Identification and Validation Model for Informative Liquid Biopsy-Based microRNA Biomarkers: Insights from Germ Cell Tumor In Vitro, In Vivo and Patient-Derived Data

 , , ,
, , ,  ,
,  , and
, and
Abstract
: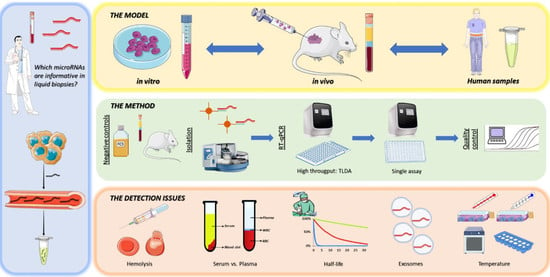
1. Introduction
2. Materials and Methods
2.1. Ethics Approval
2.2. Statistical Analyses
2.3. MicroRNA Isolation, Quantification and Quality Control
2.4. MicroRNA Profiling
2.5. Cell Lines
2.6. Mouse Model
2.7. Hemolysis Analyses and Heparin Contamination
2.8. Serum vs. Plasma Analyses
2.9. MicroRNAs Decrease after Orchiectomy
2.10. MicroRNA-375 Analyses
3. Results
3.1. MicroRNA in vitro Dynamics
3.1.1. Various microRNAs are Specifically Secreted by the Different (T)GCT Cell Lines
3.1.2. Secretion of miR-371a-3p is Minimally Influenced by Cell Count
3.1.3. Secretion of miR-371a-3p by TCam-2 Cells Seems to Occur via Exosomes
3.2. MicroRNAs as Biomarkers using an in vivo Mouse Model
3.2.1. MicroRNA Profiling Allows for Identification of Potential Candidates
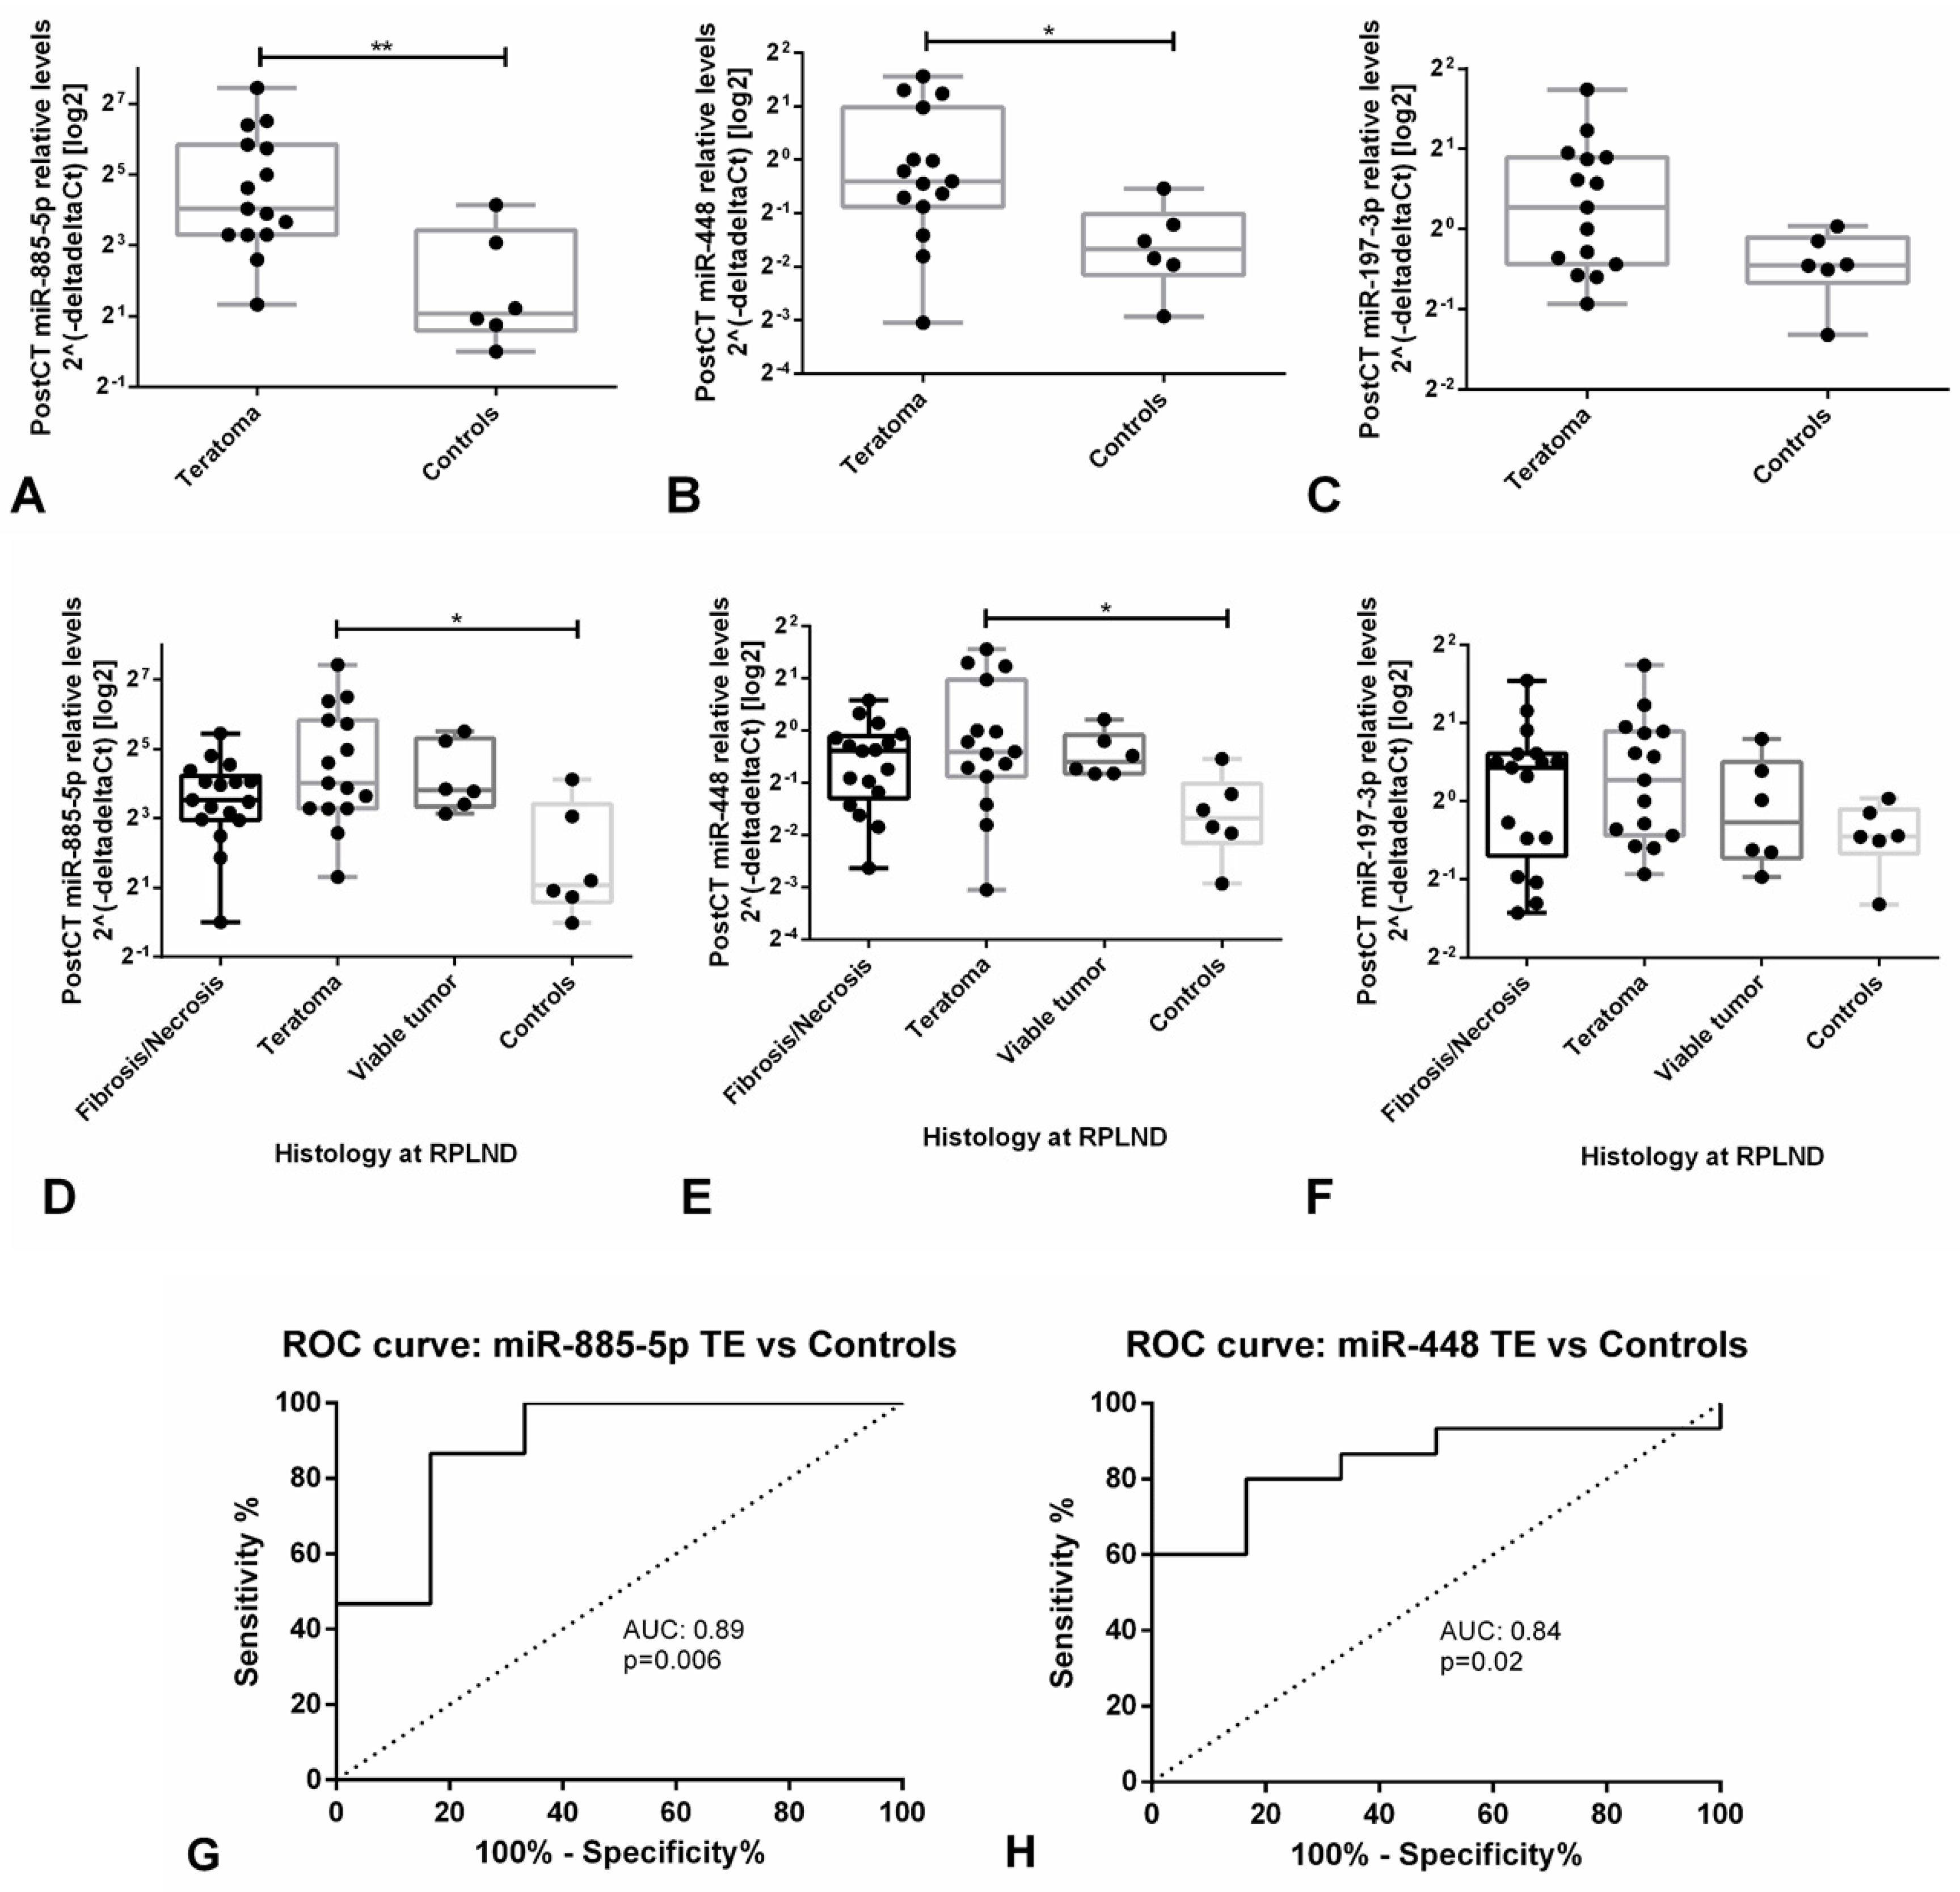
3.2.2. MicroRNA Targeted Analyses of Potential Candidates Confirm the Value of the in vivo Model
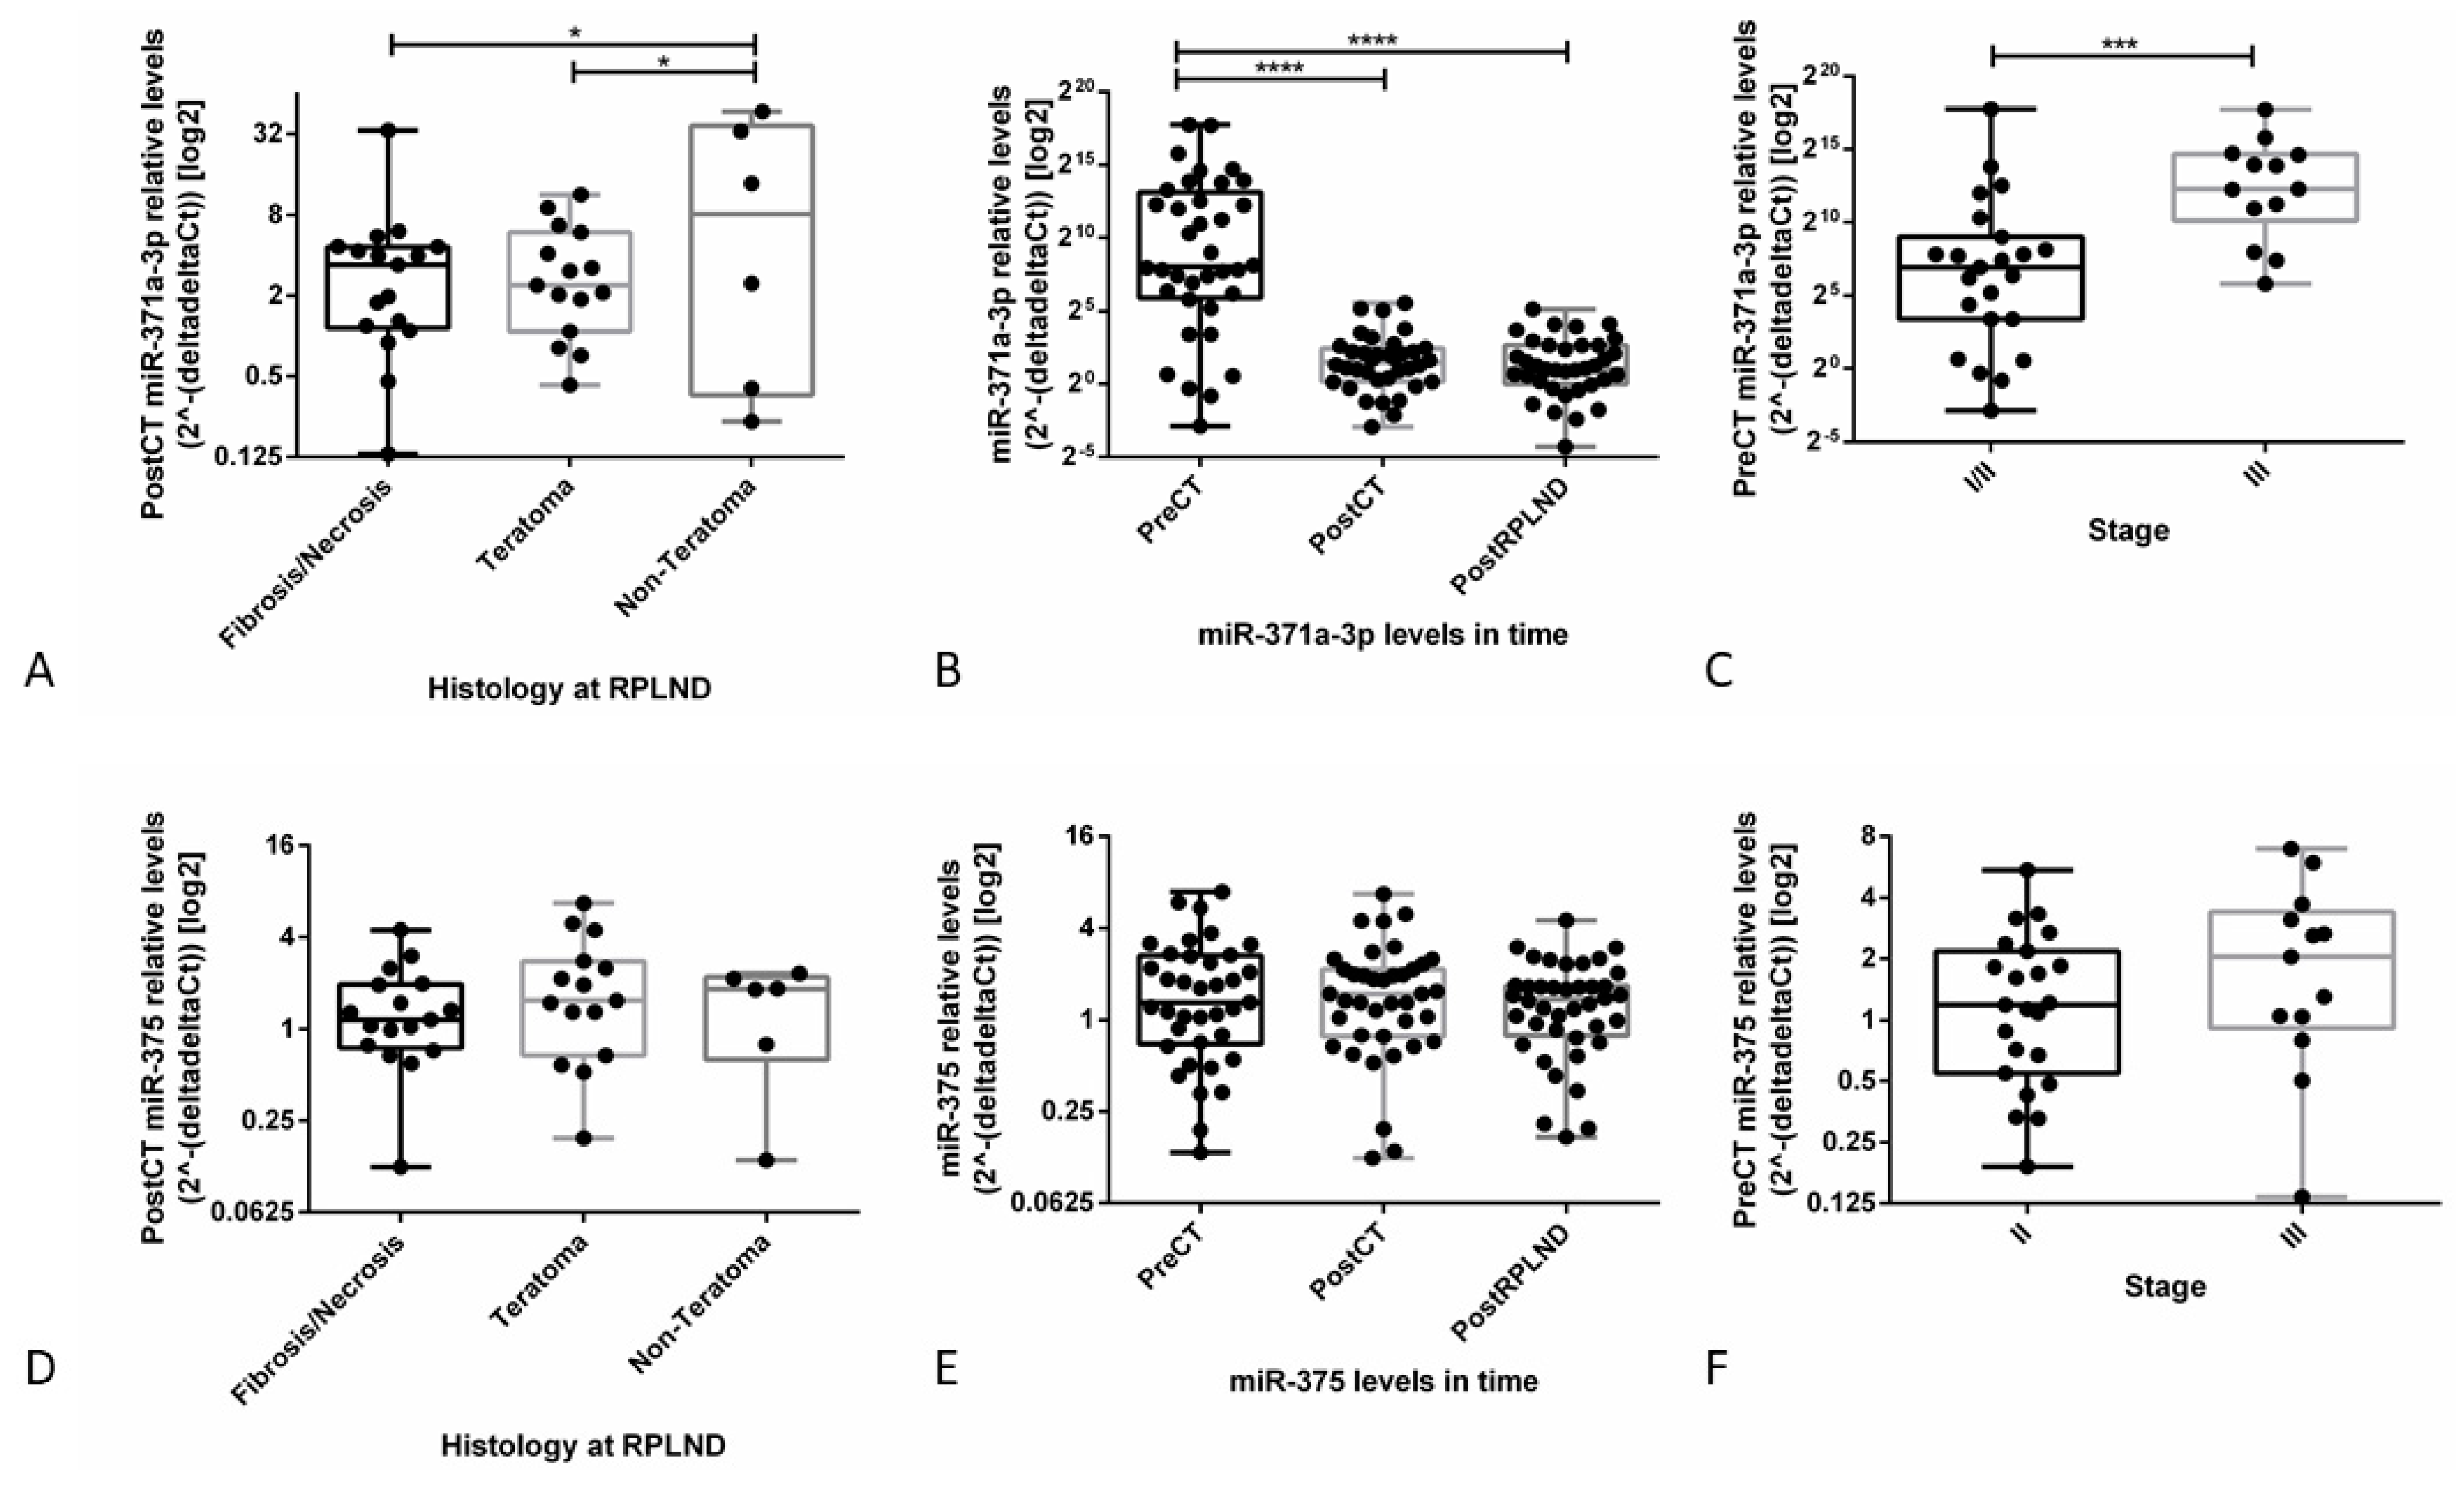
3.3. Validation and Proof of Concept: miR-371a-3p and miR-375 as Candidate Biomarkers of Germ Cell Tumors in Liquid Biopsy Setting
3.3.1. miR-371a-3p Levels Continuously Decline after Orchiectomy and Half-Life is Short
3.3.2. Analysis of TLDA Data Suggests miR-371a-3p, but not miR-375, as a Specific Biomarker in Liquid Biopsy Setting
3.3.3. Validation Studies in Patient-Derived Data Confirm the Clinical Utility of miR-371a-3p, but not miR-375, as Liquid Biopsy Biomarker for GCTs (types I and II)
3.4. Technical Considerations when Working with Liquid Biopsy-Based Biomarkers
3.4.1. The effect of Hemolysis and Heparin Contamination is Absent if Bead-Based Capture is Performed
3.4.2. Significant Differences in microRNA Levels are Found Among Serum and Plasma Samples
3.4.3. MicroRNA Profiles of Control Serum and Cerebral Spinal Fluid Samples are Distinct
4. Discussion
5. Conclusions
6. Patents
Supplementary Materials
Author Contributions
Funding
Acknowledgments
Conflicts of Interest
Availability of Data and Materials
References
- Dominguez-Vigil, I.G.; Moreno-Martinez, A.K.; Wang, J.Y.; Roehrl, M.H.A.; Barrera-Saldana, H.A. The dawn of the liquid biopsy in the fight against cancer. Oncotarget 2018, 9, 2912–2922. [Google Scholar] [CrossRef] [PubMed] [Green Version]
- Eini, R.; Dorssers, L.C.; Looijenga, L.H. Role of stem cell proteins and microRNAs in embryogenesis and germ cell cancer. Int. J. Dev. Biol. 2013, 57, 319–332. [Google Scholar] [CrossRef] [PubMed] [Green Version]
- Anfossi, S.; Babayan, A.; Pantel, K.; Calin, G.A. Clinical utility of circulating non-coding RNAs—An update. Nat. Rev. Clin. Oncol. 2018, 15, 541–563. [Google Scholar] [CrossRef] [PubMed]
- Lobo, J.; Costa, A.L.; Vilela-Salgueiro, B.; Rodrigues, A.; Guimaraes, R.; Cantante, M.; Lopes, P.; Antunes, L.; Jeronimo, C.; Henrique, R. Testicular germ cell tumors: Revisiting a series in light of the new WHO classification and AJCC staging systems, focusing on challenges for pathologists. Hum. Pathol. 2018, 82, 113–124. [Google Scholar] [CrossRef]
- Lobo, J.; Gillis, A.J.M.; Jeronimo, C.; Henrique, R.; Looijenga, L.H.J. Human germ cell tumors are developmental cancers: Impact of epigenetics on pathobiology and clinic. Int. J. Mol. Sci. 2019, 20, 258. [Google Scholar] [CrossRef] [Green Version]
- Oosterhuis, J.W.; Looijenga, L.H.J. Human germ cell tumours from a developmental perspective. Nat. Rev. Cancer 2019. [Google Scholar] [CrossRef]
- Stevenson, S.M.; Lowrance, W.T. Epidemiology and diagnosis of testis cancer. Urol. Clin. N. Am. 2015, 42, 269–275. [Google Scholar] [CrossRef]
- Curreri, S.A.; Fung, C.; Beard, C.J. Secondary malignant neoplasms in testicular cancer survivors. Urol. Oncol. 2015, 33, 392–398. [Google Scholar] [CrossRef]
- Ostrowski, K.A.; Walsh, T.J. Infertility with testicular cancer. Urol. Clin. N. Am. 2015, 42, 409–420. [Google Scholar] [CrossRef]
- Honecker, F.; Aparicio, J.; Berney, D.; Beyer, J.; Bokemeyer, C.; Cathomas, R.; Clarke, N.; Cohn-Cedermark, G.; Daugaard, G.; Dieckmann, K.P.; et al. ESMO Consensus conference on testicular germ cell cancer: Diagnosis, treatment and follow-up. Ann. Oncol. 2018, 29, 1658–1686. [Google Scholar] [CrossRef]
- Murray, M.J.; Coleman, N. Can circulating microRNAs solve clinical dilemmas in testicular germ cell malignancy? Nat. Rev. Urol. 2019, 16, 505–506. [Google Scholar] [CrossRef]
- Nicholson, B.D.; Jones, N.R.; Protheroe, A.; Joseph, J.; Roberts, N.W.; Van den Bruel, A.; Fanshawe, T.R. The diagnostic performance of current tumour markers in surveillance for recurrent testicular cancer: A diagnostic test accuracy systematic review. Cancer Epidemiol. 2019, 59, 15–21. [Google Scholar] [CrossRef] [PubMed]
- Costa, A.L.; Lobo, J.; Jeronimo, C.; Henrique, R. The epigenetics of testicular germ cell tumors: Looking for novel disease biomarkers. Epigenomics 2017, 9, 155–169. [Google Scholar] [CrossRef] [PubMed]
- Dieckmann, K.P.; Simonsen-Richter, H.; Kulejewski, M.; Anheuser, P.; Zecha, H.; Isbarn, H.; Pichlmeier, U. serum tumour markers in testicular germ cell tumours: Frequencies of elevated levels and extents of marker elevation are significantly associated with clinical parameters and with response to treatment. Biomed. Res. Int. 2019, 2019, 5030349. [Google Scholar] [CrossRef] [PubMed]
- Murray, M.J.; Coleman, N. Testicular cancer: A new generation of biomarkers for malignant germ cell tumours. Nat. Rev. Urol. 2012, 9, 298–300. [Google Scholar] [CrossRef] [PubMed]
- Voorhoeve, P.M.; le Sage, C.; Schrier, M.; Gillis, A.J.; Stoop, H.; Nagel, R.; Liu, Y.P.; van Duijse, J.; Drost, J.; Griekspoor, A.; et al. A genetic screen implicates miRNA-372 and miRNA-373 as oncogenes in testicular germ cell tumors. Cell 2006, 124, 1169–1181. [Google Scholar] [CrossRef] [Green Version]
- Gillis, A.J.; Stoop, H.J.; Hersmus, R.; Oosterhuis, J.W.; Sun, Y.; Chen, C.; Guenther, S.; Sherlock, J.; Veltman, I.; Baeten, J.; et al. High-throughput microRNAome analysis in human germ cell tumours. J. Pathol. 2007, 213, 319–328. [Google Scholar] [CrossRef]
- Rijlaarsdam, M.A.; van Agthoven, T.; Gillis, A.J.; Patel, S.; Hayashibara, K.; Lee, K.Y.; Looijenga, L.H. Identification of known and novel germ cell cancer-specific (embryonic) miRs in serum by high-throughput profiling. Andrology 2015, 3, 85–91. [Google Scholar] [CrossRef] [Green Version]
- Vilela-Salgueiro, B.; Barros-Silva, D.; Lobo, J.; Costa, A.L.; Guimaraes, R.; Cantante, M.; Lopes, P.; Braga, I.; Oliveira, J.; Henrique, R.; et al. Germ cell tumour subtypes display differential expression of microRNA371a-3p. Philos. Trans. R. Soc. Lond. B Biol. Sci. 2018, 373. [Google Scholar] [CrossRef]
- Gillis, A.J.; Rijlaarsdam, M.A.; Eini, R.; Dorssers, L.C.; Biermann, K.; Murray, M.J.; Nicholson, J.C.; Coleman, N.; Dieckmann, K.P.; Belge, G.; et al. Targeted serum miRNA (TSmiR) test for diagnosis and follow-up of (testicular) germ cell cancer patients: A proof of principle. Mol. Oncol. 2013, 7, 1083–1092. [Google Scholar] [CrossRef]
- Dieckmann, K.P.; Spiekermann, M.; Balks, T.; Ikogho, R.; Anheuser, P.; Wosniok, W.; Loening, T.; Bullerdiek, J.; Belge, G. MicroRNA miR-371a-3p—A novel serum biomarker of testicular germ cell tumors: Evidence for specificity from measurements in testicular vein blood and in neoplastic hydrocele fluid. Urol. Int. 2016, 97, 76–83. [Google Scholar] [CrossRef] [PubMed]
- Dieckmann, K.P.; Radtke, A.; Spiekermann, M.; Balks, T.; Matthies, C.; Becker, P.; Ruf, C.; Oing, C.; Oechsle, K.; Bokemeyer, C.; et al. Serum levels of MicroRNA miR-371a-3p: A sensitive and specific new biomarker for germ cell tumours. Eur. Urol. 2017, 71, 213–220. [Google Scholar] [CrossRef] [PubMed] [Green Version]
- van Agthoven, T.; Eijkenboom, W.M.H.; Looijenga, L.H.J. microRNA-371a-3p as informative biomarker for the follow-up of testicular germ cell cancer patients. Cell Oncol. 2017, 40, 379–388. [Google Scholar] [CrossRef] [PubMed]
- Leao, R.; van Agthoven, T.; Figueiredo, A.; Jewett, M.A.S.; Fadaak, K.; Sweet, J.; Ahmad, A.E.; Anson-Cartwright, L.; Chung, P.; Hansen, A.; et al. Serum miRNA predicts viable disease after chemotherapy in patients with testicular nonseminoma germ cell tumor. J. Urol. 2018, 200, 126–135. [Google Scholar] [CrossRef] [PubMed]
- Radtke, A.; Hennig, F.; Ikogho, R.; Hammel, J.; Anheuser, P.; Wulfing, C.; Belge, G.; Dieckmann, K.P. The novel biomarker of germ cell tumours, Micro-RNA-371a-3p, has a very rapid decay in patients with clinical stage 1. Urol. Int. 2018, 100, 470–475. [Google Scholar] [CrossRef] [PubMed]
- Dieckmann, K.P.; Radtke, A.; Geczi, L.; Matthies, C.; Anheuser, P.; Eckardt, U.; Sommer, J.; Zengerling, F.; Trenti, E.; Pichler, R.; et al. Serum levels of MicroRNA-371a-3p (M371 test) as a new biomarker of testicular germ cell tumors: Results of a prospective multicentric study. J. Clin. Oncol. 2019, 37, 1412–1423. [Google Scholar] [CrossRef] [PubMed]
- Mego, M.; van Agthoven, T.; Gronesova, P.; Chovanec, M.; Miskovska, V.; Mardiak, J.; Looijenga, L.H.J. Clinical utility of plasma miR-371a-3p in germ cell tumors. J. Cell Mol. Med. 2019, 23, 1128–1136. [Google Scholar] [CrossRef]
- Radtke, A.; Cremers, J.F.; Kliesch, S.; Riek, S.; Junker, K.; Mohamed, S.A.; Anheuser, P.; Belge, G.; Dieckmann, K.P. Can germ cell neoplasia in situ be diagnosed by measuring serum levels of microRNA371a-3p? J. Cancer Res. Clin. Oncol. 2017, 143, 2383–2392. [Google Scholar] [CrossRef] [Green Version]
- Murray, M.J.; Bell, E.; Raby, K.L.; Rijlaarsdam, M.A.; Gillis, A.J.; Looijenga, L.H.; Brown, H.; Destenaves, B.; Nicholson, J.C.; Coleman, N. A pipeline to quantify serum and cerebrospinal fluid microRNAs for diagnosis and detection of relapse in paediatric malignant germ-cell tumours. Br. J. Cancer 2016, 114, 151–162. [Google Scholar] [CrossRef] [Green Version]
- Murray, M.J.; Halsall, D.J.; Hook, C.E.; Williams, D.M.; Nicholson, J.C.; Coleman, N. Identification of microRNAs From the miR-371~373 and miR-302 clusters as potential serum biomarkers of malignant germ cell tumors. Am. J. Clin. Pathol. 2011, 135, 119–125. [Google Scholar] [CrossRef] [Green Version]
- Dieckmann, K.P.; Spiekermann, M.; Balks, T.; Flor, I.; Loning, T.; Bullerdiek, J.; Belge, G. MicroRNAs miR-371-3 in serum as diagnostic tools in the management of testicular germ cell tumours. Br. J. Cancer 2012, 107, 1754–1760. [Google Scholar] [CrossRef] [PubMed] [Green Version]
- Belge, G.; Dieckmann, K.P.; Spiekermann, M.; Balks, T.; Bullerdiek, J. Serum levels of microRNAs miR-371-3: A novel class of serum biomarkers for testicular germ cell tumors? Eur. Urol. 2012, 61, 1068–1069. [Google Scholar] [CrossRef] [PubMed]
- van Agthoven, T.; Looijenga, L.H.J. Accurate primary germ cell cancer diagnosis using serum based microRNA detection (ampTSmiR test). Oncotarget 2017, 8, 58037–58049. [Google Scholar] [CrossRef] [PubMed] [Green Version]
- Henrique, R.; Jeronimo, C. Testicular germ cell tumors go epigenetics: Will miR-371a-3p replace classical serum biomarkers? Eur. Urol. 2017, 71, 221–222. [Google Scholar] [CrossRef] [PubMed]
- Singla, N.; Lafin, J.T.; Bagrodia, A. MicroRNAs: Turning the tide in testicular cancer. Eur. Urol. 2019, 76, 541–542. [Google Scholar] [CrossRef] [PubMed]
- Nappi, L.; Nichols, C. MicroRNAs as biomarkers for germ cell tumors. Urol. Clin. N. Am. 2019, 46, 449–457. [Google Scholar] [CrossRef] [PubMed]
- Rosas Plaza, X.; van Agthoven, T.; Meijer, C.; van Vugt, M.; de Jong, S.; Gietema, J.A.; Looijenga, L.H.J. miR-371a-3p, miR-373-3p and miR-367-3p as serum biomarkers in metastatic testicular germ cell cancers before, during and after chemotherapy. Cells 2019, 8, 1221. [Google Scholar] [CrossRef] [Green Version]
- Syring, I.; Bartels, J.; Holdenrieder, S.; Kristiansen, G.; Muller, S.C.; Ellinger, J. Circulating serum miRNA (miR-367-3p, miR-371a-3p, miR-372-3p and miR-373-3p) as biomarkers in patients with testicular germ cell cancer. J. Urol. 2015, 193, 331–337. [Google Scholar] [CrossRef]
- Murray, M.J.; Coleman, N. MicroRNA Dysregulation in malignant germ cell tumors: More than a biomarker? J. Clin. Oncol. 2019. [Google Scholar] [CrossRef]
- Bedel, A.; Beliveau, F.; Lamrissi-Garcia, I.; Rousseau, B.; Moranvillier, I.; Rucheton, B.; Guyonnet-Duperat, V.; Cardinaud, B.; de Verneuil, H.; Moreau-Gaudry, F.; et al. Preventing pluripotent cell teratoma in regenerative medicine applied to hematology disorders. Stem Cells Transl. Med. 2017, 6, 382–393. [Google Scholar] [CrossRef]
- Charytonowicz, D.; Aubrey, H.; Bell, C.; Ferret, M.; Tsui, K.; Atfield, R.; Coleman, N.; Murray, M.J.; Wilson, E.C.F. Cost analysis of noninvasive blood-based MicroRNA testing versus CT scans for follow-up in patients with testicular germ-cell tumors. Clin. Genitourin. Cancer 2019, 17, e733–e744. [Google Scholar] [CrossRef] [PubMed] [Green Version]
- Shah, J.S.; Soon, P.S.; Marsh, D.J. Comparison of methodologies to detect low levels of hemolysis in serum for accurate assessment of serum microRNAs. PLoS ONE 2016, 11, e0153200. [Google Scholar] [CrossRef] [PubMed]
- Myklebust, M.P.; Rosenlund, B.; Gjengstø, P.; Bercea, B.S.; Karlsdottir, Á.; Brydøy, M.; Dahl, O. Quantitative PCR measurement of miR-371a-3p and miR-372-p Is influenced by hemolysis. Front. Genet. 2019, 10. [Google Scholar] [CrossRef] [PubMed]
- O’Brien, J.; Hayder, H.; Zayed, Y.; Peng, C. Overview of microrna biogenesis, mechanisms of actions, and circulation. Front Endocrinol. (Lausanne) 2018, 9, 402. [Google Scholar] [CrossRef] [PubMed] [Green Version]
- Shen, H.; Shih, J.; Hollern, D.P.; Wang, L.; Bowlby, R.; Tickoo, S.K.; Thorsson, V.; Mungall, A.J.; Newton, Y.; Hegde, A.M.; et al. Integrated molecular characterization of testicular germ cell tumors. Cell Rep. 2018, 23, 3392–3406. [Google Scholar] [CrossRef] [PubMed]
- Heberle, H.; Meirelles, G.V.; da Silva, F.R.; Telles, G.P.; Minghim, R. InteractiVenn: A web-based tool for the analysis of sets through Venn diagrams. BMC Bioinform. 2015, 16, 169. [Google Scholar] [CrossRef] [PubMed]
- de Jong, J.; Stoop, H.; Gillis, A.J.; Hersmus, R.; van Gurp, R.J.; van de Geijn, G.J.; van Drunen, E.; Beverloo, H.B.; Schneider, D.T.; Sherlock, J.K.; et al. Further characterization of the first seminoma cell line TCam-2. Genes Chromosomes Cancer 2008, 47, 185–196. [Google Scholar] [CrossRef]
- Gillis, A.J.; Stoop, H.; Biermann, K.; van Gurp, R.J.; Swartzman, E.; Cribbes, S.; Ferlinz, A.; Shannon, M.; Oosterhuis, J.W.; Looijenga, L.H. Expression and interdependencies of pluripotency factors LIN28, OCT3/4, NANOG and SOX2 in human testicular germ cells and tumours of the testis. Int. J. 2011, 34, e160–e174. [Google Scholar] [CrossRef]
- Hartjes, T.A.; Mytnyk, S.; Jenster, G.W.; van Steijn, V.; van Royen, M.E. Extracellular vesicle quantification and characterization: Common methods and emerging approaches. Bioengineering 2019, 6, 7. [Google Scholar] [CrossRef] [Green Version]
- Salvatori, D.C.F.; Dorssers, L.C.J.; Gillis, A.J.M.; Perretta, G.; van Agthoven, T.; Gomes Fernandes, M.; Stoop, H.; Prins, J.B.; Oosterhuis, J.W.; Mummery, C.; et al. The MicroRNA-371 family as plasma biomarkers for monitoring undifferentiated and potentially malignant human pluripotent stem cells in teratoma assays. Stem Cell Rep. 2018, 11, 1493–1505. [Google Scholar] [CrossRef] [Green Version]
- Massolt, E.T.; Chaker, L.; Visser, T.J.; Gillis, A.J.M.; Dorssers, L.C.J.; Beukhof, C.M.; Kam, B.L.R.; Franssen, G.J.; Brigante, G.; van Ginhoven, T.M.; et al. Serum microRNA profiles in athyroid patients on and off levothyroxine therapy. PLoS ONE 2018, 13, e0194259. [Google Scholar] [CrossRef] [PubMed]
- Youden, W.J. Index for rating diagnostic tests. Cancer 1950, 3, 32–35. [Google Scholar] [CrossRef]
- Schisterman, E.F.; Perkins, N.J.; Liu, A.; Bondell, H. Optimal cut-point and its corresponding Youden Index to discriminate individuals using pooled blood samples. Epidemiology 2005, 16, 73–81. [Google Scholar] [CrossRef] [PubMed]
- Roest, H.P.; Ooms, L.S.S.; Gillis, A.J.M.; JNM, I.J.; Looijenga, L.H.J.; Dorssers, L.C.J.; Dor, F.; van der Laan, L.J.W. Cell-free MicroRNA miR-505-3p in graft preservation fluid is an independent predictor of delayed graft function after kidney transplantation. Transplantation 2019, 103, 329–335. [Google Scholar] [CrossRef]
- Poel, D.; Buffart, T.E.; Oosterling-Jansen, J.; Verheul, H.M.; Voortman, J. Evaluation of several methodological challenges in circulating miRNA qPCR studies in patients with head and neck cancer. Exp. Mol. Med. 2018, 50, e454. [Google Scholar] [CrossRef] [Green Version]
- Fomicheva, K.A.; Osip’yants, A.I.; Knyazev, E.N.; Samatov, T.R.; Shkurnikov, M.Y. Detection of potential metastatic prostate cancer circulating biomarkers by comparison of miRNA profiles in DU145 cells and culture medium. Bull. Exp. Biol. Med. 2017, 162, 792–796. [Google Scholar] [CrossRef]
- Kosaka, N.; Iguchi, H.; Yoshioka, Y.; Takeshita, F.; Matsuki, Y.; Ochiya, T. Secretory mechanisms and intercellular transfer of microRNAs in living cells. J. Biol. Chem. 2010, 285, 17442–17452. [Google Scholar] [CrossRef] [Green Version]
- Bobrie, A.; Colombo, M.; Krumeich, S.; Raposo, G.; Thery, C. Diverse subpopulations of vesicles secreted by different intracellular mechanisms are present in exosome preparations obtained by differential ultracentrifugation. J. Extracell. Vesicles 2012, 1, 18397. [Google Scholar] [CrossRef]
- Kirschner, M.B.; Edelman, J.J.; Kao, S.C.; Vallely, M.P.; van Zandwijk, N.; Reid, G. The impact of hemolysis on cell-free microRNA biomarkers. Front Genet 2013, 4, 94. [Google Scholar] [CrossRef] [Green Version]
- Al-Soud, W.A.; Radstrom, P. Purification and characterization of PCR-inhibitory components in blood cells. J. Clin. Microbiol. 2001, 39, 485–493. [Google Scholar] [CrossRef] [Green Version]
- Verhoeven, C.J.; Selten, J.W.; Roest, H.P.; Farid, W.R.R.; de Ruiter, P.E.; Hansen, B.E.; de Jonge, J.; Kwekkeboom, J.; Metselaar, H.J.; Tilanus, H.W.; et al. Corrigendum to “MicroRNA profiles in graft preservation solution are predictive of ischemic-type biliary lesions after liver transplantation. J Hepatol. 2017, 59, 1231–1238. [Google Scholar] [CrossRef] [PubMed]
- Roest, H.P.; Verhoeven, C.J.; de Haan, J.E.; de Jonge, J.; JN, I.J.; van der Laan, L.J. Improving accuracy of urinary miRNA quantification in heparinized patients using heparinase I digestion. J. Mol. Diagn. 2016, 18, 825–833. [Google Scholar] [CrossRef] [PubMed] [Green Version]
- Plieskatt, J.L.; Feng, Y.; Rinaldi, G.; Mulvenna, J.P.; Bethony, J.M.; Brindley, P.J. Circumventing qPCR inhibition to amplify miRNAs in plasma. Biomark. Res. 2014, 2, 13. [Google Scholar] [CrossRef] [PubMed] [Green Version]
- Miles, R.R.; Roberts, R.F.; Putnam, A.R.; Roberts, W.L. Comparison of serum and heparinized plasma samples for measurement of chemistry analytes. Clin. Chem. 2004, 50, 1704–1706. [Google Scholar] [CrossRef] [PubMed] [Green Version]
- Purow, B. The elephant in the room: Do microRNA-based therapies have a realistic chance of succeeding for brain tumors such as glioblastoma? J. Neurooncol. 2011, 103, 429–436. [Google Scholar] [CrossRef]
- Dubois, L.G.; Campanati, L.; Righy, C.; D’Andrea-Meira, I.; Spohr, T.C.; Porto-Carreiro, I.; Pereira, C.M.; Balca-Silva, J.; Kahn, S.A.; DosSantos, M.F.; et al. Gliomas and the vascular fragility of the blood brain barrier. Front. Cell. Neurosci. 2014, 8, 418. [Google Scholar] [CrossRef] [Green Version]
- Afanasyeva, E.A.; Mestdagh, P.; Kumps, C.; Vandesompele, J.; Ehemann, V.; Theissen, J.; Fischer, M.; Zapatka, M.; Brors, B.; Savelyeva, L.; et al. MicroRNA miR-885-5p targets CDK2 and MCM5, activates p53 and inhibits proliferation and survival. Cell Death Differ. 2011, 18, 974–984. [Google Scholar] [CrossRef] [Green Version]
- Tapia, N.; Scholer, H.R. p53 connects tumorigenesis and reprogramming to pluripotency. J. Exp. Med. 2010, 207, 2045–2048. [Google Scholar] [CrossRef] [Green Version]
- Voorhoeve, P.M.; le Sage, C.; Schrier, M.; Gillis, A.J.; Stoop, H.; Nagel, R.; Liu, Y.P.; van Duijse, J.; Drost, J.; Griekspoor, A.; et al. A genetic screen implicates miRNA-372 and miRNA-373 as oncogenes in testicular germ cell tumors. Adv. Exp. Med. Biol. 2007, 604, 17–46. [Google Scholar] [CrossRef]
- Rodosthenous, R.S.; Burris, H.H.; Sanders, A.P.; Just, A.C.; Dereix, A.E.; Svensson, K.; Solano, M.; Tellez-Rojo, M.M.; Wright, R.O.; Baccarelli, A.A. Second trimester extracellular microRNAs in maternal blood and fetal growth: An exploratory study. Epigenetics 2017, 12, 804–810. [Google Scholar] [CrossRef] [Green Version]
- Salas-Huetos, A.; Blanco, J.; Vidal, F.; Godo, A.; Grossmann, M.; Pons, M.C.; F-Fernández, S.; Garrido, N.; Anton, E. Spermatozoa from patients with seminal alterations exhibit a differential micro-ribonucleic acid profile. Fertil. Steril. 2015, 104, 591–601. [Google Scholar] [CrossRef] [PubMed] [Green Version]
- Wu, X.; Yan, L.; Liu, Y.; Xian, W.; Wang, L.; Ding, X. MicroRNA-448 suppresses osteosarcoma cell proliferation and invasion through targeting EPHA7. PLoS ONE 2017, 12, e0175553. [Google Scholar] [CrossRef] [PubMed] [Green Version]
- Lv, Y.; Lei, Y.; Hu, Y.; Ding, W.; Zhang, C.; Fang, C. miR-448 negatively regulates ovarian cancer cell growth and metastasis by targeting CXCL12. Clin. Transl. Oncol. 2015, 17, 903–909. [Google Scholar] [CrossRef] [PubMed]
- Wu, X.; Tang, H.; Liu, G.; Wang, H.; Shu, J.; Sun, F. miR-448 suppressed gastric cancer proliferation and invasion by regulating ADAM10. Tumour Biol. 2016, 37, 10545–10551. [Google Scholar] [CrossRef] [PubMed]
- Lafin, J.T.; Singla, N.; Woldu, S.L.; Lotan, Y.; Lewis, C.M.; Majmudar, K.; Savelyeva, A.; Kapur, P.; Margulis, V.; Strand, D.W.; et al. Serum MicroRNA-371a-3p levels predict viable germ cell tumor in chemotherapy-naive patients undergoing retroperitoneal lymph node dissection. Eur. Urol. 2019. [Google Scholar] [CrossRef] [PubMed]


| TCam-2 | ||
| microRNA | Ct values | |
| Cells | Media | |
| hsa-miR-371a-3p | 25.4 | 25.9 |
| hsa-miR-372-3p | 19.8 | 20.9 |
| hsa-miR-373-3p | 27.3 | 24.7 |
| hsa-miR-367 | 24.6 | 26.0 |
| NT2 | ||
| microRNA | Ct values | |
| Cells | Media | |
| hsa-miR-371a-3p | 33.4 | 33.2 |
| hsa-miR-372-3p | 28.4 | 40 |
| hsa-miR-373-3p | 40 | N/A* |
| hsa-miR-367 | 17.4 | 23.7 |
| NCCIT | ||
| microRNA | Ct values | |
| Cells | Media | |
| hsa-miR-371a-3p | 31.3 | 33.0 |
| hsa-miR-372-3p | 25.9 | 26.6 |
| hsa-miR-373-3p | 29.8 | 40 |
| hsa-miR-367 | 20.9 | 27.2 |
| 2102Ep | ||
| microRNA | Ct values | |
| Cells | Media | |
| hsa-miR-371a-3p | 27.1 | 26.7 |
| hsa-miR-372-3p | 21.5 | 22.4 |
| hsa-miR-373-3p | 30.4 | 26.1 |
| hsa-miR-367 | 26.5 | 24.6 |
| Cells | Cell count per mL (confluent) × 104 | EVs per mL (EVQuant) | miR-371a-3p Ct values |
|---|---|---|---|
| TCam-2 | 391 | 2.99E + 10 | 29 |
| NCCIT | 932 | 2.04E + 10 | 32 |
| Context | Sensitivity (%) | Specificity (%) | PPV (%) | NPV (%) | Accuracy (%) |
|---|---|---|---|---|---|
| miR-885-5p | 86.7 | 83.3 | 92.9 | 71.4 | 85.7 |
| miR-448 | 80.0 | 83.3 | 100 | 62.5 | 81.0 |
| Both miR-885-5p and miR-448 above defined cutoff | 73.3 | 83.3 | 91.7 | 55.6 | 76.2 |
| Either miR-885-5p or miR-448 above defined cutoff | 93.3 | 83.3 | 93.3 | 83.3 | 90.5 |
© 2019 by the authors. Licensee MDPI, Basel, Switzerland. This article is an open access article distributed under the terms and conditions of the Creative Commons Attribution (CC BY) license (http://creativecommons.org/licenses/by/4.0/).
Share and Cite
Lobo, J.; Gillis, A.J.M.; van den Berg, A.; Dorssers, L.C.J.; Belge, G.; Dieckmann, K.-P.; Roest, H.P.; van der Laan, L.J.W.; Gietema, J.; Hamilton, R.J.; et al. Identification and Validation Model for Informative Liquid Biopsy-Based microRNA Biomarkers: Insights from Germ Cell Tumor In Vitro, In Vivo and Patient-Derived Data. Cells 2019, 8, 1637. https://doi.org/10.3390/cells8121637
Lobo J, Gillis AJM, van den Berg A, Dorssers LCJ, Belge G, Dieckmann K-P, Roest HP, van der Laan LJW, Gietema J, Hamilton RJ, et al. Identification and Validation Model for Informative Liquid Biopsy-Based microRNA Biomarkers: Insights from Germ Cell Tumor In Vitro, In Vivo and Patient-Derived Data. Cells. 2019; 8(12):1637. https://doi.org/10.3390/cells8121637
Chicago/Turabian StyleLobo, João, Ad J.M. Gillis, Annette van den Berg, Lambert C.J. Dorssers, Gafanzer Belge, Klaus-Peter Dieckmann, Henk P. Roest, Luc J.W. van der Laan, Jourik Gietema, Robert J. Hamilton, and et al. 2019. "Identification and Validation Model for Informative Liquid Biopsy-Based microRNA Biomarkers: Insights from Germ Cell Tumor In Vitro, In Vivo and Patient-Derived Data" Cells 8, no. 12: 1637. https://doi.org/10.3390/cells8121637