A-Kinase Anchoring Proteins Diminish TGF-β1/Cigarette Smoke-Induced Epithelial-To-Mesenchymal Transition

 and
and 
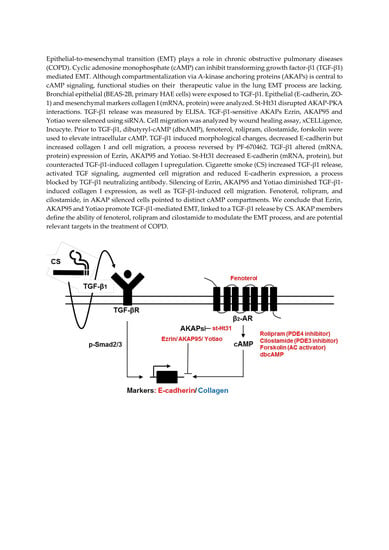
Abstract
1. Introduction
2. Materials and Methods
2.1. Chemicals and Antibodies
2.2. Cell Culture
2.3. Cell Stimulation
2.4. Transfection
2.5. Real-Time Quantitative PCR
2.6. Western Blotting
2.7. Immunofluorescence
2.8. Cigarette Smoke Extract (CSE) Preparation
2.9. Wound Healing Assay
2.10. xCELLigence Transwell Migration
2.11. Incucyte
2.12. Cell Viability
2.13. Cell Cycle Distribution
2.14. Statistics
3. Results
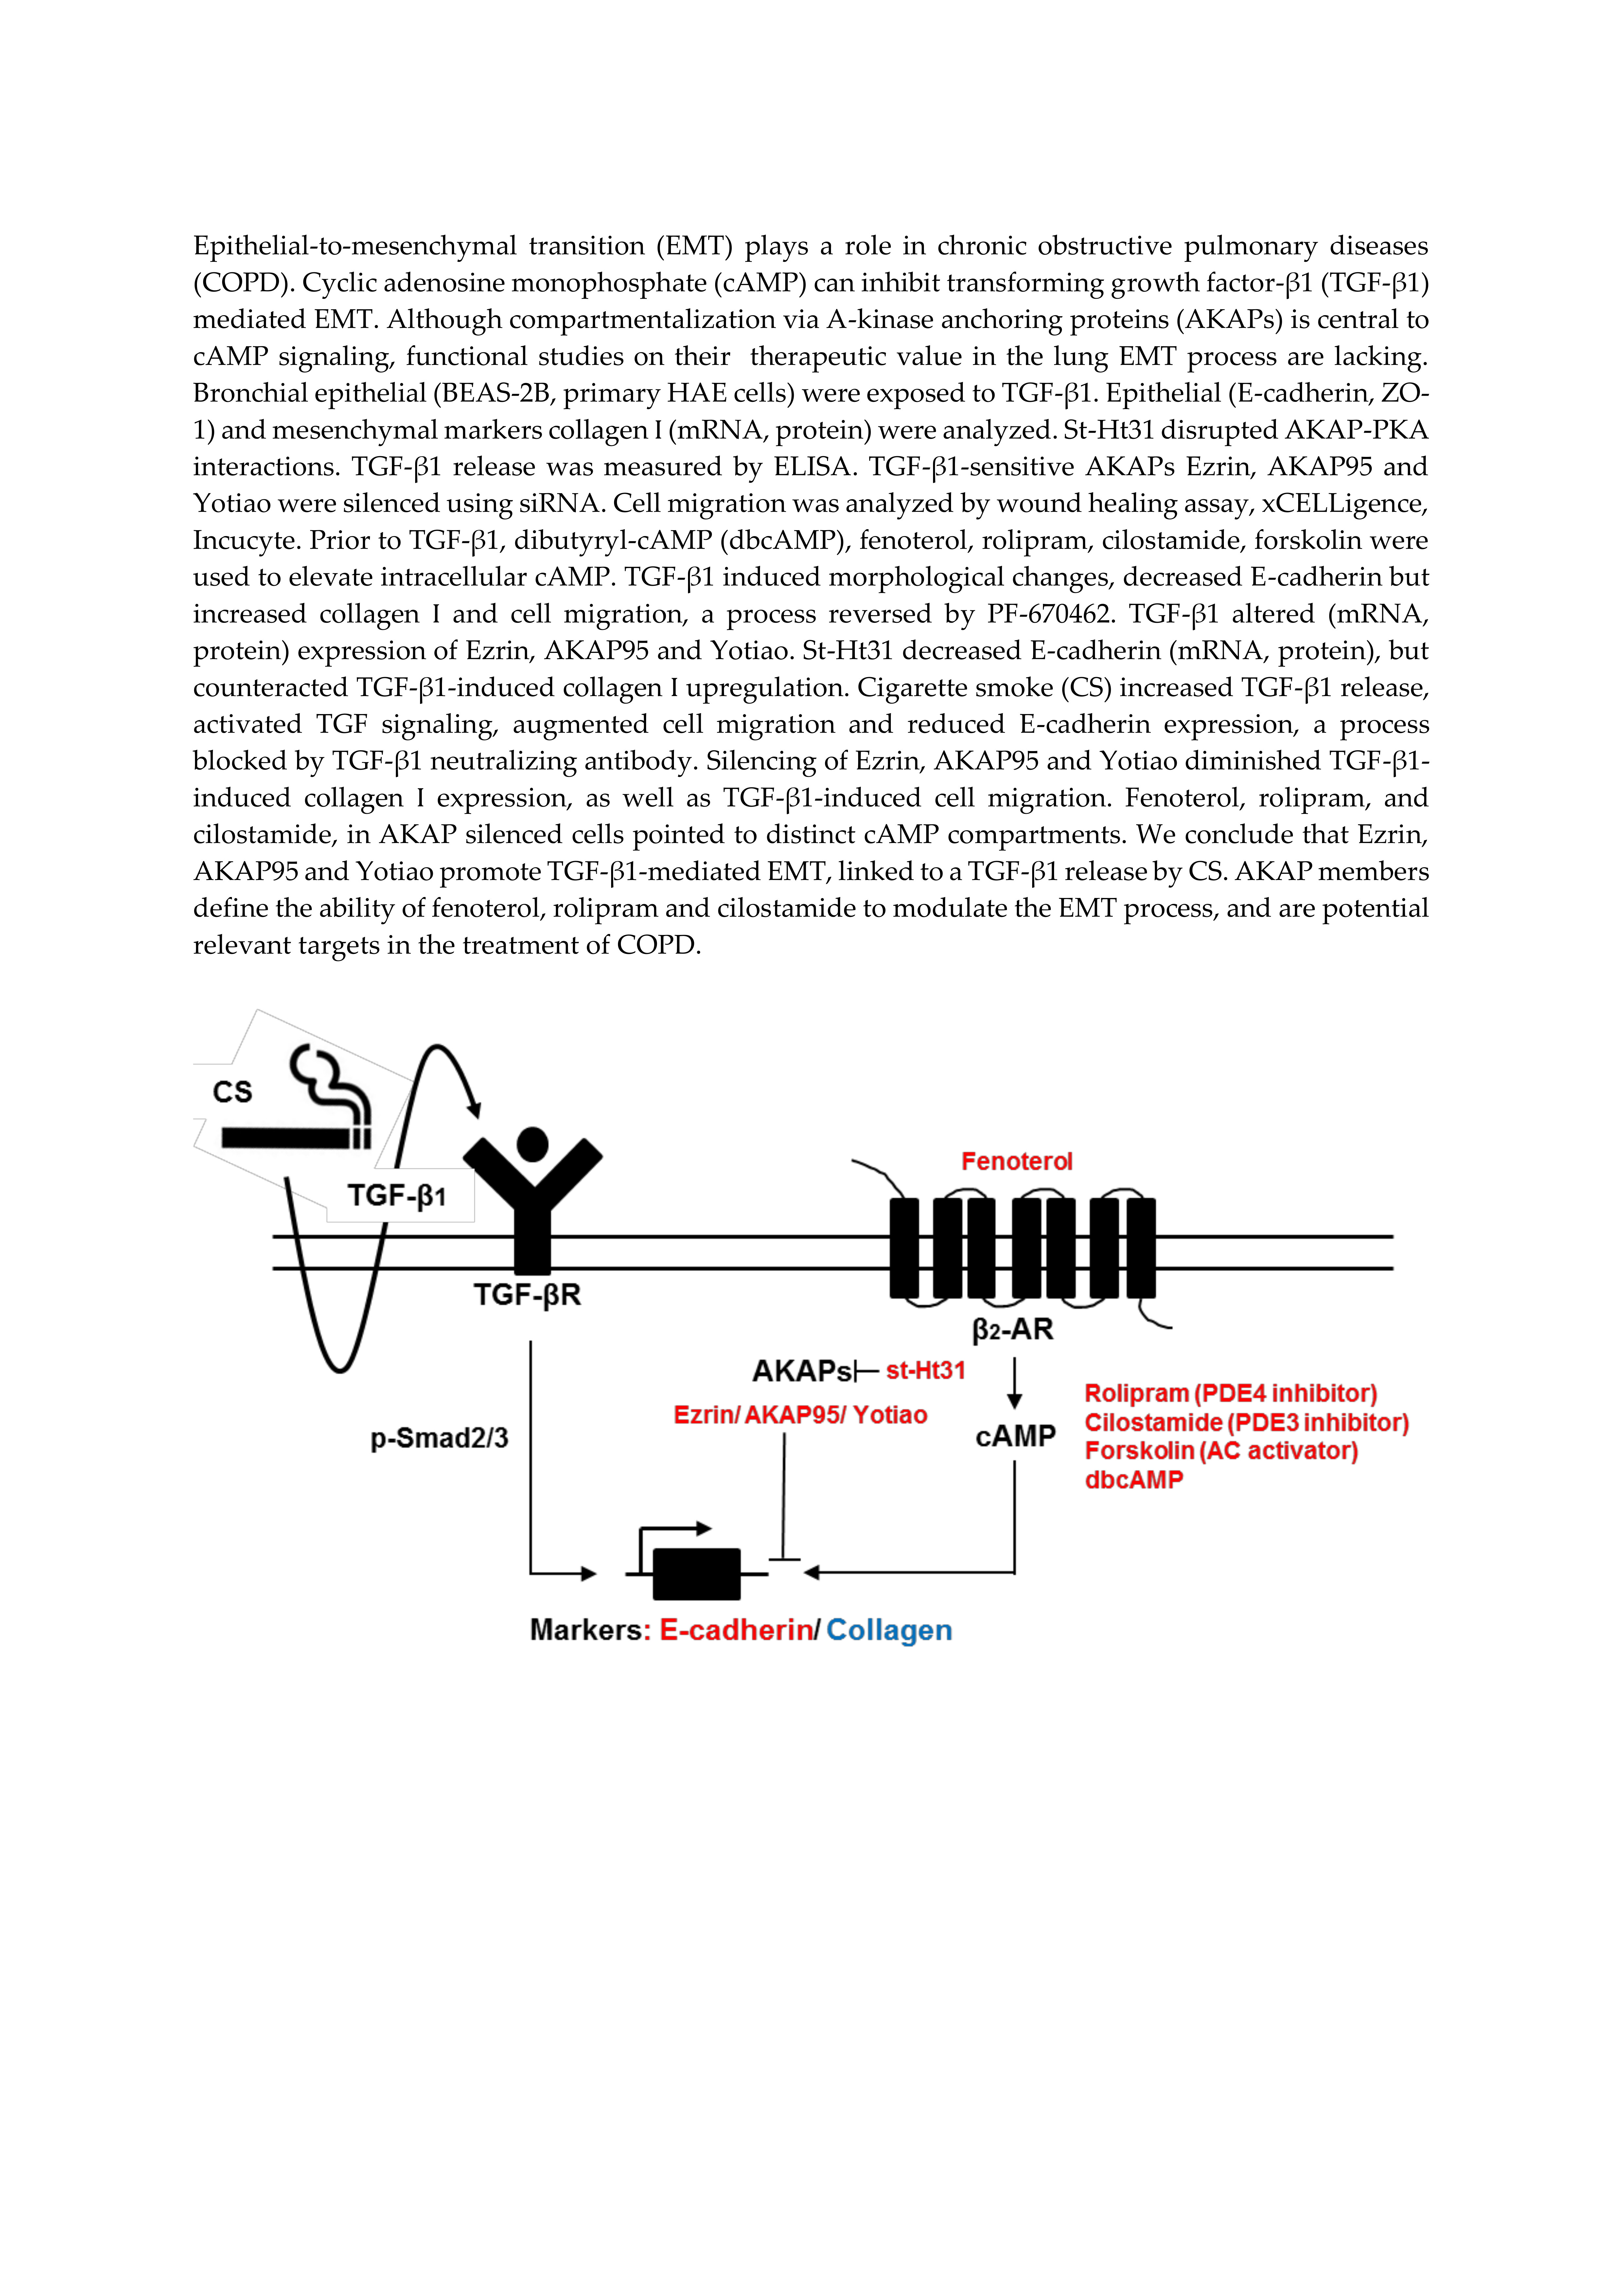
3.1. Effect of TGF-β1 on Cell Morphology and Phenotype Markers in BEAS-2B Cells
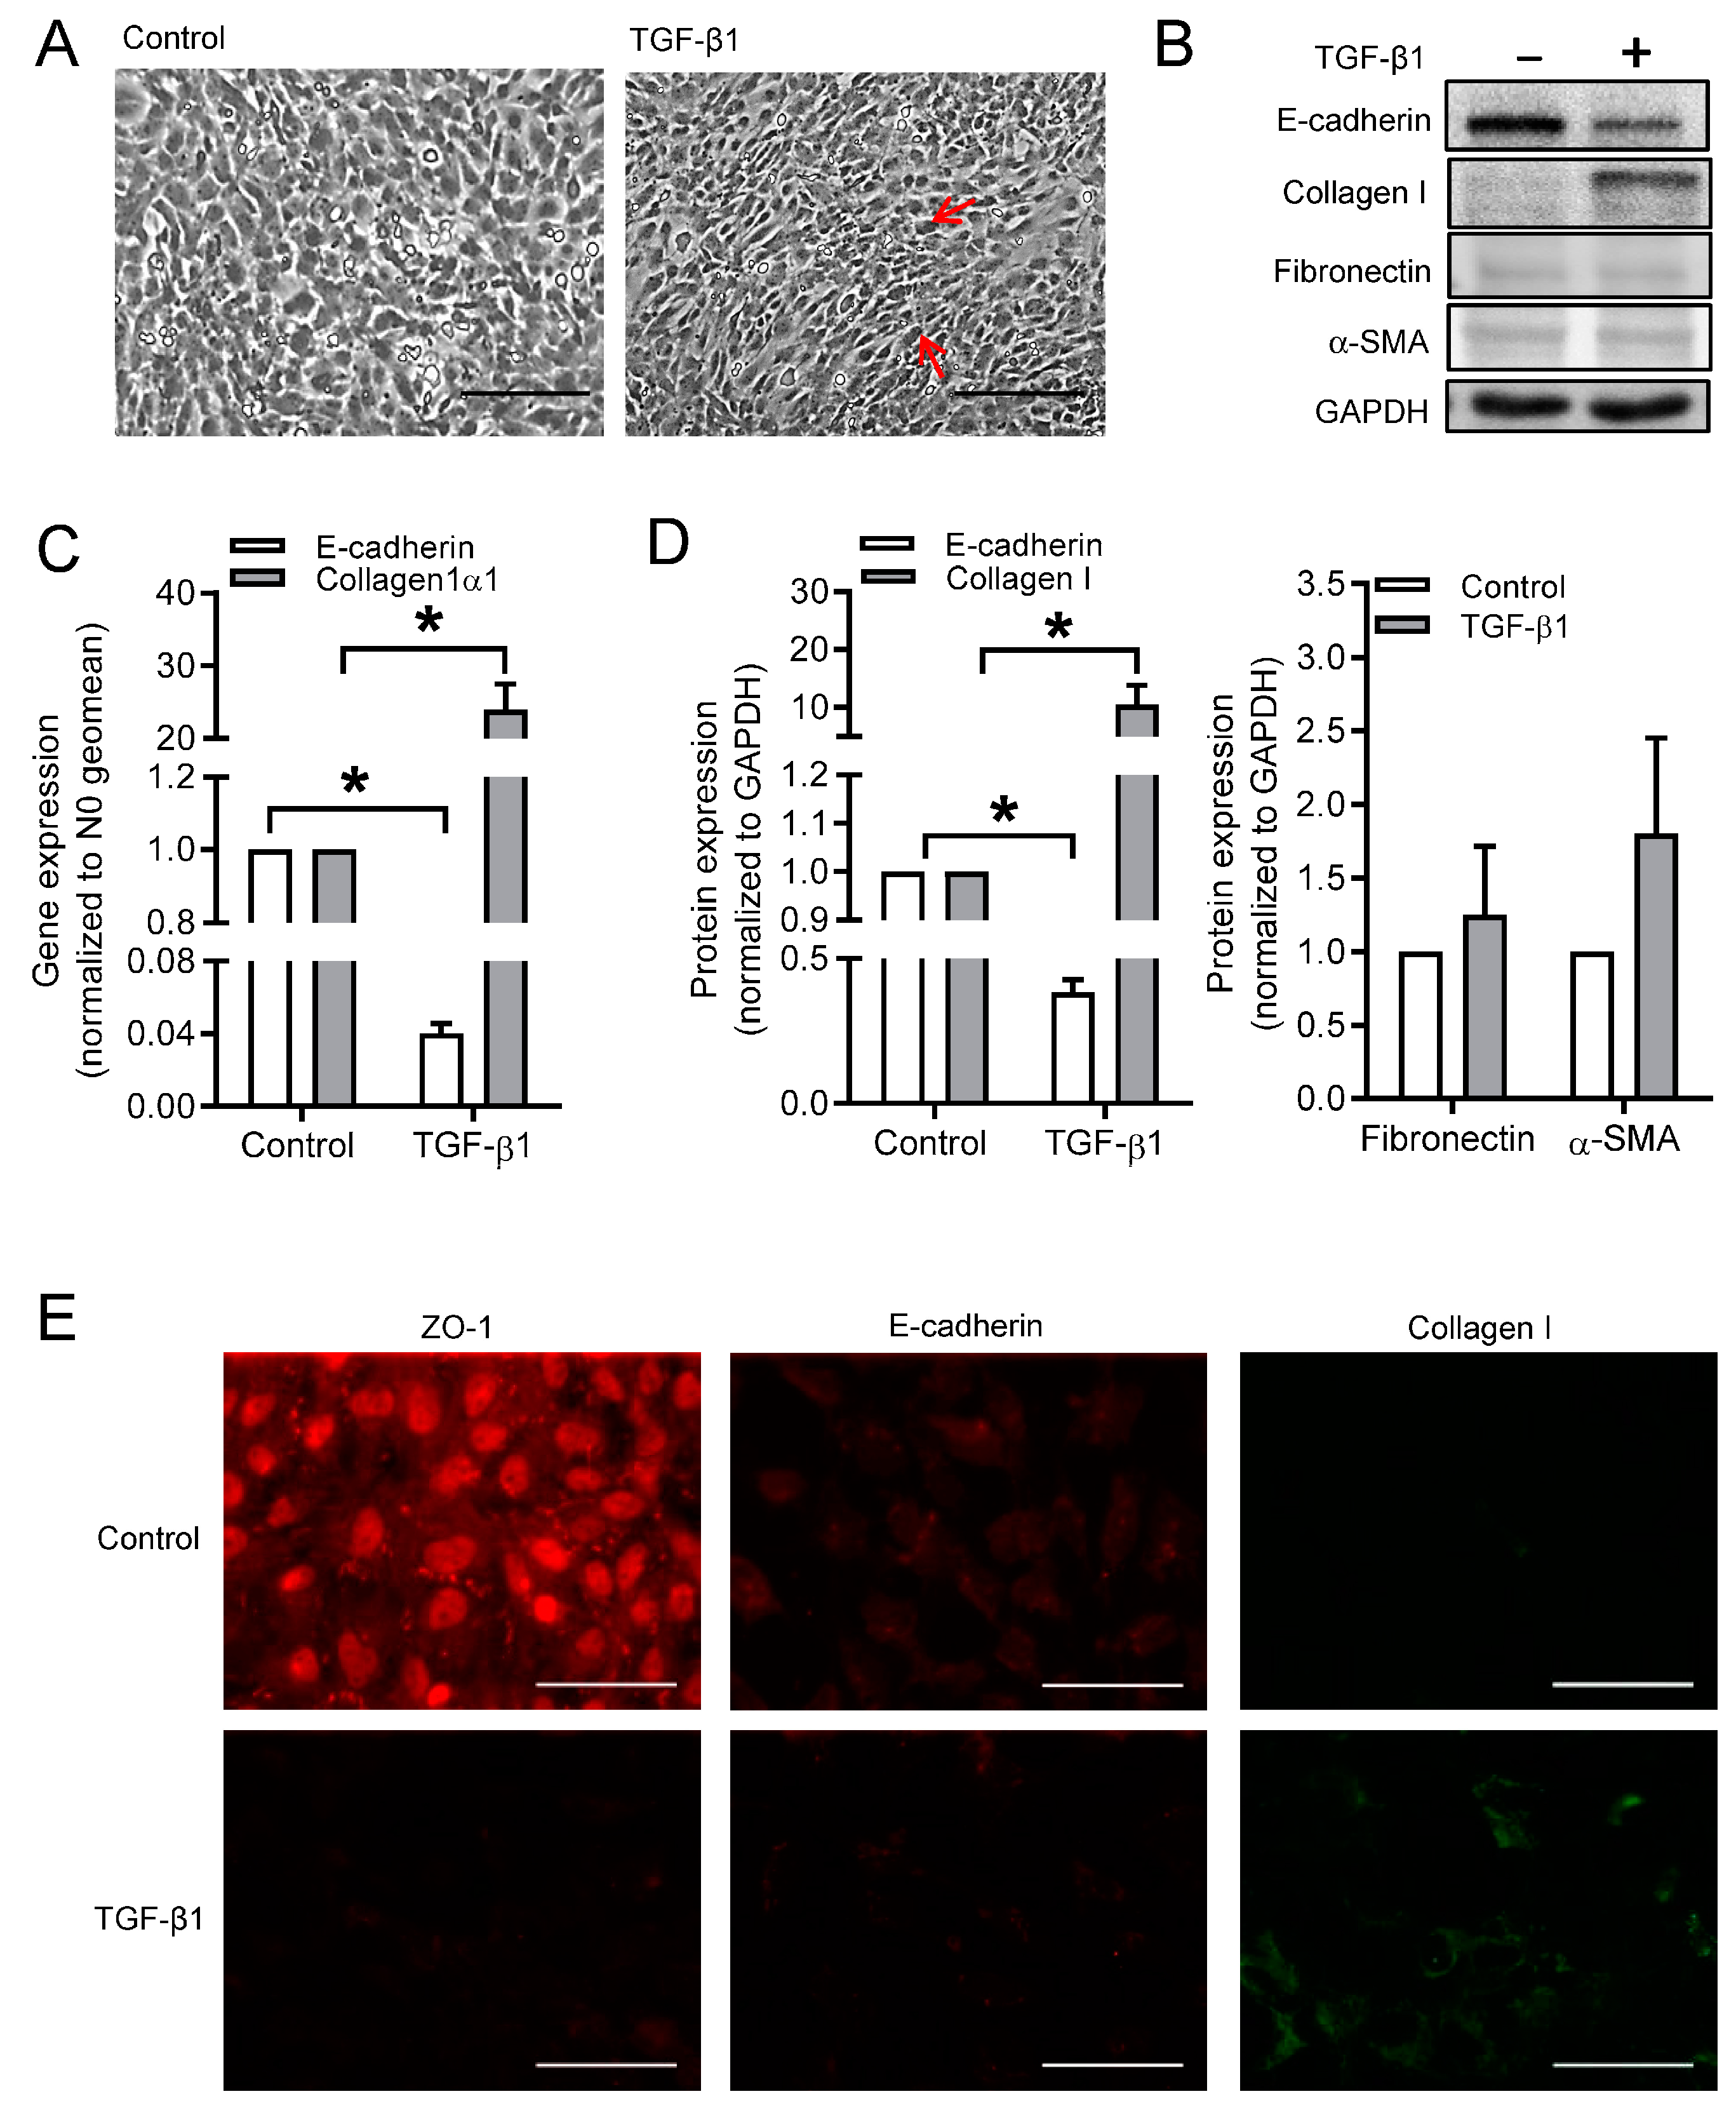
3.2. Disruption of AKAP-PKA Interaction Diminishes TGF-β1-Induced Collagen Ӏ Upregulation
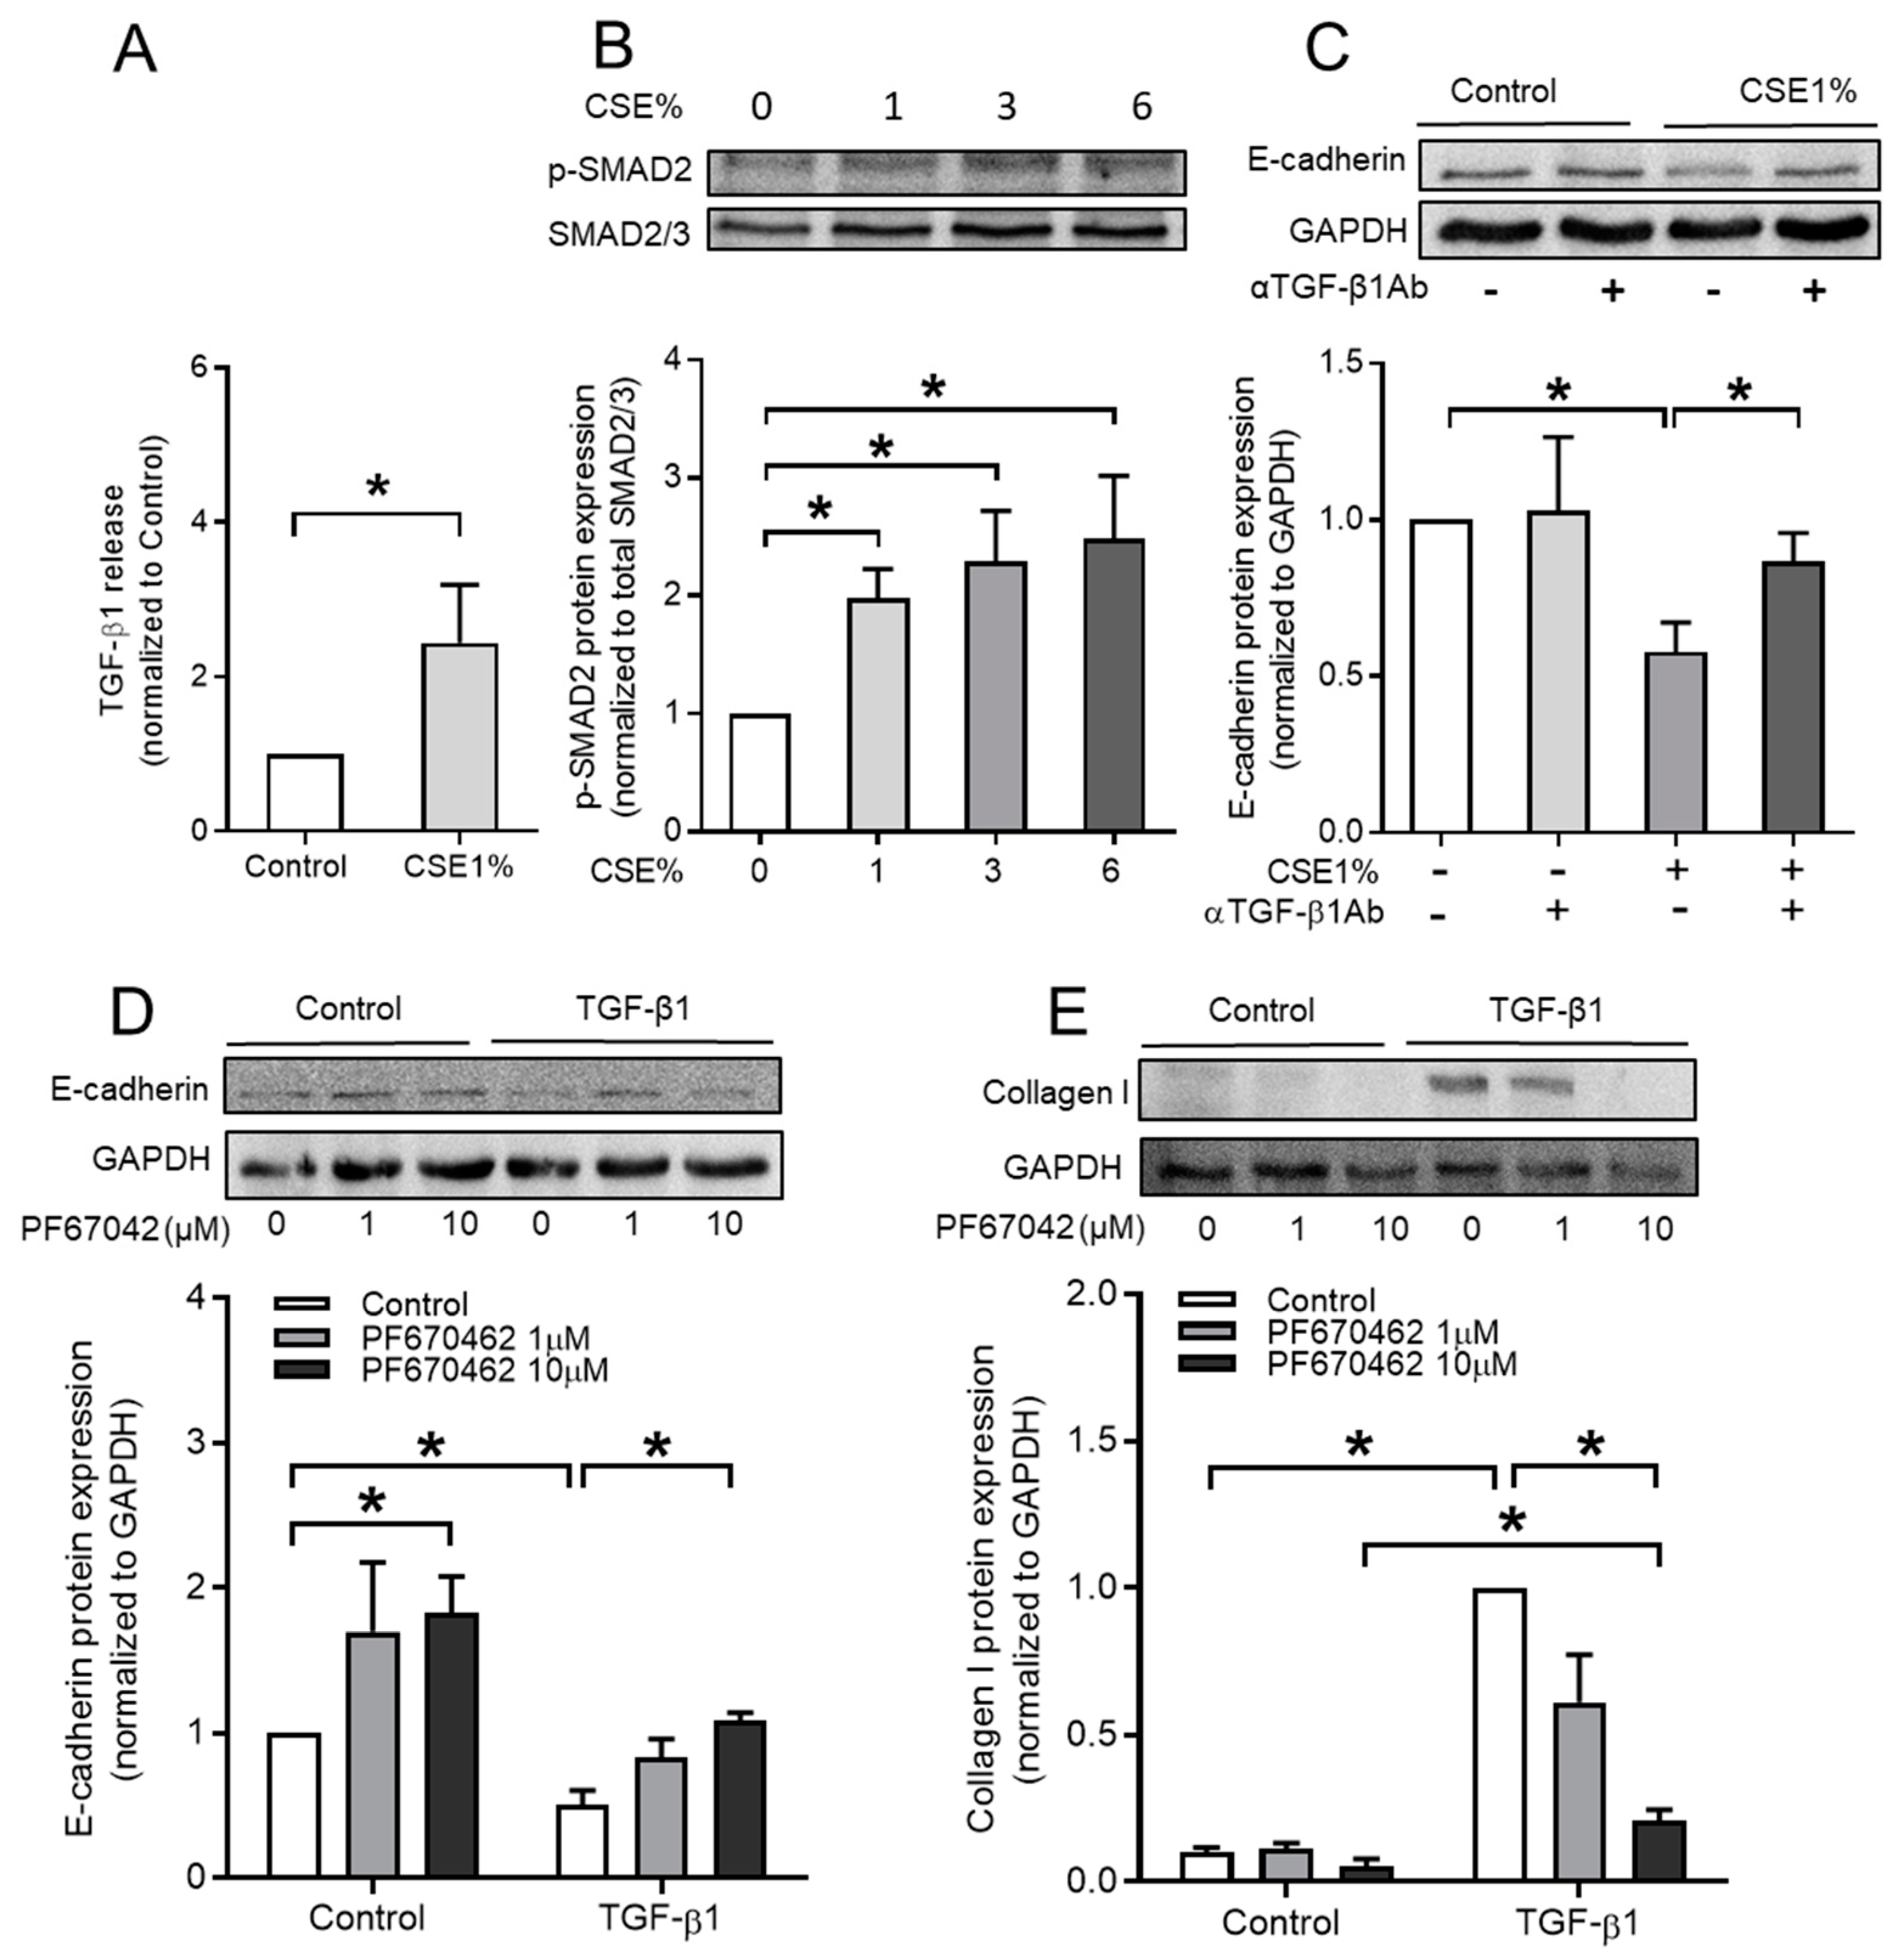
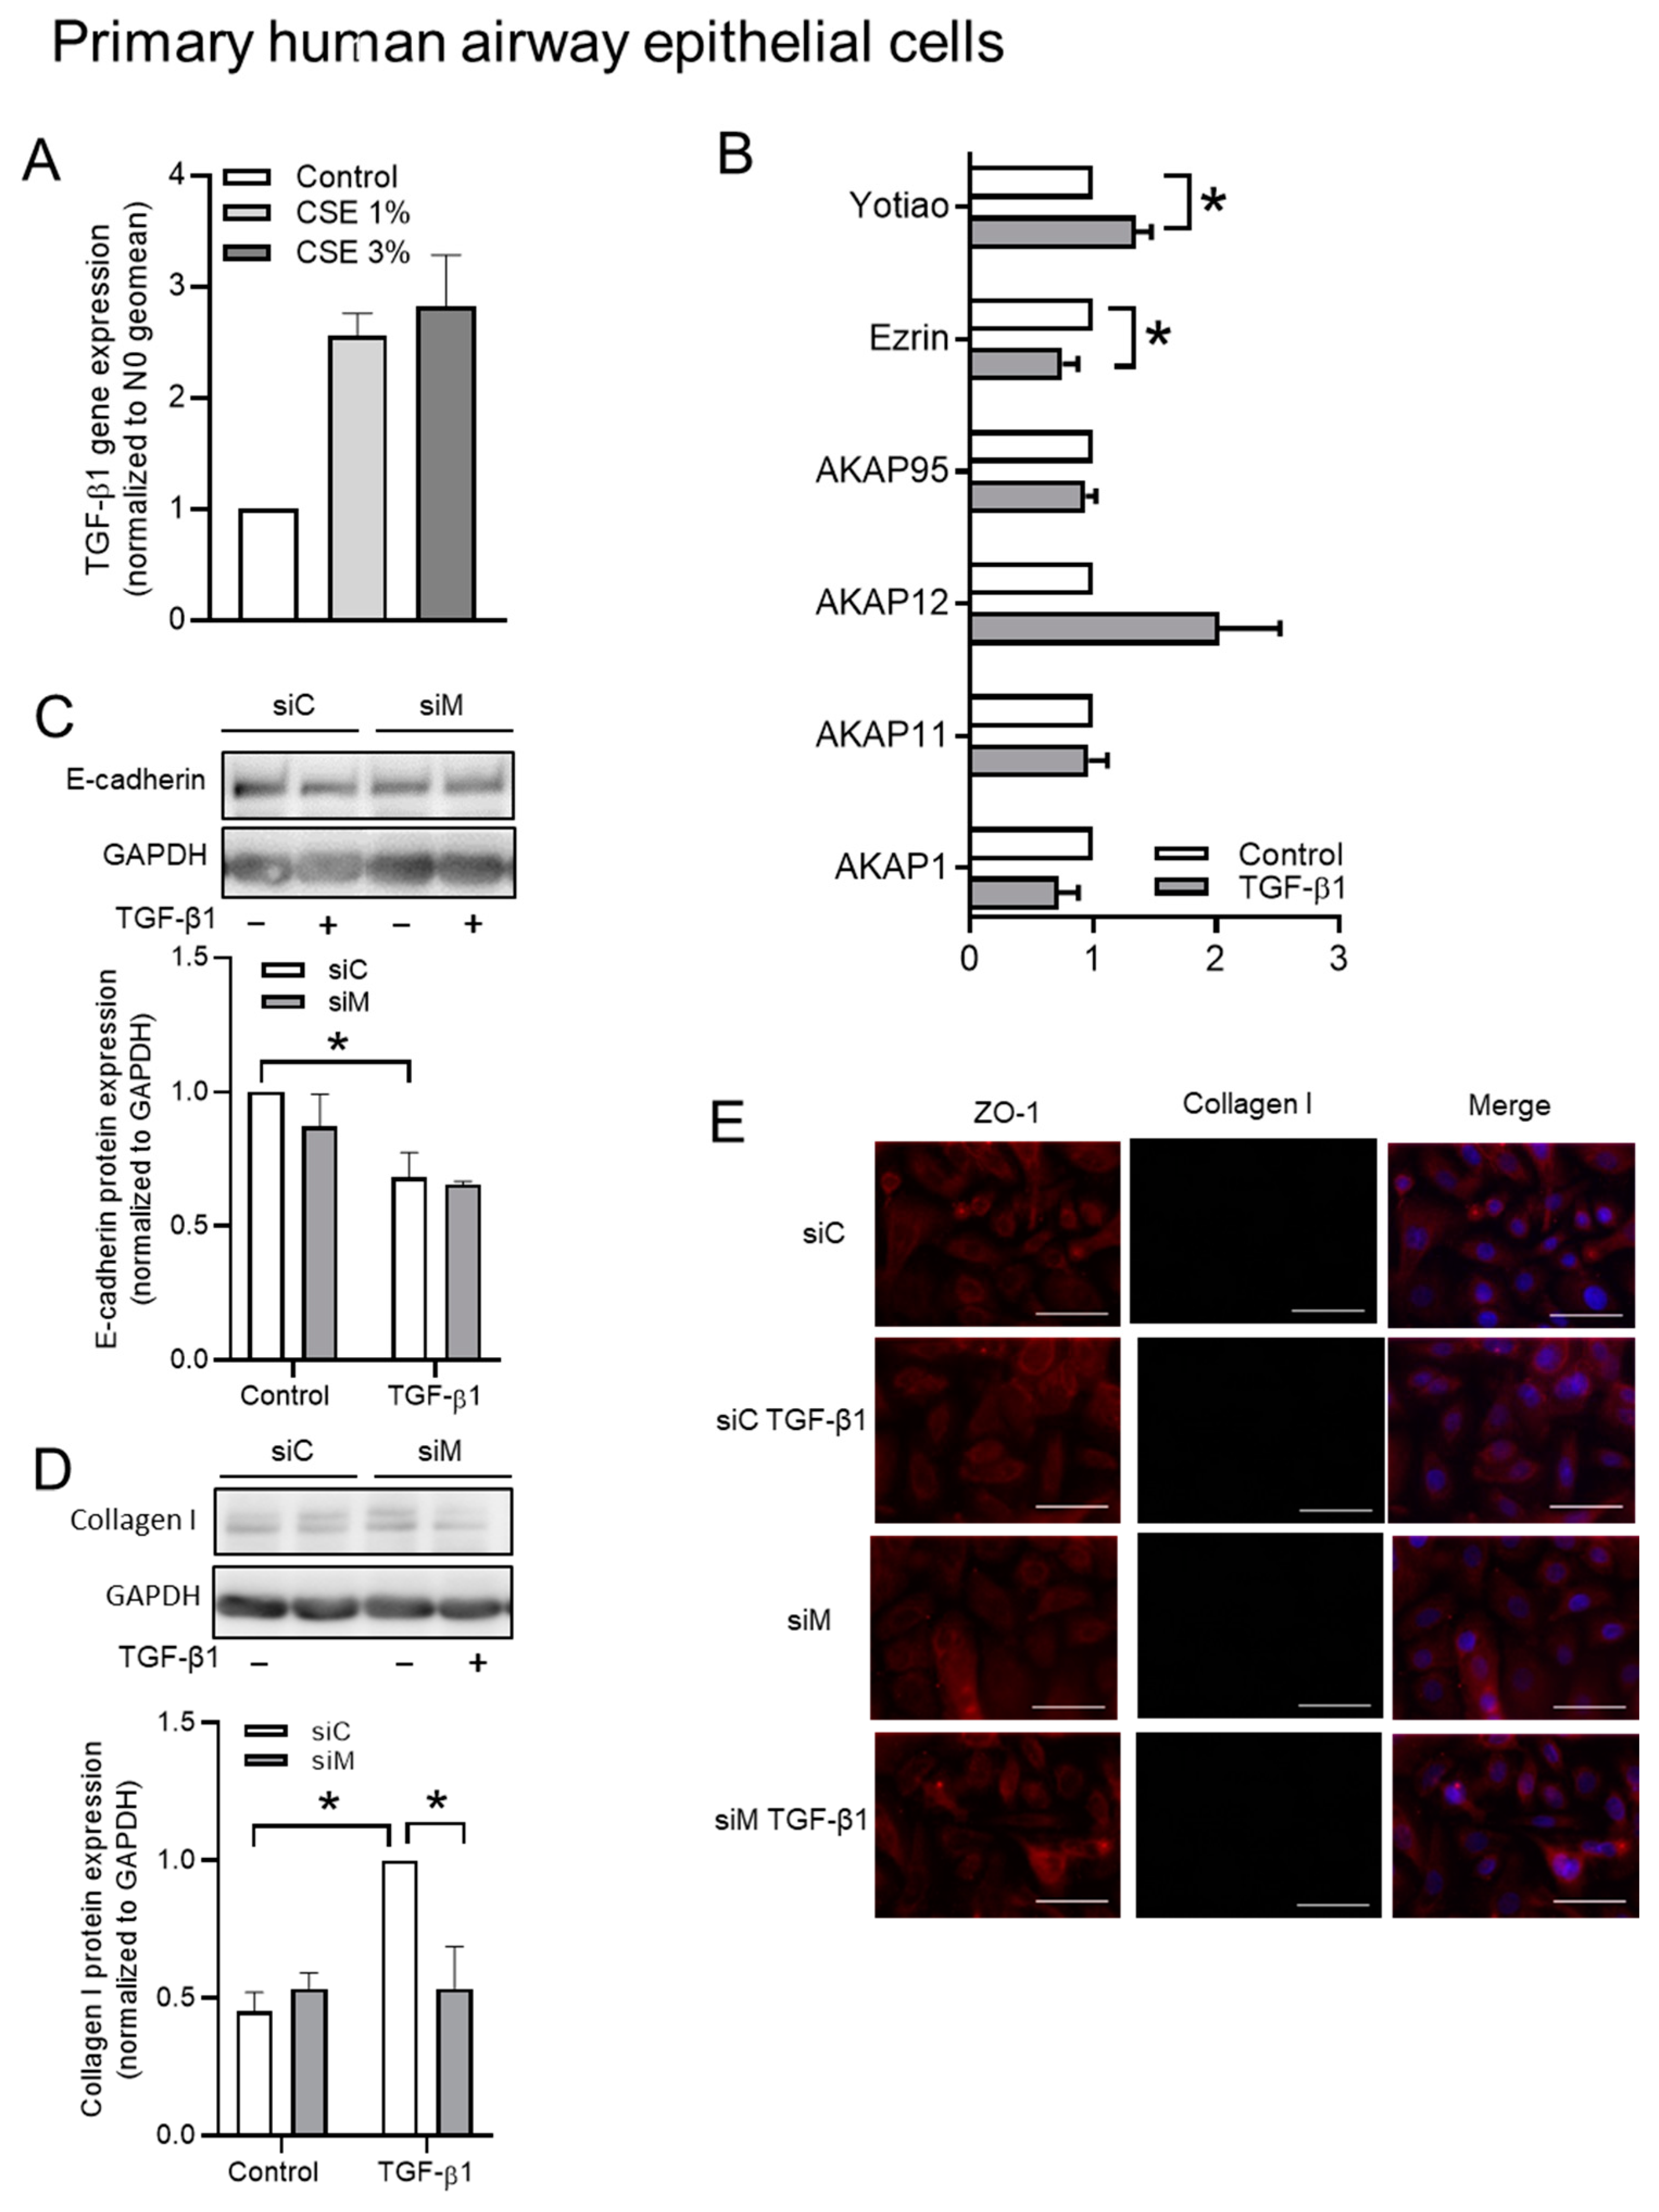
3.3. CSE Activates TGF-β1 Signaling Pathway
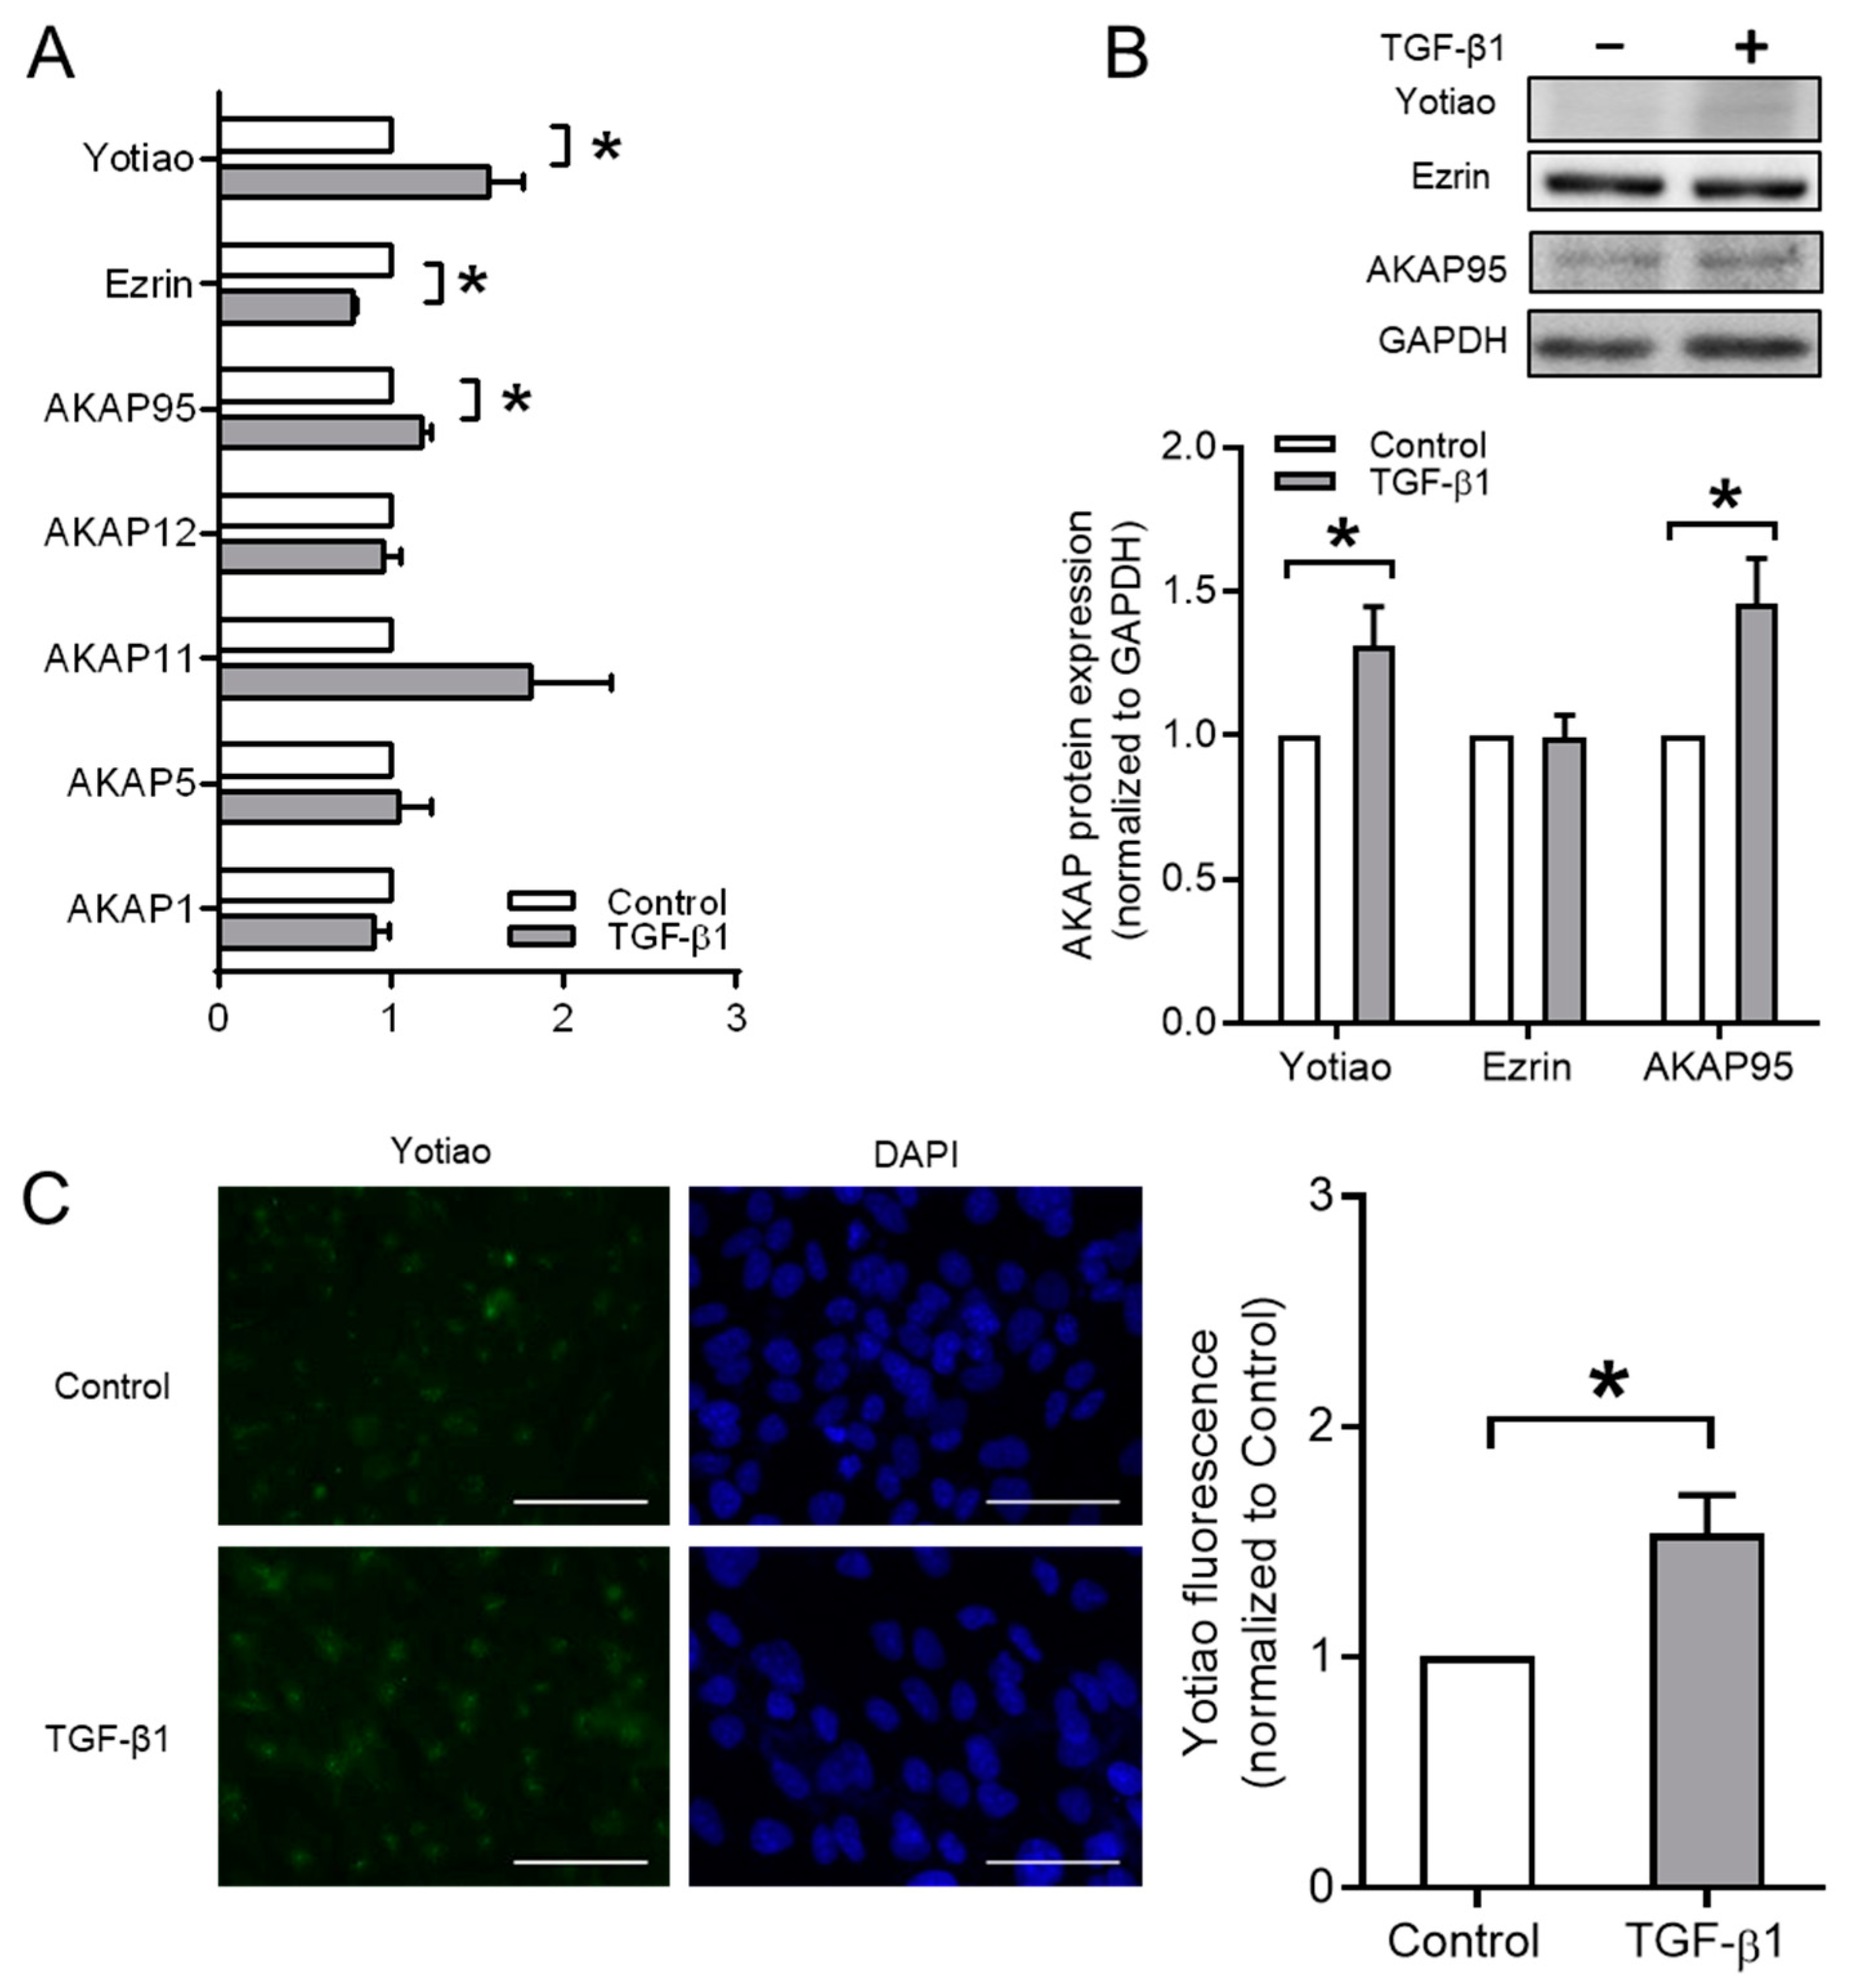
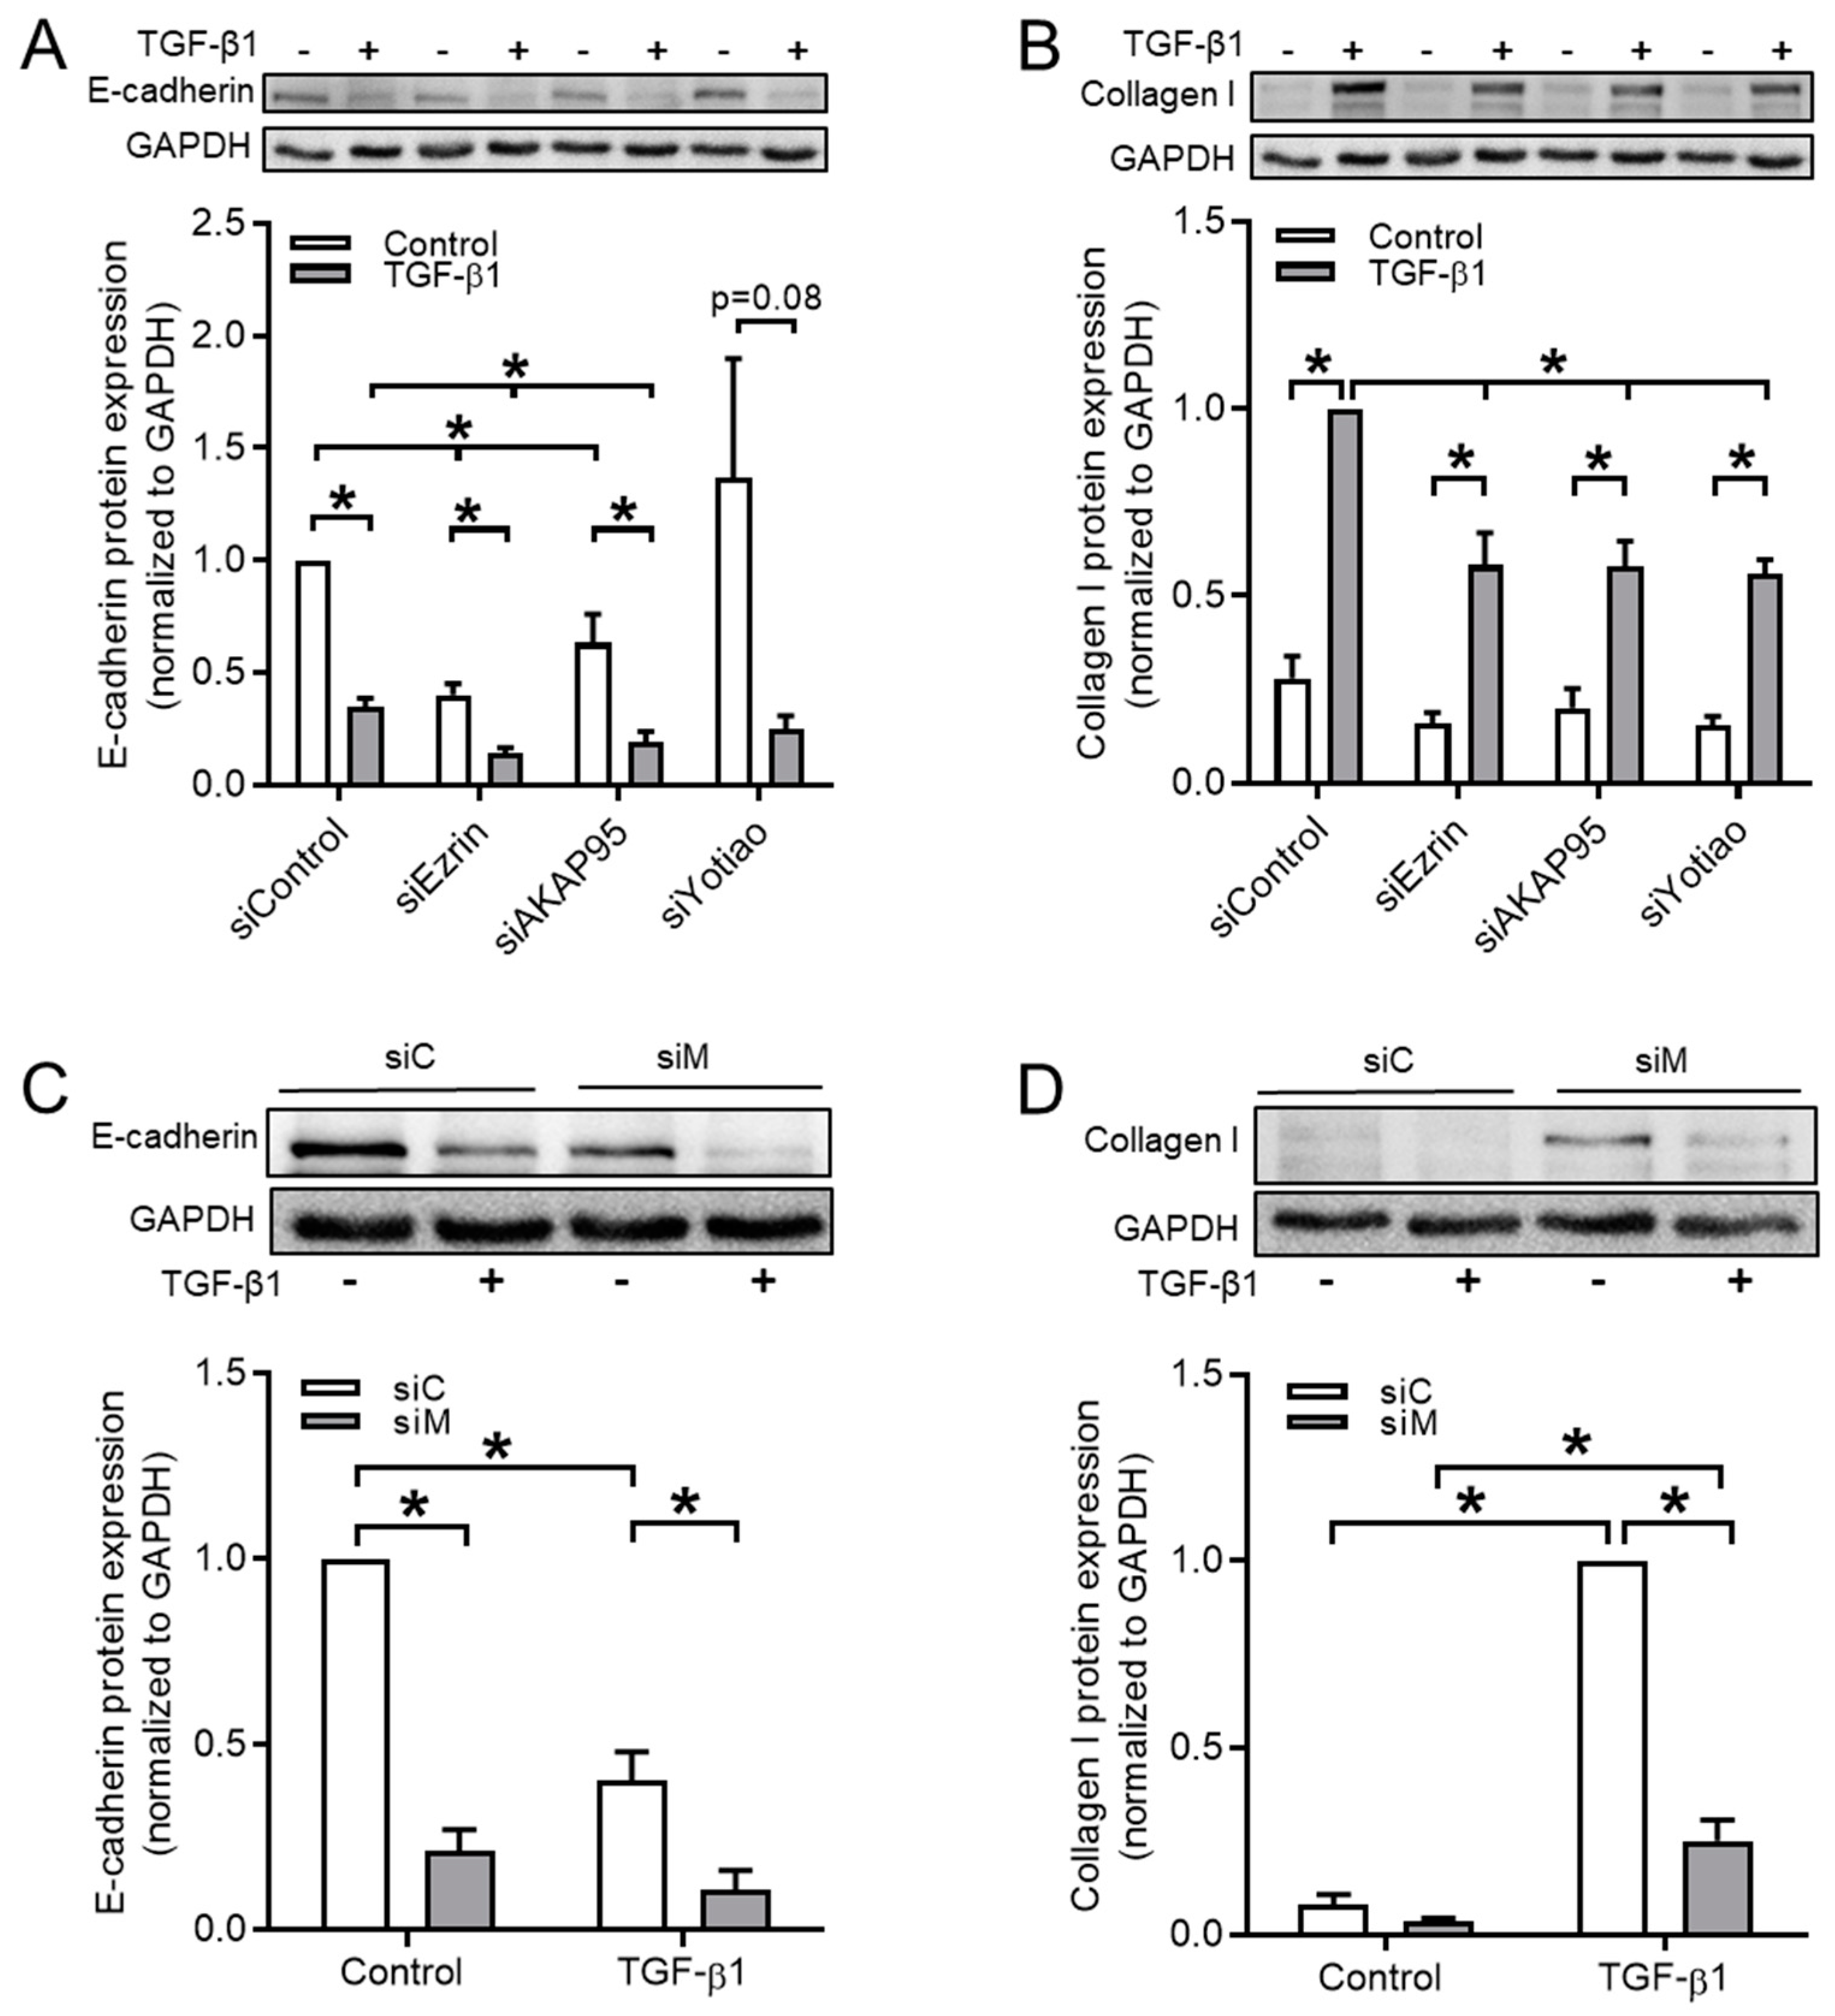
3.4. Ezrin, AKAP95, and Yotiao Are Involved in TGF-β1-Induced EMT
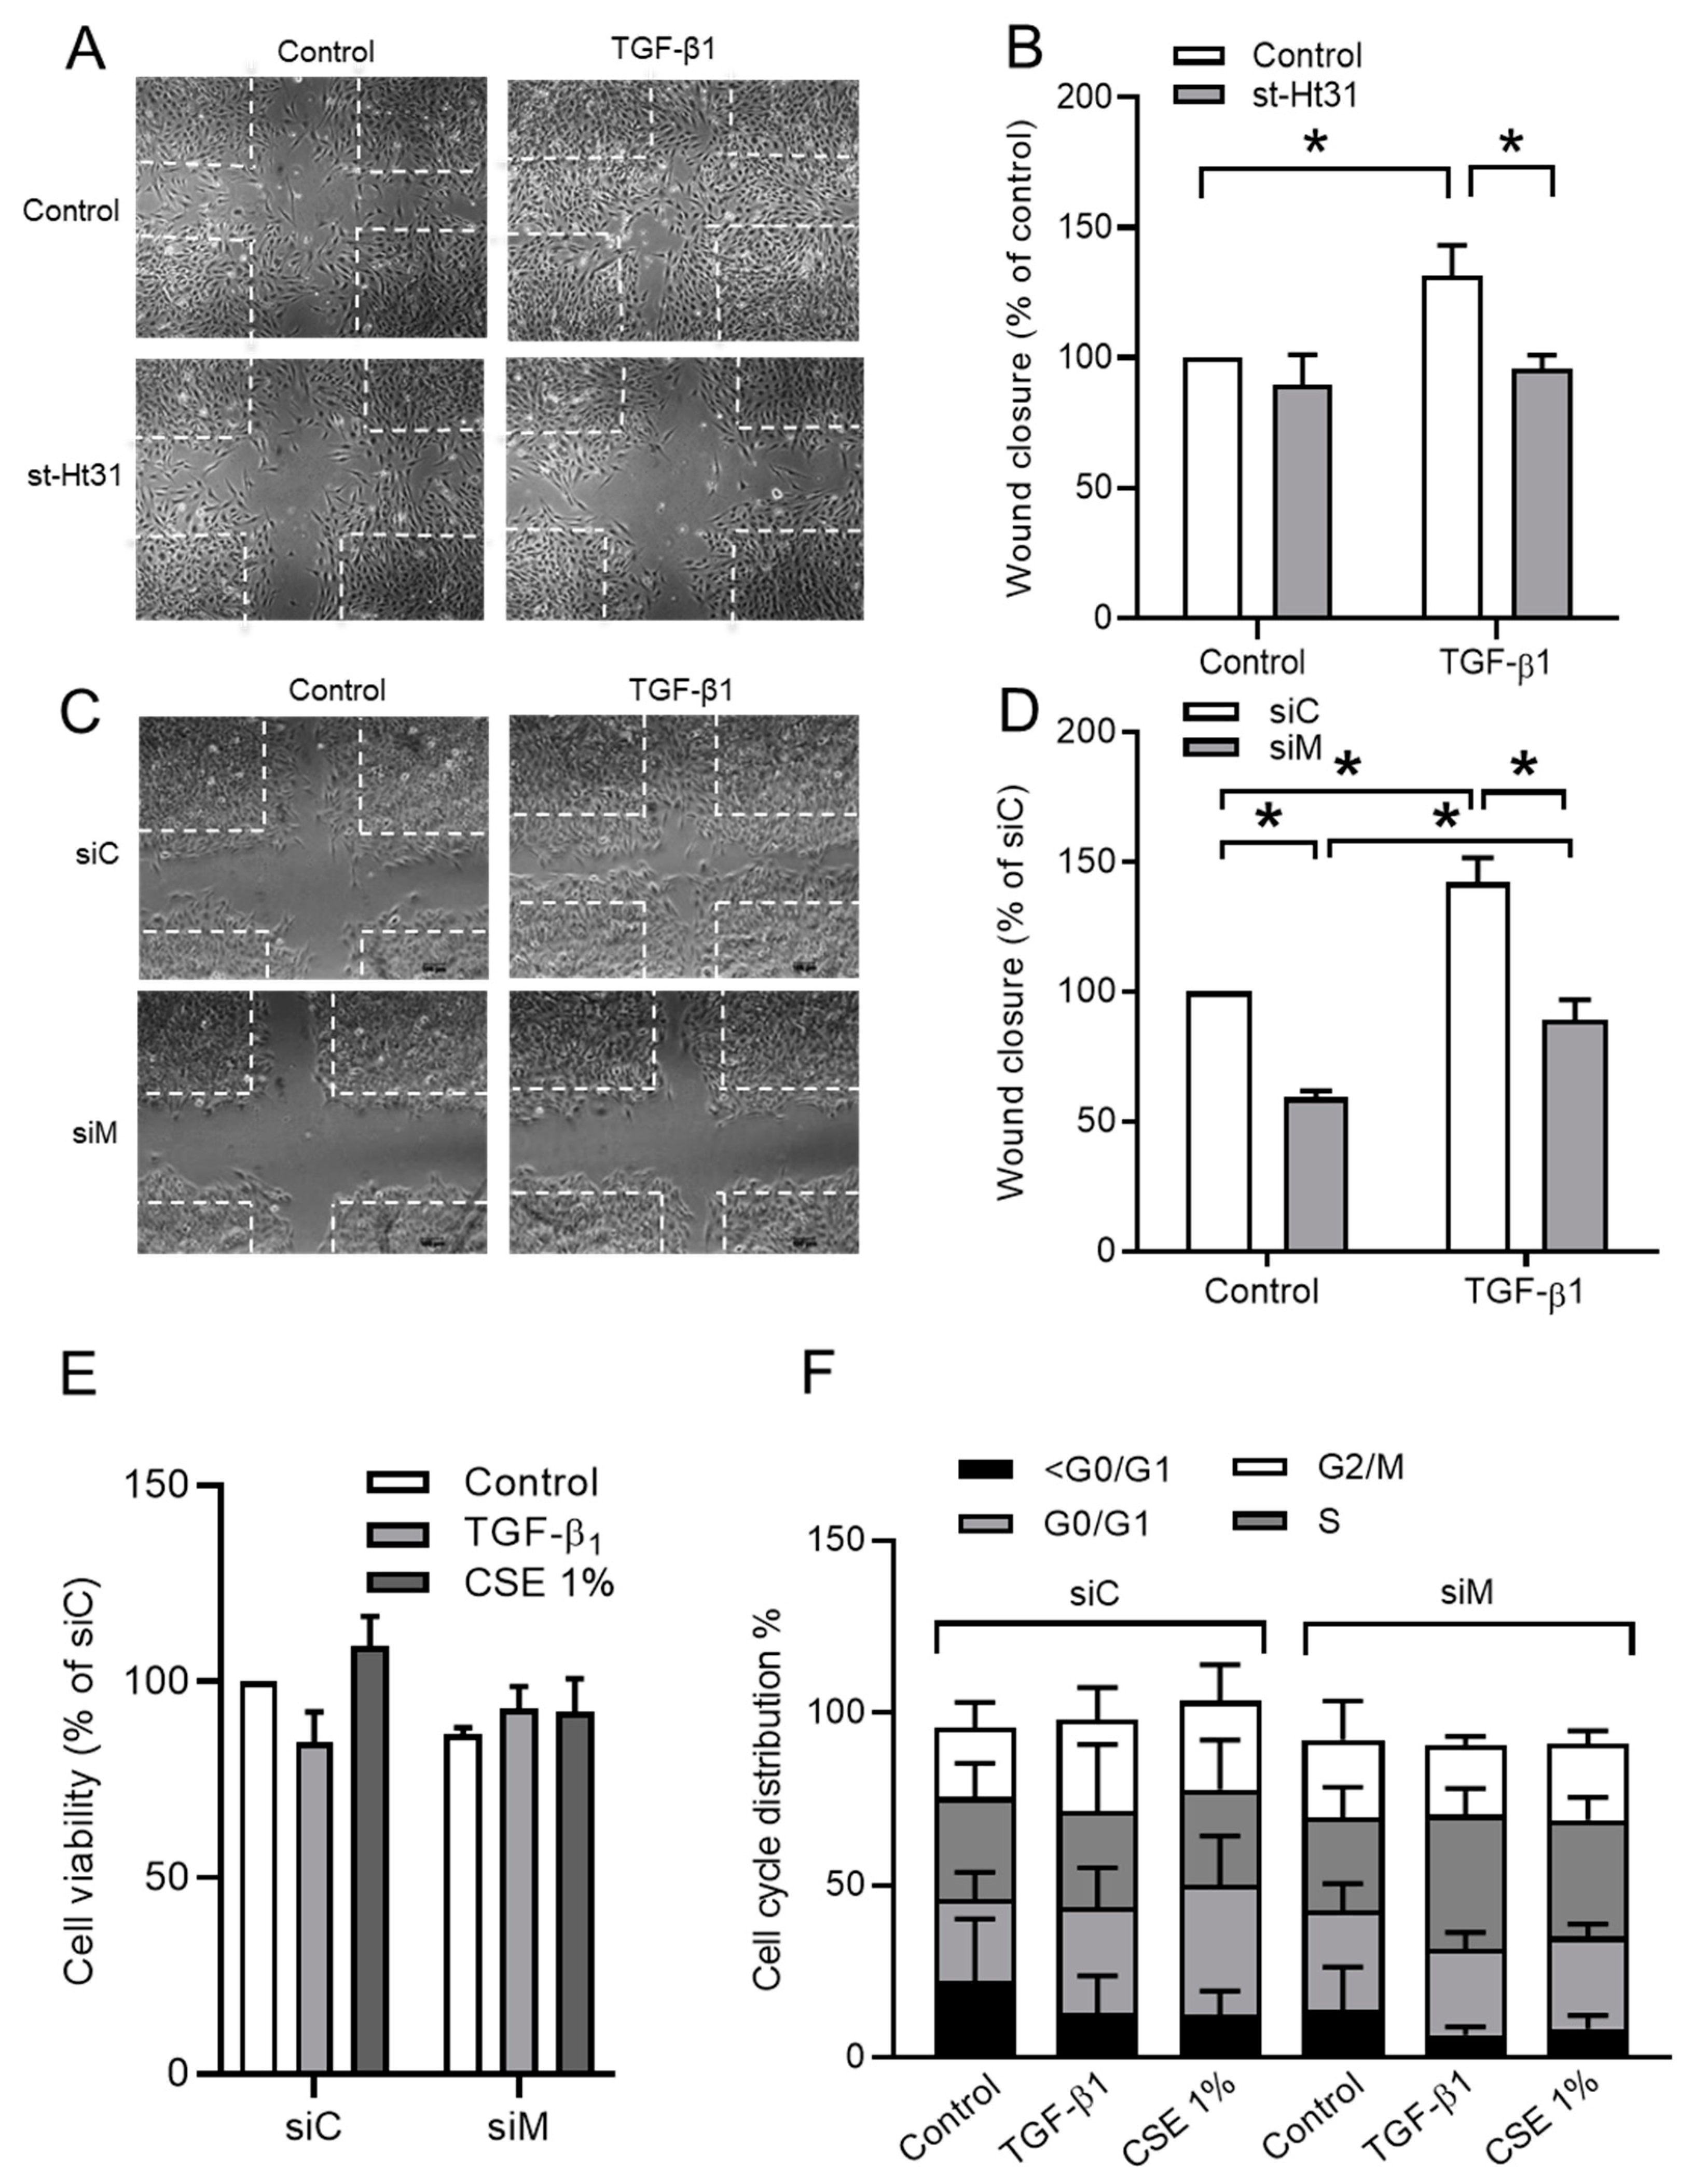
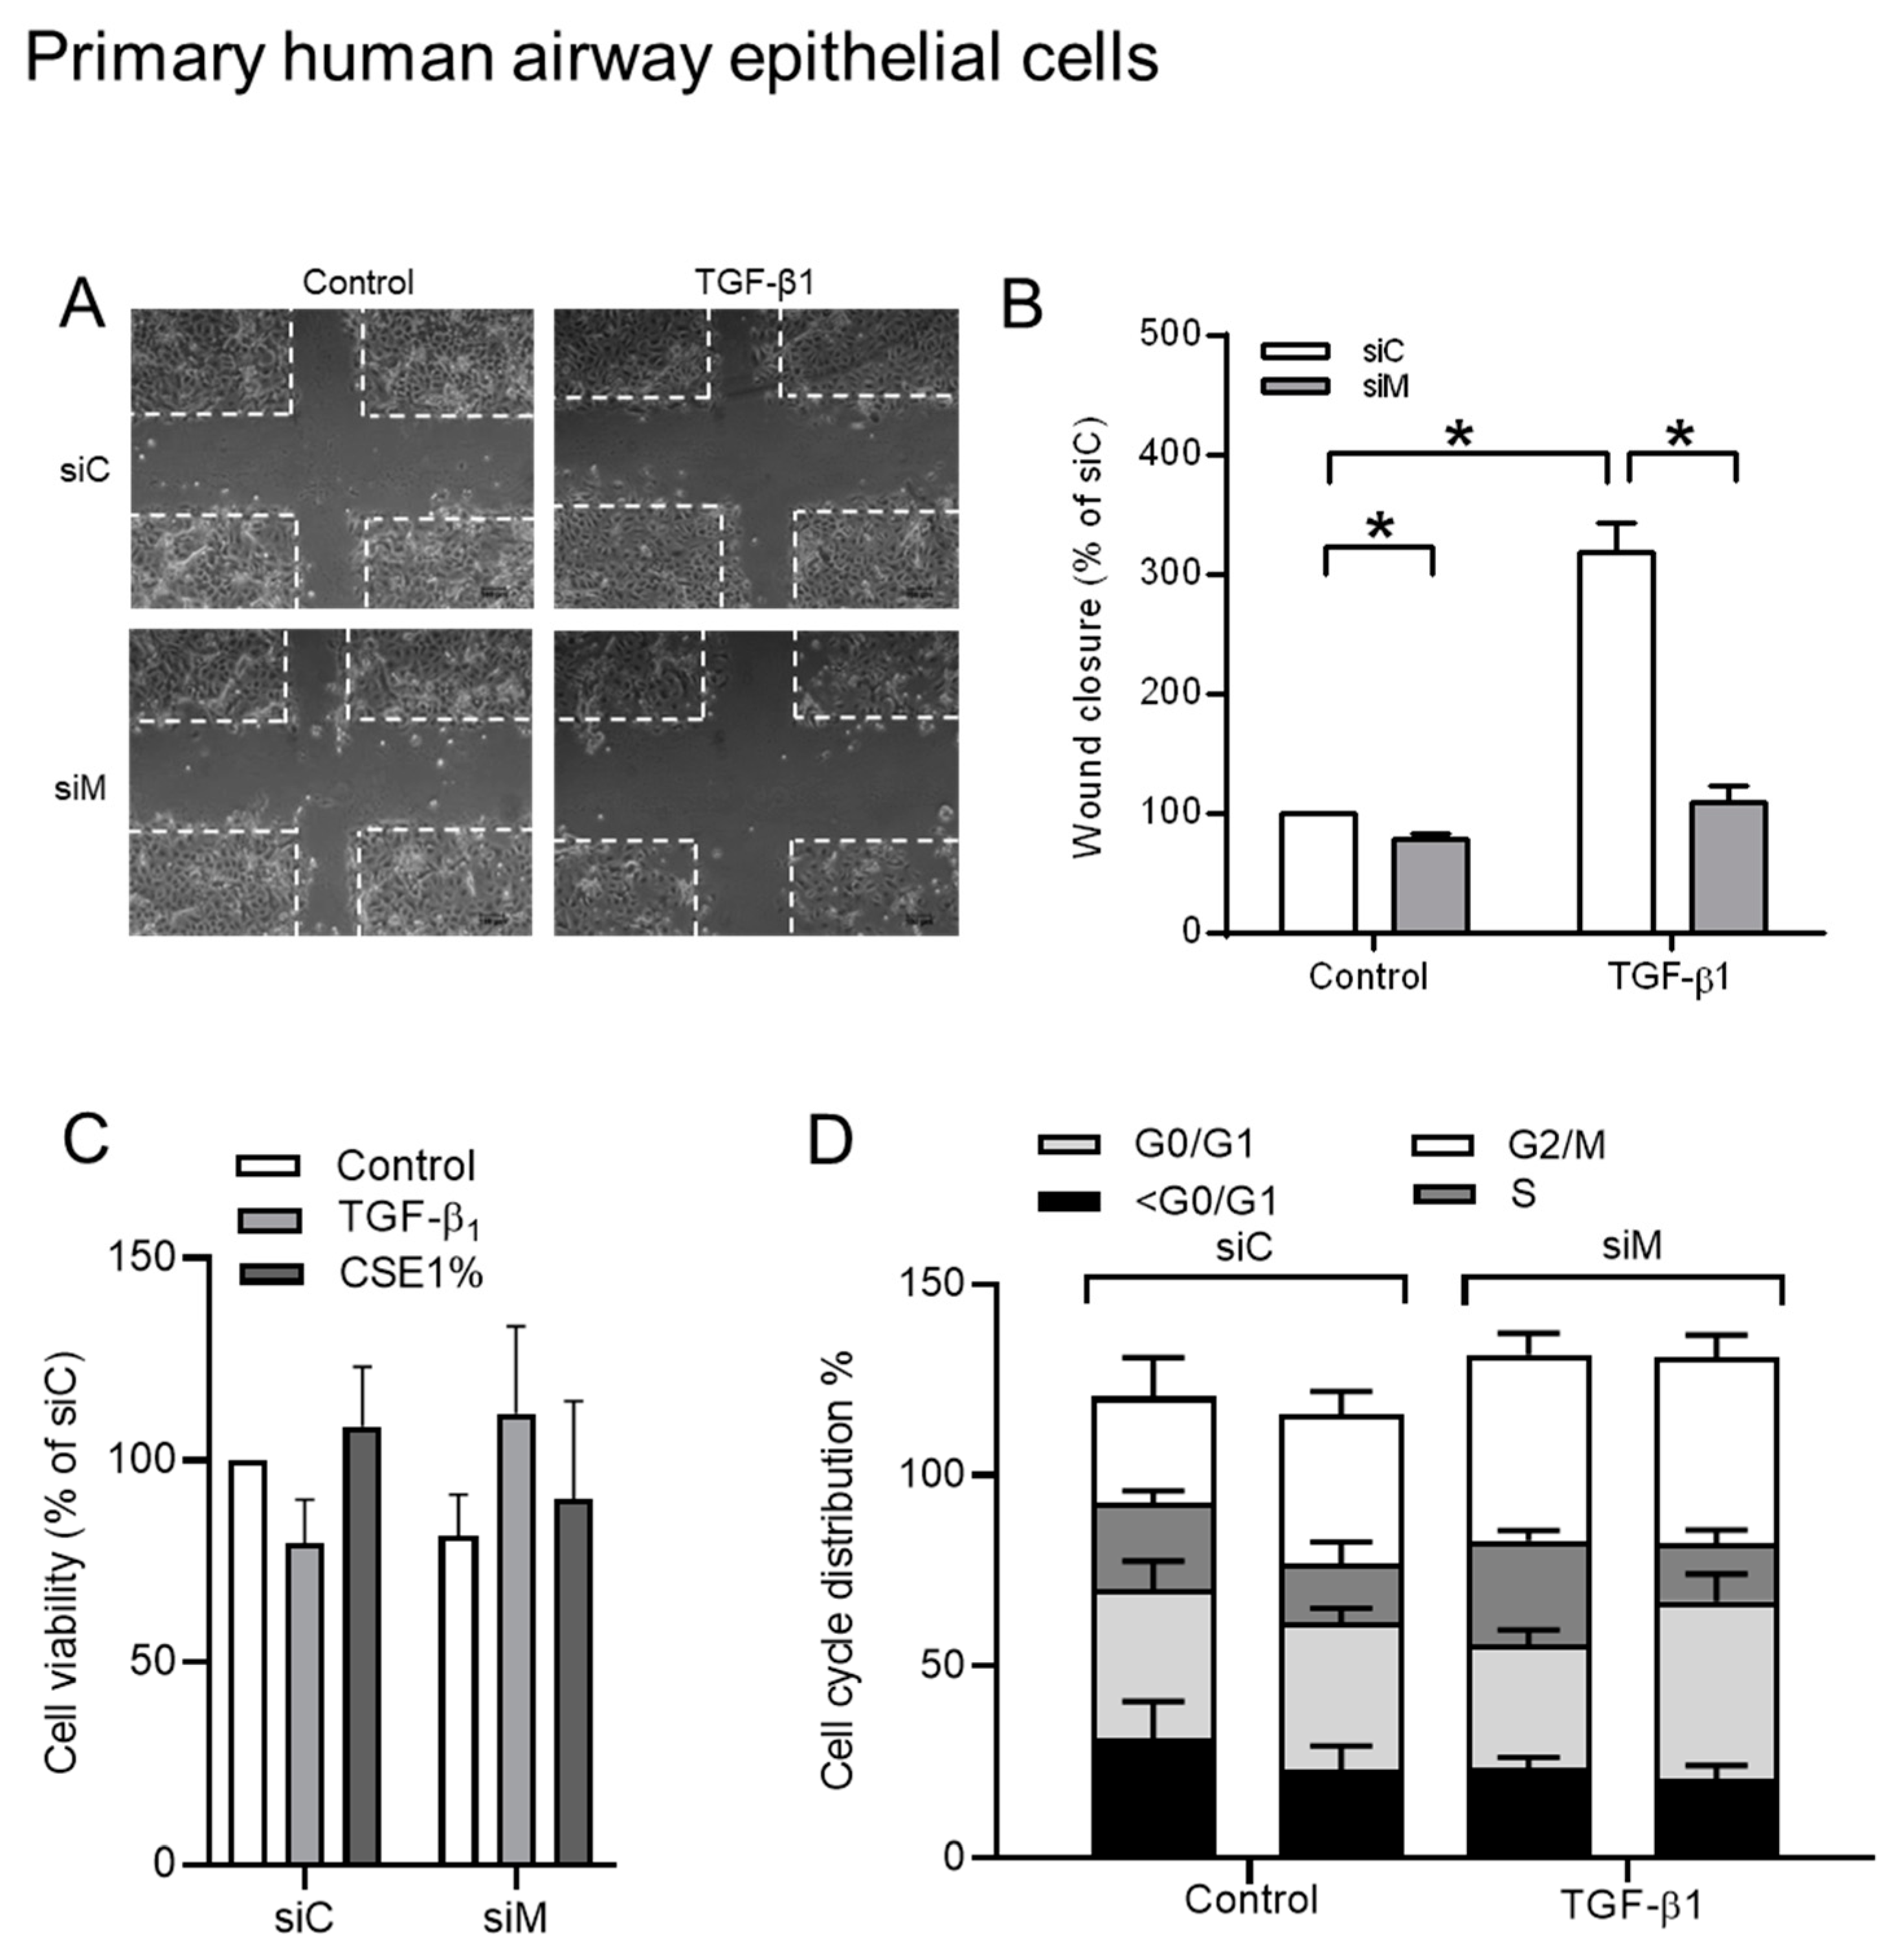
3.5. Ezrin, AKAP95, and Yotiao Are Required for TGF-β1-Induced Cell Migration
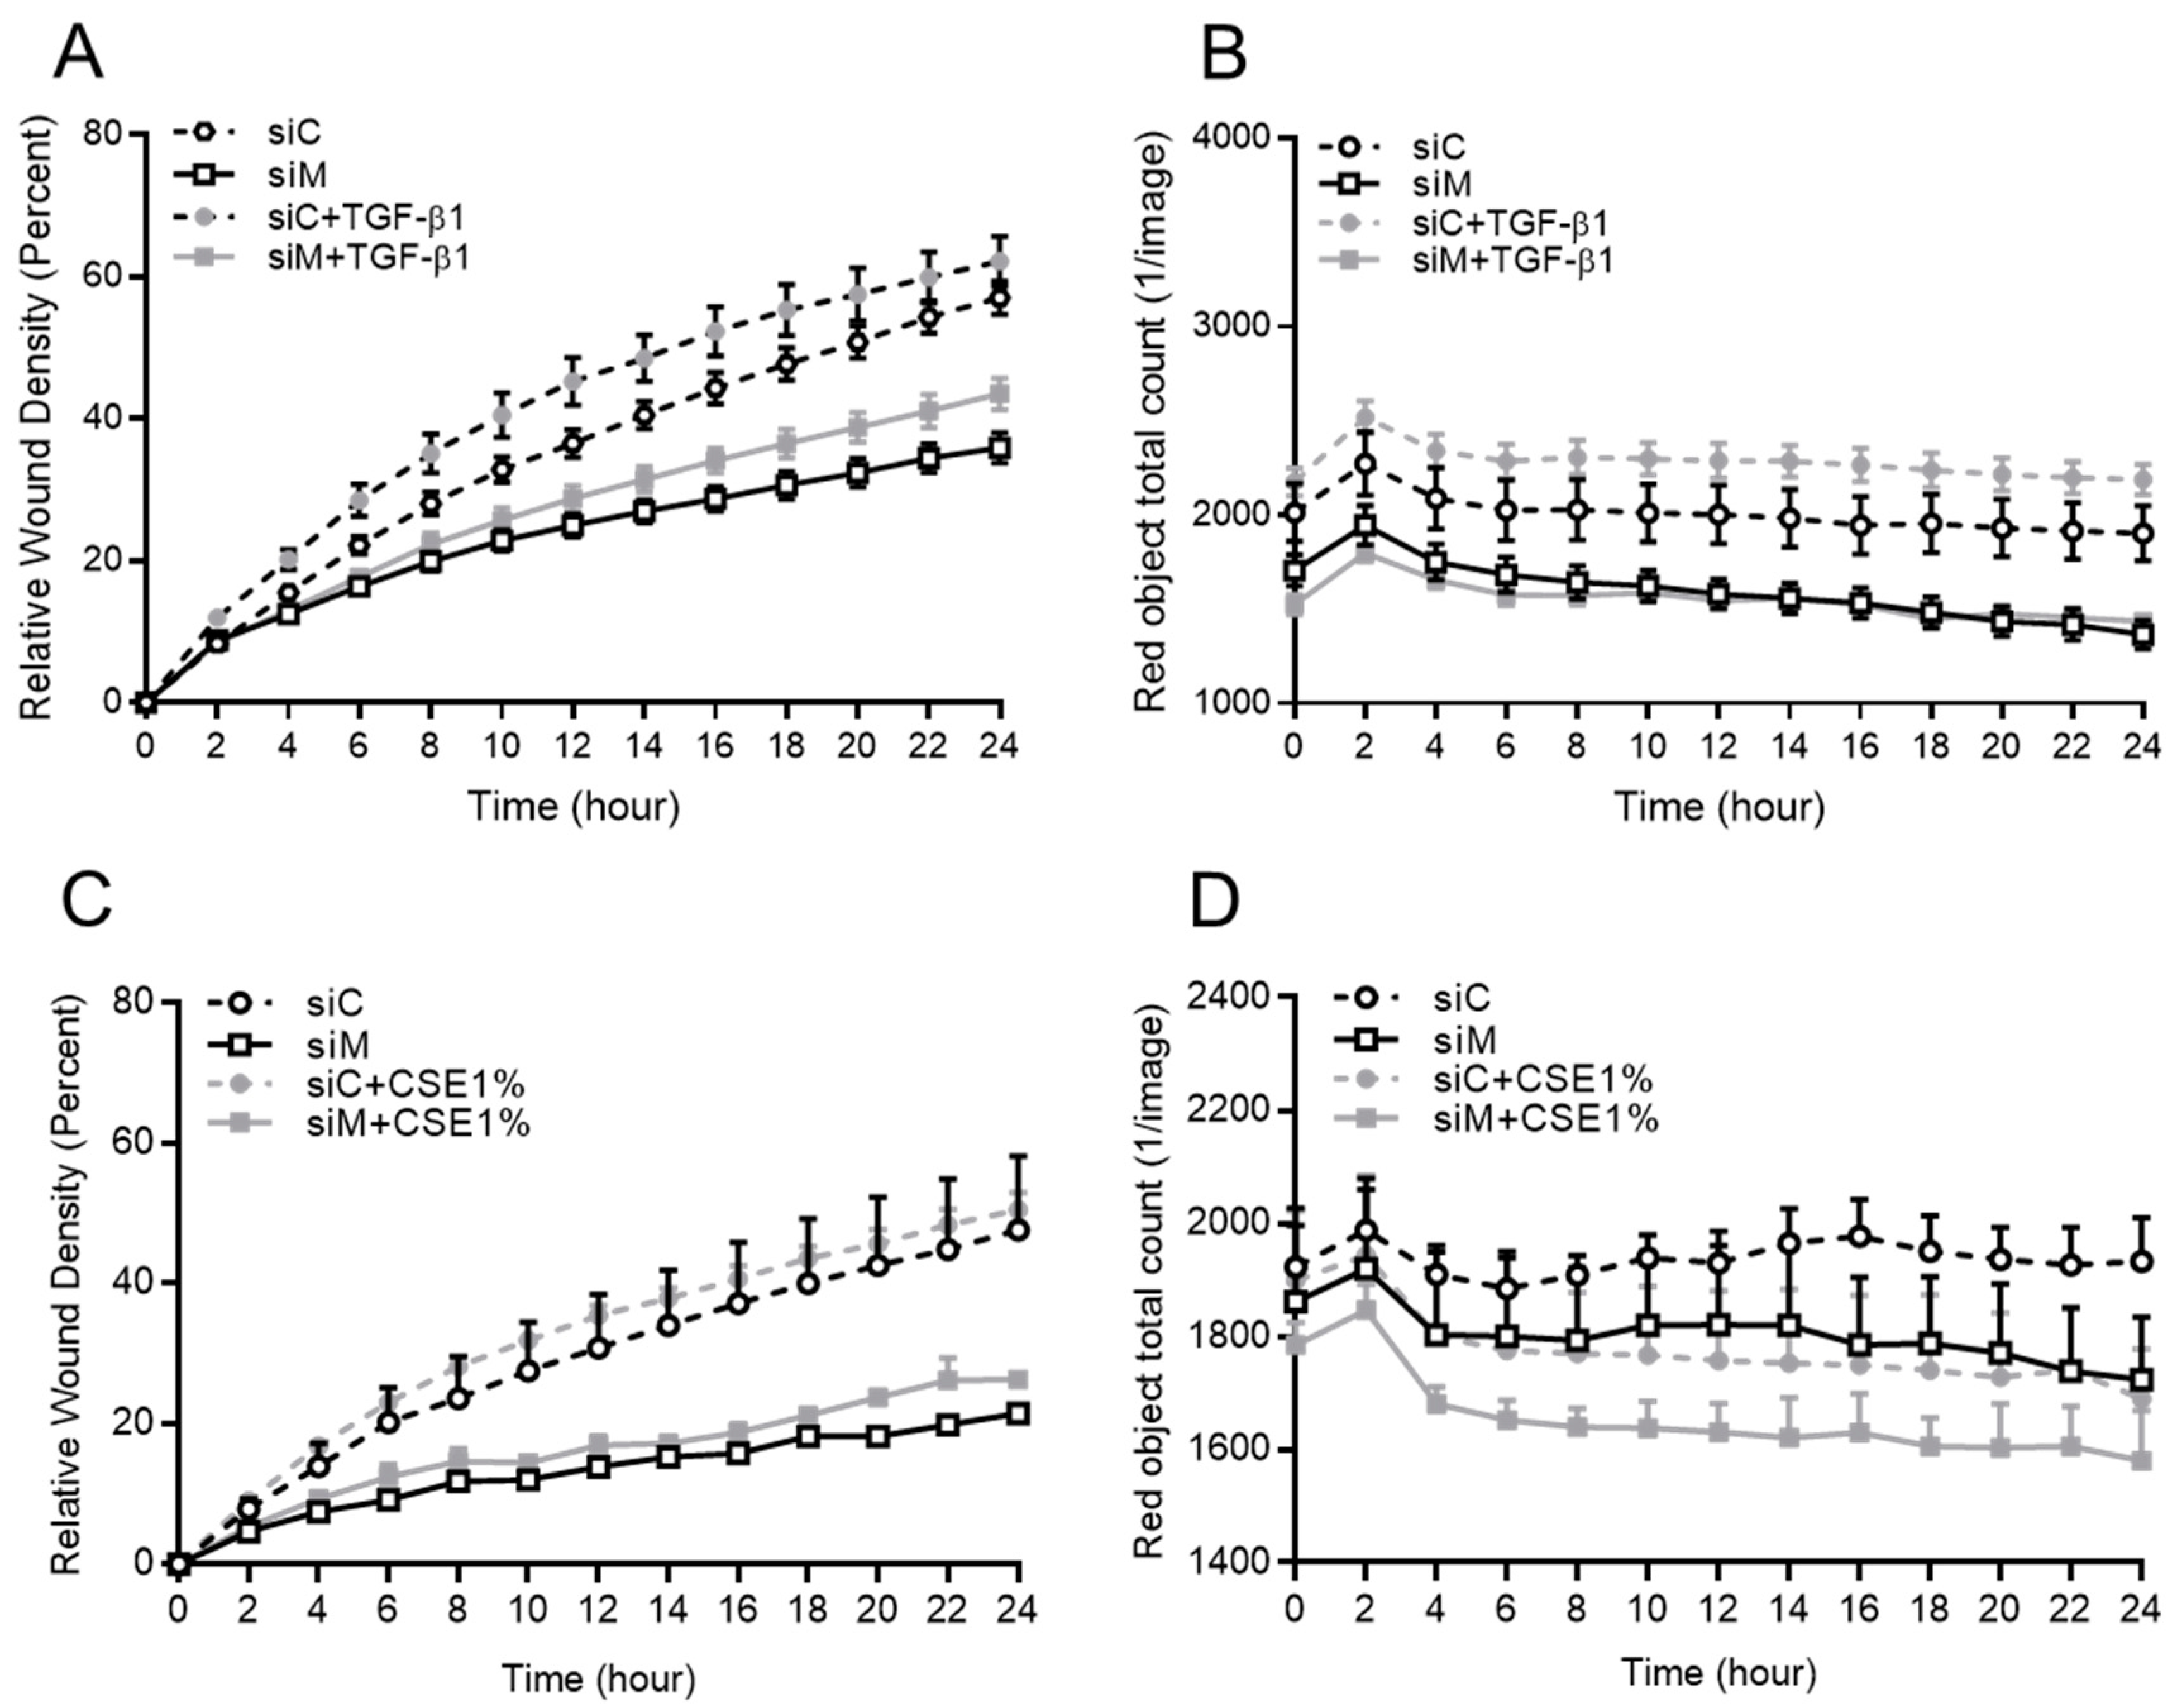
3.6. The Role of AKAPs in Primary HAE Cells
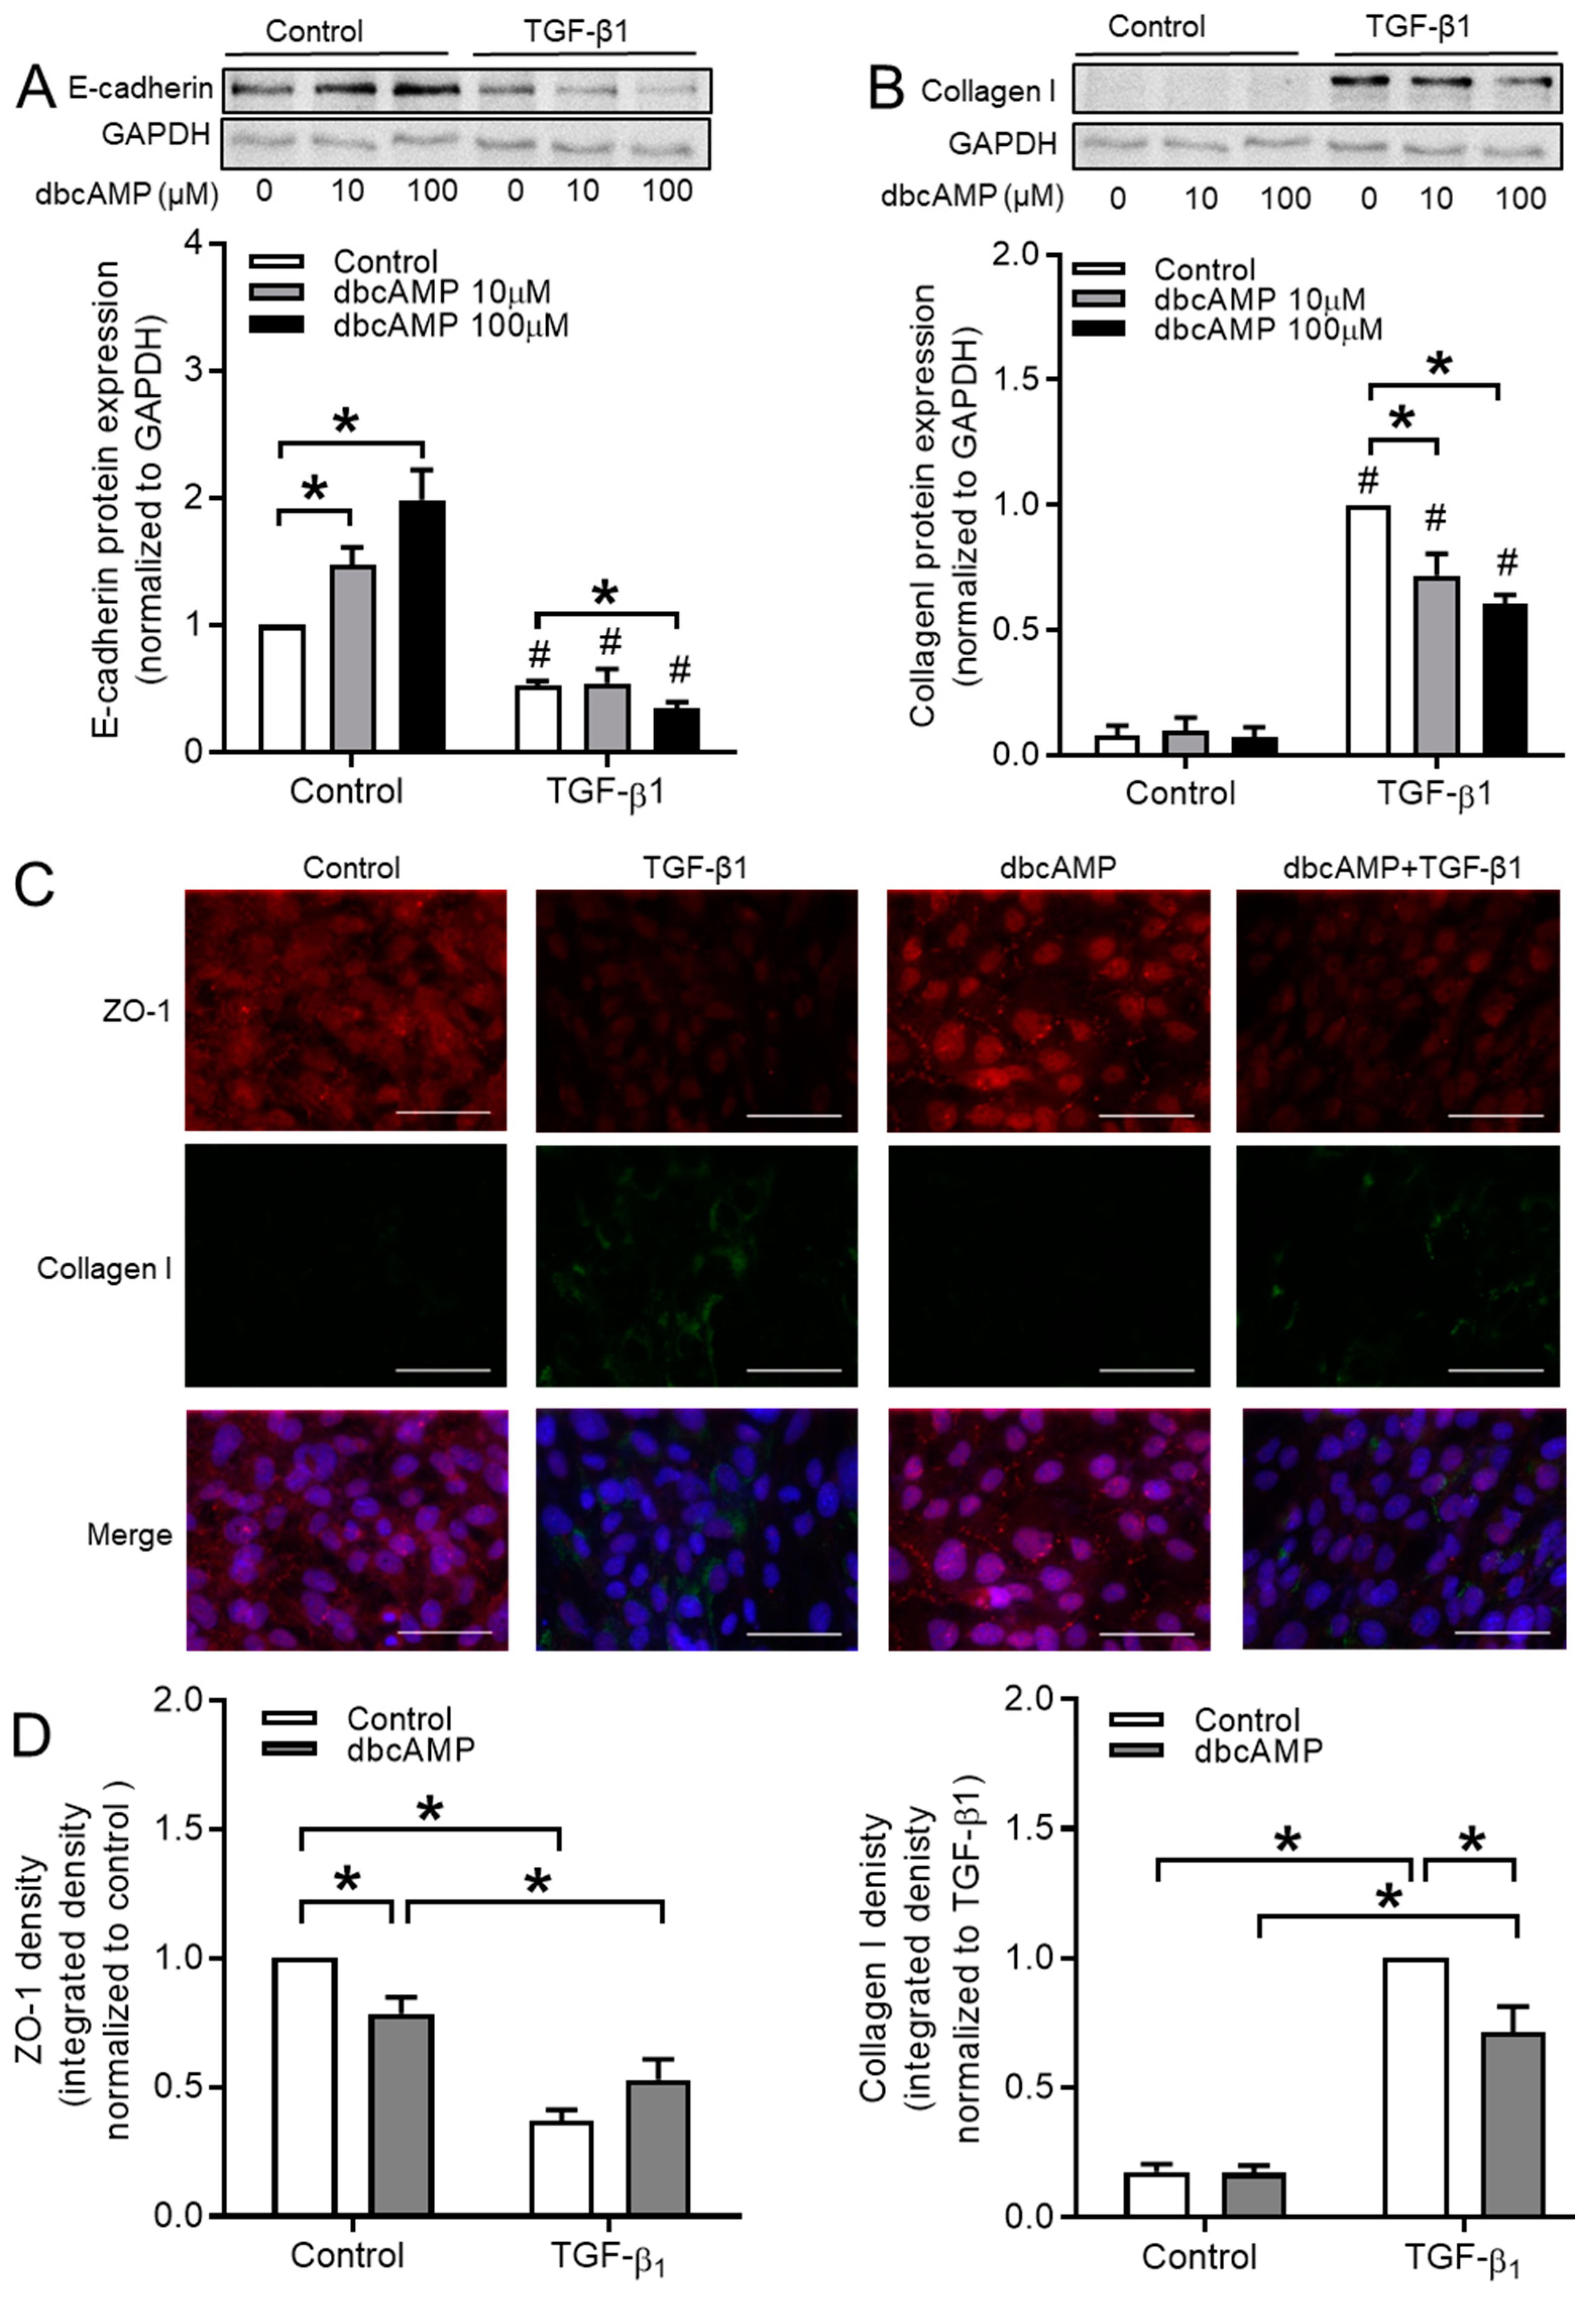
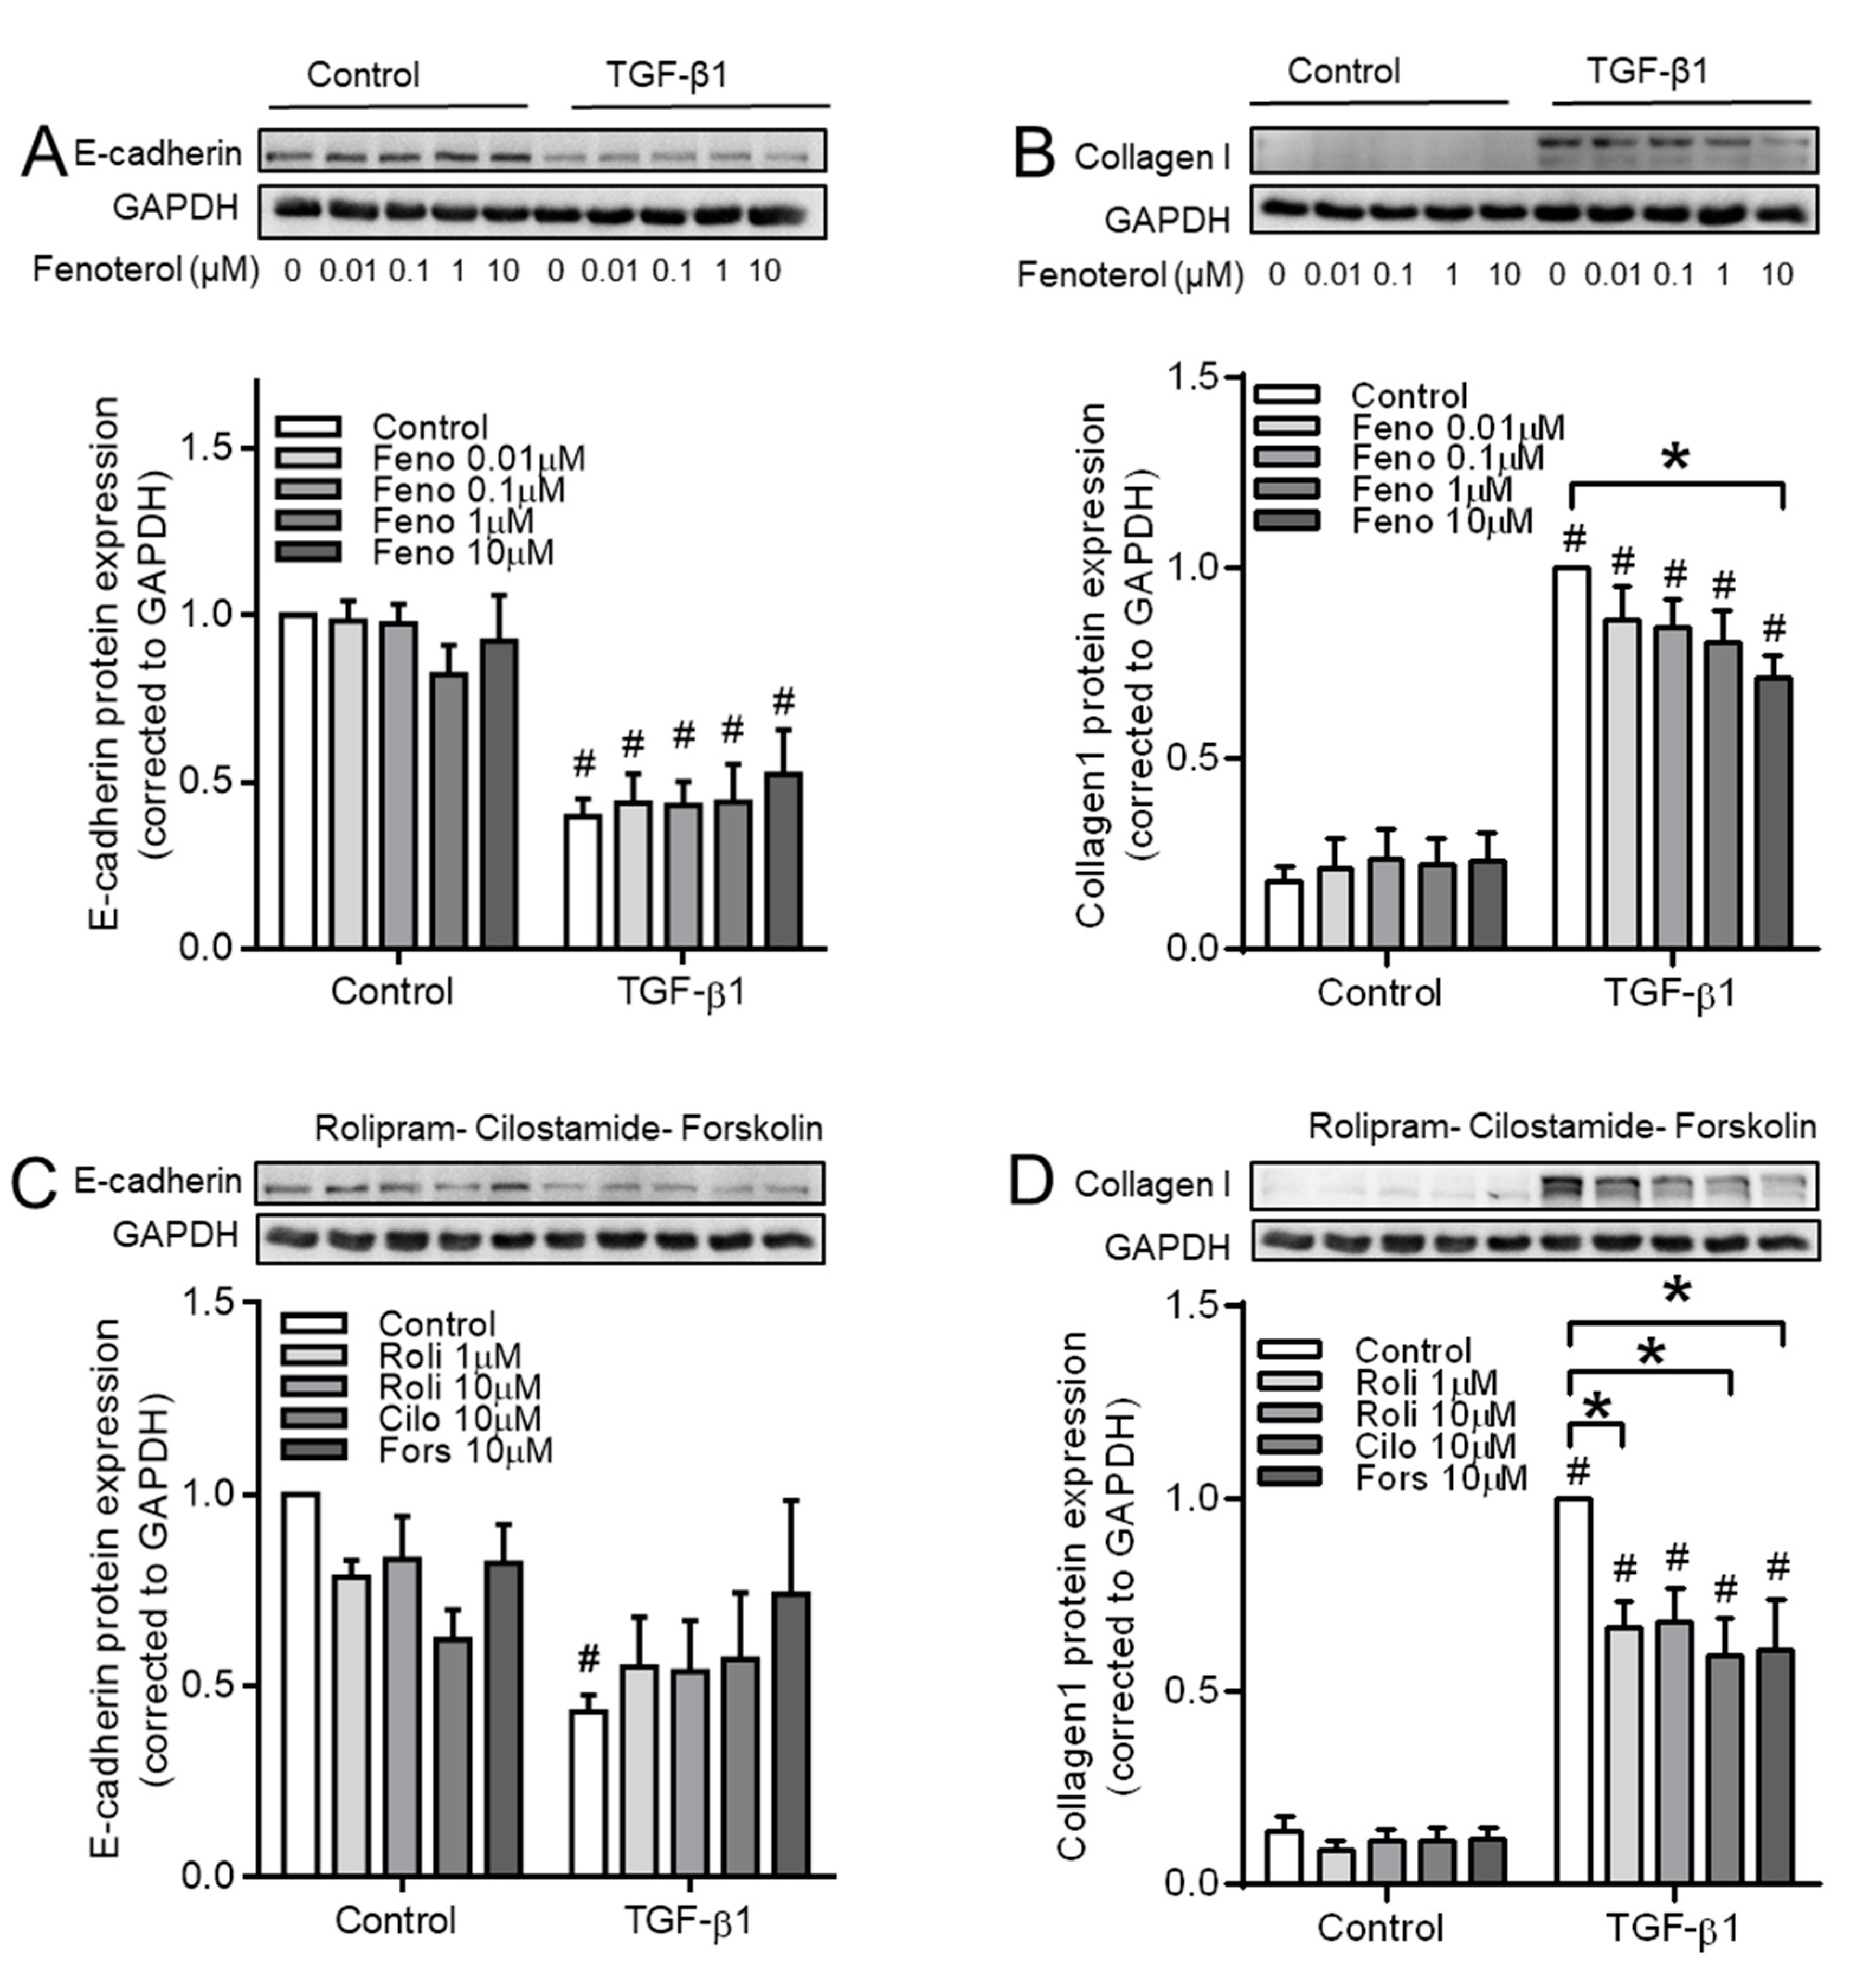
3.7. cAMP Donors Decrease TGF-β1-Induced Collagen Ӏ Upregulation
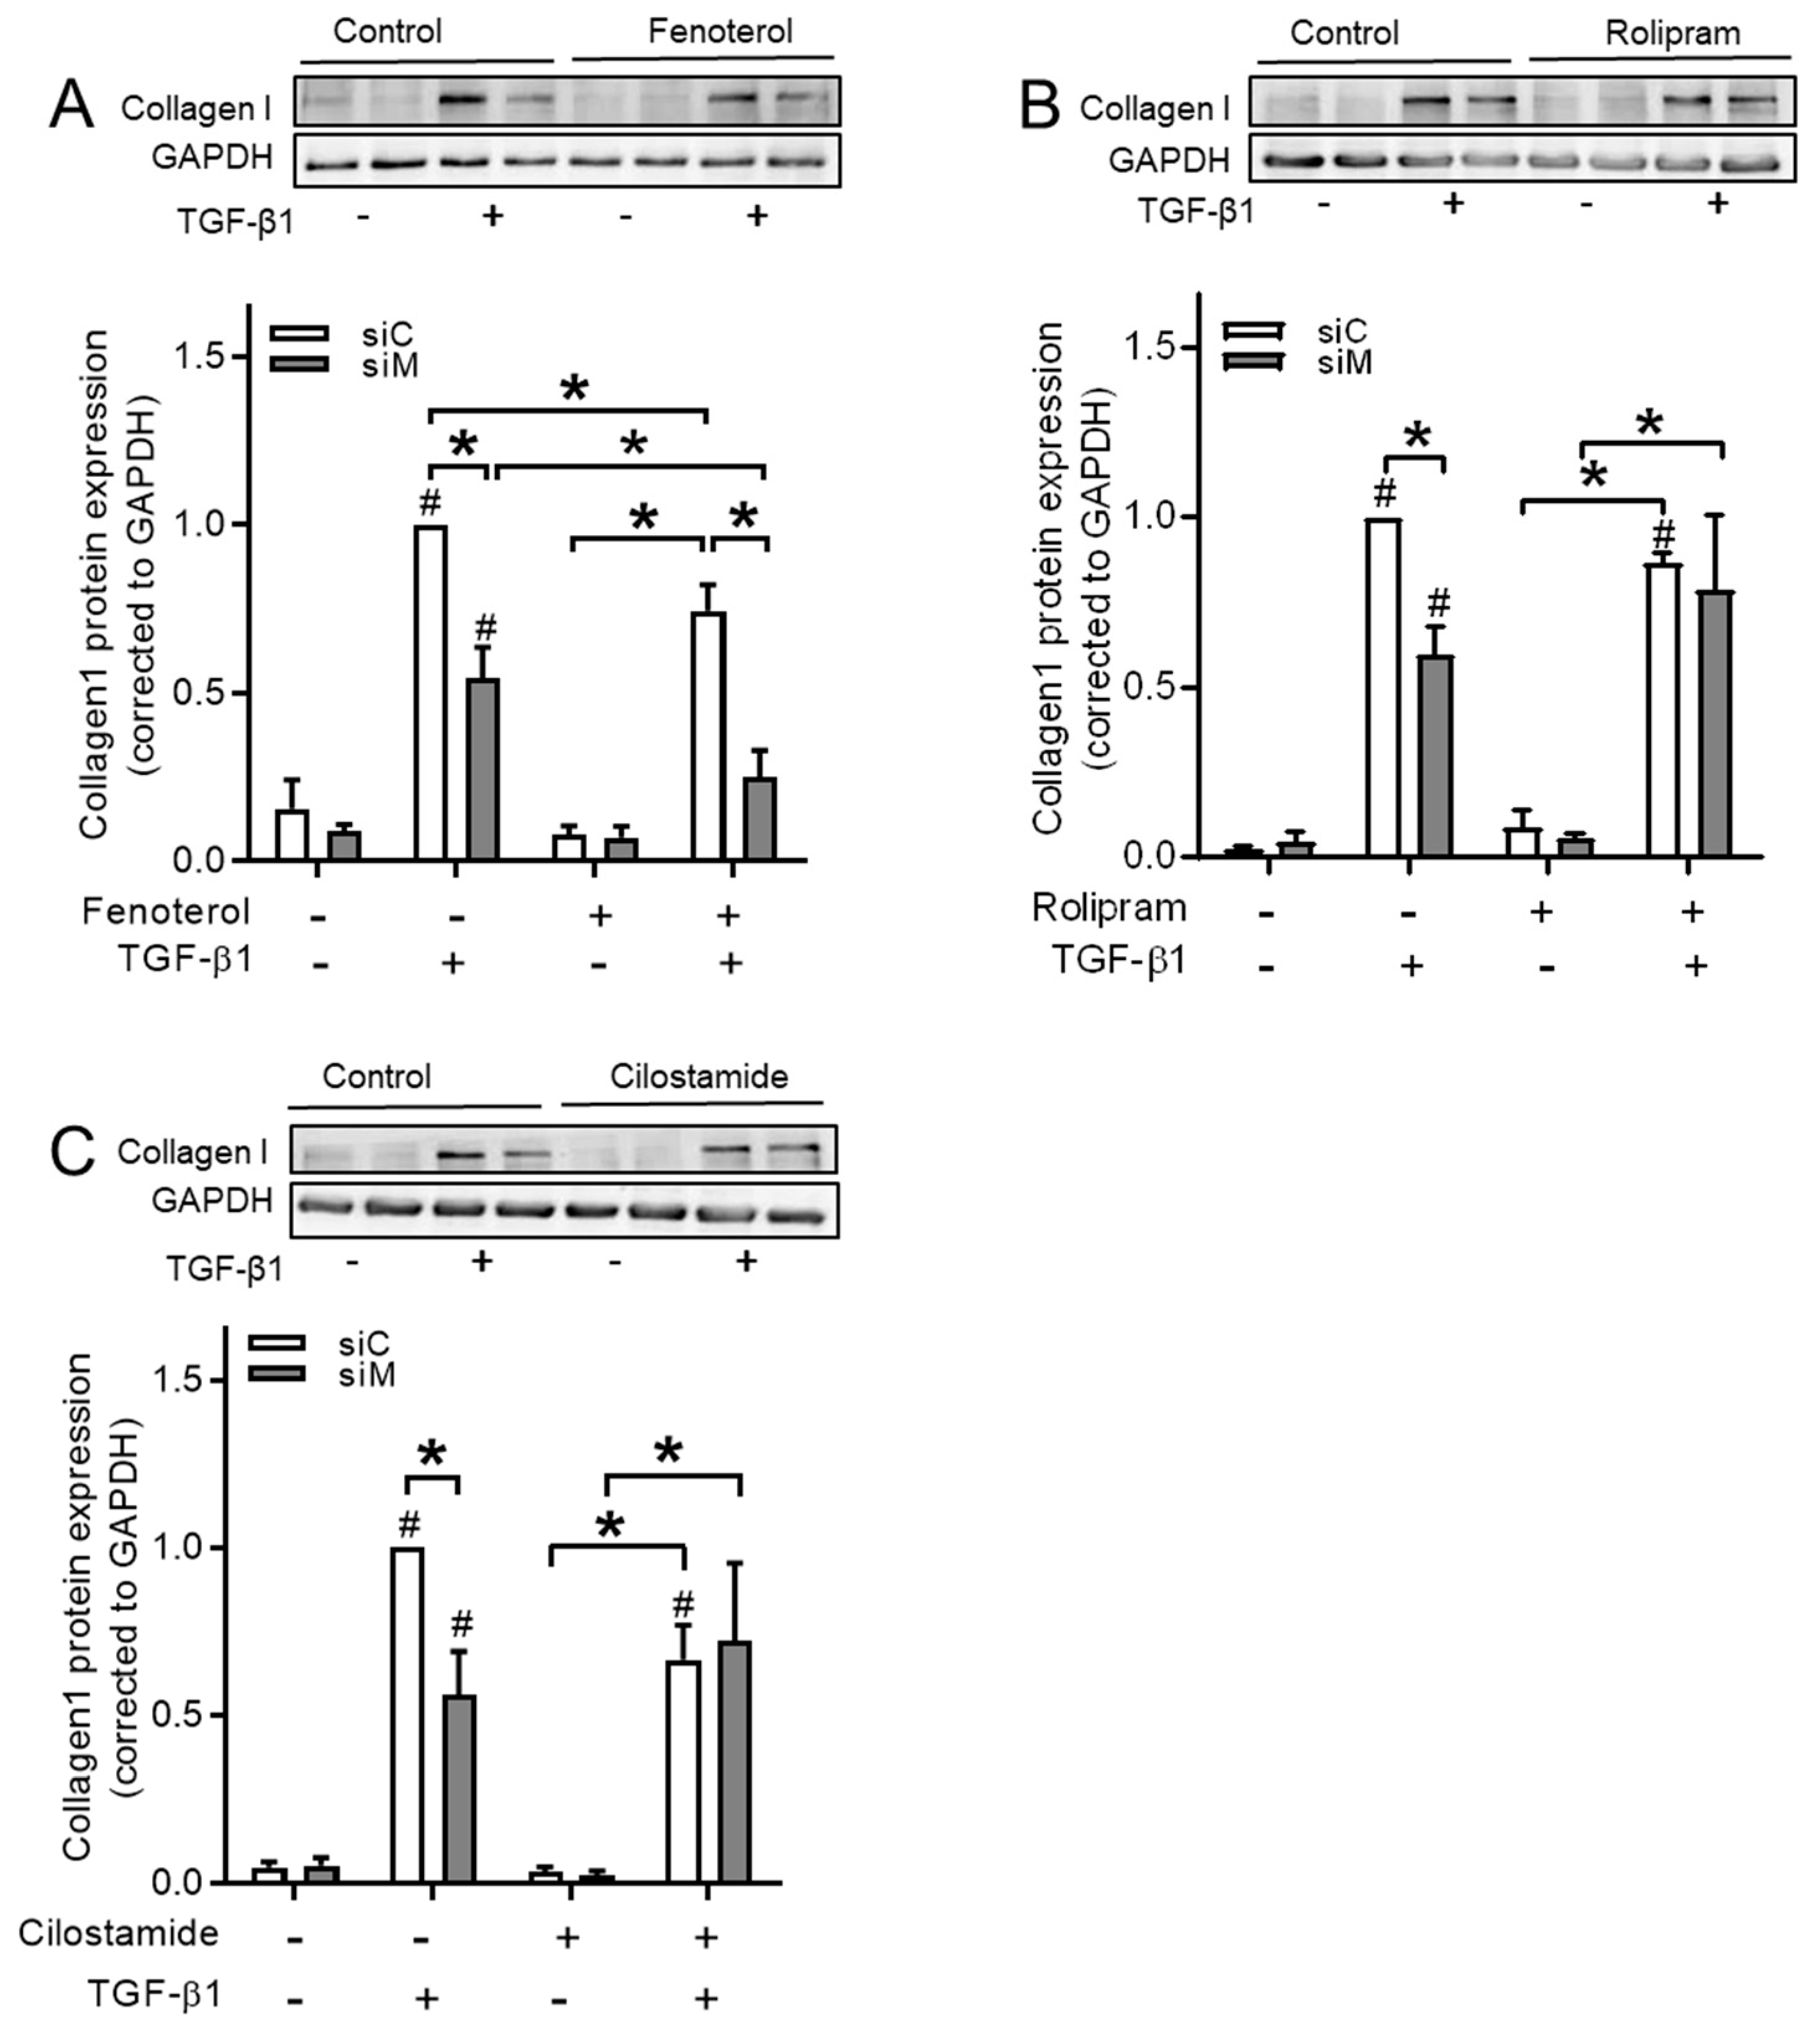
3.8. Ezrin, AKAP95, and Yotiao Differentially Contribute to cAMP Compartments
4. Discussion
5. Conclusions
Supplementary Materials
Author Contributions
Funding
Acknowledgments
Conflicts of Interest
References
- Vogelmeier, C.F.; Criner, G.J.; Martinez, F.J.; Anzueto, A.; Barnes, P.J.; Bourbeau, J.; Celli, B.R.; Chen, R.; Decramer, M.; Fabbri, L.M.; et al. Global Strategy for the Diagnosis, Management, and Prevention of Chronic Obstructive Lung Disease 2017 Report. GOLD Executive Summary. Am. J. Respir. Crit. Care Med. 2017, 195, 557–582. [Google Scholar] [CrossRef] [PubMed]
- Kalluri, R.; Neilson, E.G. Epithelial-mesenchymal transition and its implications for fibrosis. J. Clin. Investig. 2003, 112, 1776–1784. [Google Scholar] [CrossRef] [PubMed]
- Kim, K.K.; Kugler, M.C.; Wolters, P.J.; Robillard, L.; Galvez, M.G.; Brumwell, A.N.; Sheppard, D.; Chapman, H.A. Alveolar epithelial cell mesenchymal transition develops in vivo during pulmonary fibrosis and is regulated by the extracellular matrix. Proc. Natl. Acad. Sci. USA 2006, 103, 13180–13185. [Google Scholar] [CrossRef] [PubMed]
- Zeisberg, M.; Neilson, E.G. Biomarkers for epithelial-mesenchymal transitions. J. Clin. Investig. 2009, 119, 1429–1437. [Google Scholar] [CrossRef]
- Zuo, H.; Cattani-Cavalieri, I.; Valenca, S.S.; Musheshe, N.; Schmidt, M. Function of cAMP scaffolds in obstructive lung disease: Focus on epithelial-to-mesenchymal transition and oxidative stress. Br. J. Pharm. 2019, 176, 2402–2415. [Google Scholar] [CrossRef]
- Milara, J.; Peiro, T.; Serrano, A.; Cortijo, J. Epithelial to mesenchymal transition is increased in patients with COPD and induced by cigarette smoke. Thorax 2013, 68, 410–420. [Google Scholar] [CrossRef]
- Sohal, S.S.; Reid, D.; Soltani, A.; Ward, C.; Weston, S.; Muller, H.K.; Wood-Baker, R.; Walters, E.H. Reticular basement membrane fragmentation and potential epithelial mesenchymal transition is exaggerated in the airways of smokers with chronic obstructive pulmonary disease. Respirology 2010, 15, 930–938. [Google Scholar] [CrossRef]
- Sohal, S.S.; Walters, E.H. Epithelial mesenchymal transition (EMT) in small airways of COPD patients. Thorax 2013, 68, 783–784. [Google Scholar] [CrossRef]
- Kalluri, R.; Weinberg, R.A. The basics of epithelial-mesenchymal transition. J. Clin. Investig. 2009, 119, 1420–1428. [Google Scholar] [CrossRef]
- Bartis, D.; Mise, N.; Mahida, R.Y.; Eickelberg, O.; Thickett, D.R. Epithelial-mesenchymal transition in lung development and disease: Does it exist and is it important? Thorax 2014, 69, 760–765. [Google Scholar] [CrossRef]
- Jansen, S.R.; Poppinga, W.J.; de Jager, W.; Lezoualc’h, F.; Cheng, X.; Wieland, T.; Yarwood, S.J.; Gosens, R.; Schmidt, M. Epac1 links prostaglandin E2 to beta-catenin-dependent transcription during epithelial-to-mesenchymal transition. Oncotarget 2016, 7, 46354–46370. [Google Scholar] [CrossRef] [PubMed][Green Version]
- Jolly, M.K.; Ware, K.E.; Gilja, S.; Somarelli, J.A.; Levine, H. EMT and MET: Necessary or permissive for metastasis? Mol. Oncol. 2017, 11, 755–769. [Google Scholar] [CrossRef] [PubMed]
- Nieto, M.A. The ins and outs of the epithelial to mesenchymal transition in health and disease. Annu. Rev. Cell Dev. Biol. 2011, 27, 347–376. [Google Scholar] [CrossRef] [PubMed]
- Beene, D.L.; Scott, J.D. A-kinase anchoring proteins take shape. Curr. Opin. Cell Biol. 2007, 19, 192–198. [Google Scholar] [CrossRef] [PubMed]
- Skroblin, P.; Grossmann, S.; Schafer, G.; Rosenthal, W.; Klussmann, E. Mechanisms of protein kinase A anchoring. Int. Rev. Cell Mol. Biol. 2010, 283, 235–330. [Google Scholar] [PubMed]
- Poppinga, W.J.; Munoz-Llancao, P.; Gonzalez-Billault, C.; Schmidt, M. A-kinase anchoring proteins: cAMP compartmentalization in neurodegenerative and obstructive pulmonary diseases. Br. J. Pharm. 2014, 171, 5603–5623. [Google Scholar] [CrossRef]
- Chen, M.J.; Gao, X.J.; Xu, L.N.; Liu, T.F.; Liu, X.H.; Liu, L.X. Ezrin is required for epithelial-mesenchymal transition induced by TGF-beta1 in A549 cells. Int. J. Oncol. 2014, 45, 1515–1522. [Google Scholar] [CrossRef]
- Hu, Z.Y.; Liu, Y.P.; Xie, L.Y.; Wang, X.Y.; Yang, F.; Chen, S.Y.; Li, Z.G. AKAP-9 promotes colorectal cancer development by regulating Cdc42 interacting protein 4. Biochim. Biophys. Acta 2016, 1862, 1172–1181. [Google Scholar] [CrossRef]
- Oldenburger, A.; Poppinga, W.J.; Kos, F.; de Bruin, H.G.; Rijks, W.F.; Heijink, I.H.; Timens, W.; Meurs, H.; Maarsingh, H.; Schmidt, M. A-kinase anchoring proteins contribute to loss of E-cadherin and bronchial epithelial barrier by cigarette smoke. Am. J. Physiol. Cell Physiol. 2014, 306, C585–C597. [Google Scholar] [CrossRef]
- van Wetering, S.; van der Linden, A.C.; van Sterkenburg, M.A.; Rabe, K.F.; Schalkwijk, J.; Hiemstra, P.S. Regulation of secretory leukocyte proteinase inhibitor (SLPI) production by human bronchial epithelial cells: Increase of cell-associated SLPI by neutrophil elastase. J. Investig. Med. 2000, 48, 359–366. [Google Scholar]
- Poppinga, W.J.; Heijink, I.H.; Holtzer, L.J.; Skroblin, P.; Klussmann, E.; Halayko, A.J.; Timens, W.; Maarsingh, H.; Schmidt, M. A-kinase-anchoring proteins coordinate inflammatory responses to cigarette smoke in airway smooth muscle. Am. J. Physiol. Lung Cell Mol. Physiol. 2015, 308, L766–L775. [Google Scholar] [CrossRef]
- Keenan, C.R.; Langenbach, S.Y.; Jativa, F.; Harris, T.; Li, M.; Chen, Q.; Xia, Y.; Gao, B.; Schuliga, M.J.; Jaffar, J.; et al. Casein Kinase 1delta/epsilon Inhibitor, PF670462 Attenuates the Fibrogenic Effects of Transforming Growth Factor-beta in Pulmonary Fibrosis. Front. Pharm. 2018, 9, 738. [Google Scholar] [CrossRef]
- Ruijter, J.M.; Ramakers, C.; Hoogaars, W.M.; Karlen, Y.; Bakker, O.; van den Hoff, M.J.; Moorman, A.F. Amplification efficiency: Linking baseline and bias in the analysis of quantitative PCR data. Nucleic Acids Res. 2009, 37, e45. [Google Scholar] [CrossRef]
- Mihailichenko, D.; Pertseva, T. Influence of tobacco-smoking on serum level of transforming growth factor (TGF) beta 1 in COPD patients. Eur. Respir. J. 2017, 50, PA3602. [Google Scholar]
- Wang, Q.; Wang, Y.; Zhang, Y.; Zhang, Y.; Xiao, W. The role of uPAR in epithelial-mesenchymal transition in small airway epithelium of patients with chronic obstructive pulmonary disease. Respir. Res. 2013, 14, 67. [Google Scholar] [CrossRef] [PubMed]
- Fehon, R.G.; McClatchey, A.I.; Bretscher, A. Organizing the cell cortex: The role of ERM proteins. Nat. Rev. Mol. Cell Biol. 2010, 11, 276–287. [Google Scholar] [CrossRef] [PubMed]
- Ivetic, A.; Ridley, A.J. Ezrin/radixin/moesin proteins and Rho GTPase signalling in leucocytes. Immunology 2004, 112, 165–176. [Google Scholar] [CrossRef] [PubMed]
- Tsukita, S.; Yonemura, S. ERM (ezrin/radixin/moesin) family: From cytoskeleton to signal transduction. Curr. Opin. Cell. Biol. 1997, 9, 70–75. [Google Scholar] [CrossRef]
- Pastor, M.D.; Nogal, A.; Molina-Pinelo, S.; Melendez, R.; Salinas, A.; Gonzalez De la Pena, M.; Martin-Juan, J.; Corral, J.; Garcia-Carbonero, R.; Carnero, A.; et al. Identification of proteomic signatures associated with lung cancer and COPD. J. Proteom. 2013, 89, 227–237. [Google Scholar] [CrossRef]
- Li, Q.; Li, N.; Liu, C.Y.; Xu, R.; Kolosov, V.P.; Perelman, J.M.; Zhou, X.D. Ezrin/Exocyst complex regulates mucin 5AC secretion induced by neutrophil elastase in human airway epithelial cells. Cell Physiol. Biochem. 2015, 35, 326–338. [Google Scholar] [CrossRef]
- Jia, M.; Yan, X.; Jiang, X.; Wu, Y.; Xu, J.; Meng, Y.; Yang, Y.; Shan, X.; Zhang, X.; Mao, S.; et al. Ezrin, a Membrane Cytoskeleton Cross-Linker Protein, as a Marker of Epithelial Damage in Asthma. Am. J. Respir. Crit. Care Med. 2019, 199, 496–507. [Google Scholar] [CrossRef] [PubMed]
- Perez, P.; Aguilera, S.; Olea, N.; Alliende, C.; Molina, C.; Brito, M.; Barrera, M.J.; Leyton, C.; Rowzee, A.; Gonzalez, M.J. Aberrant localization of ezrin correlates with salivary acini disorganization in Sjogren’s Syndrome. Rheumatology 2010, 49, 915–923. [Google Scholar] [CrossRef] [PubMed][Green Version]
- Sarrio, D.; Rodriguez-Pinilla, S.M.; Dotor, A.; Calero, F.; Hardisson, D.; Palacios, J. Abnormal ezrin localization is associated with clinicopathological features in invasive breast carcinomas. Breast Cancer Res. Treat. 2006, 98, 71–79. [Google Scholar] [CrossRef] [PubMed]
- Huang, H.Y.; Li, C.F.; Fang, F.M.; Tsai, J.W.; Li, S.H.; Lee, Y.T.; Wei, H.M. Prognostic implication of ezrin overexpression in myxofibrosarcomas. Ann. Surg. Oncol. 2010, 17, 3212–3219. [Google Scholar] [CrossRef] [PubMed]
- Li, Q.; Gao, H.; Xu, H.; Wang, X.; Pan, Y.; Hao, F.; Qiu, X.; Stoecker, M.; Wang, E.; Wang, E. Expression of ezrin correlates with malignant phenotype of lung cancer, and in vitro knockdown of ezrin reverses the aggressive biological behavior of lung cancer cells. Tumour. Biol. 2012, 33, 1493–1504. [Google Scholar] [CrossRef]
- Saito, S.; Yamamoto, H.; Mukaisho, K.; Sato, S.; Higo, T.; Hattori, T.; Yamamoto, G.; Sugihara, H. Mechanisms underlying cancer progression caused by ezrin overexpression in tongue squamous cell carcinoma. PLoS ONE 2013, 8, e54881. [Google Scholar] [CrossRef]
- Han, B.; Poppinga, W.J.; Schmidt, M. Scaffolding during the cell cycle by A-kinase anchoring proteins. Pflug. Arch. 2015, 467, 2401–2411. [Google Scholar] [CrossRef]
- Chen, G.; Khalil, N. TGF-beta1 increases proliferation of airway smooth muscle cells by phosphorylation of map kinases. Respir. Res. 2006, 7, 2. [Google Scholar] [CrossRef]
- Yue, X.; Shan, B.; Lasky, J.A. TGF-beta: Titan of Lung Fibrogenesis. Curr. Enzym. Inhib. 2010, 6, 67–77. [Google Scholar] [CrossRef]
- Frank, B.; Wiestler, M.; Kropp, S.; Hemminki, K.; Spurdle, A.B.; Sutter, C.; Wappenschmidt, B.; Chen, X.; Beesley, J.; Hopper, J.L.; et al. Association of a common AKAP9 variant with breast cancer risk: A collaborative analysis. J. Natl. Cancer Inst. 2008, 100, 437–442. [Google Scholar] [CrossRef]
- Truong, T.; Sauter, W.; McKay, J.D.; Hosgood, H.D., 3rd; Gallagher, C.; Amos, C.I.; Spitz, M.; Muscat, J.; Lazarus, P.; Illig, T.; et al. International Lung Cancer Consortium: Coordinated association study of 10 potential lung cancer susceptibility variants. Carcinogenesis 2010, 31, 625–633. [Google Scholar] [CrossRef] [PubMed]
- Kabbarah, O.; Nogueira, C.; Feng, B.; Nazarian, R.M.; Bosenberg, M.; Wu, M.; Scott, K.L.; Kwong, L.N.; Xiao, Y.; Cordon-Cardo, C.; et al. Integrative genome comparison of primary and metastatic melanomas. PLoS ONE 2010, 5, e10770. [Google Scholar] [CrossRef] [PubMed]
- Caria, P.; Vanni, R. Cytogenetic and molecular events in adenoma and well-differentiated thyroid follicular-cell neoplasia. Cancer Genet. Cytogenet. 2010, 203, 21–29. [Google Scholar] [CrossRef] [PubMed]
- Lee, J.H.; Lee, E.S.; Kim, Y.S.; Won, N.H.; Chae, Y.S. BRAF mutation and AKAP9 expression in sporadic papillary thyroid carcinomas. Pathology 2006, 38, 201–204. [Google Scholar] [CrossRef]
- Naren, A.P.; Cobb, B.; Li, C.; Roy, K.; Nelson, D.; Heda, G.D.; Liao, J.; Kirk, K.L.; Sorscher, E.J.; Hanrahan, J.; et al. A macromolecular complex of beta 2 adrenergic receptor, CFTR, and ezrin/radixin/moesin-binding phosphoprotein 50 is regulated by PKA. Proc. Natl. Acad. Sci. USA 2003, 100, 342–346. [Google Scholar] [CrossRef]
- Jolly, M.K.; Ward, C.; Eapen, M.S.; Myers, S.; Hallgren, O.; Levine, H.; Sohal, S.S. Epithelial-mesenchymal transition, a spectrum of states: Role in lung development, homeostasis, and disease. Dev. Dyn. 2018, 247, 346–358. [Google Scholar] [CrossRef]


| Antibody | Dilution | Company |
|---|---|---|
| Anti-E-cadherin | Western blotting, 1:1000 Immunofluorescence, 1:100 | BD Biosciences |
| Anti-ZO-1 | Immunofluorescence, 1:100 | Invitrogen |
| Anti-type I collagen-UNLB | Western blotting, 1:1000 Immunofluorescence, 1:20; | SouthernBiotech |
| Anti-α-SMA | Western blotting, 1:1000 | Sigma |
| Anti-Fibronectin | Western blotting, 1:1000 | Santa Cruz Biotechnology |
| Anti-Ezrin | Western blotting, 1:500 | Abcam |
| Anti-AKAP95 | Western blotting, 1:500 | Santa Cruz Biotechnology |
| Anti-Yotiao (Anti-AKAP9) | Immunofluorescence, 1:50 Western Blotting,1:1000 | BD Biosciences Novus Biologicals |
| Anti-p-Smad2 | Western blotting, 1:1000 | Cell Signaling Technology |
| Anti-p-Smad3 | Western blotting, 1:1000 | Cell Signaling Technology |
| Anti-total Smad2/3 | Western blotting, 1:3000 | Santa Cruz Biotechnology |
| Anti-GAPDH Anti-p-PKA Anti-α-Tubulin | Western blotting, 1:10,000 Western Blotting, 1:1000 Western Blotting, 1:3000 | Sigma Cell Signaling Technology Sigma |
| Primers | Species | Forward Sequence 5′ to 3′ | Reverse Sequence 5′ to 3′ |
|---|---|---|---|
| 18s | Homo sap. | CGCCGCTAGAGGTGAAATTC | TTGGCAAATGCTTTCGCTC |
| SDHA | Homo sap. | GGGAAGACTACAAGGTGCGG | CTCCAGTGCTCCTCAAAGGG |
| RPL13A | Homo sap. | ACCGCCCTACGACAAGAAAA | GCTGTCACTGCCTGGTACTT |
| E-cadherin | Homo sap. | TGCCCAGAAAATGAAAAAGG | GTGTATGTGGCAATGCGTTC |
| Collagen 1α1 | Homo sap. | AGCCAGCAGATCGAGAACAT | TCTTGTCCTTGGGGTTCTTG |
| AKAP1 | Homo sap. | CCAGTGCAGGAGGAAGAGTATG | CTCCCTCGACACCTCTATCCT |
| AKAP5 | Homo sap. | GACGCCCTACGTTGATCT | GAAATGCCCAGTTTCTCTATG |
| AKAP11 | Homo sap. | CCGGGCTAGTTCTGAATGGG | TGCTCCGACTTCACATCCAC |
| AKAP12 | Homo sap. | CAAGCACAGGAGGAGTTACAG | CTGGTCTTCCAAACAGACAATG |
| AKAP95 | Homo sap. | ATGCACCGACAATTCCGACT | CATAGGACTCGAACGGCTGG |
| Yotiao | Homo sap. | AACCTGAAGATGTGCCTCCTG | CTGGAGTGCATACCTTTC |
| Ezrin | Homo sap. | GCTTTTTGATCAGGTGGTAAAGACT | TCCACATAGTGGAGGCCAAAGT |
| Snail | Homo sap. | ACCACTATGCCGCGCTCTT | GGTCGTAGGGCTGCTGGAA |
| Slug | Homo sap. | TGTTGCAGTGAGGGCAAGAA | GAGCCTGGTTGCTTCAAGGA |
| TGF-β1 | Homo sap. | GGGACTATCCACCTGCAAGA | CCTCCTTGGCGTAGTAGTCG |
| Treatment | E-cadherin | n | Treatment | Collagen Ӏ | n | ||
|---|---|---|---|---|---|---|---|
| −TGF-β1 | +TGF-β1 | −TGF-β1 | +TGF-β1 | ||||
| siControl | 1.00 ± 0.00 | 0.35 ± 0.04 | 6 | siControl | 0.28 ± 0.06 | 1.00 ± 0.00 | 6 |
| siEzrin | 0.40 ± 0.05 | 0.14 ± 0.02 | 6 | siEzrin | 0.16 ± 0.03 | 0.58 ± 0.09 | 6 |
| siAKAP95 | 0.63 ± 0.13 | 0.19 ± 0.05 | 6 | siAKAP95 | 0.20 ± 0.05 | 0.58 ± 0.07 | 6 |
| siYotiao | 1.37 ± 0.53 | 0.25 ± 0.06 | 4 | siYotiao | 0.15 ± 0.02 | 0.56 ± 0.04 | 4 |
| siControl | 1.00 ± 0.00 | 0.40 ± 0.08 | 5 | siControl | 0.08 ± 0.03 | 1.00 ± 0.00 | 5 |
| siMultiple | 0.21 ± 0.06 | 0.11 ± 0.05 | 5 | siMultiple | 0.04 ± 0.01 | 0.25 ± 0.06 | 5 |
| Control | 1.00 ± 0.00 | 0.13 ± 0.02 | 3 | Control | 0.26 ± 0.08 | 1.00 ± 0.00 | 3 |
| st-Ht31 | 0.43 ± 0.04 | 0.06 ± 0.02 | 3 | st-Ht31 | 0.23 ± 0.06 | 0.66 ± 0.03 | 3 |
| Treatment | Collagen Ӏ | |||||
|---|---|---|---|---|---|---|
| Control | siControl | siMultiple | ||||
| −TGF-β1 | +TGF-β1 | −TGF-β1 | +TGF-β1 | −TGF-β1 | +TGF-β1 | |
| Control | 0.18 ± 0.04 | 1.00 ± 0.00 | ||||
| Fenoterol 10 μM | 0.23 ± 0.07 | 0.71 ± 0.06 | ||||
| Rolipram 10 μM | 0.11 ± 0.03 | 0.68 ± 0.09 | ||||
| Cilostamide 10 μM | 0.11 ± 0.03 | 0.59 ± 0.10 | ||||
| 0.08 ± 0.03 | 1.00 ± 0.00 | 0.04 ± 0.01 | 0.25 ± 0.06 | |||
| Control | 0.16 ± 0.09 | 1.00 ± 0.00 | 0.09 ± 0.02 | 0.54 ± 0.09 | ||
| Fenoterol 10 μM | 0.08 ± 0.02 | 0.75 ± 0.08 | 0.07 ± 0.03 | 0.25 ± 0.08 | ||
| Control | 0.02 ± 0.06 | 1.00 ± 0.00 | 0.04 ± 0.02 | 0.59 ± 0.08 | ||
| Rolipram 10 μM | 0.08 ± 0.05 | 0.76 ± 0.05 | 0.05 ± 0.01 | 0.75 ± 0.22 | ||
| Control | 0.04 ± 0.01 | 1.00 ± 0.00 | 0.05 ± 0.02 | 0.55 ± 0.13 | ||
| Cilostamide 10 μM | 0.03 ± 0.01 | 0.86 ± 0.29 | 0.02 ± 0.01 | 0.72 ± 0.23 | ||
© 2020 by the authors. Licensee MDPI, Basel, Switzerland. This article is an open access article distributed under the terms and conditions of the Creative Commons Attribution (CC BY) license (http://creativecommons.org/licenses/by/4.0/).
Share and Cite
Zuo, H.; Trombetta-Lima, M.; Heijink, I.H.; van der Veen, C.H.T.J.; Hesse, L.; Faber, K.N.; Poppinga, W.J.; Maarsingh, H.; Nikolaev, V.O.; Schmidt, M. A-Kinase Anchoring Proteins Diminish TGF-β1/Cigarette Smoke-Induced Epithelial-To-Mesenchymal Transition. Cells 2020, 9, 356. https://doi.org/10.3390/cells9020356
Zuo H, Trombetta-Lima M, Heijink IH, van der Veen CHTJ, Hesse L, Faber KN, Poppinga WJ, Maarsingh H, Nikolaev VO, Schmidt M. A-Kinase Anchoring Proteins Diminish TGF-β1/Cigarette Smoke-Induced Epithelial-To-Mesenchymal Transition. Cells. 2020; 9(2):356. https://doi.org/10.3390/cells9020356
Chicago/Turabian StyleZuo, Haoxiao, Marina Trombetta-Lima, Irene H. Heijink, Christina H. T. J. van der Veen, Laura Hesse, Klaas Nico Faber, Wilfred J. Poppinga, Harm Maarsingh, Viacheslav O. Nikolaev, and Martina Schmidt. 2020. "A-Kinase Anchoring Proteins Diminish TGF-β1/Cigarette Smoke-Induced Epithelial-To-Mesenchymal Transition" Cells 9, no. 2: 356. https://doi.org/10.3390/cells9020356
APA StyleZuo, H., Trombetta-Lima, M., Heijink, I. H., van der Veen, C. H. T. J., Hesse, L., Faber, K. N., Poppinga, W. J., Maarsingh, H., Nikolaev, V. O., & Schmidt, M. (2020). A-Kinase Anchoring Proteins Diminish TGF-β1/Cigarette Smoke-Induced Epithelial-To-Mesenchymal Transition. Cells, 9(2), 356. https://doi.org/10.3390/cells9020356