Quantitative Connection between Cell Size and Growth Rate by Phospholipid Metabolism


1
School of Physical Sciences, University of Chinese Academy of Sciences, Beijing 100049, China
2
CAS Key Laboratory of Theoretical Physics, Institute of Theoretical Physics, Chinese Academy of Sciences, Beijing 100190, China
*
Author to whom correspondence should be addressed.
Cells 2020, 9(2), 391; https://doi.org/10.3390/cells9020391
Submission received: 9 January 2020
/
Accepted: 4 February 2020
/
Published: 8 February 2020
Abstract
:The processes involved in cell growth are extremely complicated even for a single cell organism such as Escherichia coli, while the relationship between growth rate and cell size is simple. We aimed to reveal the systematic link between them from the aspect of the genome-scale metabolic network. Since the growth rate reflects metabolic rates of bacteria and the cell size relates to phospholipid synthesis, a part of bacterial metabolic networks, we calculated the cell length from the cardiolipin synthesis rate, where the cardiolipin synthesis reaction is able to represent the phospholipid metabolism of Escherichia coli in the exponential growth phase. Combined with the flux balance analysis, it enables us to predict cell length and to examine the quantitative relationship between cell length and growth rate. By simulating bacteria growing in various nutrient media with the flux balance analysis and calculating the corresponding cell length, we found that the increase of the synthesis rate of phospholipid, the cell width, and the protein fraction in membranes caused the increase of cell length with growth rate. Different tendencies of phospholipid synthesis rate changing with growth rate result in different relationships between cell length and growth rate. The effects of gene deletions on cell size and growth rate are also examined. Knocking out the genes, such as tktA, tktB, yqaB, pgm, and cysQ, affects growth rate largely while affecting cell length slightly. Results of this method are in good agreement with experiments.
1. Introduction
Cell size is an important measurable characteristic in the study of bacterial physiology. Since the growth rate is another significant physiological feature, the link between them is worth studying. A significant phenomenon about bacterial growth is that cell volume increases with the growth rate under nutrient limitation [1,2,3]. This relationship, known as Schaechter’s growth law, was discovered 60 years ago [1]. Experiments studying cell size and growth rate were performed with different strains of Escherichia coli under various growth conditions [4,5,6,7,8,9,10,11,12,13]. The Schaechter’s growth law has been reconfirmed at the single-cell level. In addition, two new kinds of relationships have been discovered. One is that cell size is independent of growth rate under translation inhibition [10] and another is cell size decreases with growth rate under LacZ overexpression [10]. Although cell size control and cell growth involve a variety of processes, cell length and growth rate follow a simple relationship. Therefore, the coordination between cell size and growth rate is critical to understand the growth features of bacteria.
Bacterial cells regulate fatty acid synthesis and cell membranes are assembled to form a proper membrane structure [5,14,15]. As the size of cell membrane relating to phospholipid metabolism is sufficient to quantify the cell size, we intended to link cell size to the growth rate from the aspect of the genome-scale metabolic network. Previous works revealed the relationship between them from many aspects [1,5,6,9,11,12,13,14,16,17,18,19,20,21,22,23,23] but did not propose a quantitative model to describe how cell size and growth rate correlate with each other from the aspect of bacterial metabolism. Since the empirical relationship between cell size and growth rate is suitable for different bacterial strains [1,2,3] and mutants [6,9,10,13] whose growth regulations are not exactly the same, the detailed regulation mechanism may be not critical to the correlation between the growth rate and cell size. Regardless of the specific regulations of bacterial growth, the metabolic-balance constraint will establish a relationship between the synthesis rates of materials required for cell membranes and for other parts of cells. It results in the correlation between bacterial cell size and growth rate.
We provided a method to estimate bacterial cell length from the cardiolipin synthesis rate. Considering that phospholipid is a main constituent of the bacterial membranes, we estimated the cell surface area from the phospholipid amount in a cell based on the bacterial envelope structure. The Michaelis–Menten kinetics of the cardiolipin synthesis reaction, which is able to represent all the phospholipid synthesis in the bacterial exponential growth phase, sets another constraint between the amount of phospholipid and the cell surface area. This two constraints set the quantitative relationship between the cell length and the cardiolipin synthesis rate. Combining this method with the relationship between the growth rate and the cardiolipin synthesis rate, we finally obtained a function about the cell length and the growth rate. Two ways were introduced to quantify the relationship between the growth rate and the cardiolipin synthesis rate. One way was the flux balance analysis (FBA) of the genome-scale metabolic network. FBA [24,25,26,27] is a widely used method to predict the growth rate and metabolic reactions rates. It is suitable to analyze metabolic features of a single cell organism growing in the exponential phase and it has been applied to several organisms such as H. influenzae [28,29], S. cerevisiae [30,31], and E. coli [32,33,34,35,36,37,38,39]. FBA provides the relationship among the growth rate and multiple metabolic reactions including the cardiolipin synthesis. Since FBA is also successful in analyzing the effects of gene deletions and drug inhibitions [40,41,42], we analyzed the gene mutants’ effects on cell size and growth rate. Another way was directly using a linear equation to quantify the relationship between the growth rate and the cardiolipin synthesis rate. By changing the linear coefficient of this equation, we had the different relationship between the cell length and the growth rate and predicted that cell length can decrease or be unchanged as growth rate increases.
2. Materials and Methods
2.1. Cell Surface Area Connected to the Amount of Phosphatidylglycerol
Based on the envelope structure of gram-negative bacteria, the cell surface area of Escherichia coli is a function of the amount of phospholipid. The envelope of Escherichia coli mainly has three layers: inner membrane, periplasm, and outer membrane [2,43,44,45,46,47,48]. Both inner membrane and outer membrane take a phospholipid bilayer as the skeleton. A layer of lipopolysaccharide covers the outer membrane and a peptidoglycan layer exists in the periplasmic zone. Various enzymes and molecular machines are inserted into or covered on the inner and outer membrane [45,49,50]. As both inner membrane and outer membranes are mainly composed of a phospholipid bilayer with embedded proteins [44,45,50,51,52,53], the surface area of a bacterial cell is divided into two parts. One is the area covered by two phospholipid bilayers, and the other is the area covered by proteins embedded in the membranes. This is written as
Here, denotes the surface area of a bacterial cell. is the surface area covered by phospholipid in membranes of a cell, and is the surface area covered by embedded proteins in membranes of a cell, drawn as Figure 1A. Using fl representing the fraction area of phospholipid in membranes, we had
Here, nlipid denotes the amount of phospholipid in two layers of membranes in a cell in unit of mol. NA is the Avogadro constant in unit of mol−1. The factor derives from two parts. One is that each cell of Escherichia coli has two layers of membranes, and the other is that each membrane is a lipid bilayer. The cartoon is shown as Figure 1A.
Since cell polar caps are relatively unchanged [55,56] and new cell caps are formed in the middle of the cell during division period [57], the phospholipid in membranes is classified into two parts: one part is the lipid in the cell side surface and the other part is the lipid in cell caps. The idealized shape of E. coli used in this work is a right circular cylinder with two hemispherical polar caps, shown as Figure 1A. The cell side surface () refers to the lateral area of the right circular cylinder, shown as the gray area in Figure 1A, and the cell caps () are the hemispherical polar caps shown as the purple area in Figure 1A. Thus, the amount of phospholipid in membranes () is the amount of phospholipid in cell side area () plus the amount of phospholipid in cell caps area (), written as:
Since a bacterial cell has two semisphere caps at the beginning of a cell cycle and has four semisphere caps at the end of a cell cycle [55,56], the average value of during a cell cycle is about the phospholipid in times semisphere caps. is average number of semispheres during a cell cycle. Thus, we had
In order to estimate the amount of all kinds of phospholipid in a bacterial cell from the amount of phosphatidylglycerol (abbreviated as PG), we introduced the factor fPG as the ratio of the amount of PG in cell side surface to all phospholipid in cell side surface. We assumed fPG was equal to the ratio of the amount of PG to lipid in bacterial cells, which is about 18% [35,58]. The amount of PG in cell side surface is denoted as nPG. Then we had
Because
Equation (7) was rewritten as
an equation about cell length (L), cell width (D), and the amount of PG (nPG).
2.2. Estimation of Phosphatidylglycerol Amount from the Kinetics of the Cardiolipin Biosynthesis Reaction
Based on the kinetics of an enzyme-catalyzed reaction, the reaction rate is a function of the reactant concentration and the enzyme concentration. To obtain the PG concentration, we selected the cardiolipin biosynthesis reaction catalyzed by the cardiolipin synthase clsA [59,60,61,62,63], because the products of the cardiolipin biosynthesis reaction [61,64] are also a kind of major phospholipid in cell membranes. During a cell cycle, cardiolipin must be produced, and Escherichia coli in the exponential growth phase synthesizes the cardiolipin due to the activity of clsA [65,66,67,68]. The cardiolipin biosynthesis reaction occurs in the inner membrane and the phospholipid of the outer membrane is transported from the inner membrane [45,49,50,52]. According to the Michaelis–Menten kinetics, this reaction is written as
where , , and are the rate constants. This reaction is abbreviated as CLPNS in this work.
According to the law of mass action, the reactions rates are written as
where [X], the concentration of X, is the amount of X per area in unit of . This is beacause CLPNS takes place at the inner membrane [45,49,50,52]. X stands for any substances such as PG and clsA. Because , when the concentration of clsA did not change, we had
Inserting Equations (13)–(15) into Equation (16), we had
where rCLPNS is the reaction rate of CLPNS, PG is the concentration of PG, and Vmax and KM are two kinetic parameters. Because the unit of rCLPNS in Equation (15) is , a unit transformation was done to have the unit consistent with that in FBA where the unit of rCLPNS is (Detail information is written in Appendix A.3). KM is about [62] and Vmax is about 0.38 mmol/(gDW·h) in BW25113 [62,69].
Inserting to Equation (17), we had
where nPG is the amount of clsA in cell side surface of a cell and sside is the side surface area of a cell. As , Equation (18) was rewritten as
an equation about L, D, nPG and rCLPNS.
From Equation (5), Equation (11) and Equation (19), we had an equation about L, n0, and rCLPNS, written as
Then, we can estimate the cell length (L) from the cardiolipin synthesis rate (rCLPNS).
2.3. Introducing the Relationship between Growth Rate and Cardiolipin Synthesis Rate
2.3.1. Cell Length Estimation Based on FBA
As flux balance analysis is efficient to simulate the metabolic rates and the growth rate of bacteria in the exponential growth phase (when metabolic reactions was assumed to be at the steady state, and the detailed description of the system was in Appendix A.1), we integrated flux balance analysis with Equation (20) to obtain the relationship between cell length and growth rate. FBA [1,32,35] is represented as
is a vector of reactions rates in unit of . rbiomass equals to the growth rate. is a stoichiometric matrix, whose element Sij is the stoichiometry of the metabolite i in the reaction j in the metabolic network of the system. is the lower bounds vector, and is the upper bounds vector. Each set of bounds of exchange reactions corresponds to a nutrient medium. By setting different bounds of exchange reactions, we simulated the growth rate and metabolic reactions’ rates including rCLPNS of Escherichia coli growing in different nutrient conditions. Detail description of FBA was written in Appendix A.2. Combining FBA with Equation (20), we are able to examine the effects of nutrient limitation and gene deletions on cell length and growth rate. We called this method the size estimation based on flux balance analysis (SEFBA).
Previous study [70] found that the fraction of protein in cell membranes increases with growth rate and finally reaches to a maximum value. The transport reactions of cells are classified into two groups which are the facilitated diffusion (rfac) and the simple diffusion (rsim). The ratio of facilitated diffusion rate (rfac) to all the transport reactions’ rates (rfac+rsim) follows a similar tendency with the fraction of protein in membranes changing with growth rate (shown as Figure A8). In order to introduce the factor that fl changes with growth rate, we assumed that the ratio of the surface area covered by protein to the surface area covered by phospholipid in membranes was in proportion to the ratio of facilitated diffusion rate (rfac) to simple diffusion rate (rsim), written as
This assumption was made because the facilitated diffusion incorporates with membrane proteins to transport substances while simple diffusion depends on the concentration gradient and the membrane area covered by phospholipid. Only small molecules like carbon dioxide, oxygen, and water transport by simple diffusion [54]. The concentrations of oxygen and carbon dioxide in chemostat culture do not change in this work, so the simple diffusion rate is in proportion to the membrane area covered by phospholipid. As for facilitated diffusion, Michaelis–Menten kinetics is able to describe it [71]. When substance concentration is at high value, the facilitated diffusion mainly depends on protein amount in membrane. In other words, the facilitated diffusion rate is approximately in proportion to the membrane area covered by protein at high substance concentration. Thus, we had the Equation (24) where is a coefficient. Under this assumption, we had
rfac and rsim were obtained from the results of FBA. The mass fraction of protein to phospholipid in membranes has a maximum value to maintain the structure of membranes, which is about 2.5 (wt/wt) [54,72]. It implies that fl is larger than 4/9. Because 97% values of obtained from the simulations of iJR904 is smaller than 2.5, the parameter is estimated to be about 0.5 for iJR904 [35]. Similarly, is about 0.22 for iJO1366 [32]. When the cardiolipin synthesis rate is small enough, cell length changes slightly with fl. The influence of fl on cell size is enhanced with increased synthesis rate of cardiolipin (shown as Figure A9).
To summarize, the final representation of SEFBA is written as:
2.3.2. The Reduced Model of SEFBA
To obtain an explicit relationship between growth rate and cell length, we directly introduced the relationship between the cardiolipin biosynthesis rate and the growth rate with a linear equation instead of the results of FBA. The cardiolipin biosynthesis rate is assumed to change linearly with the growth rate, written as
Here, wCLPNS and v0 are coefficients in this linear equation. wCLPNS represents the correlation between and growth rate . When the reactions’ bound vectors, and , are in a certain range, and are constant. Furthermore, when cells grow with the same bottleneck processes, the values of and are constant. In other words, the relationship between and growth rate does not change when bacteria grow with the same limitations. This equation is suitable among a range of growth rates. Theoretically, wCLPNS can be negative while v0 is positive during a certain range of growth rates.
Here, , which is derived from the reaction rate constant KM. Previous study [70] showed that the protein occupancy in membrane almost does not change when growth rate is faster than 0.3 h−1. It is reasonable to assume fl constant. Then, C is a constant parameter. , and . Both H and E are related to coefficients wCLPNS and v0. D stands for the cell width. This equation describes the quantitative relationship among cell length, cell width, phospholipid synthesis, and phospholipid occupancy in membranes. All the parameters used in this work are summarized in Table 1.
3. Results
3.1. Extracting Cell Size from the Metabolic Mode
Cell size is associated with the structure of the cell envelope. As for gram-negative bacteria such as Escherichia coli, the envelope has two layers of cell membranes. Because the skeleton of cell membranes is phospholipid, cell size depends on the amount of phospholipid. As phosphatidylglycerol takes about 18% of the entire phospholipid in Escherichia coli [35,58], it sets the geometric constraint among the phospholipid amount, cell length, and cell width (shown as Figure 1B and Section 2.1). The amount of phosphatidylglycerol is also related to phosphatidylglycerol metabolism. The kinetics of the catalytic reaction of cardiolipin biosynthesis determine the relationship between the reaction rate and the phosphatidylglycerol concentration, thus setting another constraint among the amount of phospholipid, cardiolipin synthesis rate, cell length, and cell width (shown as Figure 1B and Section 2.2). Combining these two constraints, we obtained a function of the cardiolipin synthesis rate, cell width, and cell length (shown as Figure 1B and Equation (20)). Since cardiolipin biosynthesis is part of the metabolic network, the metabolic balance and bacterial growth strategy relate cardiolipin synthesis rate to the whole metabolic network. Based on the flux balance analysis, the genome-scale metabolic model gives the relationships between growth rate and metabolic reaction rates (shown as Section 2.3.1). Integrating the function of cell length and cardiolipin biosynthesis with the relationship between phospholipid metabolism and growth rate, we quantitatively connected cell length with growth rate by metabolic network.
This method enables us to calculate cell length based on cardiolipin synthesis kinetics and the genome-scale metabolic networks, which is different from previous research. Previous models about metabolic networks and flux balance analysis studied the distribution of metabolic reactions and the effects of growth strategies [75], solvent capacity [76], cell volume constraints [27], and cell surface area constraints [39] on global metabolic reactions. Although the influence of phospholipid metabolism on cell size was studied by experiments [14], a quantitative model has not illustrated it.
3.2. Coordination between the Growth Rate and Cell Length
Different nutrient concentrations in culture media lead to different nutrient transport rates (Equation (2) in research [77], shown as Figure 1C). Nutrient transport reactions, classified into simple diffusion and facilitated diffusion, are the processes in which nutrients in the culture medium transport in or out of cells. When the system is at a steady state, nutrient transport rates are equal to nutrient exchange rates (Appendix A.1 Description of the system). Nutrient exchange reactions are the processes by which nutrients are added in or expelled from the chemostat. In a chemostat culture system, the nutrient exchange rate is determined by the nutrient concentration in culture media, which controls metabolic reaction rates and the growth rate. Thus, we control the nutrient exchange rates to simulate bacterial metabolic features in various culture media. For example, we set the bounds of nutrient exchange rates to correspond to the M9 minimal medium (a kind of culture medium, same to [73]) with glucose as the single carbon source, then changed the glucose exchange rate from 0 to 30 mmol/gDW/h. The results of FBA show that growth rate increases with glucose exchange rate (shown as Figure 1D) and that cardiolipin biosynthesis rate increases linearly with the growth rate (shown as Figure 1E). Equation (20) depicts the relationship between cardiolipin synthesis rate and cell length (shown as Figure 1F). Finally, cell length is a function of the growth rate. SEFBA demonstrates that lipid biosynthesis links cell size with growth rate (Figure 1D–F), which describes how cell length varies with the growth rate under multiple nutrient limitations. To validate the SEFBA model, we compared it with experimental data [6,9,13] of four bacterial strains. The bounds of exchange reactions in FBA correspond to the availability of nutrients in growth media [35]. Each series of bounds corresponds to a group of growth culture media which had the same nutrient components. We used 20 series of bounds (written in Table S1) to simulate the metabolic states of Escherichia coli in different culture media [6,25,73,74,78]. Altering the maximum rates of bottleneck carbon-source exchange reactions from 0 to 30 mmol/(gDW·h), we obtained 20 series of SEFBA results. Figure 2 compares the results of SEFBA with experimental data.
The solid lines in Figure 2 with different colors correspond to 20 culture media. They are not exactly the same but have a similar tendency, which is consistent with the empirical relationship that the cell size is larger at faster growth rate. Furthermore, it indicates that the tendency of cell length with growth rate does not strongly depend on culture media.
The bias of SEFBA may come from two main reasons. One reason is that the constraints of FBA are off the real condition. For example, neglecting the complicated genetic regulation mechanism results in the losses of coordination among reactions. Another reason is the thermodynamic constraints of reactions [79,80]. The metabolic reactions network has reaction loops [32,35]. This may lead to the large reaction rates in the results of FBA.
3.3. Influence of Phospholipid Synthesis and Cell Width on Cell Length
Cell length can be classified into two parts according to membrane formation. One part is the length occupied by cell caps which are formed in the middle of the cell, and another part is the length of cell side surface which extends by adding phospholipid and protein into cell membranes [44,81]. Cell width depends on n0 the average amount of phospholipid in cell caps during a cell cycle and fl the fraction area of phospholipid in cell membranes. The length of the cell side surface relates to fl and cardiolipin biosynthesis rate .
Assuming that n0 is constant while fl varies, we had the solid lines in Figure 2. The values of n0 for each of the bacterial strains were estimated from the average value of cell width. The segments and fluctuations in the solid lines in Figure 2 were derived from the alteration of active metabolic reactions which resulted in the variations of the relationship between fl and and the relationship between rCLPNS and . As Figure A3 shows, rCLPNS is almost in proportion to . Thus, the fluctuations of cell length mainly come from the variation of fl (Figure A3).
Assuming fl is constant while n0 varies, we had the black dashed lines in Figure 2. Under nutrient limitation, v0 equals to zero, which means rCLPNS is 0 when is infinitely close to 0. wCLPNS is the slope of rCLPNS changing with . Since the light blue area in Figure 2 stands for the cell length variation caused by the cell width change and the black dashed line represents the cell length variation caused by the change of cell width and rCLPNS, the gray area represents cell length variation derived from phospholipid synthesis. It implies that the influence of phospholipid synthesis on cell length is a little stronger than that of cell width variation in some cases.
To further validate cell width variation with growth rate, we used Equation (5) to fit the experimental data of cell width for each bacterial strain, shown as Figure A4. In Figure A5, the black lines are the cell length calculated under the condition that fl is changing while n0 is constant. The orange lines are the cell length calculated with fl constant and n0 changing. Black lines are close to orange lines. The change of either fl or n0 leads to the change of cell width. This means that cell width does affect cell length, but the source of variation in cell width is not significant.
3.4. Three Forms of Relationship between Cell Length and Growth Rate under Different Stress Conditions
The relationship between cardiolipin synthesis rate and growth rate, obtained by FBA, is not explicit and applies only to the nutrient limitation conditions. To focus on the effects of phospholipid synthesis on growth rate and cell size, we used a linear equation straightforwardly to depict how cardiolipin synthesis rate changes with growth rate and then had the reduced model of SEFBA (Section 2.3.2). Thus, the tendency of cardiolipin synthesis rate varying with growth rate determines how cell length changes with growth rate (Figure 3A). The reduced model of SEFBA was able to study the relationship between cell size and growth rate under various stresses (Figure 3B). The different relationship between rCLPNS and growth rate results in the alteration of the relationship between cell length and growth rate. As Figure 3A shows, stresses in Escherichia coli can be classified into three groups according to the tendency that cell length changes with the growth rate.
With cell width unchanged, cell length will not change with the growth rate if wCLPNS is zero. If a factor affects growth rate but not division process and phospholipid synthesis rate, cell length will be independent of the growth rate under the regulation of this factor. Previous research [10] shows that when translation processes were inhibited by different amounts of chloramphenicol, bacterial size was almost constant while the growth rate changed. This implies that cardiolipin synthesis rate rCLPNS is independent of the growth rate under translation inhibition.
Another classification is that cell length decreases with the growth rate. It occurs when wCLPNS is negative, which happens when a factor inhibits cell growth but accelerates phospholipid synthesis. Previous studies [10] showed that LacZ overexpression results in reduced growth rate and increased cell length. It implies that rCLPNS negatively correlated with the growth rate with lacZ overexpression. Under lacZ overexpression stress, protein allocation strategy is different from that under nutrient limitation, which can cause different metabolic reaction distribution. When LacZ is overexpressed, bacteria may be forced to express more protein, so more phospholipid is needed to enlarge cell volume without lysis. This leads to negative correlation between rCLPNS with growth rate.
The last classification is that cell size increases with the growth rate. One typical example is the nutrient limitation. rCLPNS positively correlates with growth rate.
3.5. Effects of Metabolic Defects on Growth Rate and Cell Length
Impacts of several metabolic gene deletions on cell length and growth rate were researched [13], however, we still lacked a model to predict these effects at a systematic level. With the ability of the genome-scale metabolic model to study gene deletions, we performed flux balance analysis of the metabolic network with genetic defects and calculated cell length to investigate whether cell length showed a positive correlation with growth rate. We did three series of simulations of metabolic gene deletion mutants. Under the influence of metabolic gene deletions, cell length variation correlates to growth rate variation positively (Figure 4A). Knocking out the genes that participate in the phosphate metabolism reduces the growth rate while weakly influencing cell size, such as tktA, tktB, yqaB, pgm, and cysQ. Some mutants without essential genes cannot grow. These mutants are out of consideration. Furthermore, we examined how the oxygen metabolic pathway affects growth rate and cell size. Interestingly, cell length in anaerobic conditions is larger than that in aerobic conditions, while growth rate in anaerobic conditions is smaller than that in aerobic conditions (see Figure A6).
To further examine the SEFBA model, we compared the SEFBA predictions of gene-deletion strains with experiments [4] which studied the influence of several central carbon metabolism genes on cell size and the growth rate. The medium [4] used to culture these nine mutants was Luria-Bertani (LB) broth supplemented with 0.2% glucose. Since the chemical components of LB are unclear, we did SEFBA with 20 kinds of culture media. The bounds of exchange reactions corresponding to these 20 kinds of culture media were written in Table S1. For each kind of reaction bound, we did flux balance analysis with various glucose exchange rates and selected the result whose growth rate was closest to the the experimental value. Then, we predicted the cell length of each mutant in these 20 kinds of culture media. The comparison of SEFBA and experiments was drawn in Figure 4B. The large error bars imply that physiology features of mutants depend on the cultural media. It is reasonable that the metabolic defects caused by a gene deletion may be critical in a cultural medium but less critical in another cultural medium. Thus, the cell size of a mutant changes widely among cultural media. The change directions we predicted for gnd and acnB are not consistent with experiments. The inconsistency may result from several aspects. One is that components of the FBA model used in this work are not fully constrained, such as the solvent capacity constraint [76], protein allocation constraint [26], etc. Another is that the nutrient uptake rates in the Westfall’s experiments [4] are unavailable—the use of the estimated values of nutrient uptake rates instead of experimental values may lead to mispredictions of some mutants.
4. Discussion
This work provides a possible explanation as to why cell size changes differently with growth rate under different kinds of growth stresses from the metabolic aspect. A reason is that the phospholipid metabolic rate changes differently with growth rate under various growth stresses. The uncertainty of parameters in SEFBA among bacterial strains under different growth stresses limits the prediction ability of the model, as well as the reduced model of SEFBA. Despite this, the correlation between growth rate and phospholipid metabolic rate is the key in determining the tendency of cell size changing with growth rate. SEFBA or the reduced model of SEFBA is still able to describe the relationship between cell size and growth rate without considering the detailed regulation processes in cells. It implies the metabolic features are the basis of the correlation between cell size and growth rate.
Unlike previous improved models of FBA [27,39,75,76], our method combined cardiolipin synthesis kinetics with the genome-scale metabolic model to calculate cell length, instead of improving the objective function or the constraints in the flux balance analysis. Thus, this method does not improve the accuracy of metabolic reactions predictions but enables us to predict cell size in various culture media and examine the effects of metabolic modes on cell size. This method accompanied by the conventional FBA is named as SEFBA in this work. It is able to combine with any other improved FBA like FBAwMC [27] and FBAME [39] instead of the conventional FBA. The accuracy of SEFBA may be improved by replacing the FBA part in SEFBA with other improved FBA models. Besides, if more constraints of reactions could be introduced into the metabolic model, we will be able to study the relationships between bacterial cell size and growth rate with other growth limitations.
The cardiolipin biosynthesis reaction used in this work is the reaction that two molecules of phosphatidylglycerol are transferred into a cardiolipin molecule and a glycerol molecule catalyzed by clsA synthase. Both phosphatidylglycerol and cardiolipin are major phospholipids in bacteria [61,64]. Since the mechanism of cardiolipin biosynthesis reaction [60,63] is much simpler than other phospholipid biosynthesis (for example, PG synthesis processes include two kinds of reactions and involve three enzymes which are pgA, pgB, and MsbA [63]), we used cardiolipin biosynthesis reaction to estimate the concentration of phosphatidylglycerol. As the reaction occurs in exponential growth phase and this method also intends to study the cell size feature of Escherichia coli in exponential growth phase, it is suitable to use the cardiolipin biosynthesis reaction to calculate cell size.
SEFBA is not susceptible to the genome-scale metabolic network models. Similar results were obtained with iJR904 and iJO1366 (Figure 2 and Figure A7). Because the transport reactions involved in different metabolic networks are not the same (which results in different simple diffusion rate and facilitated diffusion rate), needs an update to meet the constraint of phospholipid-to-protein ratio in membranes. The other parameters in SEFBA, including KM, Vmax, and n0, are independent of metabolic networks.
Supplementary Materials
The following are available online at https://www.mdpi.com/2073-4409/9/2/391/s1. Table S1: reactions bounds in FBA corresponding to twenty kinds of culture media; Table S2: reactions bounds in FBA for gene-deletion mutants; Table S3: gene deletions and corresponding reactions involved in iJO1366; Table S4: reactions bounds information used to compare bacteria growth in aerobic condition to that in anaerobic condition.
Author Contributions
Conceptualization, Z.Z., Q.Z. and H.S.; Data curation, Z.Z.; Formal analysis, Z.Z.; Funding acquisition, H.S.; Investigation, H.S.; Methodology, Z.Z.; Project administration, H.S.; Resources, H.S.; Software, Z.Z.; Supervision, H.S.; Validation, Z.Z., Q.Z. and S.G.; Visualization, Z.Z.; Writing—original draft, Z.Z.; Writing—review and editing, Z.Z., Q.Z., S.G. and H.S. All authors have read and agreed to the published version of the manuscript.
Funding
The work was supported by the Strategic Priority Program of Chinese Academy of Sciences (Grant No. XDA17010504), National Natural Science Foundation of China (Grants No.11774359 and No. 11947302), and the Interdisciplinary Innovation Team of Chinese Academy of Sciences (Grant No. 2060299).
Conflicts of Interest
The authors declare no conflict of interest. The funders had no role in the design of the study; in the collection, analyses, or interpretation of data; in the writing of the manuscript, or in the decision to publish the results.
Abbreviations
The following abbreviations are used in this manuscript:
| PG | phosphatidylgycerol |
| clsA | cardiolipin synthase A |
| CLPNS | the cardiolipin biosynthesis reaction catalyzed by clsA |
Appendix A. Supplementary Notes
Appendix A.1. Description of the System
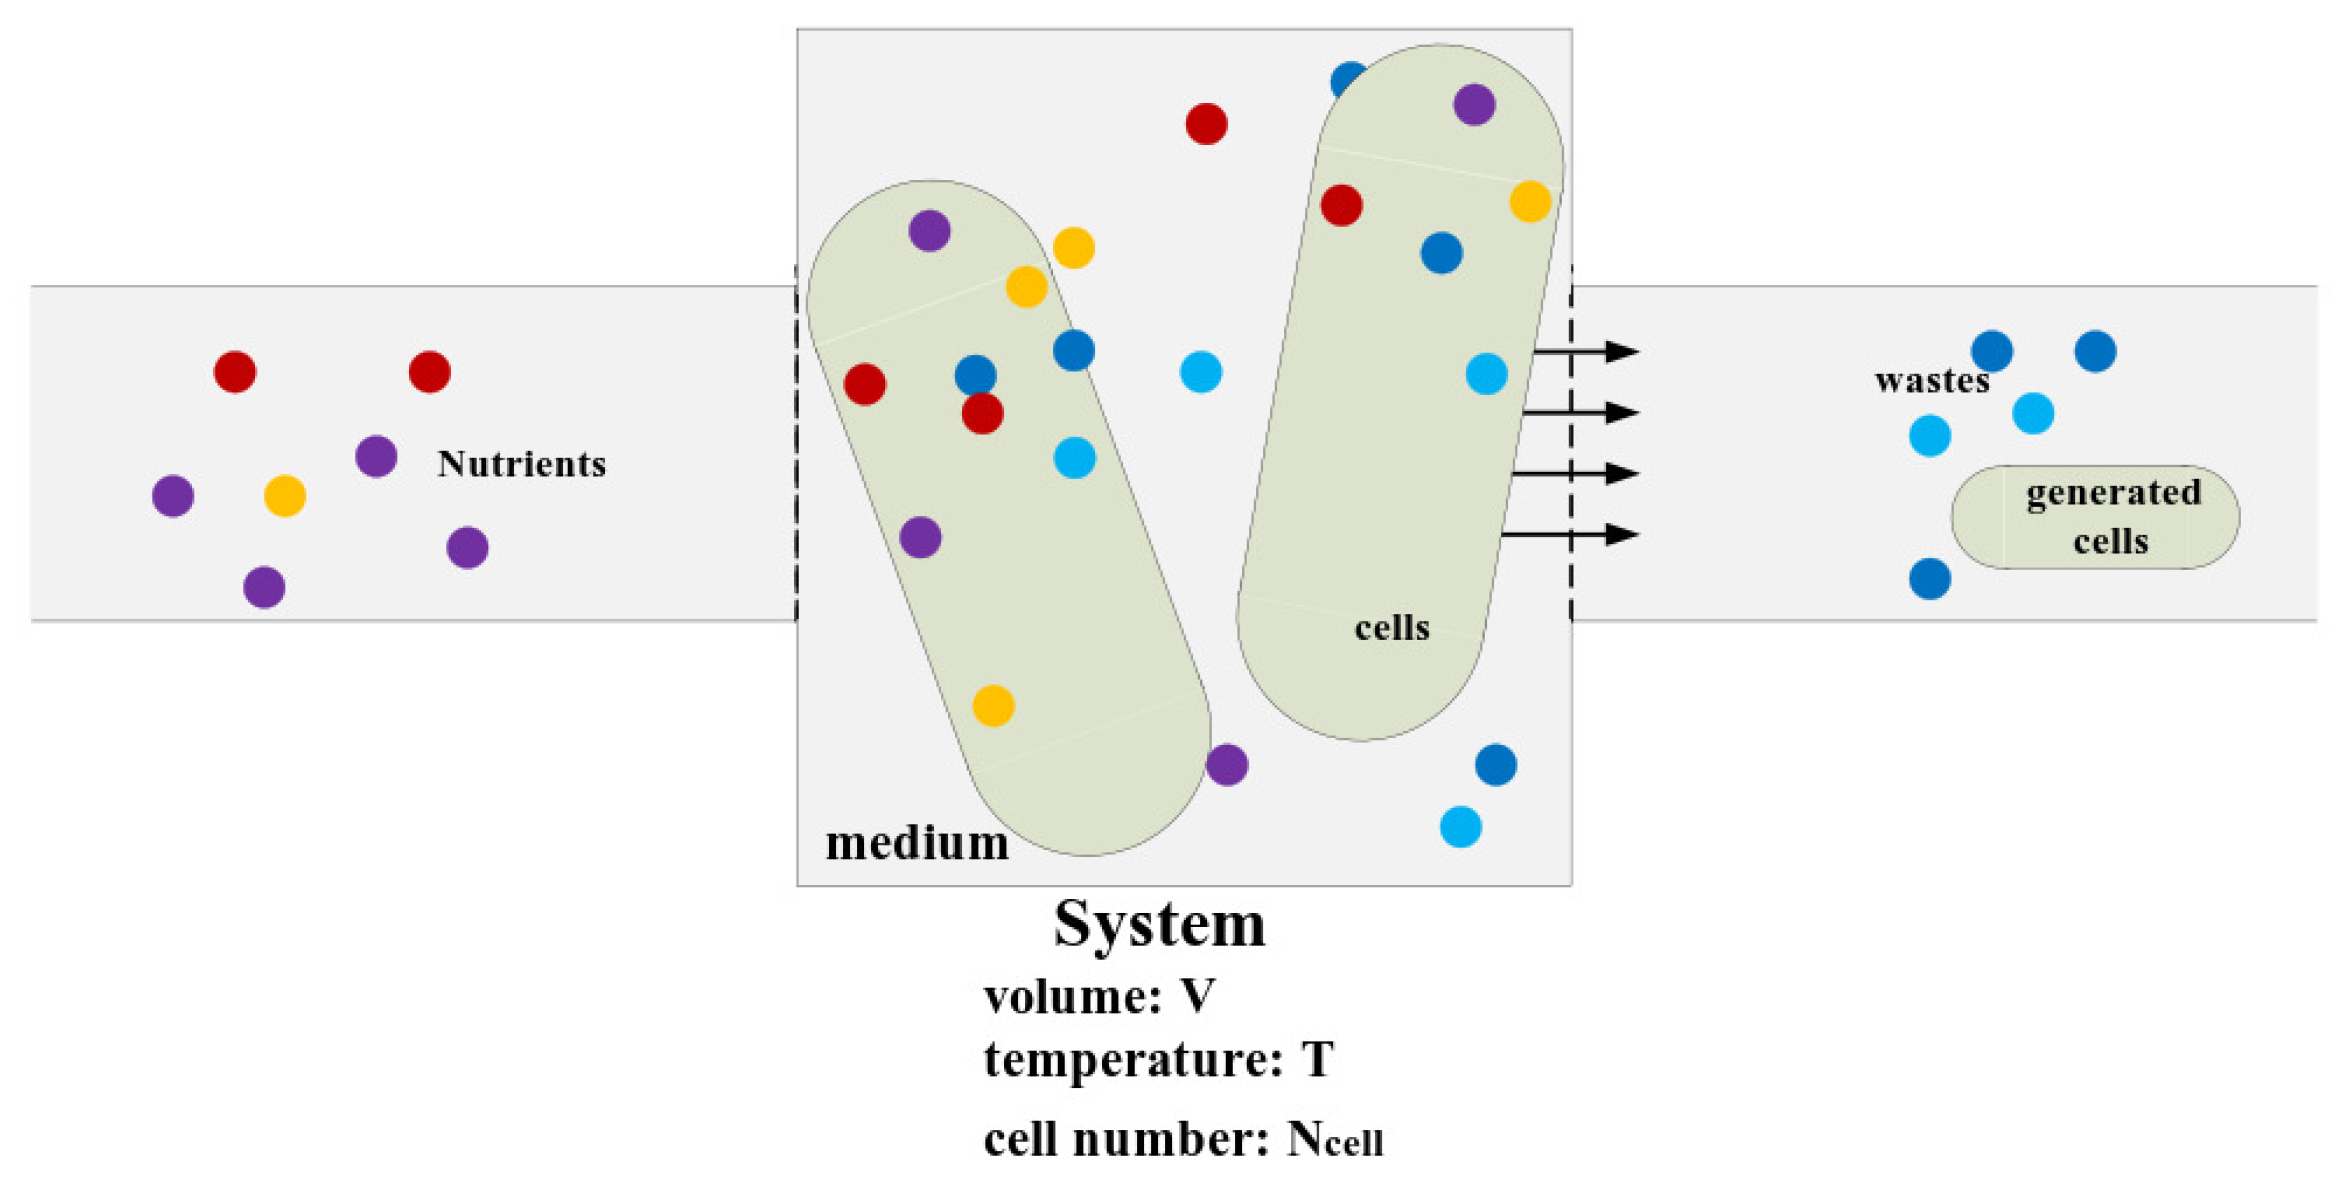
We designed a system first. The system is a cultural container where bacterial cells are cultivated, as Figure A1 shows. The container is full of culture medium. We use several parameters to describe the system’s features. They are the volume of system denoted by V, the temperature of system denoted by T, and the number of cells in the system denoted by . We add fresh culture medium into the system and drain newly generated cells and metabolic wastes off the system to ensure the system is at a steady state. That is, the concentration of components in the system are constant at steady states. The time average of every physiological variable is also constant, such as the average size and dry mass of cells in the system.
Figure A1.
The schematic diagram of the system. The container is full of culture medium. The volume of system is V, the temperature of system is T, and the number of cells in the system is . We add fresh culture medium into the system and drain newly generated cells and metabolic wastes off the system to ensure the system is at a steady state. That is, the concentrations of components in the system are constant at steady states. The time average of every physiological variable is also constant, such as the average size and dry mass of cells in the system.
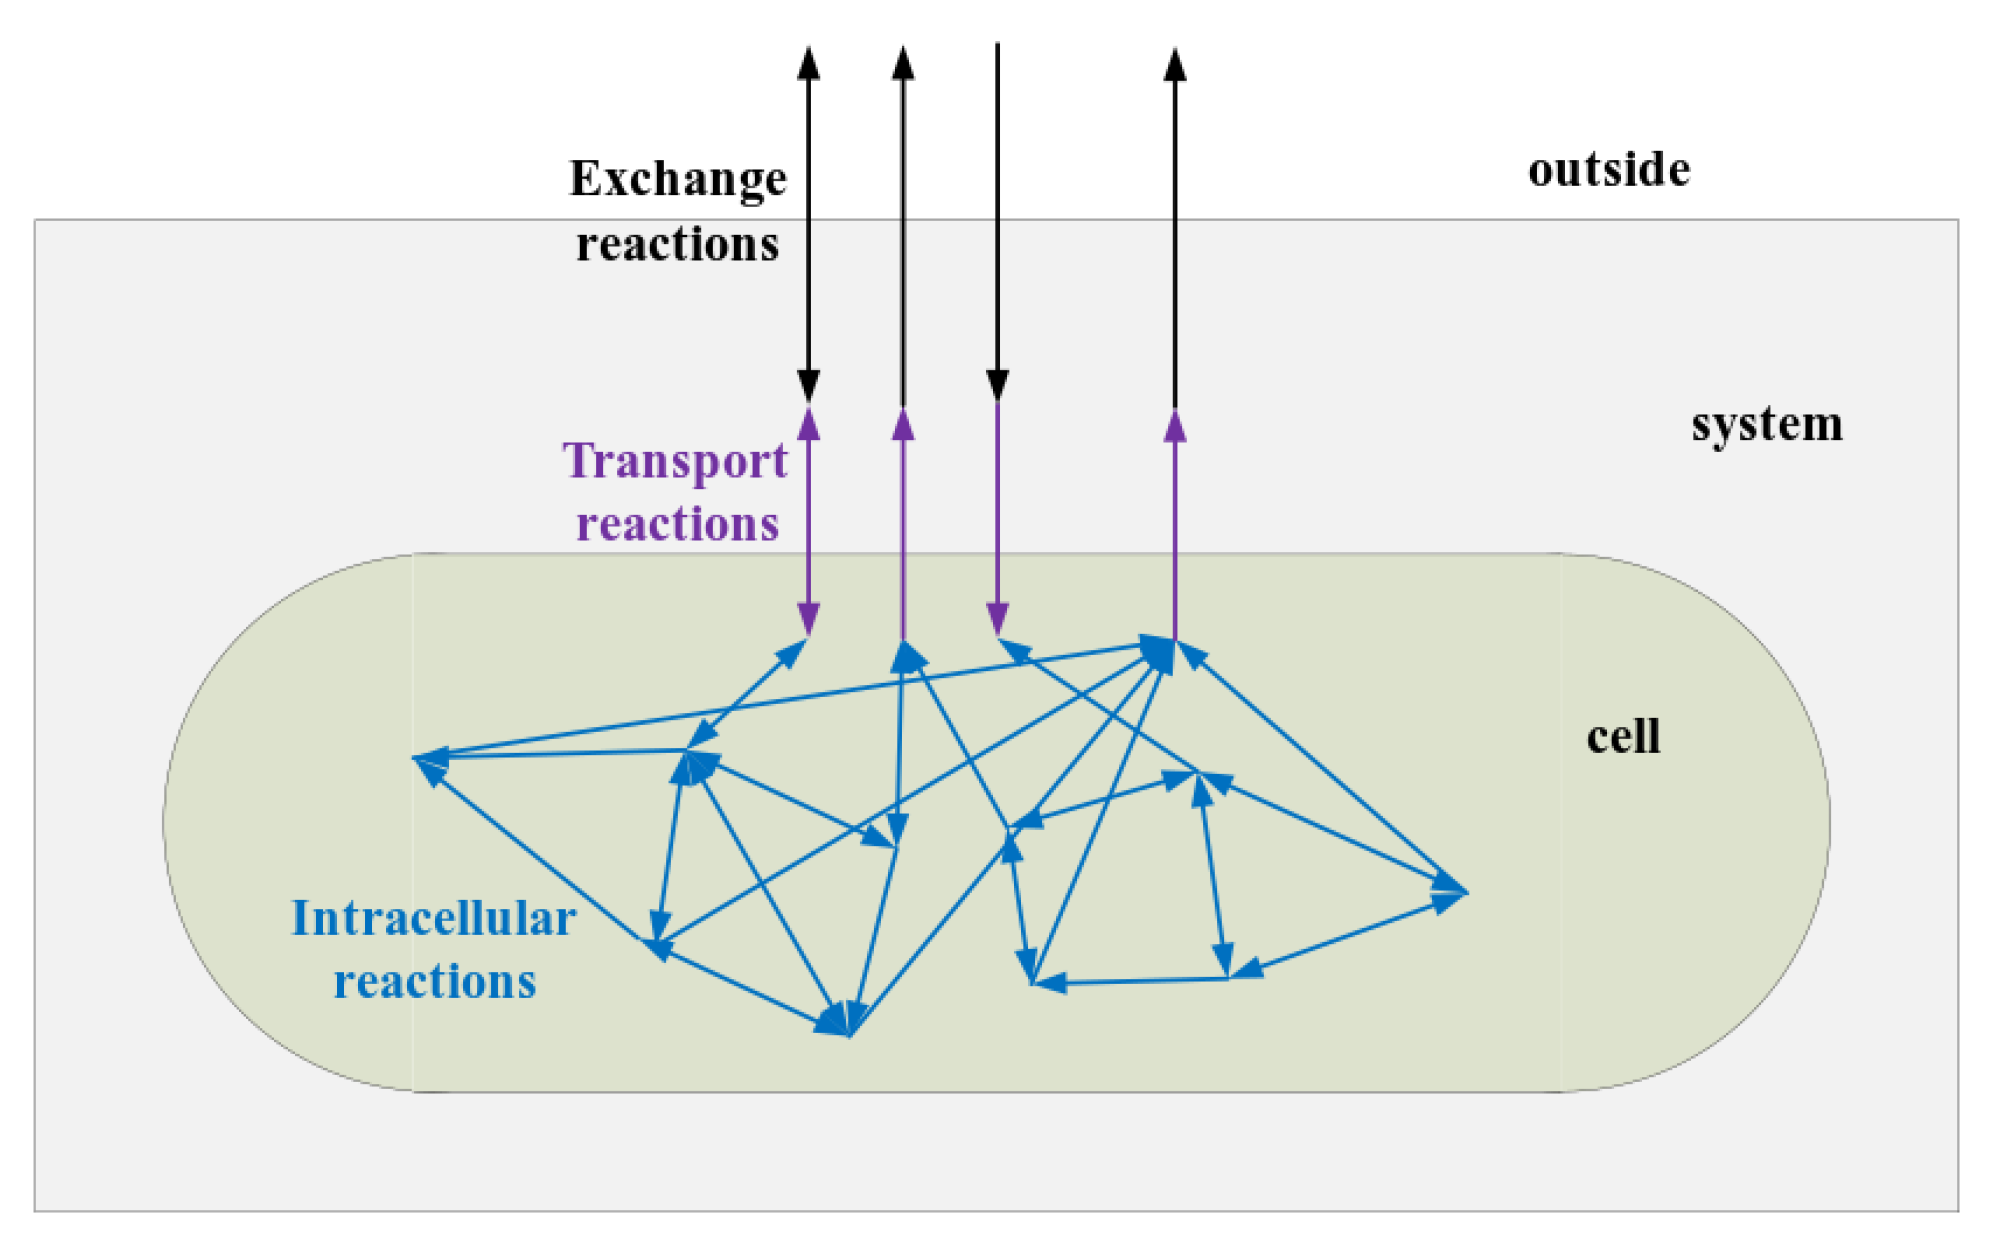
In the system, a variety of processes occur, which can be written in the form of reactions. We classified all reactions in the system into three categories based on their function, as Figure A2 shows. They are exchange reactions including reactions with the function of exchanging nutrients between the system and outside, transport reactions including reactions with the function of transporting molecules in or out the cell, and intracellular reactions including reactions whose reactants and products are all in cells. We treated a kind of molecules in culture medium and the same kind of molecules in cells as different kinds of molecules. The system is taken as a reaction solution where a cluster of reactions occured. The reactions’ rates in this work are actually the average rates of reactions in the entire system space over a cell cycle. We use a vector to stand for reactions rates whose elements is the reaction rate of reaction j occurred in cells in the system.
Figure A2.
The catagories of reactions in the system. Exchange reactions are nutrient exchanges between system and outside. Tranport reactions are nutrient exchanges between cells and medium. Intracellular reactions are reactions whose reactants and products are both in cells.
Figure A2.
The catagories of reactions in the system. Exchange reactions are nutrient exchanges between system and outside. Tranport reactions are nutrient exchanges between cells and medium. Intracellular reactions are reactions whose reactants and products are both in cells.
We considered V, , T, and reaction rates as system parameters.
In exchange reactions, biomass reaction is a special reaction in the system. It is an artificial reaction which represents the processes synthesizing cells and moving the newly generated cells out of the system. We wrote it with two reactions, BR1 and BR2. BR1 is written as
It represents the processes by which biomass precursors are converted into a cell. The biomass precursors include 20 kinds of amino acid, four kinds of ribonucleic acid and four kinds of deoxyribonucleic acid as well as some other essential compounds in cell. stands for a kind of biomass precursor and stands for the fraction of in unit of mmol per gram of dry weight, which means that mmol are needed to produce 1 g dry weight of cells. Thus stands for an artificial molecule and 1 mmol equals to 1 g cells content without water, that is the molar mass of equals to 1000 g/mol, denoted by [82].
BR2 is the exchange reaction that moves the newly synthesized cell out of the system to maintain the system at steady states, shown as
In many cases, BR1 and BR2 are written as a single reaction:
Then, we calculated the reaction rate of biomass reaction denoted by . According to the reaction rate defination, we have
Here, is the molar concentration of cells after dehydration in the system in unit of mol/liter. That is
Here, is the dry mass of a single cell in unit of gram, is the number of cells in the system. The system volume V is in unit of liter. Thus,
is in unit of . Define a system parameter as
Thus,
According to the definition of growth rate that , we had
When the system is at steady states, , the average dry weight of a single cell in a cell cycle, is constant. That is, does not change with time. Thus, cells in the system grow in exponential phase when the system is at steady states. However, will change among steady states. As a consequence, the value of is certain in each steady state, while it alters when the system is at different steady states. The unit of is . Transforming it to same to previous studies [82], we have .
Appendix A.2. Description of Flux Balance Analysis
Flux balance analysis method is suitable to analyze a steady system. Under the assumption that the system described above is at steady state where the concentration of every kind of substance is constant, such as the concentration of the cell and the concentration of nutrients, we use flux balance analysis to study the relationship among reactions. We defined a vector whose element represents the concentration of metabolite i. is a vector of reactions rates whose element represents the reaction rate of reaction j occurred in the system. The unit of is ·h. is a stoichiometric matrix, whose element is the stoichiometry of the metabolite i in the reaction j in the metabolic network of the system. According to the Mass Conservation Law, we have
The concentration of each kind of component in the system is constant at steady states, so
This equation is called mass balance constraint. We introduce another constraint to the system. It is often called as bounds, which defines the ranges of reaction rate. It is written as
and are vectors whose elements and are respectively the lowest and largest values of reaction j among all achievable steady states. That is, the bounds of reactions restrict a space of steady states of the system. The negative value of a exchange reaction of a nutrient means that the nutrient is added into the system, and the positive value means that the nutrient is exhausted out of the system. Each kind of nutrient in medium participates at least two reactions, as Figure A2 shows. One is an exchange reaction, and the others are transport reactions. denotes to the exchange reaction that excrete nutrient i is out of the system, and denotes to the sum of reactions that transport nutrient i into cells. At steady states, the sum of and equals to zero. That is, . If the lower bounds of reaction, , is larger than or equal to zero, the cells in system cannot absorb nutrient i. This means determines the maximum rate at which cells in the system utilize nutrient i. By changing the value of , we can simulate cells growing in different mediums. Different maximum values of are related to the concentration of nutrients i in the system and the concentration of enzymes that catalyze this reaction.
Assuming that the system prefers the state of biomass precursors to produce cells at maximum rate, we use as the objective function. Thus, the flux balance analysis in this work method is written as:
Appendix A.3. Kinetics of Cardiolipin Synthesis Reaction and Unit Transformation
Cardiolipin synthesis reaction can be written as
where , , and denote the rate constants. The phosphatidylglycerol is abbreviated as PG in this work, and the reaction of cardiolipin synthesis catalyzed by clsA is abbreviated herein as CLPNS. r’ with subscripts represent the reaction rates in unit of , for example is the cardiolipin synthesis rate in unit of . According to the law of mass action, the reaction rate is written as
where [X] is the concentration of X meaning amount of X per area in unit of . This is beacause this reaction is taking place at cell membrane. X can be any one of a number of substances such as PG and clsA. Because , when the concentration of clsA does not change, we had
thus we had
As the sum of and is , we had
where and .
To transform the unit of from to , we had
where is the amount of clsA per cell in unit of mol, . The difference between r’ and r with same subscript is the unit.
Appendix B. Supplementary Figures
Figure A3.
Relationships among growth rate, cell length, cardiolipin synthesis rate, and fraction area of phospholipid in membranes. The purple solid lines are the cardiolipin synthesis rate changing with the growth rate. As the sub-figure shows, the cardiolipin synthesis rate is nearly proportional to the growth rate in all culture media, except for the media containing kinds of amino acid. The blue solid lines represent the fraction area of the phospholipid in cell membranes. As growth rate increases, fl does not change smoothly at some points; it is the same for . Data in each sub-figure is from a series of simulations corresponding to the same kind of culture media.
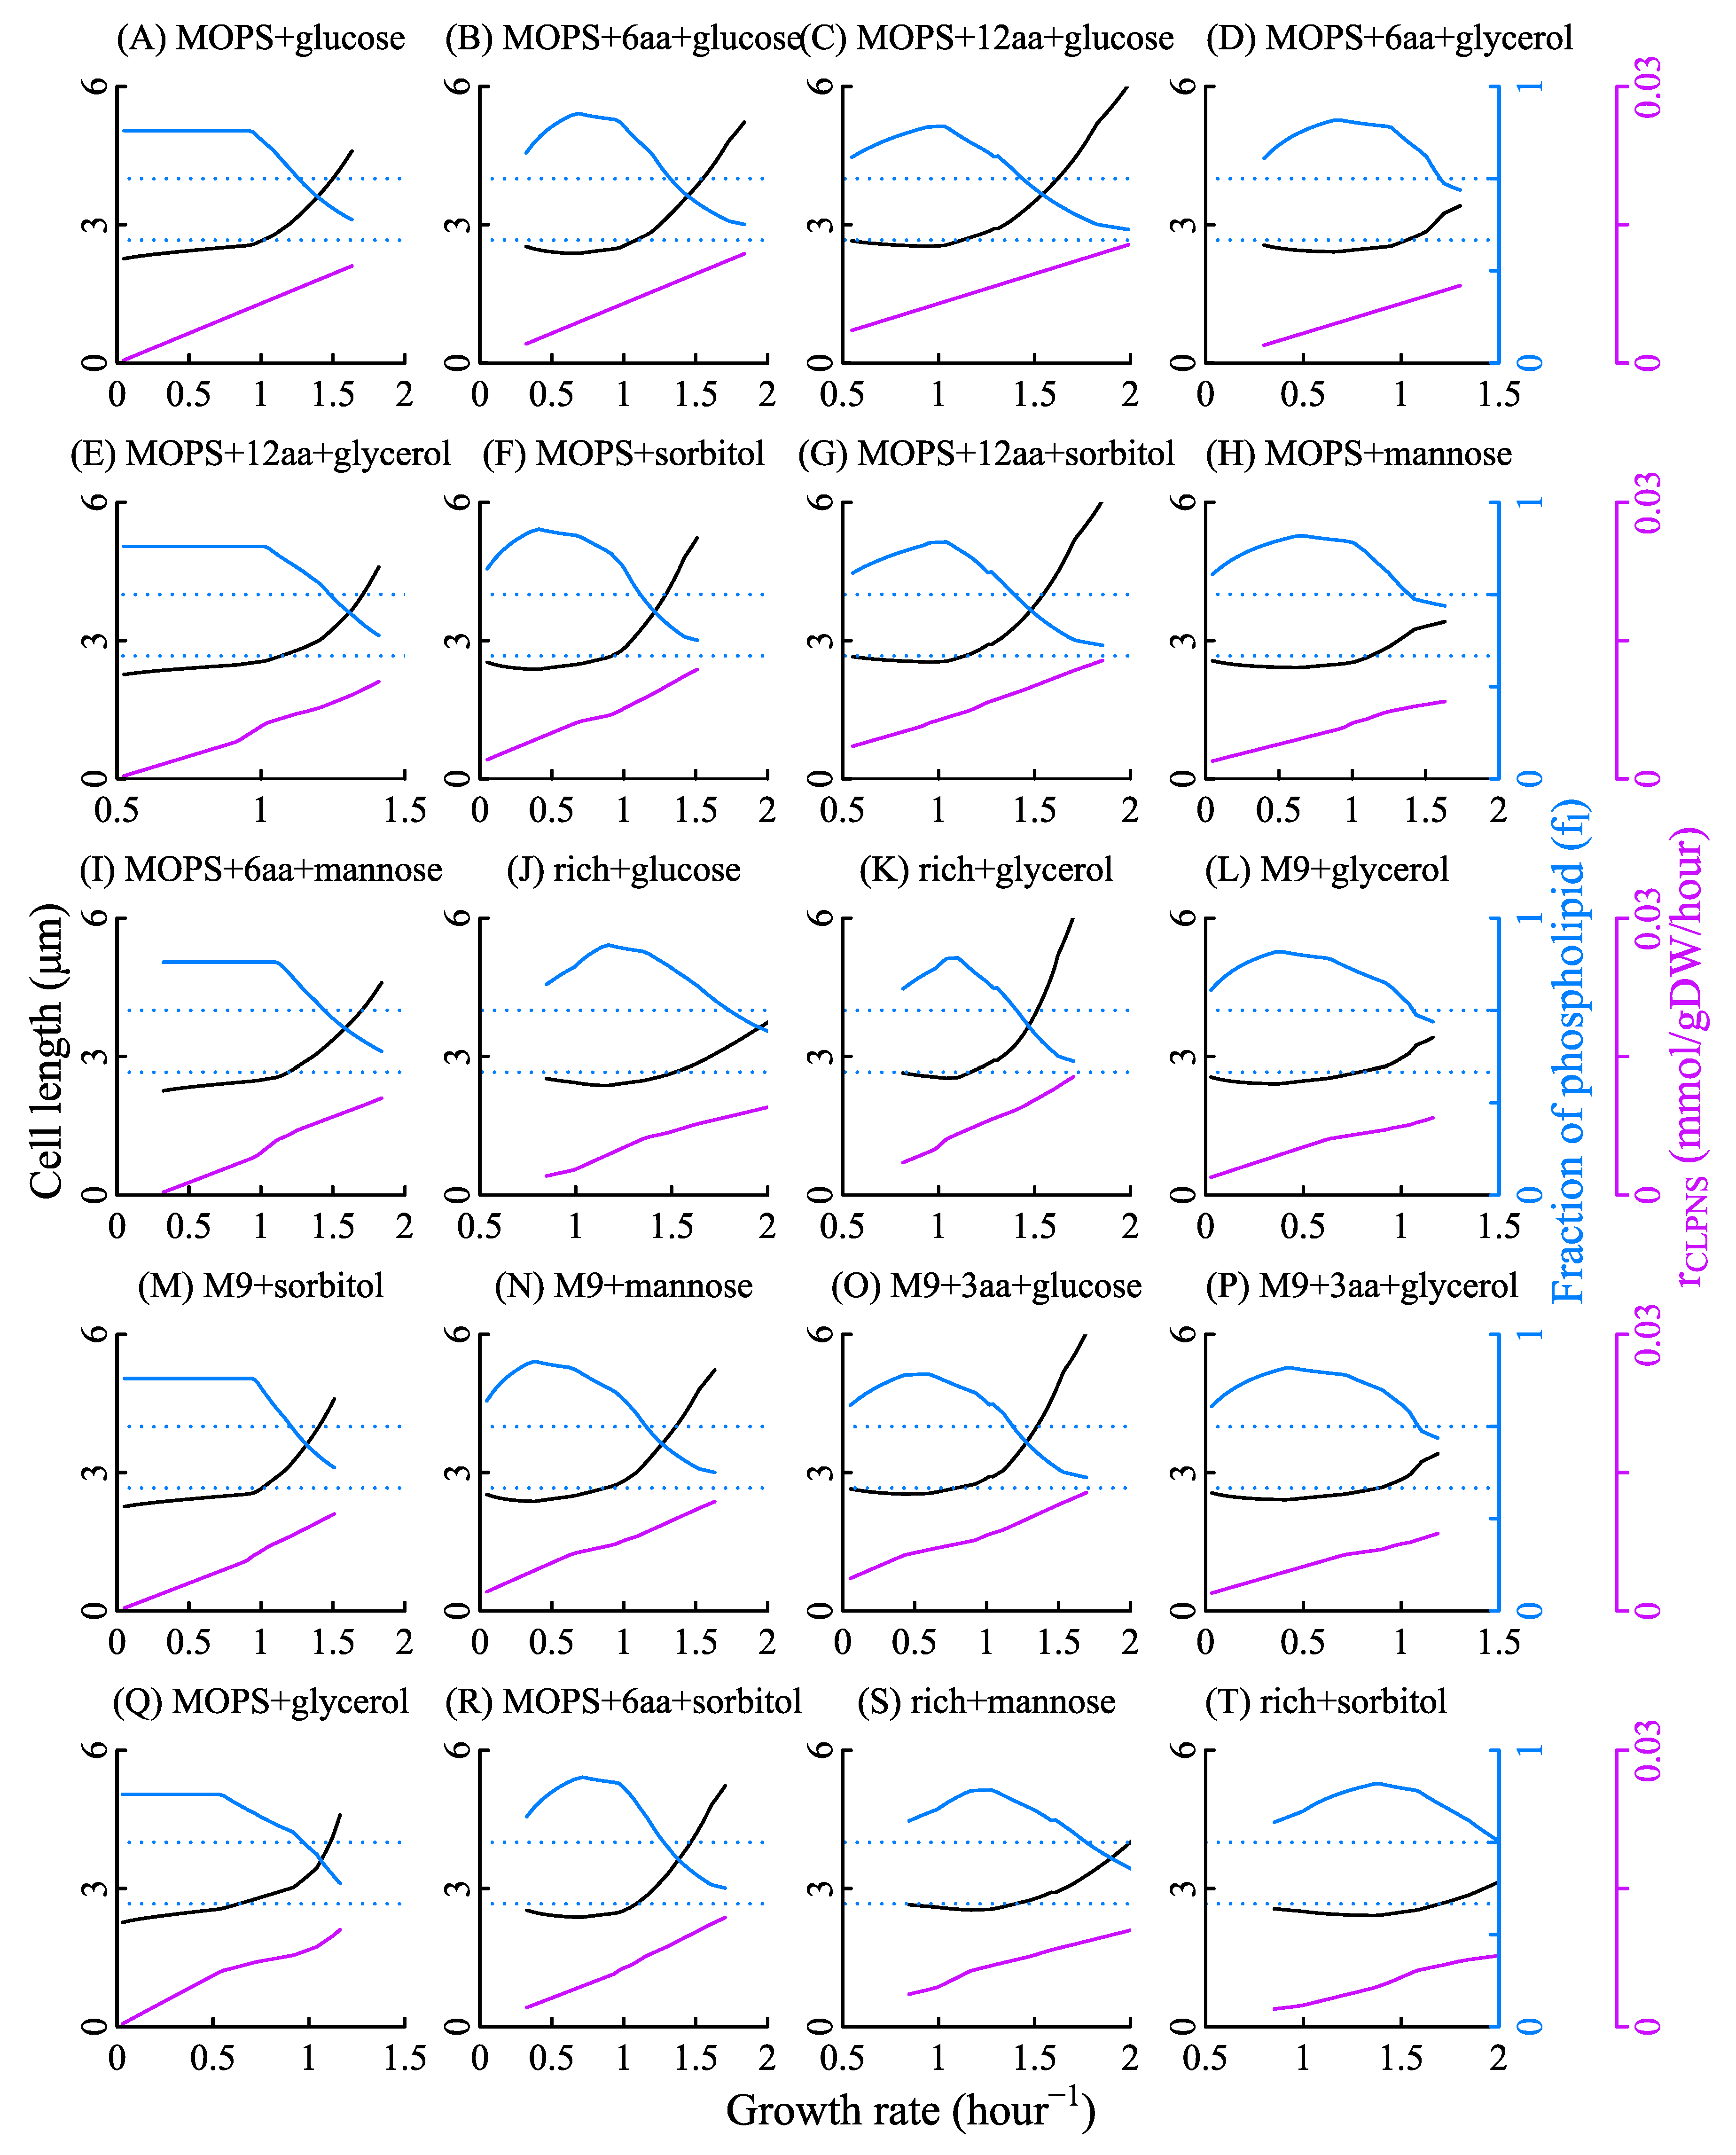
Figure A4.
Cell width changing with growth rate. Points in each sub-figure stand for the cell width of four bacterial strains at various growth rates. The colorful lines are cell width in SEFBA calculated with Equation (5) whose n0 is estimated based on cell width average and the average value of fl. The light blue area is the cell width calculated by the experimental relationship between cell width and the growth rate. The orange area is the cell width variation derived from the fl change. All the parameters used here are the same as Figure 2.

Figure A5.
Effects of cell width on cell length. The solid lines in both black and orange are cell length. The difference between them is whether the variation of cell width is derived from the fraction area of phospholipid in membranes (fl) or from the amount of phospholipid in cell caps (n0). As for black solid lines, fl is based on the simulations, which varies with the growth rate, while n0 is constant. As for orange solid lines, fl uses the average value, which does not change with the growth rate, while n0 changes with the growth rate.

Figure A6.
Growth rates and cell length of bacteria in aerobic conditions and in anaerobic conditions. E. coli grows faster in aerobic condition than anaerobic condition, while cell length is smaller in aerobic condition than anaerobic condition. (A) the growth rate of bacteria growing in 20 aerobic and anaerobic culture media. (B) The cell length of bacteria growing in 20 aerobic and anaerobic culture media. These results were derived from SEFBA simulations whose reaction bounds corresponding to culture media were written in Table S4 and parameters were the same as in Figure 2 of BW25113. It suggested that bacteria in anaerobic condition has a smaller growth rate but a larger cell size than that in aerobic condition.

Figure A7.
Relationship between growth rate and cell length with iJO1366 model. The simulations were done with iJO1366 model. The parameters used here are the same as those in Figure 2, except for . The results of SEFBA using iJO1366 model are similar to using iJR904 model.
Figure A7.
Relationship between growth rate and cell length with iJO1366 model. The simulations were done with iJO1366 model. The parameters used here are the same as those in Figure 2, except for . The results of SEFBA using iJO1366 model are similar to using iJR904 model.
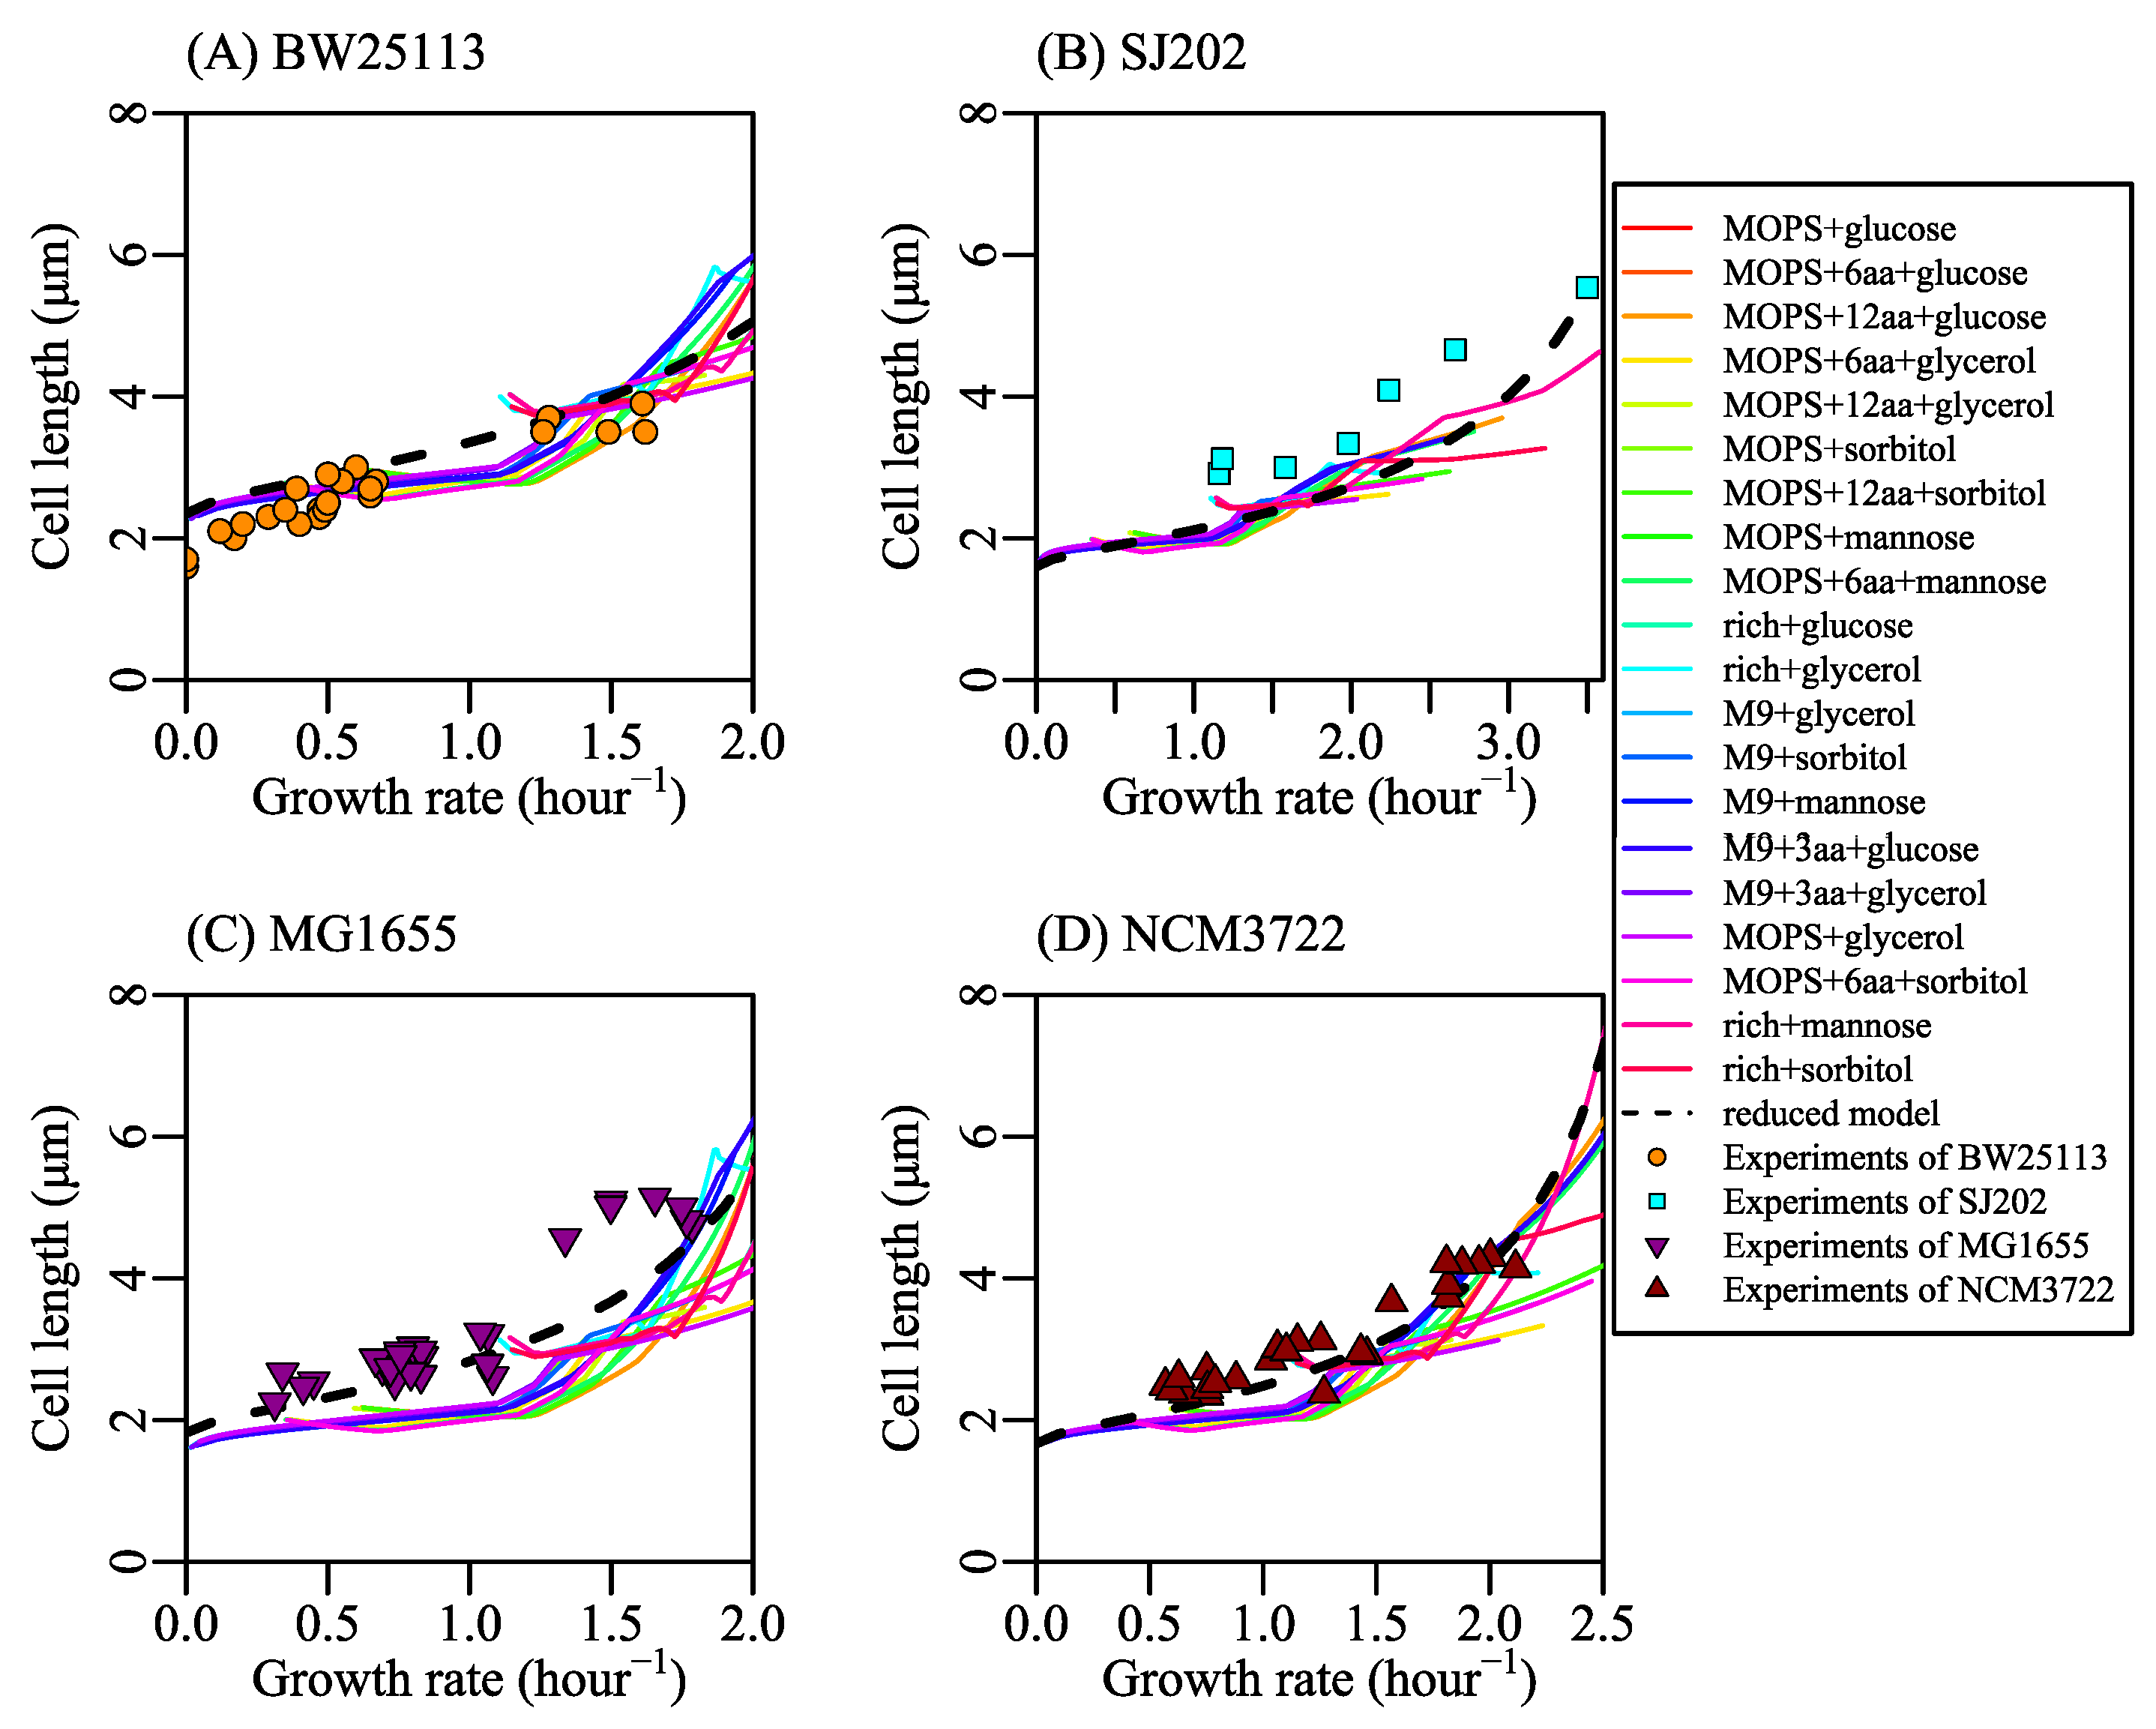
Figure A8.
The tendency that the fraction of facilitated diffusion to all transport reactions varies with growth rate. Despite that there are several parts of lines corresponding to the culture media with more than six kinds of amino acids decreased in a small rang of growth rate, the fraction of facilitated diffusion to all transport reactions mainly has a tendency to increase with growth rate and to reach a limit value finally. The data in this figure was obtained by flux balance analysis with bounds listed in Table S1, the same as in Figure 2.

Figure A9.
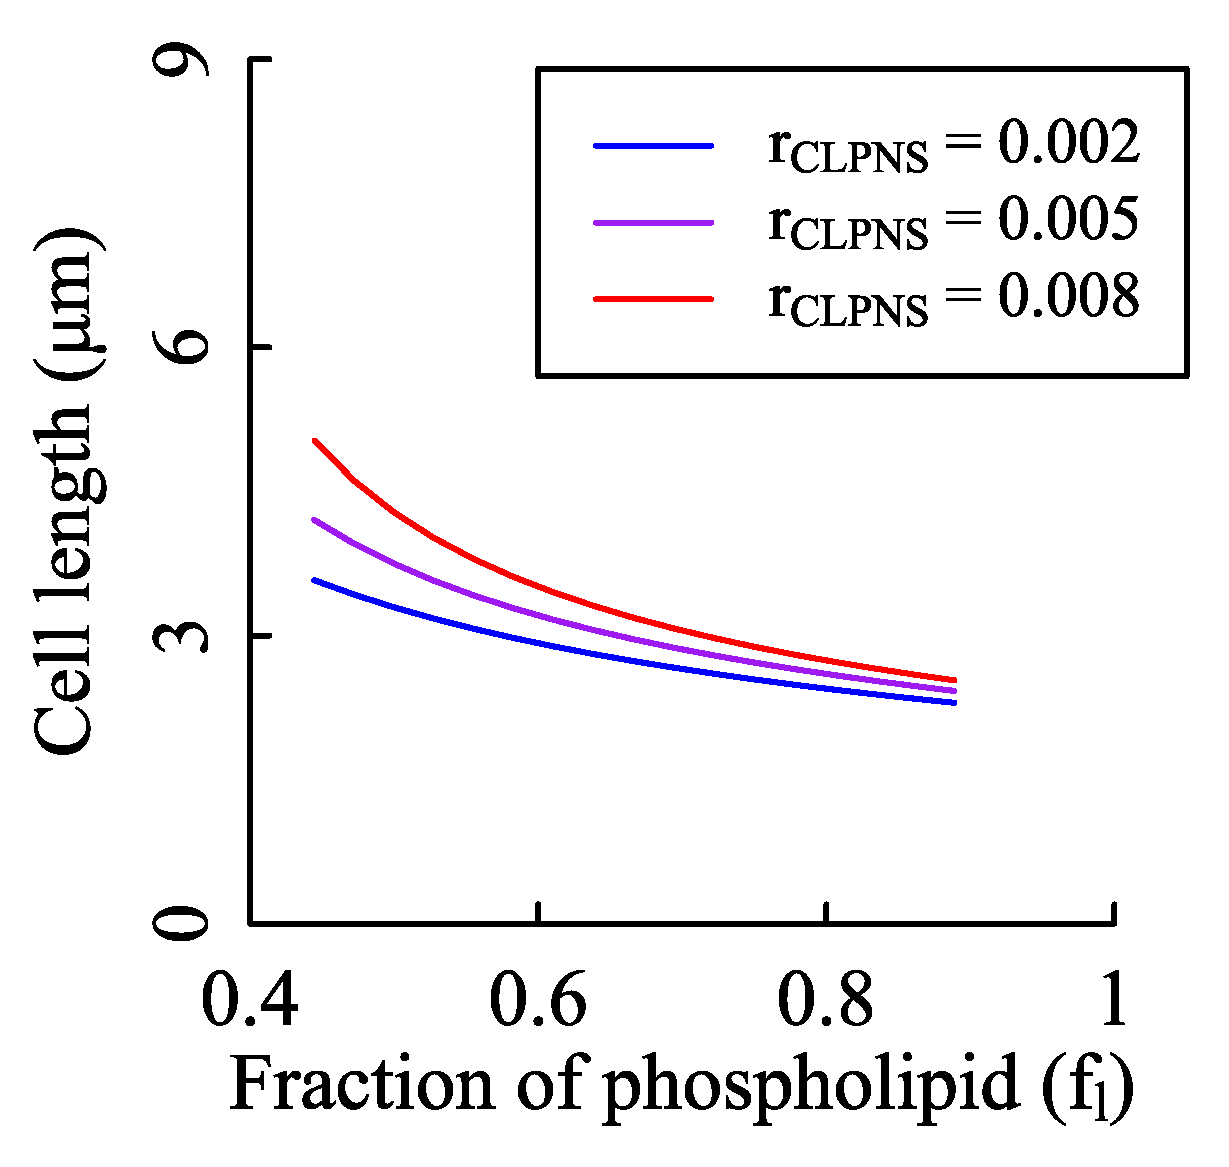
Effects of the fraction of phospholipid in membranes on cell size. According to the Equation (20), the fraction of phospholipid does have influence on the cell length. To test the impact strength, we fixed the cardiolipin synthesis rate and changed fl. The values of n0, KM, and Vmax were the same as those of Figure 2A. We set rCLPNS to three values with the unit of mmol/(gDW·h).
Figure A9.
Effects of the fraction of phospholipid in membranes on cell size. According to the Equation (20), the fraction of phospholipid does have influence on the cell length. To test the impact strength, we fixed the cardiolipin synthesis rate and changed fl. The values of n0, KM, and Vmax were the same as those of Figure 2A. We set rCLPNS to three values with the unit of mmol/(gDW·h).
References
- Schaechter, M.; Maaløe, O.; Kjeldgaard, N.O. Dependency on medium and temperature of cell size and chemical composition during balanced growth of Salmonella typhimurium. Microbiology 1958, 19, 592–606. [Google Scholar] [CrossRef] [Green Version]
- Pierucci, O. Dimensions of Escherichia coli at various growth rates: Model for envelope growth. J. Bacteriol. 1978, 135, 559–574. [Google Scholar] [CrossRef] [PubMed] [Green Version]
- Sargent, M.G. Control of cell length in Bacillus subtilis. J. Bacteriol. 1975, 123, 7–19. [Google Scholar] [CrossRef] [PubMed] [Green Version]
- Westfall, C.S.; Levin, P.A. Comprehensive analysis of central carbon metabolism illuminates connections between nutrient availability, growth rate, and cell morphology in Escherichia coli. PLoS Genet. 2018, 14, e1007205. [Google Scholar] [CrossRef] [PubMed] [Green Version]
- Vadia, S.; Jessica, L.T.; Lucena, R.; Yang, Z.; Kellogg, D.R.; Wang, J.D.; Levin, P.A. Fatty acid availability sets cell envelope capacity and dictates microbial cell size. Curr. Biol. 2017, 27, 1757–1767. [Google Scholar] [CrossRef] [Green Version]
- Si, F.; Li, D.; Cox, S.E.; Sauls, J.T.; Azizi, O.; Sou, C.; Schwartz, A.B.; Erickstad, M.J.; Jun, Y.; Li, X.; et al. Invariance of initiation mass and predictability of cell size in Escherichia coli. Curr. Biol. 2017, 27, 1278–1287. [Google Scholar] [CrossRef]
- Sheats, J.; Sclavi, B.; Cosentino Lagomarsino, M.; Cicuta, P.; Dorfman, K.D. Role of growth rate on the orientational alignment of Escherichia coli in a slit. R. Soc. Open Sci. 2017, 4, 170463. [Google Scholar] [CrossRef] [Green Version]
- Harris, L.K.; Theriot, J.A. Relative rates of surface and volume synthesis set bacterial cell size. Cell 2016, 165, 1479–1492. [Google Scholar] [CrossRef] [Green Version]
- Taheri-Araghi, S.; Bradde, S.; Sauls, J.T.; Hill, N.S.; Levin, P.A.; Paulsson, J.; Vergassola, M.; Jun, S. Cell-size control and homeostasis in bacteria. Curr. Biol. 2015, 25, 385–391. [Google Scholar] [CrossRef] [Green Version]
- Basan, M.; Zhu, M.; Dai, X.; Warren, M.; Sévin, D.; Wang, Y.P.; Hwa, T. Inflating bacterial cells by increased protein synthesis. Mol. Syst. Biol. 2015, 11, 836. [Google Scholar] [CrossRef]
- Hill, N.S.; Buske, P.J.; Shi, Y.; Levin, P.A. A moonlighting enzyme links Escherichia coli cell size with central metabolism. PLoS Genet. 2013, 9, e1003663. [Google Scholar] [CrossRef] [PubMed] [Green Version]
- Hill, N.S.; Kadoya, R.; Chattoraj, D.K.; Levin, P.A. Cell size and the initiation of DNA replication in bacteria. PLoS Genet. 2012, 8, e1002549. [Google Scholar] [CrossRef] [PubMed] [Green Version]
- Volkmer, B.; Heinemann, M. Condition-dependent cell volume and concentration of Escherichia coli to facilitate data conversion for systems biology modeling. PLoS ONE 2011, 6, e23126. [Google Scholar] [CrossRef] [PubMed] [Green Version]
- Yao, Z.; Davis, R.M.; Kishony, R.; Kahne, D.; Ruiz, N. Regulation of cell size in response to nutrient availability by fatty acid biosynthesis in Escherichia coli. Proc. Natl. Acad. Sci. USA 2012, 109, E2561–E2568. [Google Scholar] [CrossRef] [PubMed] [Green Version]
- Willis, L.; Huang, K.C. Cell Size: Fat Makes Cells Fat. Curr. Biol. 2017, 27, R592–R594. [Google Scholar] [CrossRef] [PubMed] [Green Version]
- Weart, R.B.; Lee, A.H.; Chien, A.C.; Haeusser, D.P.; Hill, N.S.; Levin, P.A. A metabolic sensor governing cell size in bacteria. Cell 2007, 130, 335–347. [Google Scholar] [CrossRef] [Green Version]
- Battesti, A.; Bouveret, E. Acyl carrier protein/SpoT interaction, the switch linking SpoT-dependent stress response to fatty acid metabolism. Mol. Microbiol. 2006, 62, 1048–1063. [Google Scholar] [CrossRef]
- Liu, K.; Bittner, A.N.; Wang, J.D. Diversity in (p) ppGpp metabolism and effectors. Curr. Opin. Microbiol. 2015, 24, 72–79. [Google Scholar] [CrossRef] [Green Version]
- My, L.; Rekoske, B.; Lemke, J.J.; Viala, J.P.; Gourse, R.L.; Bouveret, E. Transcription of the Escherichia coli fatty acid synthesis operon fabHDG is directly activated by FadR and inhibited by ppGpp. J. Bacteriol. 2013, 195, 3784–3795. [Google Scholar] [CrossRef] [Green Version]
- Schreiber, G.; Ron, E.Z.; Glaser, G. ppGpp-mediated regulation of DNA replication and cell division in Escherichia coli. Curr. Microbiol. 1995, 30, 27–32. [Google Scholar] [CrossRef]
- Heath, R.J.; Jackowski, S.; Rock, C.O. Guanosine tetraphosphate inhibition of fatty acid and phospholipid synthesis in Escherichia coli is relieved by overexpression of glycerol-3-phosphate acyltransferase (plsB). J. Biol. Chem. 1994, 269, 26584–26590. [Google Scholar] [PubMed]
- Seyfzadeh, M.; Keener, J.; Nomura, M. spoT-dependent accumulation of guanosine tetraphosphate in response to fatty acid starvation in Escherichia coli. Proc. Natl. Acad. Sci. USA 1993, 90, 11004–11008. [Google Scholar] [CrossRef] [PubMed] [Green Version]
- Sarubbi, E.; Rudd, K.E.; Cashel, M. Basal ppGpp level adjustment shown by new spoT mutants affect steady state growth rates and rrnA ribosomal promoter regulation in Escherichia coli. Mol. Gen. Genet. MGG 1988, 213, 214–222. [Google Scholar] [CrossRef] [PubMed]
- Orth, J.D.; Thiele, I.; Palsson, B. What is flux balance analysis? Nat. Biotechnol. 2010, 28, 245. [Google Scholar] [CrossRef]
- Edwards, J.S.; Ibarra, R.U.; Palsson, B.O. In silico predictions of Escherichia coli metabolic capabilities are consistent with experimental data. Nat. Biotechnol. 2001, 19, 125. [Google Scholar] [CrossRef]
- Mori, M.; Hwa, T.; Martin, O.C.; De Martino, A.; Marinari, E. Constrained allocation flux balance analysis. PLoS Comput. Biol. 2016, 12, e1004913. [Google Scholar] [CrossRef] [Green Version]
- Beg, Q.K.; Vazquez, A.; Ernst, J.; de Menezes, M.A.; Bar-Joseph, Z.; Barabási, A.L.; Oltvai, Z.N. Intracellular crowding defines the mode and sequence of substrate uptake by Escherichia coli and constrains its metabolic activity. Proc. Natl. Acad. Sci. USA 2007, 104, 12663–12668. [Google Scholar] [CrossRef] [Green Version]
- Edwards, J.S.; Palsson, B.O. Systems properties of the Haemophilus influenzaeRd metabolic genotype. J. Biol. Chem. 1999, 274, 17410–17416. [Google Scholar] [CrossRef] [Green Version]
- Schilling, C.H.; Palsson, B. Assessment of the metabolic capabilities of Haemophilus influenzae Rd through a genome-scale pathway analysis. J. Theor. Biol. 2000, 203, 249–283. [Google Scholar] [CrossRef]
- Förster, J.; Famili, I.; Fu, P.; Palsson, B.; Nielsen, J. Genome-scale reconstruction of the Saccharomyces cerevisiae metabolic network. Genome Res. 2003, 13, 244–253. [Google Scholar]
- Duarte, N.C.; Herrgård, M.J.; Palsson, B. Reconstruction and validation of Saccharomyces cerevisiae iND750, a fully compartmentalized genome-scale metabolic model. Genome Res. 2004, 14, 1298–1309. [Google Scholar] [CrossRef] [PubMed] [Green Version]
- Orth, J.D.; Conrad, T.M.; Na, J.; Lerman, J.A.; Nam, H.; Feist, A.M.; Palsson, B. A comprehensive genome-scale reconstruction of Escherichia coli metabolism—2011. Mol. Syst. Biol. 2011, 7, 535. [Google Scholar] [CrossRef] [PubMed]
- Conrad, T.M.; Frazier, M.; Joyce, A.R.; Cho, B.K.; Knight, E.M.; Lewis, N.E.; Landick, R.; Palsson, B. RNA polymerase mutants found through adaptive evolution reprogram Escherichia coli for optimal growth in minimal media. Proc. Natl. Acad. Sci. USA 2010, 107, 20500–20505. [Google Scholar] [CrossRef] [PubMed] [Green Version]
- Feist, A.M.; Henry, C.S.; Reed, J.L.; Krummenacker, M.; Joyce, A.R.; Karp, P.D.; Broadbelt, L.J.; Hatzimanikatis, V.; Palsson, B. A genome-scale metabolic reconstruction for Escherichia coli K-12 MG1655 that accounts for 1260 ORFs and thermodynamic information. Mol. Syst. Biol. 2007, 3, 121. [Google Scholar] [CrossRef] [PubMed]
- Reed, J.L.; Vo, T.D.; Schilling, C.H.; Palsson, B.O. An expanded genome-scale model of Escherichia coli K-12 (i JR904 GSM/GPR). Genome Biol. 2003, 4, R54. [Google Scholar] [CrossRef] [PubMed] [Green Version]
- Edwards, J.; Palsson, B. The Escherichia coli MG1655 in silico metabolic genotype: Its definition, characteristics, and capabilities. Proc. Natl. Acad. Sci. USA 2000, 97, 5528–5533. [Google Scholar] [CrossRef] [Green Version]
- Schuster, S.; Pfeiffer, T.; Fell, D.A. Is maximization of molar yield in metabolic networks favoured by evolution? J. Theor. Biol. 2008, 252, 497–504. [Google Scholar] [CrossRef]
- Pramanik, J.; Keasling, J. Stoichiometric model of Escherichia coli metabolism: Incorporation of growth-rate dependent biomass composition and mechanistic energy requirements. Biotechnol. Bioeng. 1997, 56, 398–421. [Google Scholar] [CrossRef]
- Zhuang, K.; Vemuri, G.N.; Mahadevan, R. Economics of membrane occupancy and respiro-fermentation. Mol. Syst. Biol. 2011, 7, 500. [Google Scholar] [CrossRef]
- Gatto, F.; Miess, H.; Schulze, A.; Nielsen, J. Flux balance analysis predicts essential genes in clear cell renal cell carcinoma metabolism. Sci. Rep. 2015, 5, 10738. [Google Scholar] [CrossRef]
- Raman, K.; Chandra, N. Flux balance analysis of biological systems: Applications and challenges. Briefings Bioinform. 2009, 10, 435–449. [Google Scholar] [CrossRef] [PubMed]
- Reznik, E.; Mehta, P.; Segrè, D. Flux imbalance analysis and the sensitivity of cellular growth to changes in metabolite pools. PLoS Comput. Biol. 2013, 9, e1003195. [Google Scholar] [CrossRef] [PubMed]
- Silhavy, T.J. Classic spotlight: Gram-negative bacteria have two membranes. J. Bacteriol. 2016, 198, 201. [Google Scholar] [CrossRef] [PubMed] [Green Version]
- Silhavy, T.J.; Kahne, D.; Walker, S. The bacterial cell envelope. Cold Spring Harb. Perspect. Biol. 2010, 2, a000414. [Google Scholar] [CrossRef]
- Costerton, J.; Ingram, J.; Cheng, K. Structure and function of the cell envelope of gram-negative bacteria. Bacteriol. Rev. 1974, 38, 87. [Google Scholar] [CrossRef] [Green Version]
- Osborn, M.; Gander, J.; Parisi, E.; Carson, J. Mechanism of assembly of the outer membrane of Salmonella typhimurium isolation and characterization of cytoplasmic and outer membrane. J. Biol. Chem. 1972, 247, 3962–3972. [Google Scholar]
- Schwechheimer, C.; Sullivan, C.J.; Kuehn, M.J. Envelope control of outer membrane vesicle production in Gram-negative bacteria. Biochemistry 2013, 52, 3031–3040. [Google Scholar] [CrossRef]
- Autissier, F.; Jaffe, A.; Kepes, A. Segregation of galactoside permease, a membrane marker during growth and cell division in Escherichia coli. Mol. Gen. Genet. MGG 1971, 112, 275–288. [Google Scholar] [CrossRef]
- Cronan, J.E., Jr.; Gelmann, E.P. Physical properties of membrane lipids: Biological relevance and regulation. Bacteriol. Rev. 1975, 39, 232. [Google Scholar] [CrossRef] [Green Version]
- Bell, R.M.; Mavis, R.D.; Osborn, M.; Vagelos, P.R. Enzymes of phospholipid metabolism: Localization in the cytoplasmic and outer membrane of the cell envelope of Escherichia coli and Salmonella typhimurium. Biochim. Biophys. Acta-(BBA)-Biomembr. 1971, 249, 628–635. [Google Scholar] [CrossRef]
- Cronan, J.J.; Rock, C.O. Biosynthesis of membrane lipids. EcoSal Plus 2008, 3. [Google Scholar] [CrossRef] [PubMed]
- Raetz, C. Enzymology, genetics, and regulation of membrane phospholipid synthesis in Escherichia coli. Microbiol. Rev. 1978, 42, 614. [Google Scholar] [CrossRef] [PubMed]
- Decad, G.M.; Nikaido, H. Outer membrane of gram-negative bacteria. XII. Molecular-sieving function of cell wall. J. Bacteriol. 1976, 128, 325–336. [Google Scholar] [CrossRef] [PubMed] [Green Version]
- Phillips, R.; Theriot, J.; Kondev, J.; Garcia, H. Physical Biology of the Cell; Garland Science: New York, NY, USA, 2012. [Google Scholar]
- Bowman, G.R.; Lyuksyutova, A.I.; Shapiro, L. Bacterial polarity. Curr. Opin. Cell Biol. 2011, 23, 71–77. [Google Scholar] [CrossRef]
- Koch, A.L.; Woldringh, C.L. The metabolic inertness of the pole wall of a gram-negative rod. J. Theor. Biol. 1994, 171, 415–425. [Google Scholar] [CrossRef]
- Hoffmann, B.; Messer, W.; Schwarz, U. Regulation of polar cap formation in the life cycle of Escherichia coli. J. Supramol. Struct. 1972, 1, 29–37. [Google Scholar] [CrossRef]
- Neidhardt, F.C.; Ingraham, J.L.; Schaechter, M. Physiology of the Bacterial Cell: A Molecular Approach; Sinauer Associates: Sunderland, MA, USA, 1990; Volume 20. [Google Scholar]
- Schlame, M. Thematic Review Series: Glycerolipids. Cardiolipin synthesis for the assembly of bacterial and mitochondrial membranes. J. Lipid Res. 2008, 49, 1607–1620. [Google Scholar] [CrossRef] [Green Version]
- Hirschberg, C.B.; Kennedy, E.P. Mechanism of the enzymatic synthesis of cardiolipin in Escherichia coli. Proc. Natl. Acad. Sci. USA 1972, 69, 648–651. [Google Scholar] [CrossRef] [Green Version]
- Schlame, M.; Zhao, M.; Rua, D.; Haldar, D.; Greenberg, M.L. Kinetic analysis of cardiolipin synthase: A membrane enzyme with two glycerophospholipid substrates. Lipids 1995, 30, 633–640. [Google Scholar] [CrossRef]
- Ragolia, L.; Tropp, B.E. The effects of phosphoglycerides on Escherichia coli cardiolipin synthase. Biochim. Biophys. Acta-(BBA)-Lipids Lipid Metab. 1994, 1214, 323–332. [Google Scholar] [CrossRef]
- Keseler, I.M.; Mackie, A.; Santos-Zavaleta, A.; Billington, R.; Bonavides-Martínez, C.; Caspi, R.; Fulcher, C.; Gama-Castro, S.; Kothari, A.; Krummenacker, M.; et al. The EcoCyc database: Reflecting new knowledge about Escherichia coli K-12. Nucleic Acids Res. 2016, 45, D543–D550. [Google Scholar] [CrossRef] [Green Version]
- Carranza, G.; Angius, F.; Ilioaia, O.; Solgadi, A.; Miroux, B.; Arechaga, I. Cardiolipin plays an essential role in the formation of intracellular membranes in Escherichia coli. Biochim. Biophys. Acta-(BBA)-Biomembr. 2017, 1859, 1124–1132. [Google Scholar] [CrossRef]
- Pluschke, G.; Hirota, Y.; Overath, P. Function of phospholipids in Escherichia coli. Characterization of a mutant deficient in cardiolipin synthesis. J. Biol. Chem. 1978, 253, 5048–5055. [Google Scholar]
- Shibuya, I.; Miyazaki, C.; Ohta, A. Alteration of phospholipid composition by combined defects in phosphatidylserine and cardiolipin synthases and physiological consequences in Escherichia coli. J. Bacteriol. 1985, 161, 1086–1092. [Google Scholar] [CrossRef] [Green Version]
- Nishijima, S.; Asami, Y.; Uetake, N.; Yamagoe, S.; Ohta, A.; Shibuya, I. Disruption of the Escherichia coli cls gene responsible for cardiolipin synthesis. J. Bacteriol. 1988, 170, 775–780. [Google Scholar] [CrossRef] [Green Version]
- Tan, B.K.; Bogdanov, M.; Zhao, J.; Dowhan, W.; Raetz, C.R.; Guan, Z. Discovery of a cardiolipin synthase utilizing phosphatidylethanolamine and phosphatidylglycerol as substrates. Proc. Natl. Acad. Sci. USA 2012, 109, 16504–16509. [Google Scholar] [CrossRef] [Green Version]
- Schmidt, A.; Kochanowski, K.; Vedelaar, S.; Ahrné, E.; Volkmer, B.; Callipo, L.; Knoops, K.; Bauer, M.; Aebersold, R.; Heinemann, M. The quantitative and condition-dependent Escherichia coli proteome. Nat. Biotechnol. 2016, 34, 104. [Google Scholar] [CrossRef]
- Szenk, M.; Dill, K.A.; de Graff, A.M. Why do fast-growing bacteria enter overflow metabolism? Testing the membrane real estate hypothesis. Cell Syst. 2017, 5, 95–104. [Google Scholar] [CrossRef]
- Carruthers, A. Facilitated diffusion of glucose. Physiol. Rev. 1990, 70, 1135–1176. [Google Scholar] [CrossRef]
- Hoekstra, D.; van der Laan, J.W.; de Leij, L.; Witholt, B. Release of outer membrane fragments from normally growing Escherichia coli. Biochim. Biophys. Acta-(BBA)-Biomembr. 1976, 455, 889–899. [Google Scholar] [CrossRef]
- Ibarra, R.U.; Edwards, J.S.; Palsson, B.O. Escherichia coli K-12 undergoes adaptive evolution to achieve in silico predicted optimal growth. Nature 2002, 420, 186. [Google Scholar] [CrossRef]
- Nanchen, A.; Schicker, A.; Sauer, U. Nonlinear dependency of intracellular fluxes on growth rate in miniaturized continuous cultures of Escherichia coli. Appl. Environ. Microbiol. 2006, 72, 1164–1172. [Google Scholar] [CrossRef] [Green Version]
- Schuetz, R.; Kuepfer, L.; Sauer, U. Systematic evaluation of objective functions for predicting intracellular fluxes in Escherichia coli. Mol. Syst. Biol. 2007, 3, 119. [Google Scholar] [CrossRef] [PubMed]
- Vazquez, A.; Beg, Q.K.; Marcio, A.D.; Ernst, J.; Bar-Joseph, Z.; Barabási, A.L.; Boros, L.G.; Oltvai, Z.N. Impact of the solvent capacity constraint on E. coli metabolism. BMC Syst. Biol. 2008, 2, 7. [Google Scholar] [CrossRef] [Green Version]
- Natarajan, A.; Srienc, F. Dynamics of glucose uptake by single Escherichia coli cells. Metab. Eng. 1999, 1, 320–333. [Google Scholar] [CrossRef] [PubMed]
- Kristjansdottir, T.; Bosma, E.F.; dos Santos, F.B.; Özdemir, E.; Herrgård, M.J.; França, L.; Ferreira, B.; Nielsen, A.T.; Gudmundsson, S. A metabolic reconstruction of Lactobacillus reuteri JCM 1112 and analysis of its potential as a cell factory. Microb. Cell Factories 2019, 18, 186. [Google Scholar] [CrossRef] [Green Version]
- Schellenberger, J.; Lewis, N.E.; Palsson, B. Elimination of thermodynamically infeasible loops in steady-state metabolic models. Biophys. J. 2011, 100, 544–553. [Google Scholar] [CrossRef] [Green Version]
- Park, J.O.; Rubin, S.A.; Xu, Y.F.; Amador-Noguez, D.; Fan, J.; Shlomi, T.; Rabinowitz, J.D. Metabolite concentrations, fluxes and free energies imply efficient enzyme usage. Nat. Chem. Biol. 2016, 12, 482. [Google Scholar] [CrossRef] [Green Version]
- Babu, M.; Bundalovic-Torma, C.; Calmettes, C.; Phanse, S.; Zhang, Q.; Jiang, Y.; Minic, Z.; Kim, S.; Mehla, J.; Gagarinova, A.; et al. Global landscape of cell envelope protein complexes in Escherichia coli. Nat. Biotechnol. 2018, 36, 103. [Google Scholar] [CrossRef]
- Thiele, I.; Palsson, B. A protocol for generating a high-quality genome-scale metabolic reconstruction. Nat. Protoc. 2010, 5, 93. [Google Scholar] [CrossRef] [Green Version]
Figure 1.
Overview of modeling approaches. (A) Gram-negative bacteria have an inner membrane and an outer membrane, both of which are lipid bilayers embedded with membrane proteins. According to the membrane structure, the cell surface area is the function of the amount of phospholipid. (B) f1 refers to the Michaelis–Menten equation of cardiolipin biosynthesis reaction, which sets a constraint among the amount of phosphatidylglycerol, cardiolipin synthesis rate, cell length and cell width (see Equation (18)). f2 is another constraint deriving from cell membrane structure (see Equation (7)). According to f1 and f2, f3 is written as Equation (20). The relationship between the growth rate and cardiolipin synthesis rate was introduced by two ways in this work. One was based on the flux balance analysis, and another was assuming a linear equation directly. The function of cell length and growth rate was obtained by integrated f3 and f4. (C–F) Simulations of iJR904 [35] whose bounds correspond to the M9 minimal medium [25,73,74] with glucose (written in Table S1). Exchange rates of nutrients depend on the nutrient concentration. The increase of nutrient exchange rates leads to fast growth rate. The flux balance analysis of genome-scale metabolic network infers that the cardiolipin synthesis rate changes linearly with the growth rate when bacteria grow with same bottleneck reactions. According to Equation (20), cell length increases with cardiolipin synthesis rate.

Figure 2.
Comparison between the results of size estimation based on flux balance analysis (SEFBA) with experimental data. The solid lines in different colors are the results of SEFBA. Each color of the solid lines stands for a kind of culture medium which is determined by reactions bounds. KM is , and is 0.5 in all sub-figures. The dashed lines were drawn by Equation (31), where parameter C is 2.96 and parameter H is 1. Cell width D changes linearly with the growth rate based on experiments data [6,9,13]. The parameter E is 0.04 in (A), 0.023 in (B), 0.04 in (C), and 0.035 in (D), standing for the variation rate of cardiolipin synthesis with growth rate. The upper edges of light blue area were calculated by setting wCLPNS zero while changing cell width D, so the light blue area represents the cell length variation caused by cell width. The upper edges of light gray area were calculated by setting wCLPNS a positive value while changing cell width D, so the light gray area represents the cell length variation caused by rCLPNS. The upper edges of brown area were calculated by setting n0 changing with growth rate (same to cell width changing with growth rate) in SEFBA. (A) The circles in orange are the experimental data [13] with the strain of BW25113. n0 is . Vmax is 0.38 mmol/(gDW·h). (B) The squares in cyan are the measured data from experiment [9] with the strain SJ202. n0 is . Vmax is 0.76 mmol/(gDW·h). (C) The inverted triangles filled with purple are from experiments of MG1655 [6]. n0 is . Vmax is 0.3 mmol/(gDW·h). (D) The regular triangles filled with red are experiments of NCM3722 [6]. n0 is . Vmax is 0.38 mmol/(gDW·h). The values of Vmax for BW2513 and MG1655 are based on the mass spectrometric data [69], and the values of Vmax for SJ202 and NCM3722 were obtained by fitting experimental data. The values of n0 for each of the bacterial strains were estimated based on the cell width. is 3.4 obtained by fitting the experiments.

Figure 3.
Three tendencies of cell length changing with growth rate. D is cell width. , and (See Equation (31)). E represents the correlation between the cardiolipin synthesis rate and growth rate. The reduced model of SEFBA is suitable to describe the changes of cell length with growth rate under various growth stresses. The parameter C in Equation (31) depends on fPG and KM. As both fPG and KM are about constant, the value of C is 2.96 under different growth stresses. (A) The lines display the relationship between growth rate and cell length under different stress conditions. Different types of lines were drawn with different parameters written in the table beside. (B) Comparison of the reduced model and experiments. The experimental data were cited from Basan et at. [10].

Figure 4.
Effects of metabolic gene deletions on growth rate and cell size. (A) Each point stands for an Escherichia coli mutant with the same parameters in SEFBA. is equal to 0.22, which is adapted to metabolic networks iJO1366. Other parameters except for are the same as Figure 2A. Three colors of points stand for three culture media (written in Table S2). One culture medium corresponds to MOPS medium [6,78] with glucose. One corresponds to M9 medium [25,73,74] with glucose. Another corresponds to rich medium [6] with kinds of amino acids and glucose. The maximum exchange reaction rate of oxygen is 15 ·h, and the maximum exchange reaction rate of glucose is 15 ·h. Detail information of bounds was written in Table S2. Each mutant can have more than one gene deletion and each gene deletion can also switch off more than one reaction in metabolic reactions network. The detailed information about mutants was written in Table S3. (B) Comparison between experimental data [4] and SEFBA results of nine mutants of metabolic gene deletions. Twenty kinds of bounds were used in SEFBA to simulate different culture media (Table S1). For each kind of bound, we varied the glucose exchange rate to have the predicted growth rate of FBA close to the experimental data. The ordinate is the variation in cell length of Escherichia coli strains with gene deletions compared to that without gene deletions. The error bars are the minimum and maximum values of cell length variation among 20 kinds of culture media.


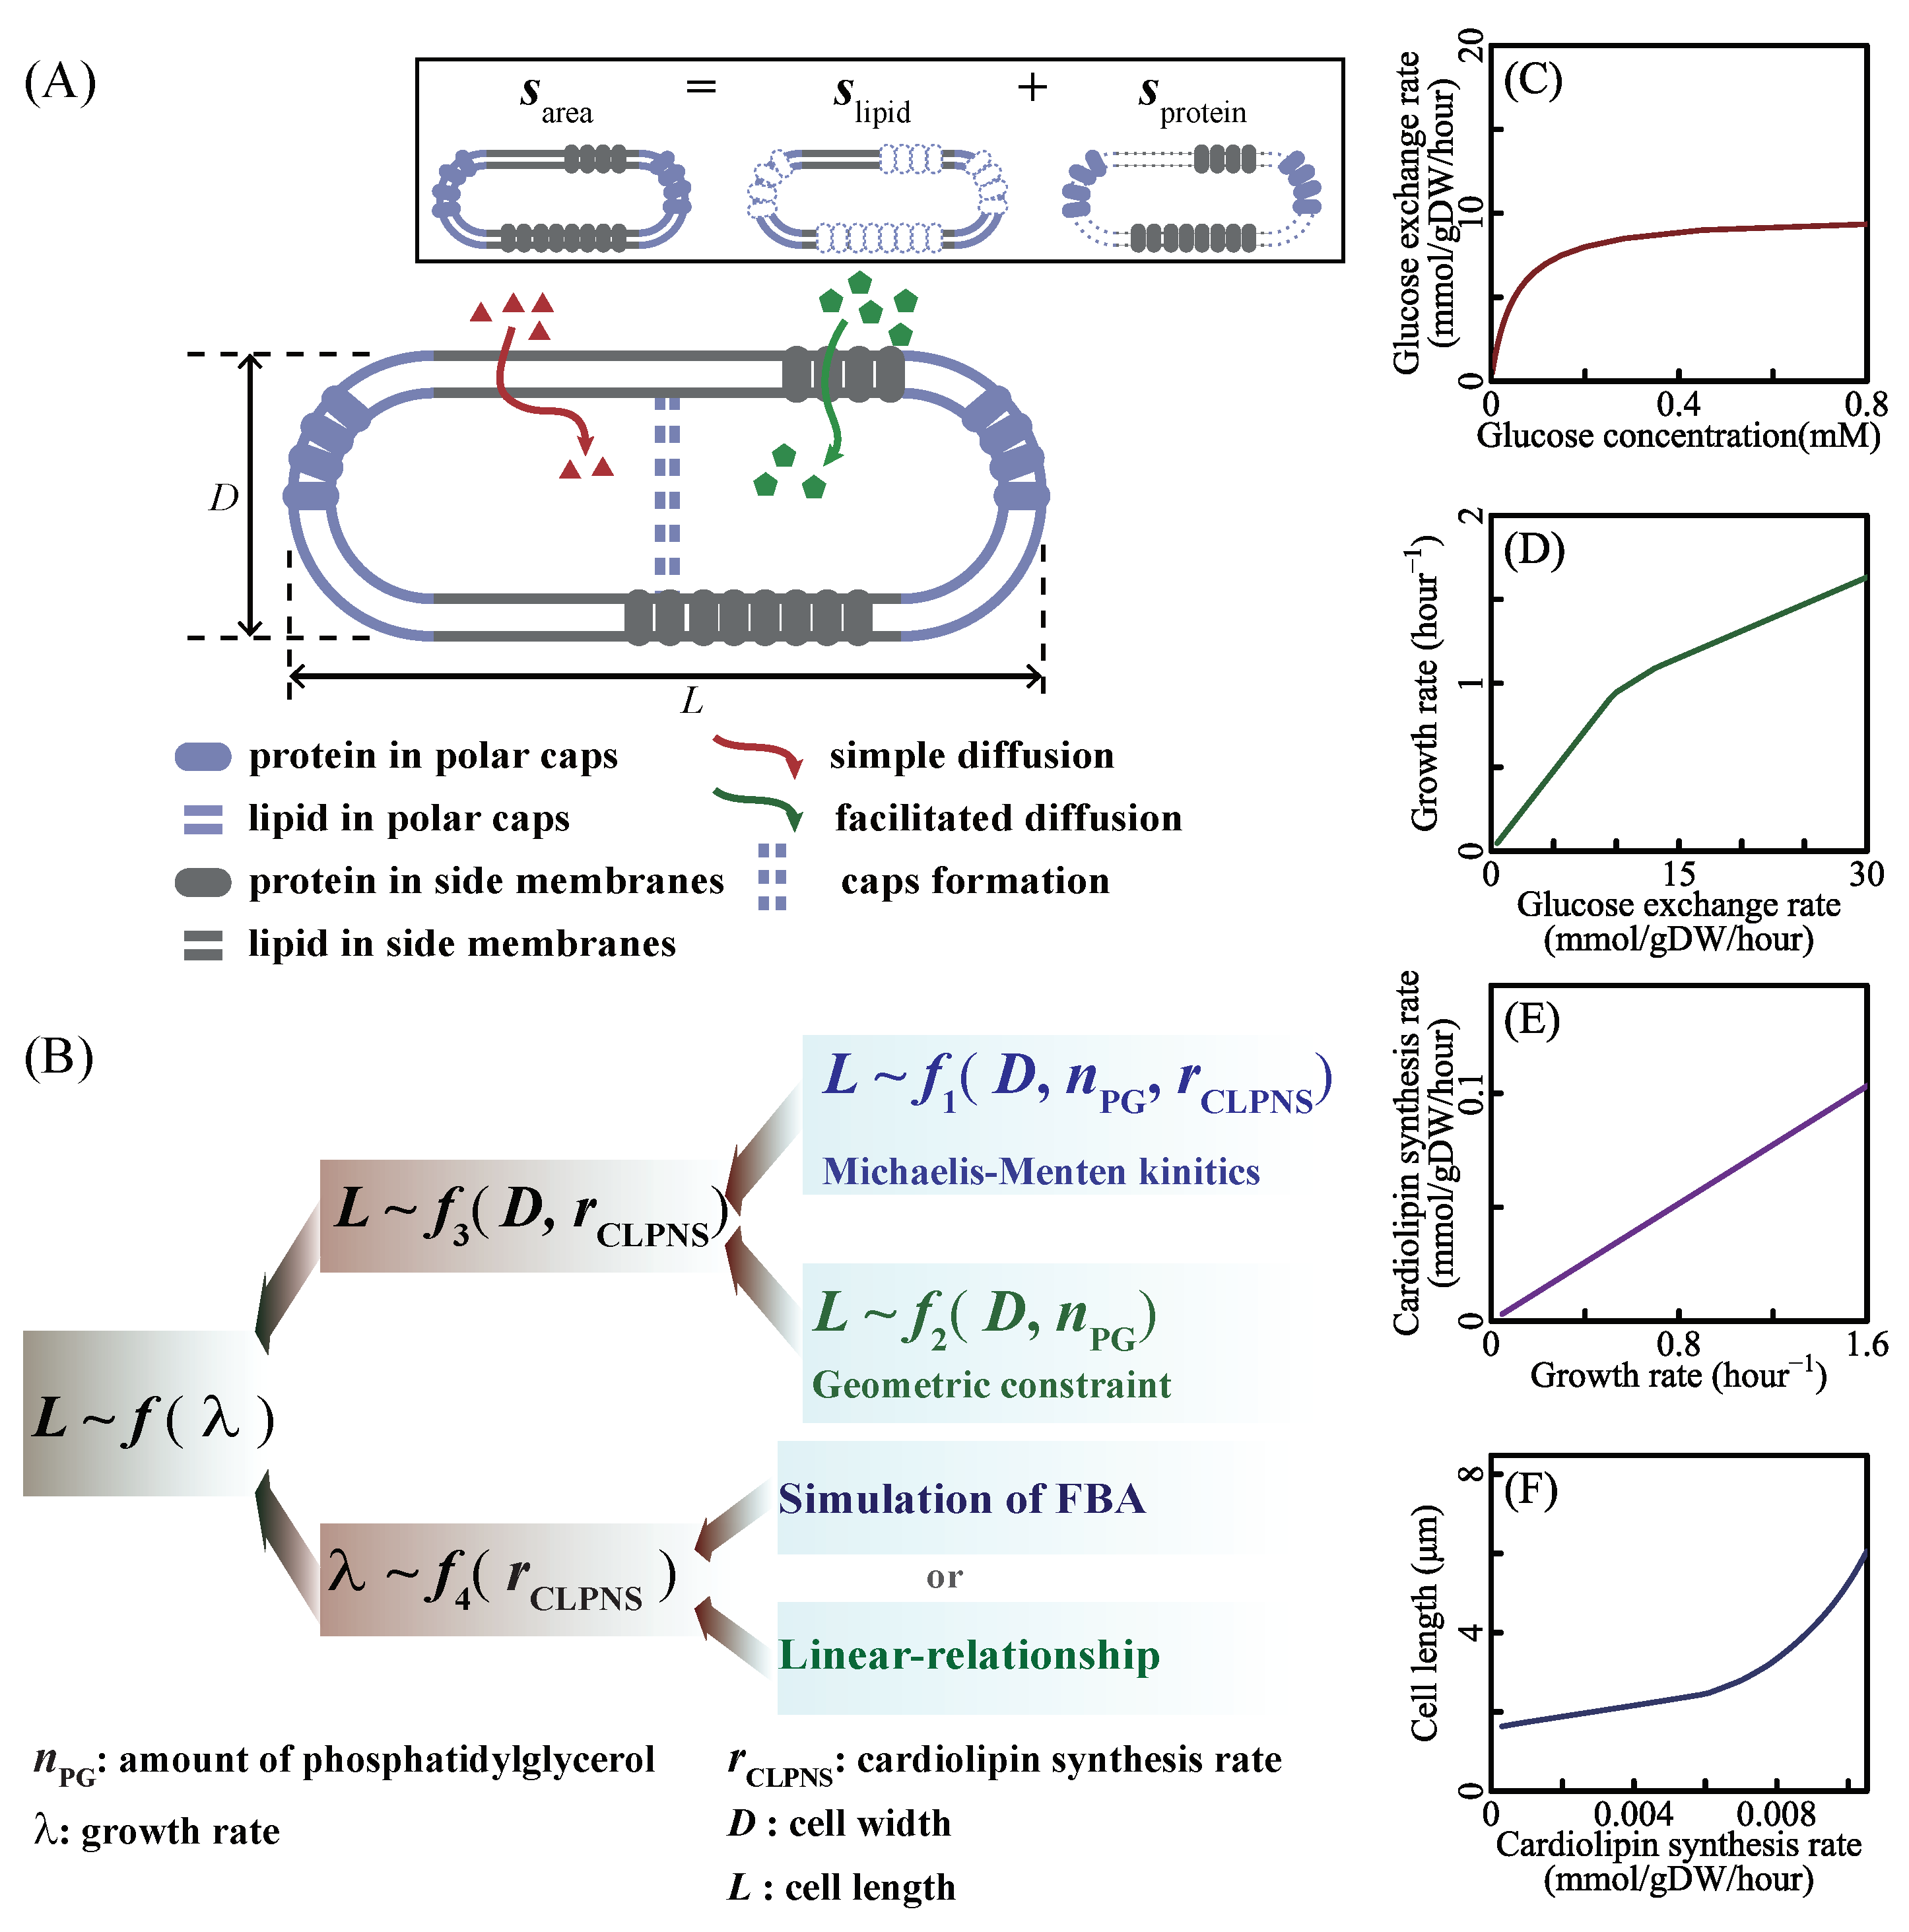
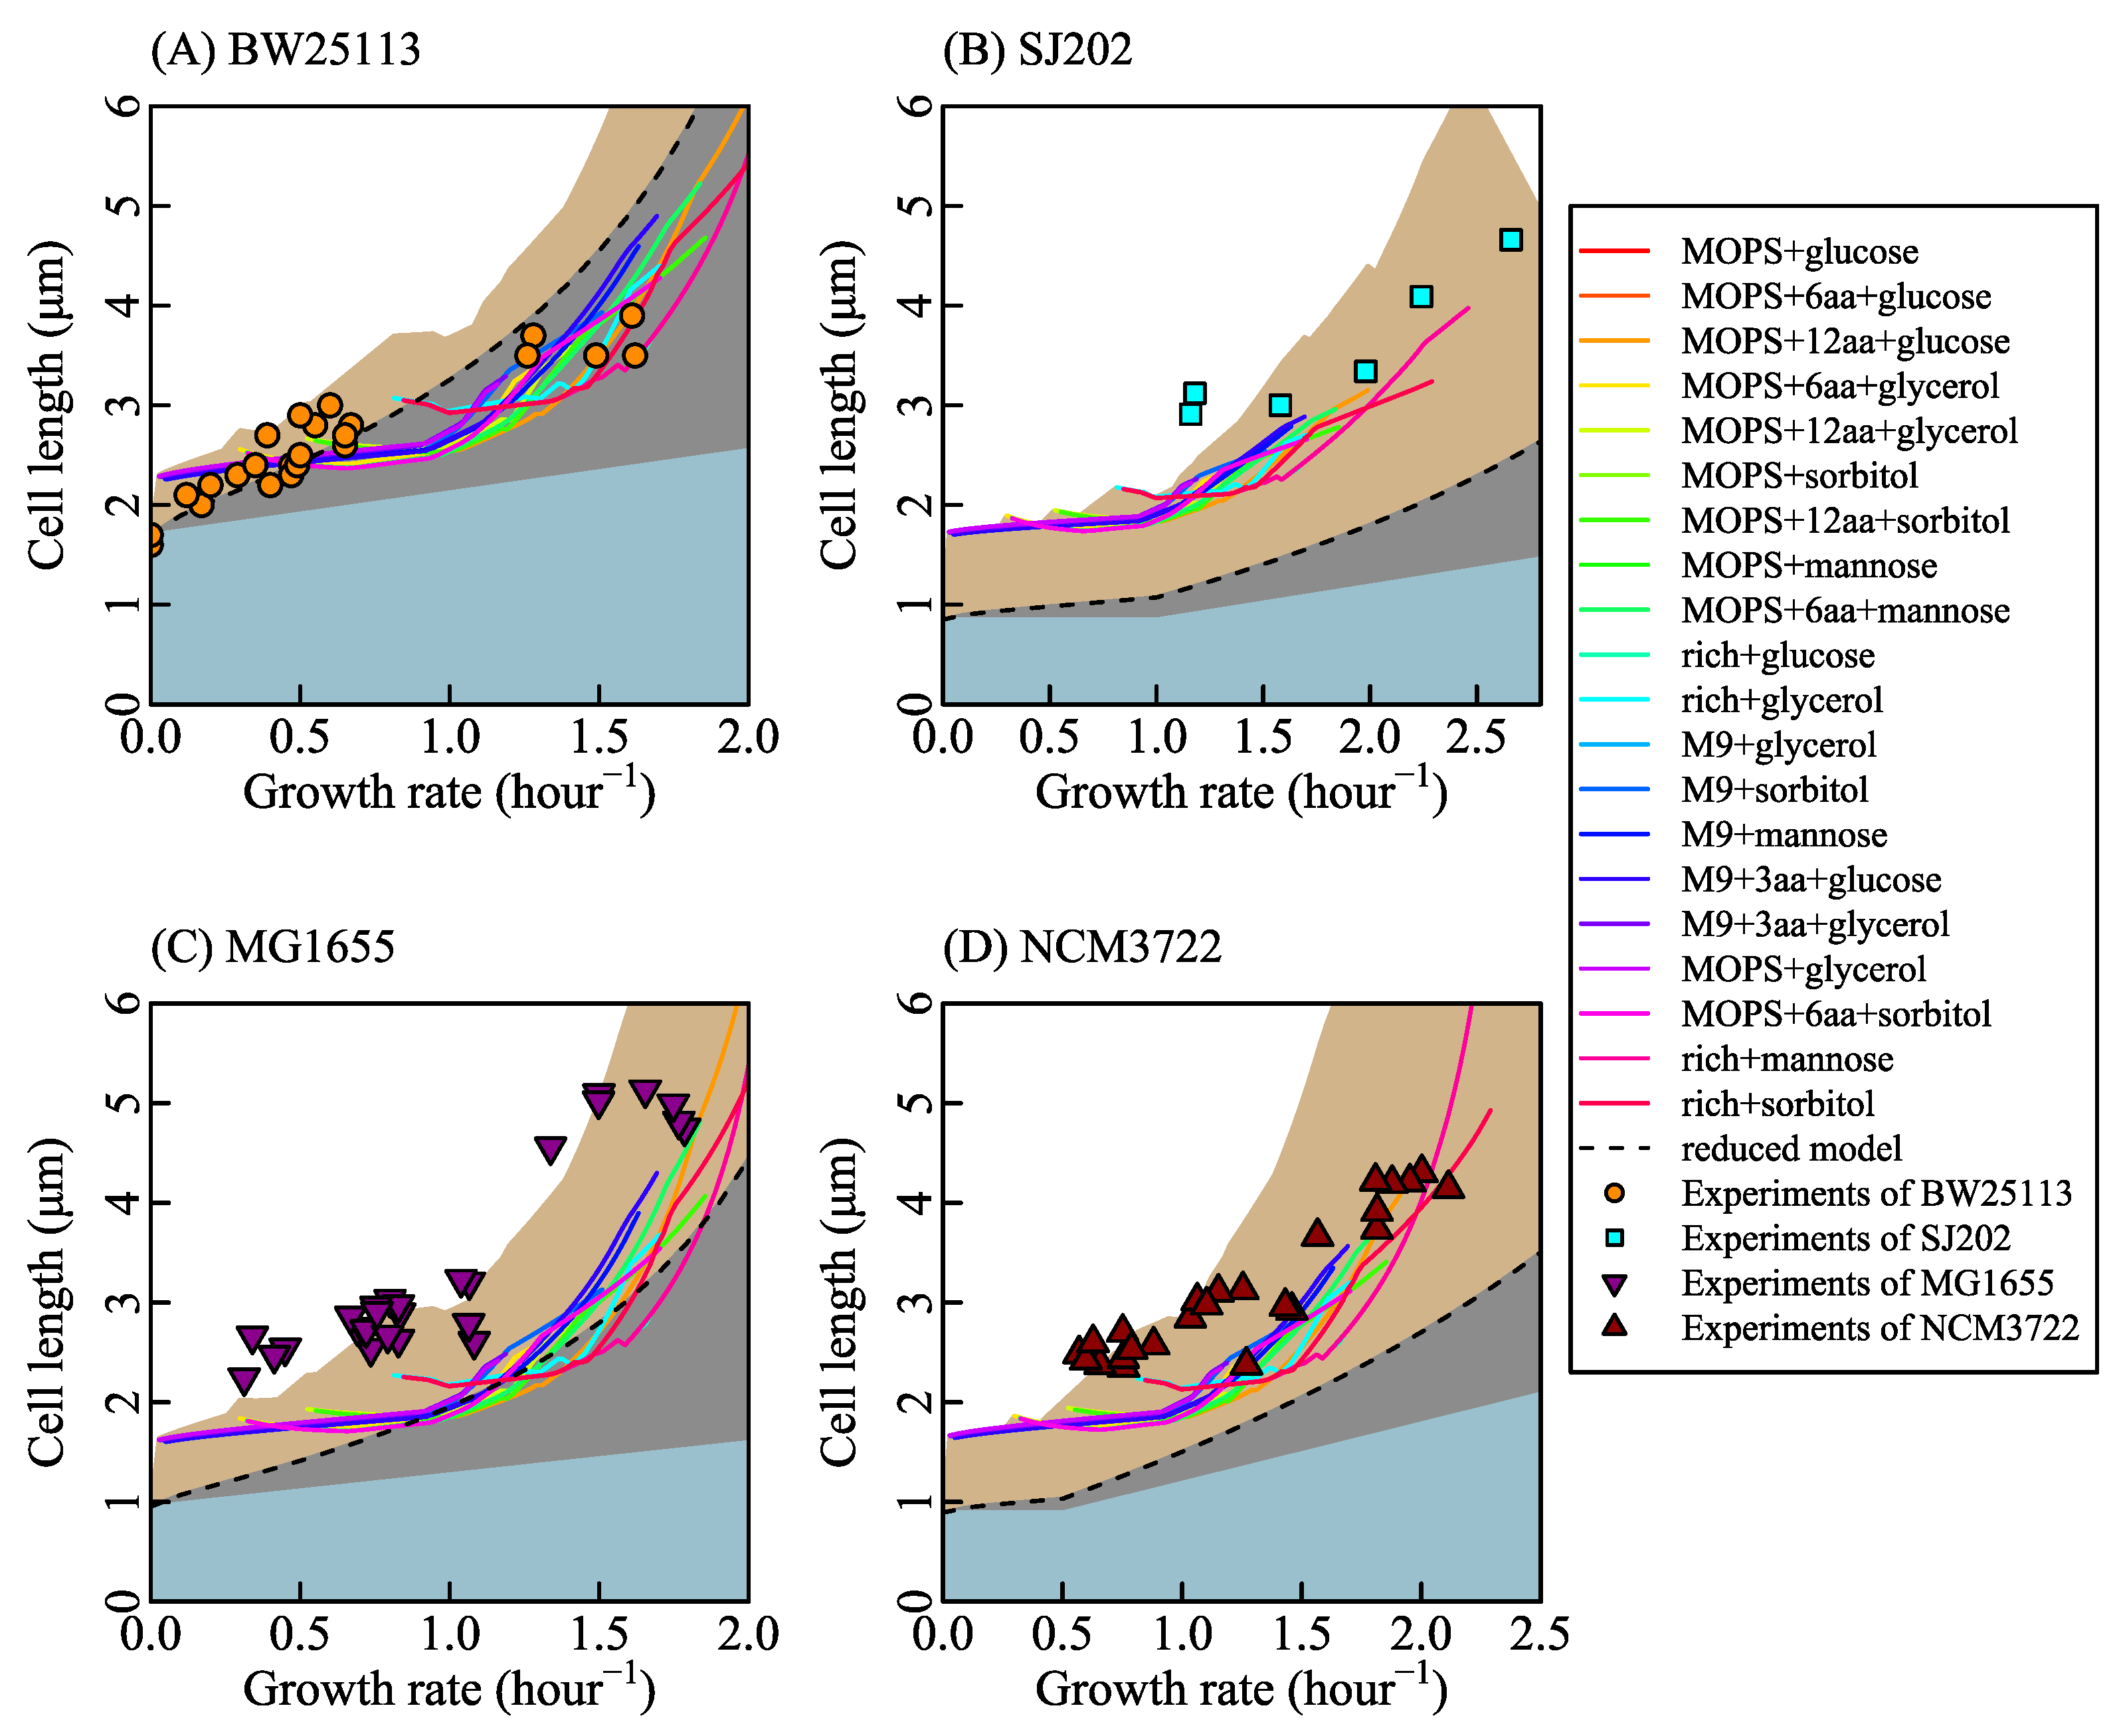
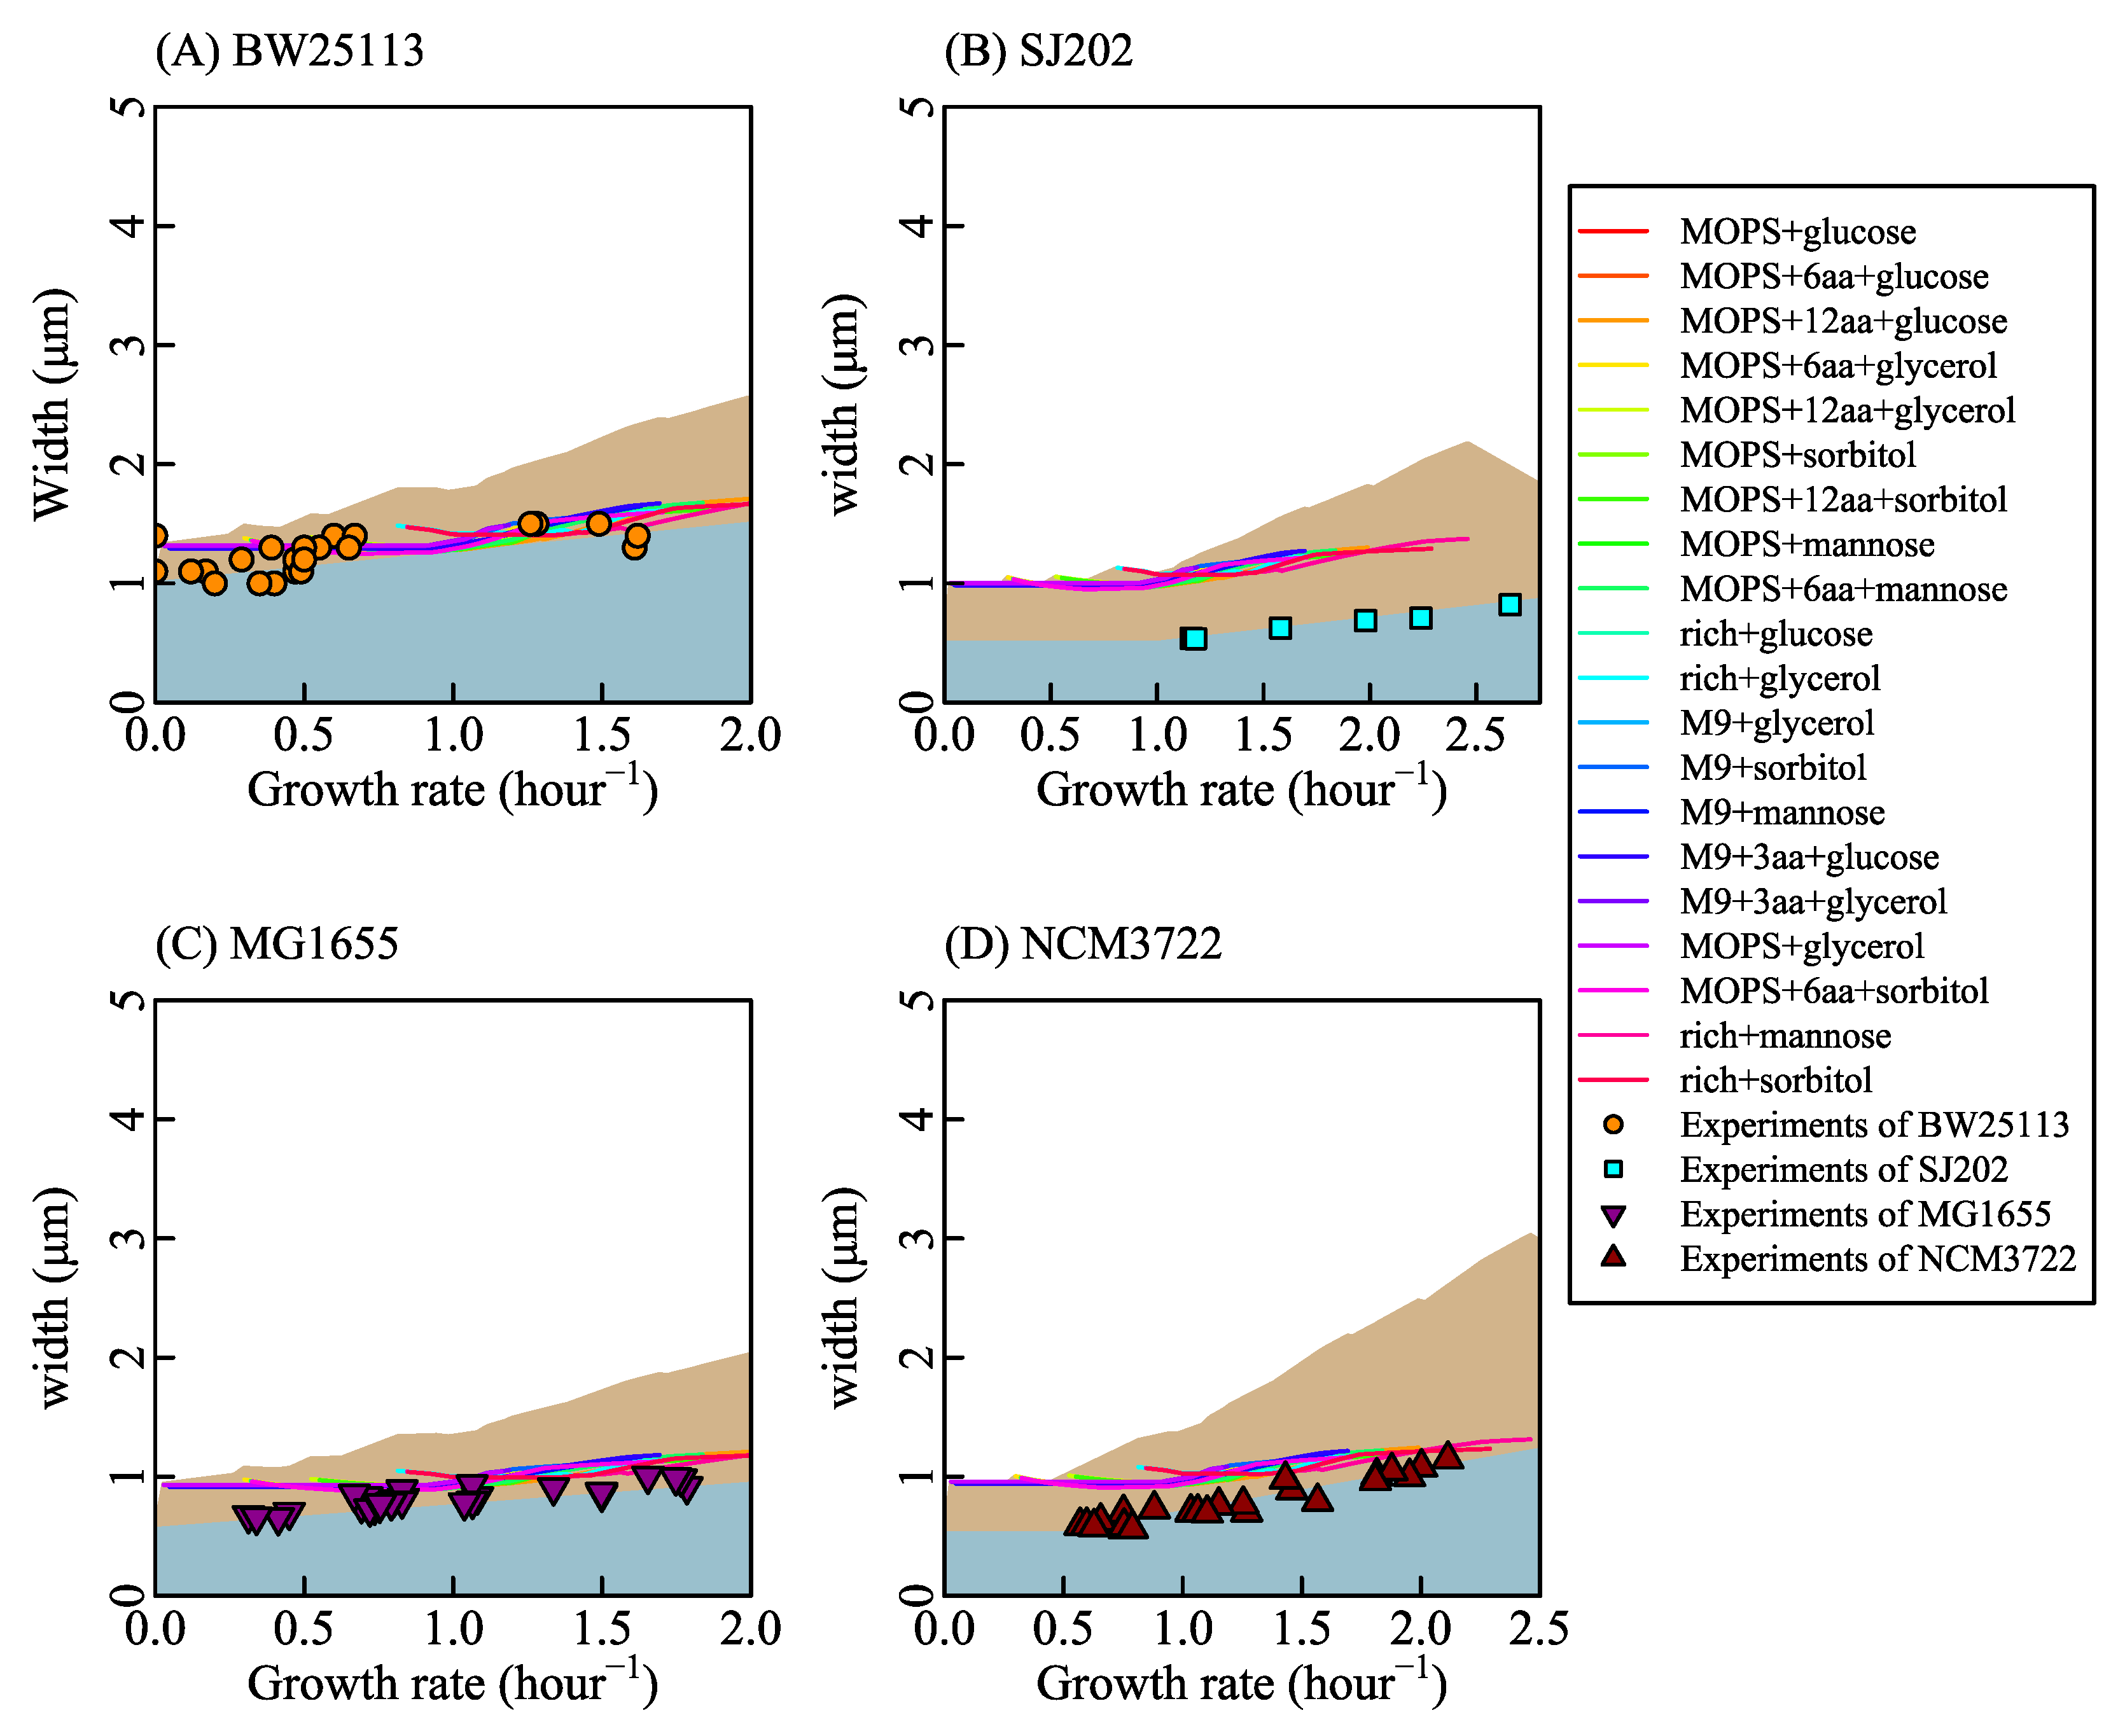
Table 1.
Parameters and variables involved in this work.
| Parameters | Description | Values |
|---|---|---|
| rCLPNS | the cardiolipin biosynthesis rate | from FBA (Section 2.3.1) or as a variable (Section 2.3.2) |
| KM | parameter of Michaelis–Menten kinetics | [62] * |
| Vmax | parameter of Michaelis–Menten kinetics | 0.38 mmol/(gDW·h) for BW25113 [62,69] *; |
| 0.3 mmol/(gDW·h) for MG1655 [62,69] *; | ||
| 0.76 mmol/(gDW·h) for SJ202; | ||
| 0.38 mmol/(gDW·h) for NCM3722 | ||
| sp | average surface area covered by a phospholipid molecule | 0.5 nm2 [54] * |
| fl | the fraction of surface area covered by phospholipid in membranes | from FBA based on Equation (25) |
| coefficient in Equation (24) | 0.5 for iJR904 and 0.22 for iJO1366 based on the experimental data of fl [54,72] * | |
| fPG | ratio of the amount of PG to the amount of all kinds of phospholipid located in the cell side surface | 18% [58] * |
| n0 | average amount of phospholipid in cell caps during a cell cycle | from cell width based on Equation (5) |
| average number of cell caps during a cell cycle | 3.4 (fitting) | |
| D | cell width | fitting the experimental data of cell width [6,9,13] or as a variable |
| C | 2.96 * | |
| H | 1 based on FBA (Section 2.3.1) or as a variable (Section 2.3.2) | |
| E | fitting |
* Obtained from the literature.
© 2020 by the authors. Licensee MDPI, Basel, Switzerland. This article is an open access article distributed under the terms and conditions of the Creative Commons Attribution (CC BY) license (http://creativecommons.org/licenses/by/4.0/).
Share and Cite
MDPI and ACS Style
Zhang, Z.; Zhang, Q.; Guan, S.; Shi, H. Quantitative Connection between Cell Size and Growth Rate by Phospholipid Metabolism. Cells 2020, 9, 391. https://doi.org/10.3390/cells9020391
AMA Style
Zhang Z, Zhang Q, Guan S, Shi H. Quantitative Connection between Cell Size and Growth Rate by Phospholipid Metabolism. Cells. 2020; 9(2):391. https://doi.org/10.3390/cells9020391
Chicago/Turabian StyleZhang, Zhichao, Qing Zhang, Shaohua Guan, and Hualin Shi. 2020. "Quantitative Connection between Cell Size and Growth Rate by Phospholipid Metabolism" Cells 9, no. 2: 391. https://doi.org/10.3390/cells9020391
Note that from the first issue of 2016, this journal uses article numbers instead of page numbers. See further details here.