Genome-Wide Analysis of Long Non-Coding RNA Profiles in Canine Oral Melanomas

 , , ,
, , ,
Abstract
1. Introduction
2. Materials and Methods
2.1. Canine RNA Samples: Extraction and Sequencing
2.2. Analysis by DESeq2 using a Multi-Factor Design including Cell-Type Heterogeneity
2.3. Identification of Human Orthologous lncRNAs
2.4. Weighted Gene Coexpression Network Analysis
2.5. Gene Set Enrichment Analysis
3. Results
3.1. Whole-Transcriptome Sequencing of Oral Melanomas
3.2. Analysis of Differentially Expressed Genes (DEG) in Mucosal Melanomas
3.3. Comparative Genomics of Canine Differentially Expressed lncRNAs
3.4. Inferring Functions of Differentially Expressed lncRNAs
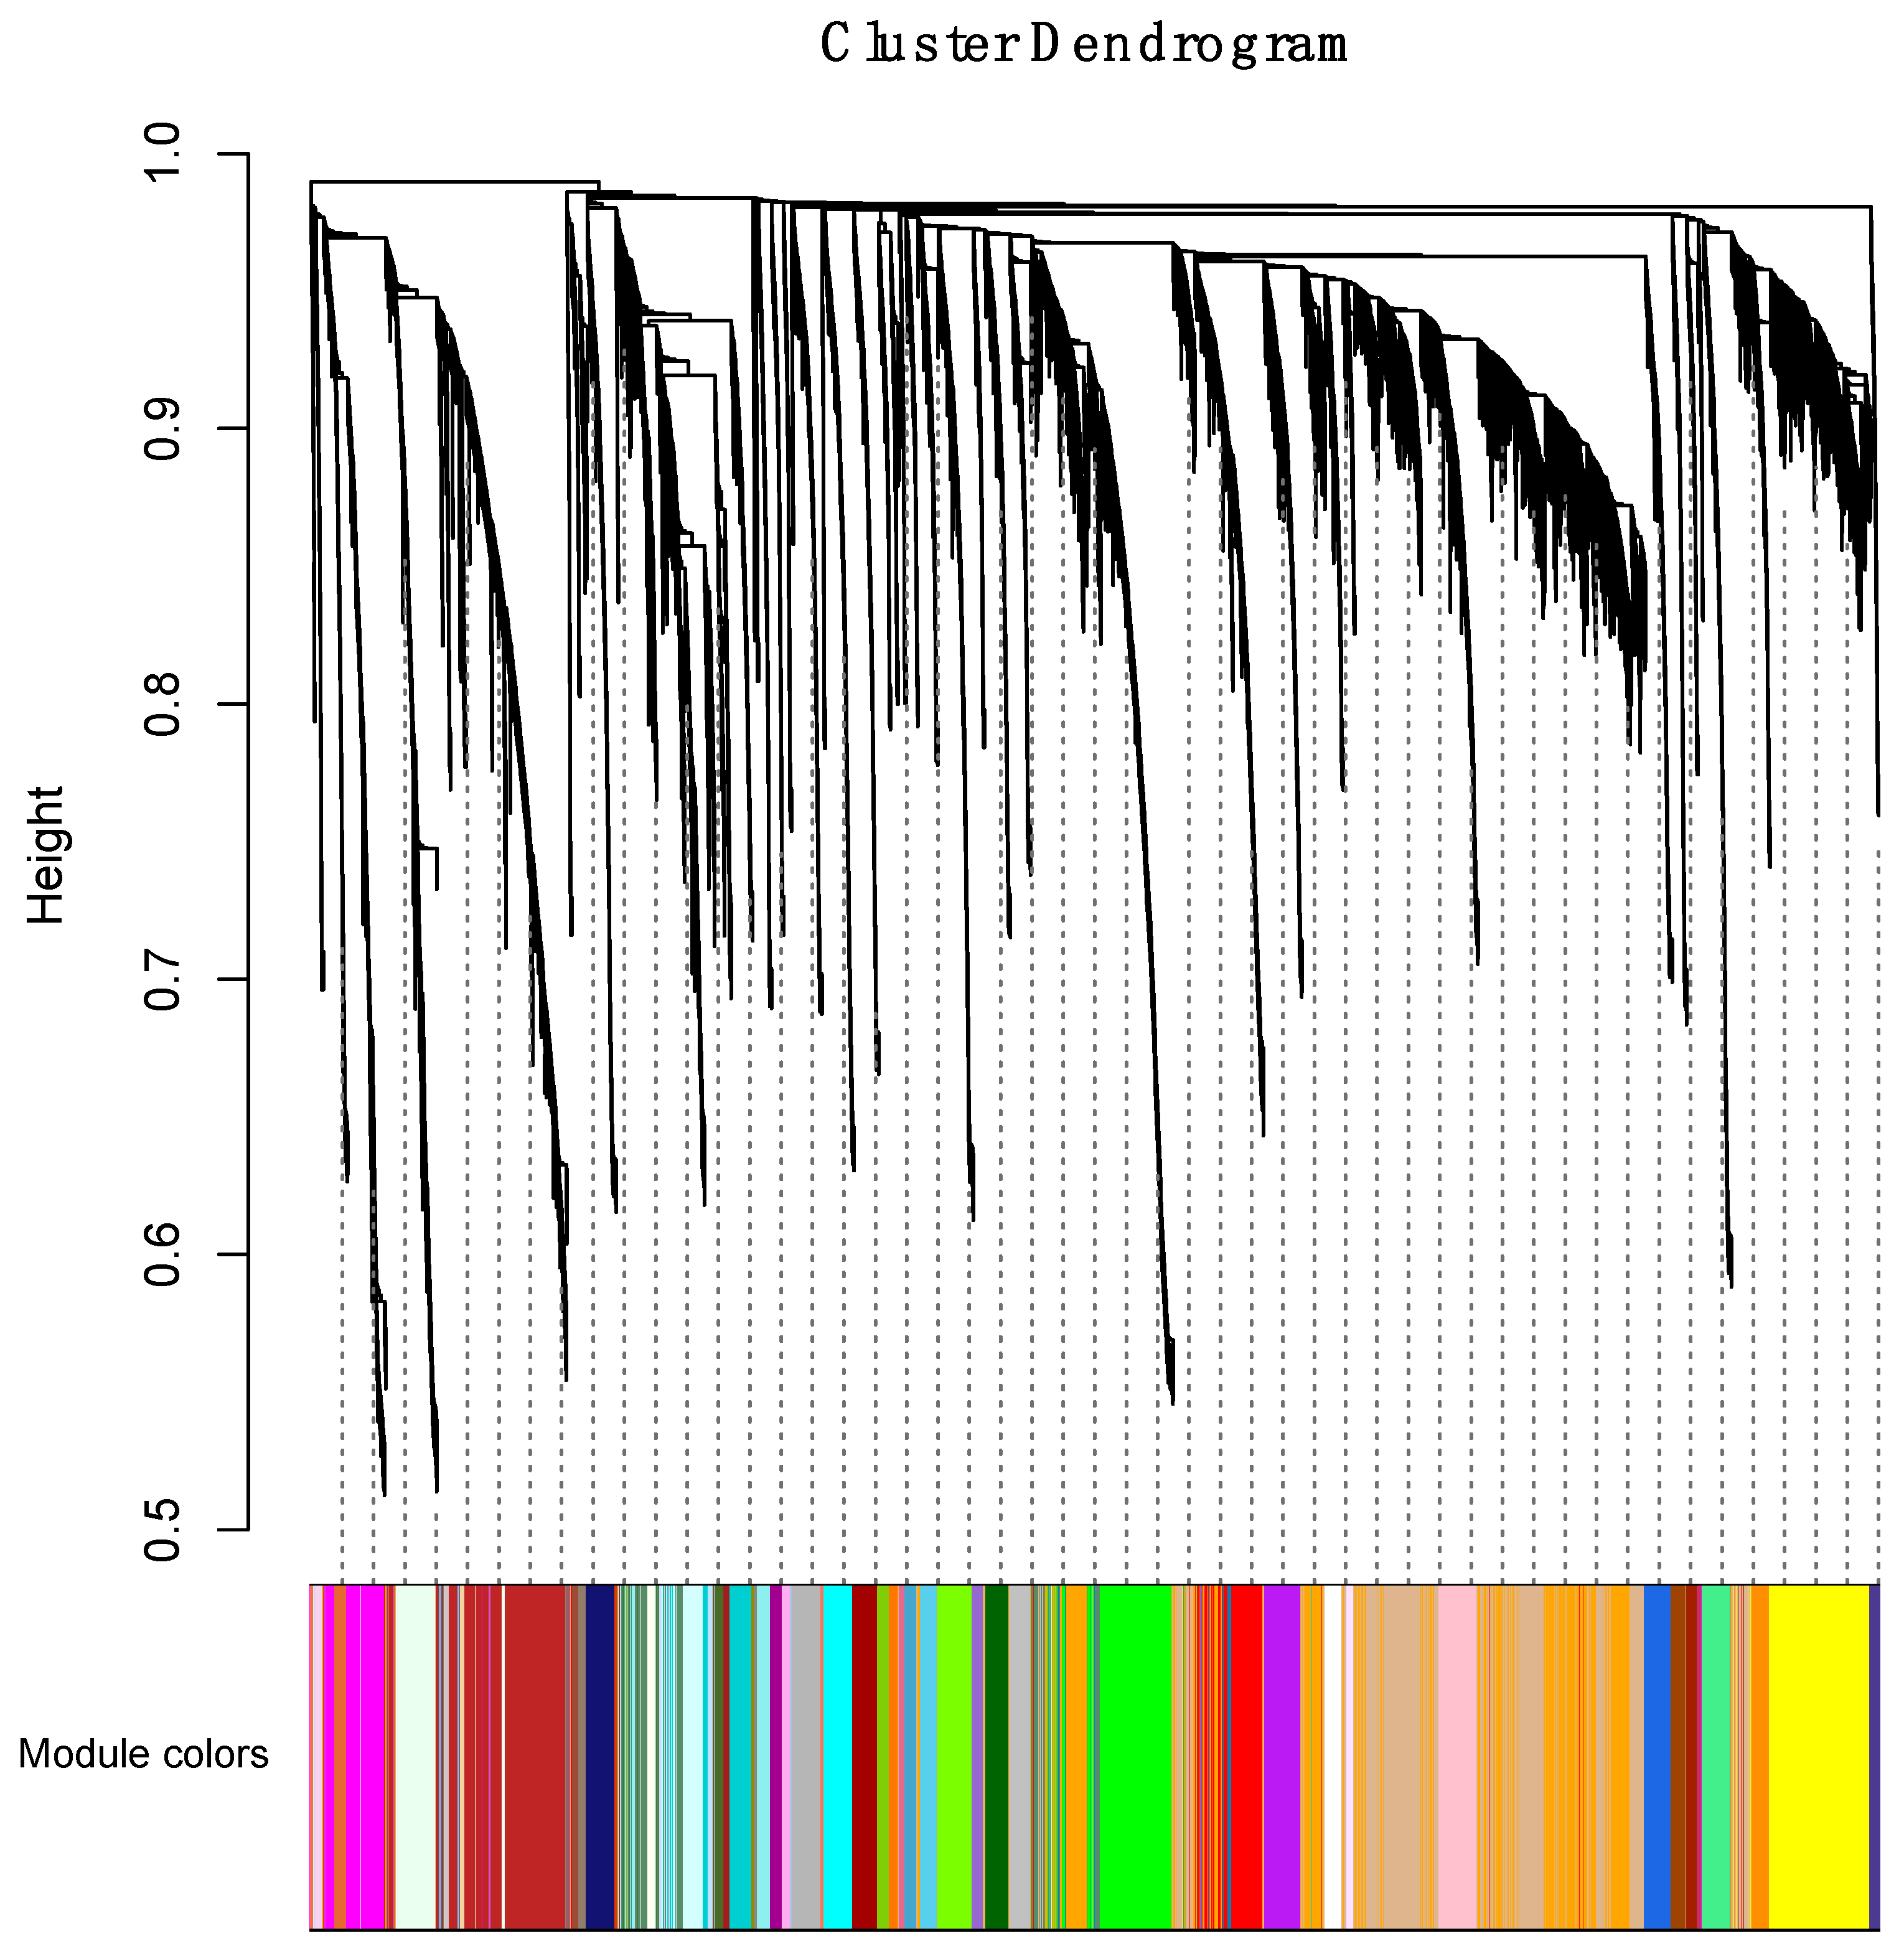
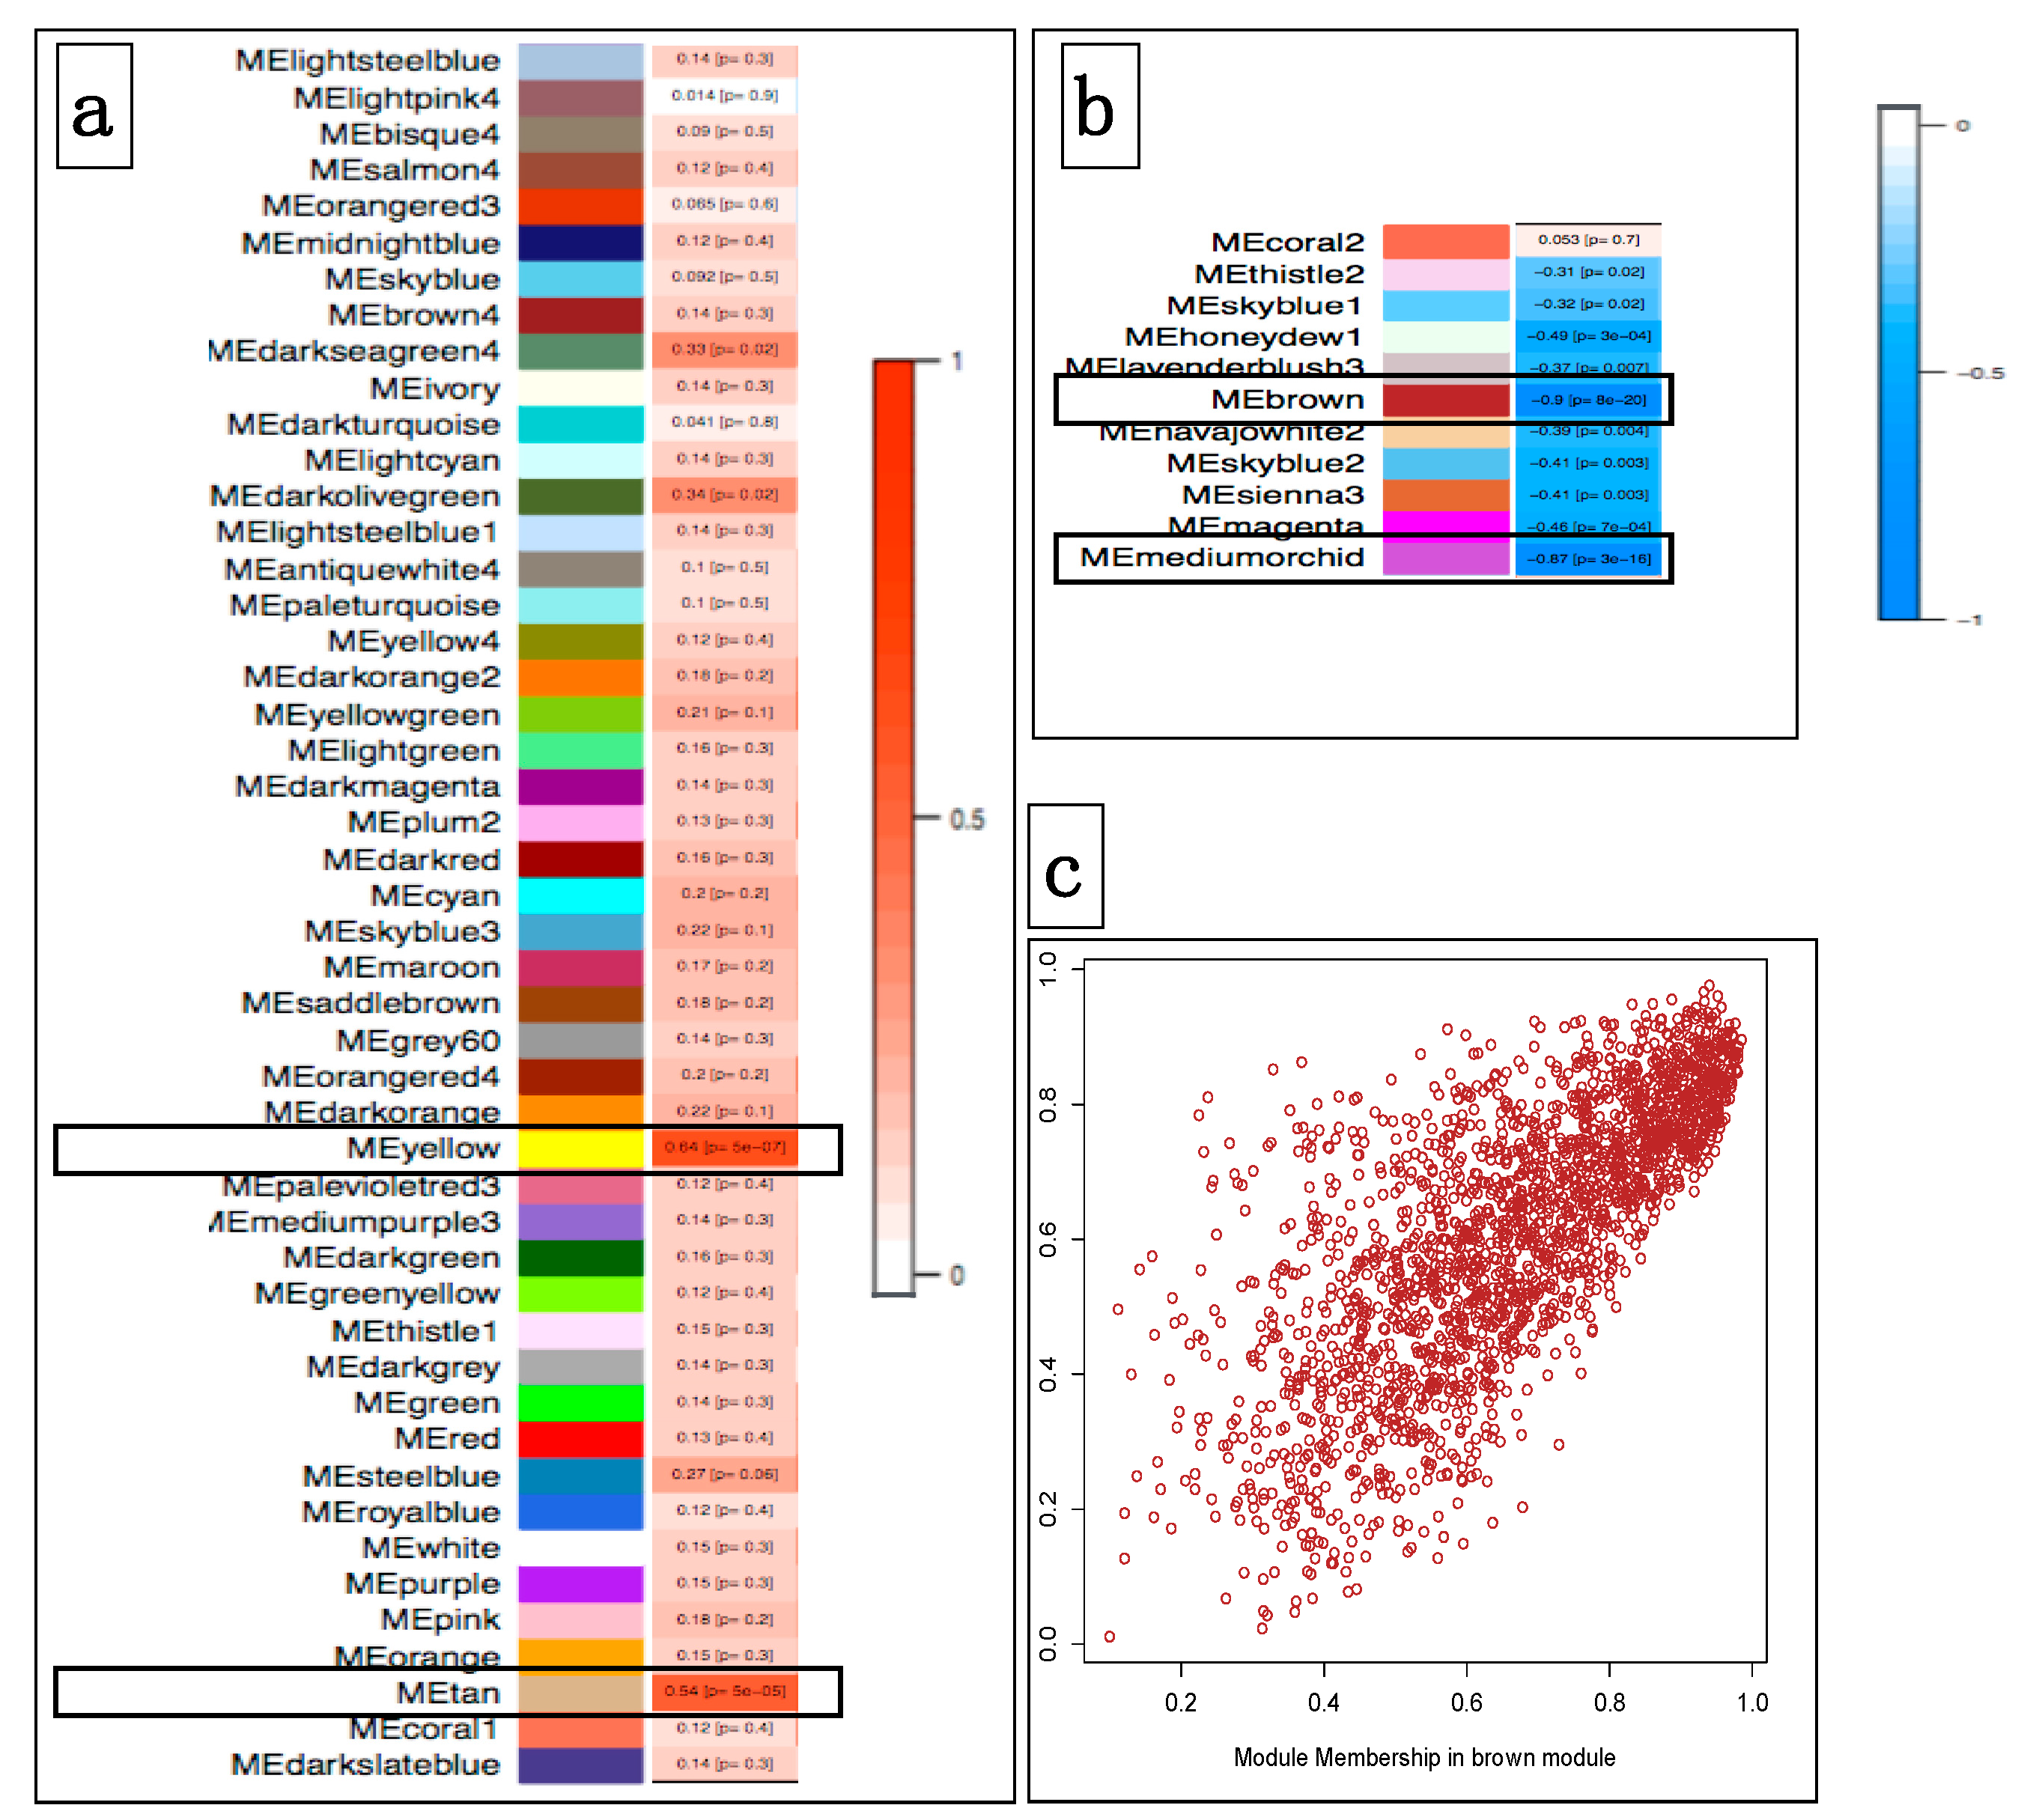
3.4.1. Correlating Transcriptional Networks and Traits using Co-Expression Analysis
3.4.2. Using Transcriptional Networks for Inferring lncRNA Functions
3.4.3. Breed-Specific lncRNAs Associated with Oral Melanoma
4. Discussion and Conclusions
Supplementary Materials
Author Contributions
Funding
Acknowledgments
Conflicts of Interest
References
- Gillard, M.; Cadieu, E.; de Brito, C.; Abadie, J.; Vergier, B.; Devauchelle, P.; Degorce, F.; Dréano, S.; Primot, A.; Dorso, L.; et al. Naturally occurring melanomas in dogs as models for non-UV pathways of human melanomas. Pigment Cell Melanoma Res. 2014, 27, 90–102. [Google Scholar] [CrossRef] [PubMed]
- Hernandez, B.; Adissu, H.; Wei, B.-R.; Michael, H.; Merlino, G.; Simpson, R. Naturally Occurring Canine Melanoma as a Predictive Comparative Oncology Model for Human Mucosal and Other Triple Wild-Type Melanomas. Int. J. Mol. Sci. 2018, 19, 394. [Google Scholar] [CrossRef] [PubMed]
- Wong, K.; van der Weyden, L.; Schott, C.R.; Foote, A.; Constantino-Casas, F.; Smith, S.; Dobson, J.M.; Murchison, E.P.; Wu, H.; Yeh, I.; et al. Cross-species genomic landscape comparison of human mucosal melanoma with canine oral and equine melanoma. Nat. Commun. 2019, 10, 353. [Google Scholar] [CrossRef] [PubMed]
- Hendricks, W.P.D.; Zismann, V.; Sivaprakasam, K.; Legendre, C.; Poorman, K.; Tembe, W.; Perdigones, N.; Kiefer, J.; Liang, W.; DeLuca, V.; et al. Trent, Somatic inactivating PTPRJ mutations and dysregulated pathways identified in canine malignant melanoma by integrated comparative genomic analysis. PLoS Genet. 2018, 14, e1007589. [Google Scholar] [CrossRef] [PubMed]
- Wucher, V.; Legeai, F.; Hédan, B.; Rizk, G.; Lagoutte, L.; Leeb, T.; Jagannathan, V.; Cadieu, E.; David, A.; Lohi, H.; et al. FEELnc: A tool for long non-coding RNA annotation and its application to the dog transcriptome. Nucleic Acids Res. 2017, 45, e57. [Google Scholar] [CrossRef] [PubMed]
- Le Béguec, C.; Wucher, V.; Lagoutte, L.; Cadieu, E.; Botherel, N.; Hédan, B.; de Brito, C.; Guillory, A.-S.; André, C.; Derrien, T.; et al. Characterisation and functional predictions of canine long non-coding RNAs. Sci. Rep. 2018, 8, 13444. [Google Scholar] [CrossRef] [PubMed]
- Carninci, P. The Transcriptional Landscape of the Mammalian Genome. Science 2005, 309, 1559–1563. [Google Scholar] [CrossRef] [PubMed]
- Derrien, T.; Johnson, R.; Bussotti, G.; Tanzer, A.; Djebali, S.; Tilgner, H.; Guernec, G.; Merkel, A.; Gonzalez, D.; Lagarde, J.; et al. The GENCODE v7 catalogue of human long non-coding RNAs: Analysis of their structure, evolution and expression. Genome Res. 2012, 22, 1775–1789. [Google Scholar] [CrossRef]
- Djebali, S.; Davis, C.A.; Merkel, A.; Dobin, A.; Lassmann, T.; Mortazavi, A.; Tanzer, A.; Lagarde, J.; Lin, W.; Schlesinger, F.; et al. Landscape of transcription in human cells. Nature 2012, 489, 101–108. [Google Scholar] [CrossRef]
- Lanzós, A.; Carlevaro-Fita, J.; Mularoni, L.; Reverter, F.; Palumbo, E.; Guigó, R.; Johnson, R. Discovery of Cancer Driver Long Noncoding RNAs across 1112 Tumour Genomes: New Candidates and Distinguishing Features. Sci. Rep. 2017, 7, 41544. [Google Scholar] [CrossRef] [PubMed]
- Hosono, Y.; Niknafs, Y.S.; Prensner, J.R.; Iyer, M.K.; Dhanasekaran, S.M.; Mehra, R.; Pitchiaya, S.; Tien, J.; Escara-Wilke, J.; Poliakov, A.; et al. Oncogenic Role of THOR, a Conserved Cancer/Testis Long Non-coding RNA. Cell 2017, 171, 1559–1572. [Google Scholar] [CrossRef] [PubMed]
- Wang, Z.; Yang, B.; Zhang, M.; Guo, W.; Wu, Z.; Wang, Y.; Jia, L.; Li, S.; Xie, W.; Yang, D.S. lncRNA epigenetic landscape analysis identifies EPIC1 as an oncogenic lncRNA that interacts with MYC and promotes cell-cycle progression in cancer. Cancer Cell 2018, 33, 706–720. [Google Scholar] [CrossRef] [PubMed]
- Leucci, E.; Coe, E.A.; Marine, J.-C.; Vance, K.W. The emerging role of long non-coding RNAs in cutaneous melanoma. Pigment Cell Melanoma Res. 2016, 29, 619–626. [Google Scholar] [CrossRef] [PubMed]
- Khaitan, D.; Dinger, M.E.; Mazar, J.; Crawford, J.; Smith, M.A.; Mattick, J.S.; Perera, R.J. The melanoma-upregulated long noncoding RNA SPRY4-IT1 modulates apoptosis and invasion. Cancer Res. 2011, 71, 3852–3862. [Google Scholar] [CrossRef] [PubMed]
- Leucci, E.; Vendramin, R.; Spinazzi, M.; Laurette, P.; Fiers, M.; Wouters, J.; Radaelli, E.; Eyckerman, S.; Leonelli, C.; Vanderheyden, K.; et al. Melanoma addiction to the long non-coding RNA SAMMSON. Nature 2016, 531, 518–522. [Google Scholar] [CrossRef] [PubMed]
- Lindblad-Toh, K.; Members, B.S.P.; Wade, C.M.; Mikkelsen, T.S.; Karlsson, E.K.; Jaffe, D.B.; Kamal, M.; Clamp, M.; Chang, J.L.; Kulbokas, E.J.; et al. Genome sequence, comparative analysis and haplotype structure of the domestic dog. Nature 2005, 438, 803–819. [Google Scholar] [CrossRef] [PubMed]
- Djebali, S.; Wucher, V.; Foissac, S.; Hitte, C.; Corre, E.; Derrien, T. Bioinformatics Pipeline for Transcriptome Sequencing Analysis. Methods Mol. Biol. 2017, 1486, 201–219. [Google Scholar] [CrossRef]
- Dobin, A.; Davis, C.A.; Schlesinger, F.; Drenkow, J.; Zaleski, C.; Jha, S.; Batut, P.; Chaisson, M.; Gingeras, T.R. STAR: Ultrafast universal RNA-seq aligner. Bioinformatics 2013, 29, 15–21. [Google Scholar] [CrossRef]
- Li, B.; Dewey, C.N. RSEM: Accurate transcript quantification from RNA-Seq data with or without a reference genome. BMC Bioinform. 2011, 12, 323. [Google Scholar] [CrossRef]
- Anders, S.; Huber, W. Differential expression analysis for sequence count data. Genome Biol. 2010, 11, R106. [Google Scholar] [CrossRef]
- Aran, D.; Hu, Z.; Butte, A.J. xCell: Digitally portraying the tissue cellular heterogeneity landscape. Genome Biol. 2017, 18, 220. [Google Scholar] [CrossRef] [PubMed]
- Zhu, A.; Ibrahim, J.G.; Love, M.I. Heavy-tailed prior distributions for sequence count data: Removing the noise and preserving large differences. Bioinformatics 2018, 35, 2084–2092. [Google Scholar] [CrossRef]
- Li, H. Minimap2: Pairwise alignment for nucleotide sequences. Bioinformatics 2018, 34, 3094–3100. [Google Scholar] [CrossRef] [PubMed]
- Harrow, J.; Frankish, A.; González, J.M.; Tapanari, E.; Diekhans, M.; Kokocinski, F.; Aken, B.L.; Barrell, D.; Zadissa, A.; Searle, S.; et al. GENCODE: The reference human genome annotation for The ENCODE Project. Genome Res. 2012, 22, 1760–1774. [Google Scholar] [CrossRef]
- Quinlan, A.R.; Hall, I.M. BEDTools: A flexible suite of utilities for comparing genomic features. Bioinformatics 2010, 26, 841–842. [Google Scholar] [CrossRef] [PubMed]
- Langfelder, P.; Horvath, S. WGCNA: An R package for weighted correlation network analysis. BMC Bioinform. 2008, 9, 559. [Google Scholar] [CrossRef] [PubMed]
- Subramanian, A.; Tamayo, P.; Mootha, V.K.; Mukherjee, S.; Ebert, B.L.; Gillette, M.A.; Paulovich, A.; Pomeroy, S.L.; Golub, T.R.; Lander, E.S.; et al. Gene Set Enrichment Analysis: A Knowledge-Based Approach for Interpreting Genome-Wide Expression Profiles 2005. Available online: www.pnas.orgcgidoi10.1073pnas.0506580102 (accessed on 15 April 2019).
- Hayward, N.K.; Wilmott, J.S.; Waddell, N.; Johansson, P.A.; Field, M.A.; Nones, K.; Patch, A.M.; Kakavand, H.; Alexandrov, L.B.; Burke, H.; et al. Whole-genome landscapes of major melanoma subtypes. Nature 2017, 545, 175–180. [Google Scholar] [CrossRef]
- Beltran, M.; Puig, I.; Peña, C.; García, J.M.; Alvarez, A.B.; Peña, R.; Bonilla, F.; de Herreros, A.G. A natural antisense transcript regulates Zeb2/Sip1 gene expression during Snail1-induced epithelial-mesenchymal transition. Genes Dev. 2008, 22, 756–769. [Google Scholar] [CrossRef]
- Yang, C.-M.; Wang, T.-H.; Chen, H.-C.; Li, S.-C.; Lee, M.-C.; Liou, H.-H.; Liu, P.-F.; Tseng, Y.-K.; Shiue, Y.-L.; Ger, L.-P.; et al. Aberrant DNA hypermethylation-silenced SOX21-AS1 gene expression and its clinical importance in oral cancer. Clin. Epigenet. 2016, 8, 129. [Google Scholar] [CrossRef]
- Lessard, L.; Liu, M.; Marzese, D.M.; Wang, H.; Chong, K.; Kawas, N.; Donovan, N.C.; Kiyohara, E.; Hsu, S.; Nelson, N.; et al. The CASC15 Long Intergenic Noncoding RNA Locus Is Involved in Melanoma Progression and Phenotype Switching. J. Investig. Dermatol. 2015, 135, 2464–2474. [Google Scholar] [CrossRef]
- Guttman, M.; Amit, I.; Garber, M.; French, C.; Lin, M.F.; Feldser, D.; Huarte, M.; Zuk, O.; Carey, B.W.; Cassady, J.P.; et al. Chromatin signature reveals over a thousand highly conserved large non-coding RNAs in mammals. Nature 2009, 458, 223–227. [Google Scholar] [CrossRef] [PubMed]
- Closa, A.; Cordero, D.; Sanz-Pamplona, R.; Solé, X.; Crous-Bou, M.; Paré-Brunet, L.; Berenguer, A.; Guino, E.; Lopez-Doriga, A.; Guardiola, J.; et al. Identification of candidate susceptibility genes for colorectal cancer through eQTL analysis. Carcinogenesis 2014, 35, 2039–2046. [Google Scholar] [CrossRef] [PubMed]
- Iyer, M.K.; Niknafs, Y.S.; Malik, R.; Singhal, U.; Sahu, A.; Hosono, Y.; Barrette, T.R.; Prensner, J.R.; Evans, J.R.; Zhao, S.; et al. The landscape of long noncoding RNAs in the human transcriptome. Nat. Genet. 2015, 47, 199–208. [Google Scholar] [CrossRef] [PubMed]
- Chiu, H.-S.; Somvanshi, S.; Patel, E.; Chen, T.-W.; Singh, V.P.; Zorman, B.; Patil, S.L.; Pan, Y.; Chatterjee, S.S.; Sood, A.K.; et al. Pan-Cancer Analysis of lncRNA Regulation Supports Their Targeting of Cancer Genes in Each Tumor Context. Cell Rep. 2018, 23, 297–312. [Google Scholar] [CrossRef] [PubMed]
- Esposito, R.; Bosch, N.; Lanzós, A.; Polidori, T.; Pulido-Quetglas, C.; Johnson, R. Hacking the Cancer Genome: Profiling Therapeutically Actionable Long Non-coding RNAs Using CRISPR-Cas9 Screening. Cancer Cell 2019, 35, 545–557. [Google Scholar] [CrossRef] [PubMed]
- Tirosh, I.; Izar, B.; Prakadan, S.M.; Wadsworth, M.H.; Treacy, D.; Trombetta, J.J.; Rotem, A.; Rodman, C.; Lian, C.; Murphy, G.; et al. Dissecting the multicellular ecosystem of metastatic melanoma by single-cell RNA-seq. Science 2016, 325, 189–196. [Google Scholar] [CrossRef]
- Liu, S.J.; Nowakowski, T.J.; Pollen, A.A.; Lui, J.H.; Horlbeck, M.A.; Attenello, F.J.; He, D.; Weissman, J.S.; Kriegstein, A.R.; Diaz, A.A.; et al. Single-cell analysis of long non-coding RNAs in the developing human neocortex. Genome Biol. 2006, 17, 67. [Google Scholar] [CrossRef] [PubMed]
- Qi, P.; Zhou, X.; Du, X. Circulating long non-coding RNAs in cancer: Current status and future perspectives. Mol. Cancer 2016, 15, 39. [Google Scholar] [CrossRef] [PubMed]
- Klement, R.J.; Kämmerer, U. Is there a role for carbohydrate restriction in the treatment and prevention of cancer? Nutr. Metab. 2011, 8, 75. [Google Scholar] [CrossRef] [PubMed]
- Rawlings-Goss, R.A.; Campbell, M.C.; Tishkoff, S.A. Global population-specific variation in miRNA associated with cancer risk and clinical biomarkers. BMC Med. Genomics 2014, 7, 53. [Google Scholar] [CrossRef]


| canfam3.1+_id | Dog EnsEMBL ID | Dog Gene Biotype | lFC | Human Gene Name | Dog/Human Identity |
|---|---|---|---|---|---|
| RLOC_00034858 | NA | lincRNA | −3.693 | AC016903.1 | 0.770 |
| RLOC_00028807 | NA | antisense | −3.409 | AC010503.4 | 0.740 |
| RLOC_00001518 | NA | lincRNA | −3.055 | EPHA1-AS1 | 0.717 |
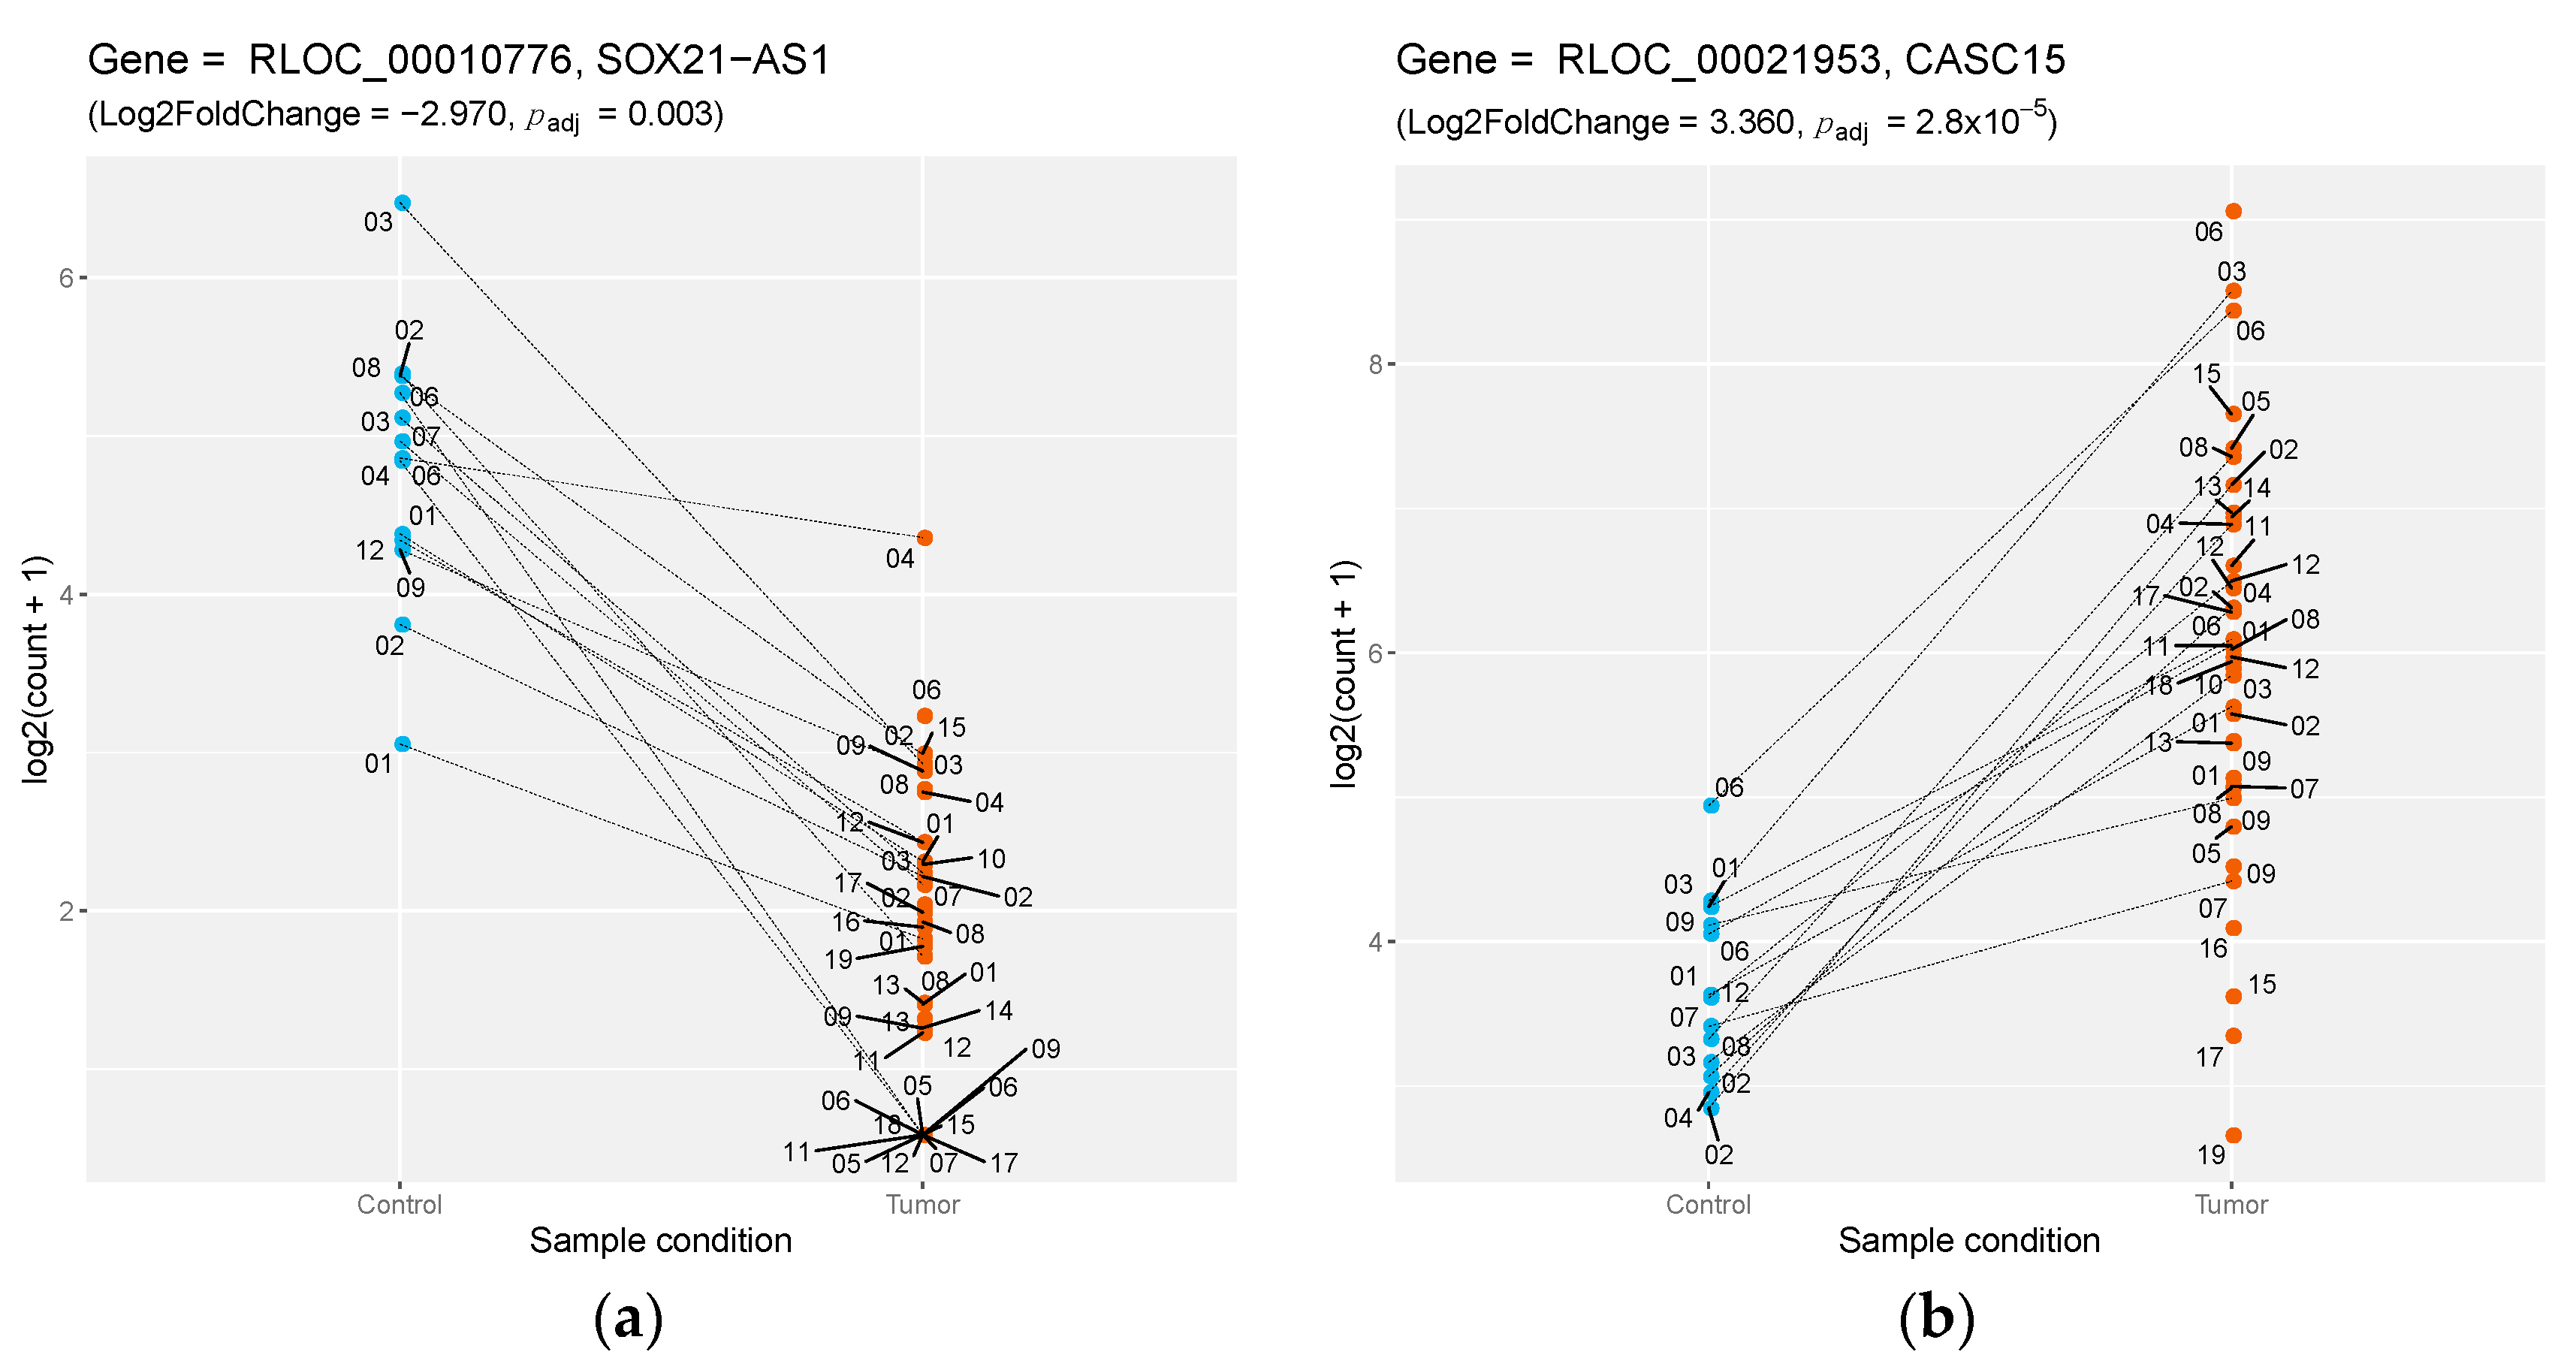
| RLOC_00010776 | NA | lincRNA | −2.974 | SOX21-AS1 | 0.732 |
| RLOC_00026330 | NA | lincRNA | −2.669 | MIR29B2CHG | 0.804 |
| RLOC_00030709 | NA | antisense | −2.659 | LINC02586 | 0.709 |
| RLOC_00012258 | NA | lincRNA | −2.258 | TOB1-AS1 | 0.717 |
| RLOC_00019548 | NA | lincRNA | −2.214 | AL049536.1 | 0.768 |
| RLOC_00015465 | NA | lincRNA | −2.201 | LINC01588 | 0.794 |
| RLOC_00011768 | NA | antisense | −2.050 | AC005821.1 | 0.714 |
| RLOC_00011720 | NA | antisense | −1.597 | LINC02079 | 0.969 |
| RLOC_00014809 | NA | lincRNA | 1.698 | AC062015.1 | 0.923 |
| RLOC_00002398 | NA | antisense | 1.782 | NR2F1-AS1 | 0.820 |
| RLOC_00032616 | NA | lincRNA | 1.868 | HOXD-AS2 | 0.754 |
| RLOC_00023326 | NA | antisense | 1.989 | RASSF8-AS1 | 0.713 |
| RLOC_00032620 | NA | antisense | 2.030 | HAGLR | 0.786 |
| RLOC_00020381 | NA | lincRNA | 2.188 | TRAM2-AS1 | 0.745 |
| RLOC_00024264 | NA | lincRNA | 2.634 | AC133644.3 | 0.979 |
| RLOC_00021953 | NA | lincRNA | 3.359 | CASC15 | 0.942 |
| RLOC_00011077 | NA | lincRNA | 3.673 | LINC01301 | 0.780 |
| RLOC_00008433 | ENSCAFG00000028700 (ZEB2-AS1) | lincRNA | 3.796 | ZEB2-AS1 | 0.839 |
| RLOC_00013073 | NA | lincRNA | 3.797 | AC006450.3 | 0.746 |
| RLOC_00018365 | NA | lincRNA | 4.403 | AC090692.1 | 0.755 |
| RLOC_00022953 | NA | antisense | 4.910 | HOXC-AS3 | 0.757 |
| RLOC_00002254 | NA | antisense | 4.958 | STARD4-AS1 | 0.903 |
| RLOC_00025419 | NA | lincRNA | 5.758 | SNAP25-AS1 | 0.987 |
© 2019 by the authors. Licensee MDPI, Basel, Switzerland. This article is an open access article distributed under the terms and conditions of the Creative Commons Attribution (CC BY) license (http://creativecommons.org/licenses/by/4.0/).
Share and Cite
Hitte, C.; Le Béguec, C.; Cadieu, E.; Wucher, V.; Primot, A.; Prouteau, A.; Botherel, N.; Hédan, B.; Lindblad-Toh, K.; André, C.; et al. Genome-Wide Analysis of Long Non-Coding RNA Profiles in Canine Oral Melanomas. Genes 2019, 10, 477. https://doi.org/10.3390/genes10060477
Hitte C, Le Béguec C, Cadieu E, Wucher V, Primot A, Prouteau A, Botherel N, Hédan B, Lindblad-Toh K, André C, et al. Genome-Wide Analysis of Long Non-Coding RNA Profiles in Canine Oral Melanomas. Genes. 2019; 10(6):477. https://doi.org/10.3390/genes10060477
Chicago/Turabian StyleHitte, Christophe, Céline Le Béguec, Edouard Cadieu, Valentin Wucher, Aline Primot, Anaïs Prouteau, Nadine Botherel, Benoît Hédan, Kerstin Lindblad-Toh, Catherine André, and et al. 2019. "Genome-Wide Analysis of Long Non-Coding RNA Profiles in Canine Oral Melanomas" Genes 10, no. 6: 477. https://doi.org/10.3390/genes10060477
APA StyleHitte, C., Le Béguec, C., Cadieu, E., Wucher, V., Primot, A., Prouteau, A., Botherel, N., Hédan, B., Lindblad-Toh, K., André, C., & Derrien, T. (2019). Genome-Wide Analysis of Long Non-Coding RNA Profiles in Canine Oral Melanomas. Genes, 10(6), 477. https://doi.org/10.3390/genes10060477