Communication

De Novo Transcriptome Assembly and Annotation of Liver and Brain Tissues of Common Brushtail Possums (Trichosurus vulpecula) in New Zealand: Transcriptome Diversity after Decades of Population Control

by
Arsalan Emami-Khoyi
1,2,
Shilpa Pradeep Parbhu
1,
James G. Ross
2,
Elaine C. Murphy
2,
Jennifer Bothwell
2,
Daniela M. Monsanto
1,
Bettine Jansen van Vuuren
1,
Peter R. Teske
1 and
Adrian M. Paterson
2,*
1
Center for Ecological Genomics and Wildlife Conservation, University of Johannesburg, Auckland Park 2006, South Africa
2
Department of Pest-management and Conservation, Faculty of Agriculture and Life Sciences, Lincoln University, Lincoln 7647, New Zealand
*
Author to whom correspondence should be addressed.
Genes 2020, 11(4), 436; https://doi.org/10.3390/genes11040436
Submission received: 27 February 2020 / Revised: 9 April 2020 / Accepted: 10 April 2020 / Published: 17 April 2020
(This article belongs to the Section Animal Genetics and Genomics)

Abstract

:
The common brushtail possum (Trichosurus vulpecula), introduced from Australia in the mid-nineteenth century, is an invasive species in New Zealand where it is widespread and forms the largest self-sustained reservoir of bovine tuberculosis (Mycobacterium bovis) among wild populations. Conservation and agricultural authorities regularly apply a series of population control measures to suppress brushtail possum populations. The evolutionary consequence of more than half a century of intensive population control operations on the species’ genomic diversity and population structure is hindered by a paucity of available genomic resources. This study is the first to characterise the functional content and diversity of brushtail possum liver and brain cerebral cortex transcriptomes. Raw sequences from hepatic cells and cerebral cortex were assembled into 58,001 and 64,735 transcripts respectively. Functional annotation and polymorphism assignment of the assembled transcripts demonstrated a considerable level of variation in the core metabolic pathways that represent potential targets for selection pressure exerted by chemical toxicants. This study suggests that the brushtail possum population in New Zealand harbours considerable variation in metabolic pathways that could potentially promote the development of tolerance against chemical toxicants.

1. Introduction

New Zealand separated from other landmasses approximately 85 million years ago and has remained largely isolated ever since [1]. Ecological isolation created distinctive evolutionary dynamics in the archipelago rarely seen elsewhere on the planet. By the time the first humans colonised in approximately 1300 AD [2,3], no native land mammals, other than three species of bats, were present [4]. The negative impacts of two consecutive waves of human colonisation triggered a series of fundamental alterations in the biological diversity of New Zealand. The introduction of three species of rats (Rattus spp.), three species of mustelids (Mustela spp.), and the common brushtail possum (Trichosurus vulpecula), in combination with extensive human hunting and habitat destruction, triggered a spiral of catastrophic events that drove fifty-nine bird species extinct and severely threatens the survival of other native species, including endemic marine mammals, native bat species, frogs, and much of the invertebrate fauna [5,6].
The common brushtail possum (hereafter ‘brushtail possum’) was introduced into New Zealand from localities in Tasmania and the eastern Australian mainland in the 1850s to establish a profitable fur industry [7,8]. Soon after its introduction, the species established itself in the wild, proliferated, and spread across all habitats in the archipelago. In these new habitats, brushtail possums reached population densities far exceeding those in their native Australian range [4]. The phenomenal success of brushtail possums in New Zealand has been linked to the high abundance of palatable and nutritious food sources, and the presence of fewer parasites, predators, and competitors [9]. The scale of devastation upon New Zealand’s endemic ecosystems prompted the brushtail possum’s designation as both an agricultural pest and a major threat to New Zealand’s unique flora and fauna [9,10]. Wild populations of brushtail possums also harbour a self-sustained reservoir of bovine tuberculosis (Mycobacterium bovis) that threatens New Zealand’s dairy and livestock industries [4]. As a result, the brushtail possum has been subject to decades of targeted population control operations.
Conservation and agricultural authorities in New Zealand regularly apply a series of population eradication and control measures to mitigate the negative impacts of brushtail possums on native ecosystems. Since 1957, aerial dispersal of cereal baits containing the chemical toxicant sodium fluoroacetate (or ‘compound 1080′) has constituted the cornerstone of management plans to control brushtail possums and other invasive mammals in New Zealand [10,11]. Synthetic compound 1080 is a water-soluble salt modelled on the naturally occurring plant toxin fluoroacetate [12]. Several plant species across the globe, such as Gastrolobium spp. and Oxyylobium spp., use this toxicant as a deterrent against herbivory, including species within the possum’s native Australian home range [13,14,15].
Brushtail possum populations in New Zealand face a combination of stressors and human-induced selection pressures that differ from those in their native Australia. The speed of local adaptation typically found in many invasive species suggests that the genetic recipe for adaptation predominately arises from standing genetic variations present in the founder populations [16,17]. Triggs and Green [18] and Sarre et al. [19] reported that current populations of the brushtail possum in New Zealand originated from two distinct subspecies, Trichosurus vulpecula fuliginosus from Tasmania and T. vulpecula vulpecula from mainland Australia, and that extensive hybridisation took place following their introduction to New Zealand. Genetic variations among the founder populations propagated in the non-native range and most likely became reshuffled into new genotypes that do not occur in Australia.
Recent advances in DNA sequencing technology and high-performance computing have facilitated the comprehensive study of functional regions in eukaryote genomes. Variability in the genome has made it possible to address some fundamental questions in evolutionary genetics, such as the prediction of pathways associated with fruit colour [20], intraspecific variation in morphology and behaviour [21], susceptibility to pathogens [22,23,24,25], responses to chemicals [23], adaptation to environmental changes [26], species diagnostics markers in endangered shrimps [27], sex determination [28], and changes in the expression profiles of an organ during embryonic development [29].
Understanding the brushtail possum’s evolutionary dynamics in New Zealand is hindered by a paucity of available genomic resources for this species [30]. In particular, the evolutionary consequences of more than half a century of intensive population control measures on its genetic diversity and population structure merit in-depth investigation. To address these fundamental questions, genomic resources are required.
In the current study, we characterise the functional content and genetic diversity of brushtail possum liver and brain cerebral cortex transcriptomes, tissues of major importance in responding to chemical toxicants and in modulating complex behaviour [31,32,33,34]. The core metabolic pathways in these tissue types are among the primary targets of selective pressures imposed by anthropogenic chemicals [35,36,37]. This study serves as a stepping-stone for a better understanding of the brushtail possum’s evolutionary dynamics in New Zealand and will contribute towards the optimisation of a comprehensive population management plan for the species, in line with the New Zealand Predator-Free 2050 horizon objectives.

2. Materials and Methods

2.1. Animal Ethics Statement

Animal ethics approval for this study was obtained from the Lincoln University Animal Ethics Committee (AEC 586). Approved standard operation procedures were used for both animal husbandry and euthanasia. All necessary steps were taken to minimise the pain and suffering of the subject animals.

2.2. Specimen Collection

In total, four brushtail possums (two males and two females) were live trapped on the east and west coasts of New Zealand’s two main islands (Banks Peninsula and Buller, South Island, and Taranaki and Hawkes Bay, North Island). The animals were transferred to the wild animal husbandry facilities (Johnstone Memorial Laboratory) at Lincoln University. On the day of specimen collection, sex, weight, and health status of each animal were recorded by Lincoln University’s wildlife animal facility staff. The brushtail possums were humanely euthanised by intracardiac administration of 300 mg of Pentobarbital. The dissection and collection of the liver and cerebral cortex biopsies were performed after the death of the animals was confirmed on site. Approximately 1 mm3 tissue from liver and brain cerebral cortex were excised, transferred to 10:1 volume of RNAlater solution (Qiagen-Hilden) and stored at −80 °C until RNA was extracted within one week after specimen collection. Liver cells are assumed to be more homogeneous in their gene expression profiles, but see Reference [38], whereas brain cell expression profiles often differ considerably between different brain regions [39,40]. To account for variations in the gene expression profiles in the possums’ cerebral cortex, brain biopsies from three individuals were excised from different sections of the proximal cerebral cortex in the left and right cortical lobes. The remaining biopsy was taken from deeper white matter in the cerebral cortex. A wildlife histologist examined all brain biopsies to validate their origin.

2.3. Nucleic Acid Extraction, Genomic Library Preparation, and Sequencing

Total RNA was purified from liver and brain tissue using Qiagen’s RNeasy Mini Kit (Hilden, Germany). The extracted RNA was eluted in 50–100 µl of water. The quality of the purified RNA was measured using Agilent’s Bioanalyzer (Santa Clara, United States) to obtain an RNA Integration Number score before proceeding with complementary DNA preparation. Nugen’s Ovation RNA-Sequencing System (Redwood City, United States), automated on an Apollo324 liquid handler (Takara Bio, Kyoto, Japan), was used to create complementary DNA using a single primer isothermal amplification method and 100 ng of template RNA. The resulting complementary DNA was quantified on a Nanodrop spectrophotometer (ThermoFisher Scientific, Massachusetts, United States) and sheared to 200 bp fragments using the Covaris M220 ultrasonicator (Woburn, Unites States). Illumina-compatible sequencing libraries were prepared using KAPA Biosystem’s LTP library preparation kit (Pleasanton, United States). Individual sequencing adapters with sample-specific barcodes (Bioo Scientific, Austin, United States) were ligated to the end-repaired fragments, the resulting libraries were cleaned using AMPure beads (Beckman-Coulter, Brea, United States) and amplified for ten PCR cycles with KAPA’s HiFi polymerase. The concentration of each library was quantified separately using qPCR on the Quantstudio 5 (Applied Biosystems, Foster City, United States) and the fragment sizes were verified using the Agilent Bioanalyzer. All sequencing libraries were normalised to 2 nM concentration before pooling for multiplex sequencing on two 1 × 50 flow cells on an Illumina HiSeq2000 platform (San Diego, United States) at the Arizona State University genomics core facility.

2.4. Transcriptome Assembly, Variant Calling and Functional Annotation
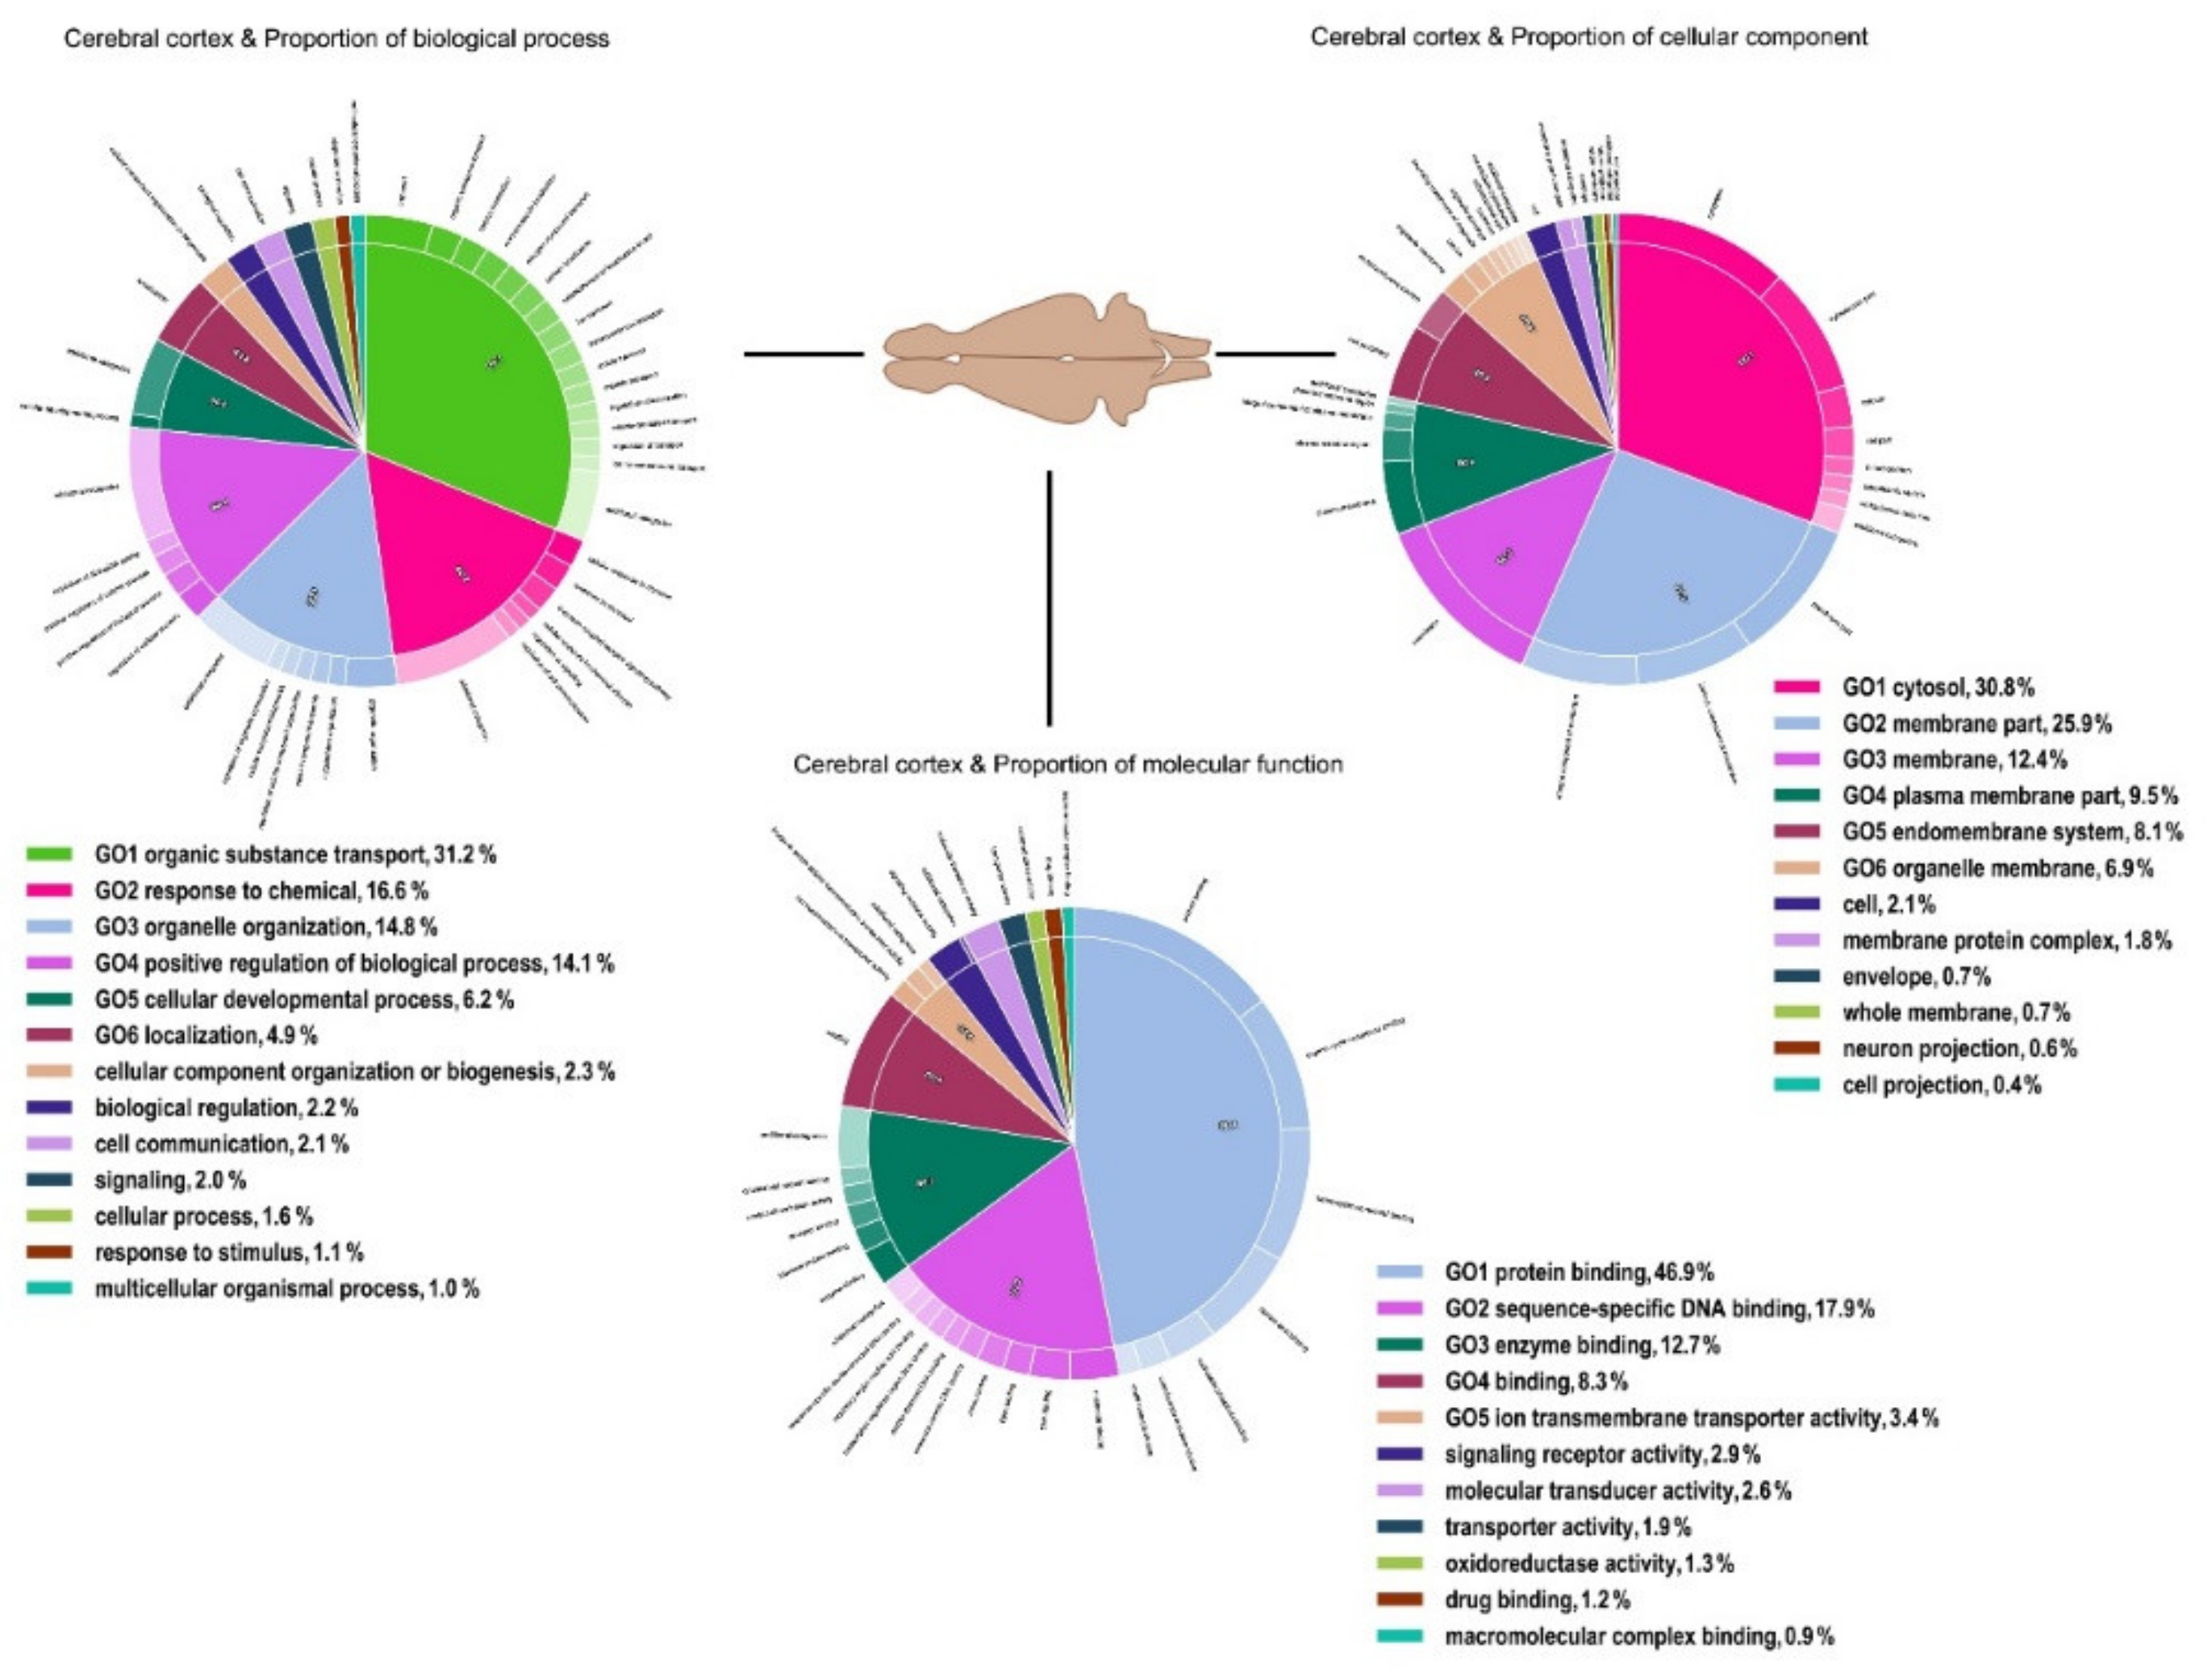
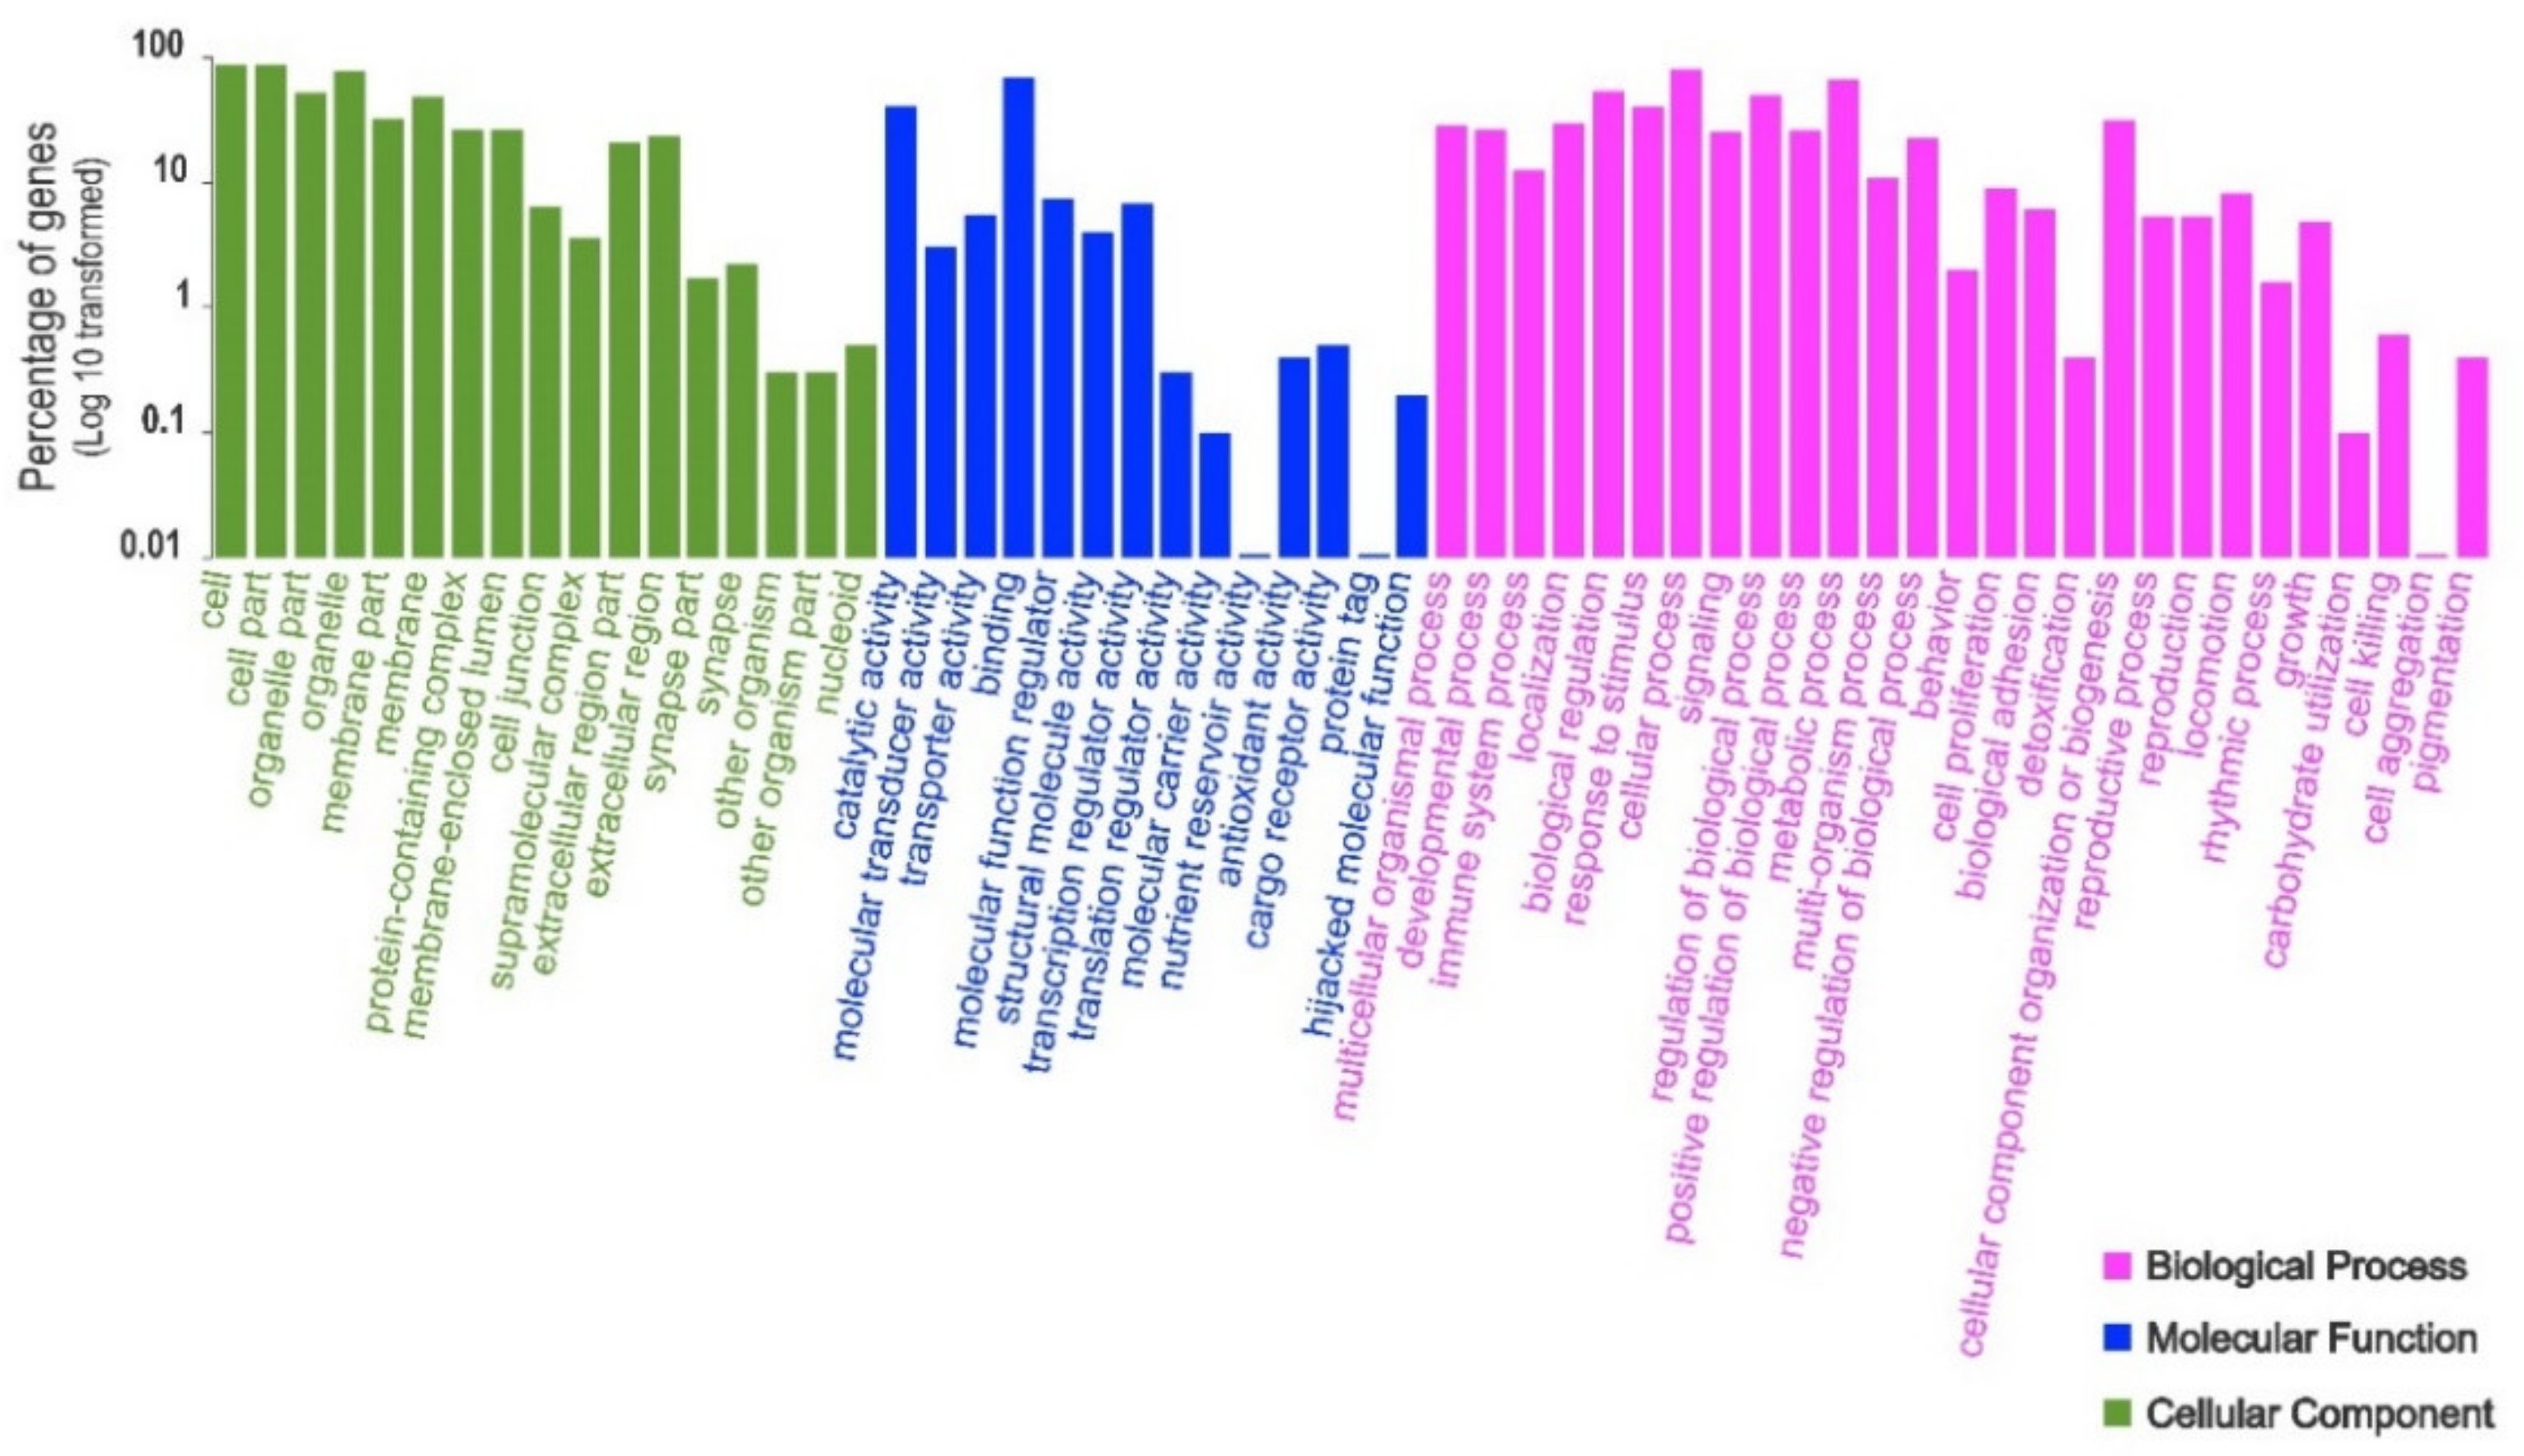
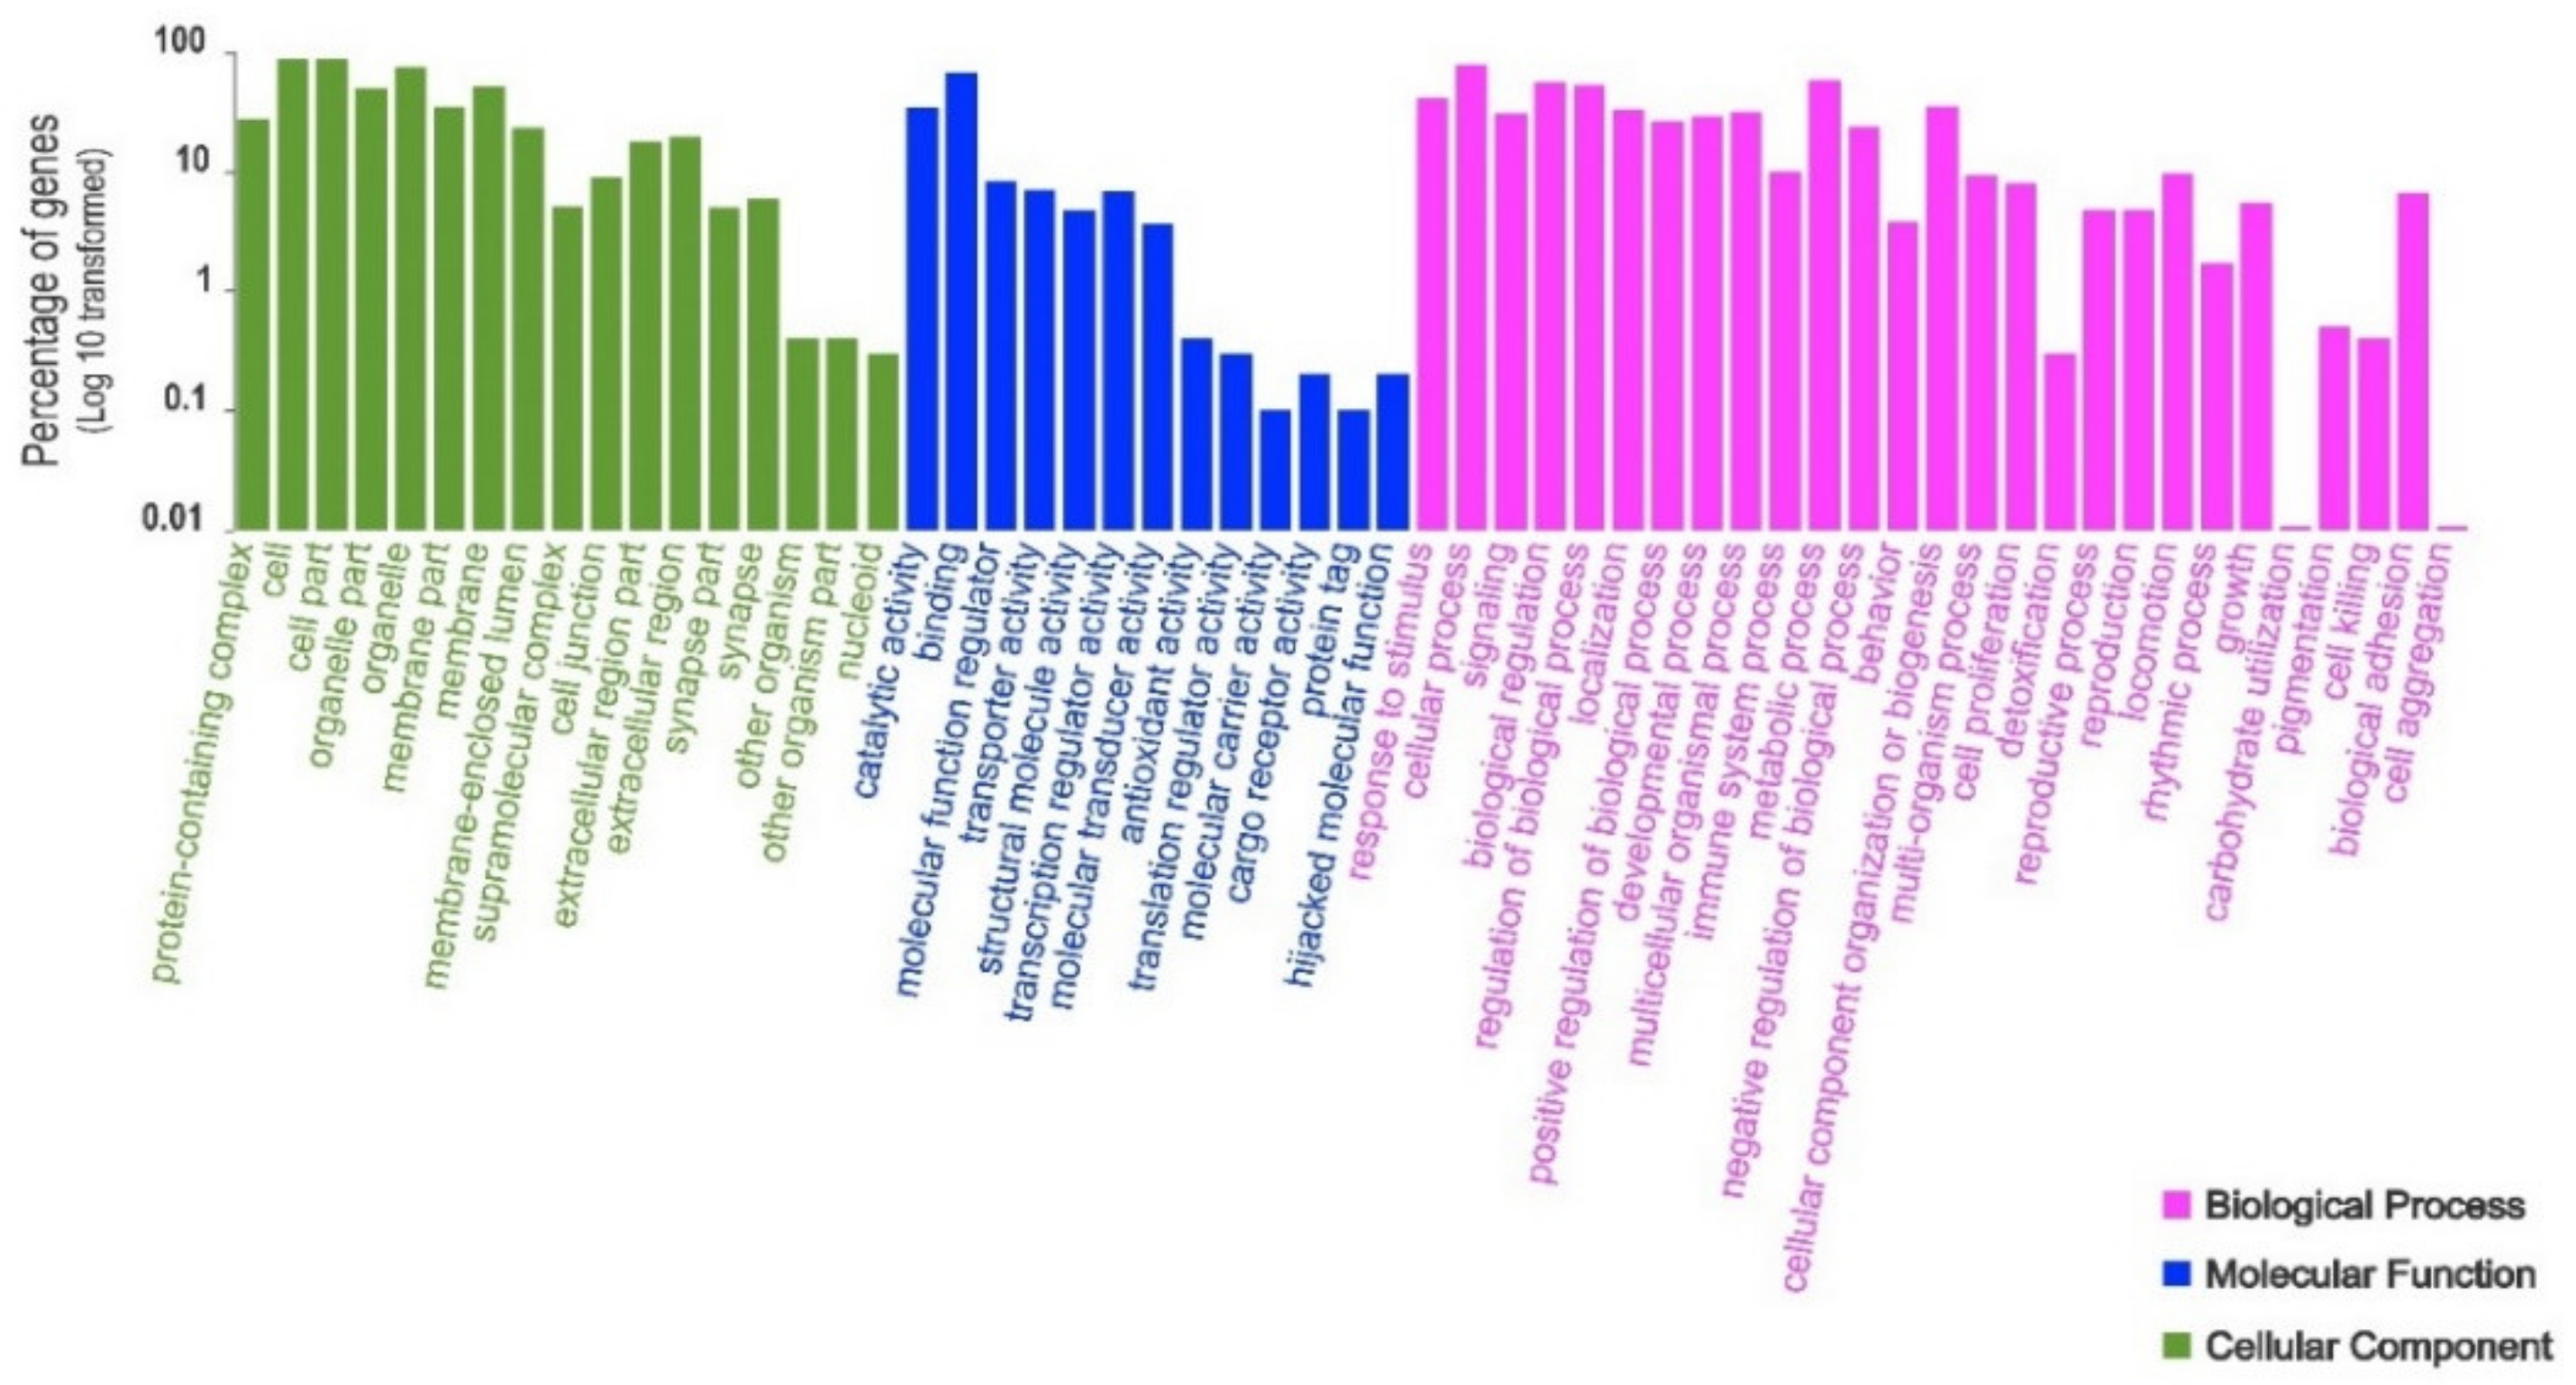
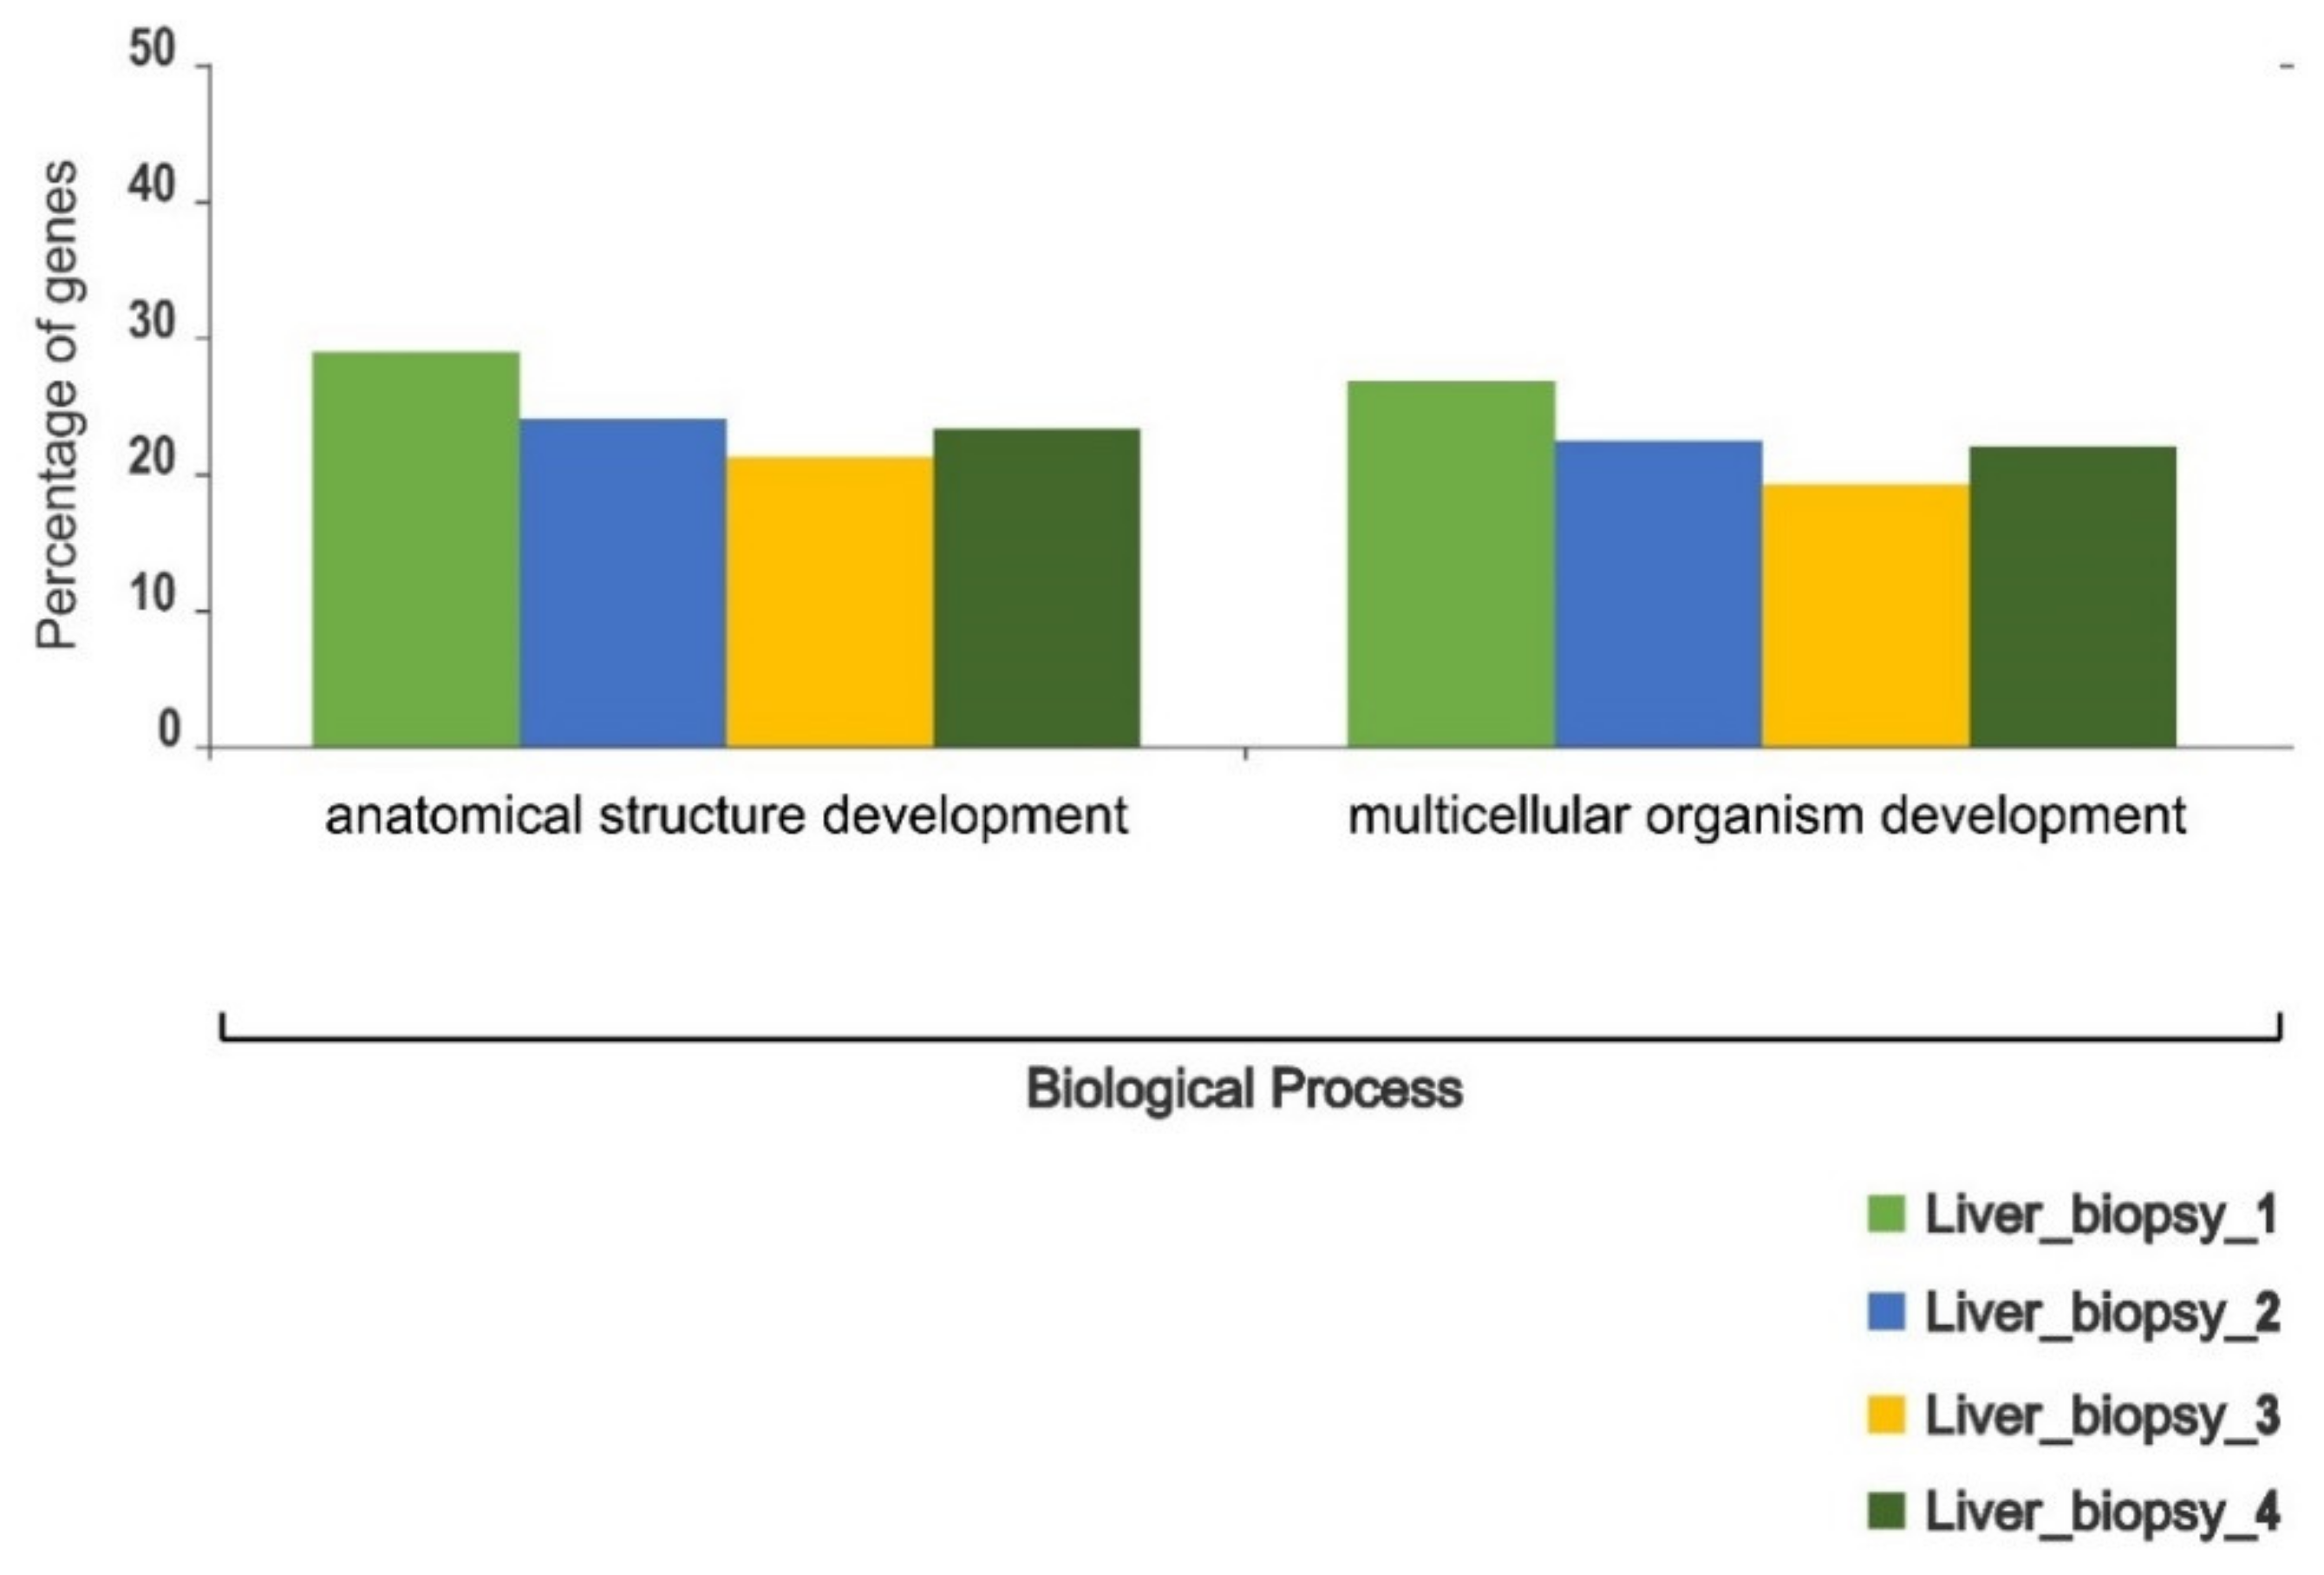
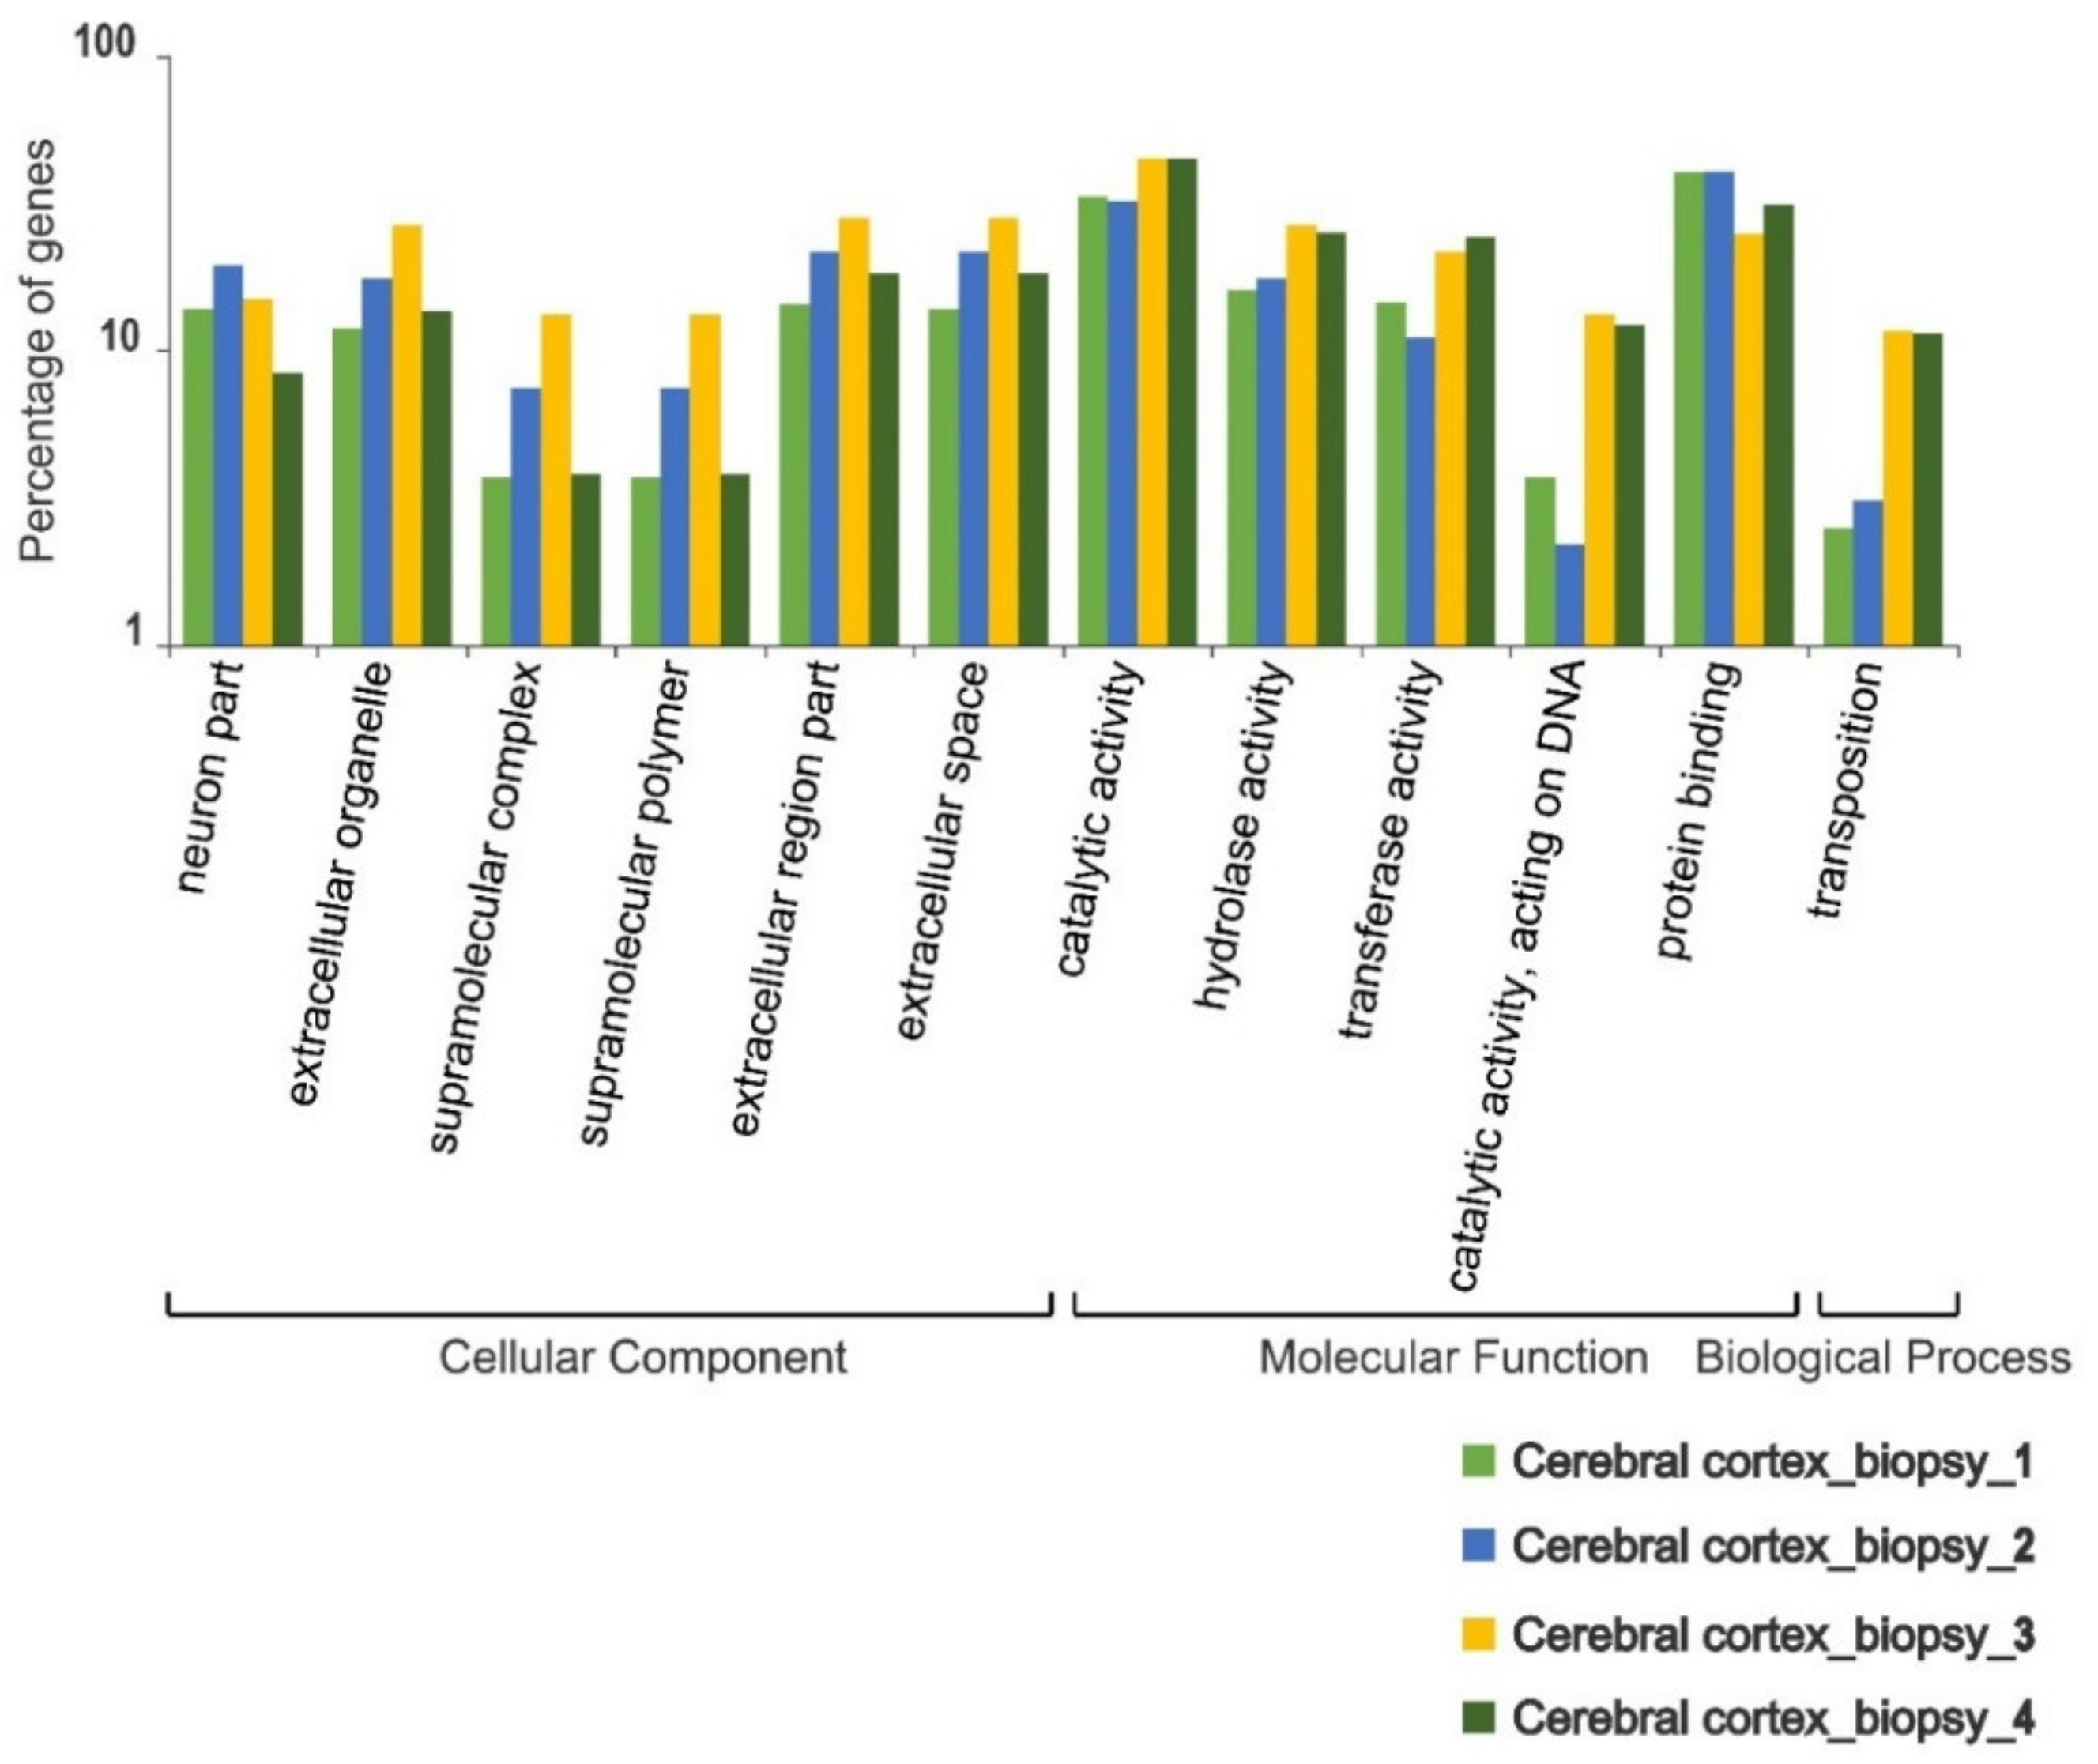
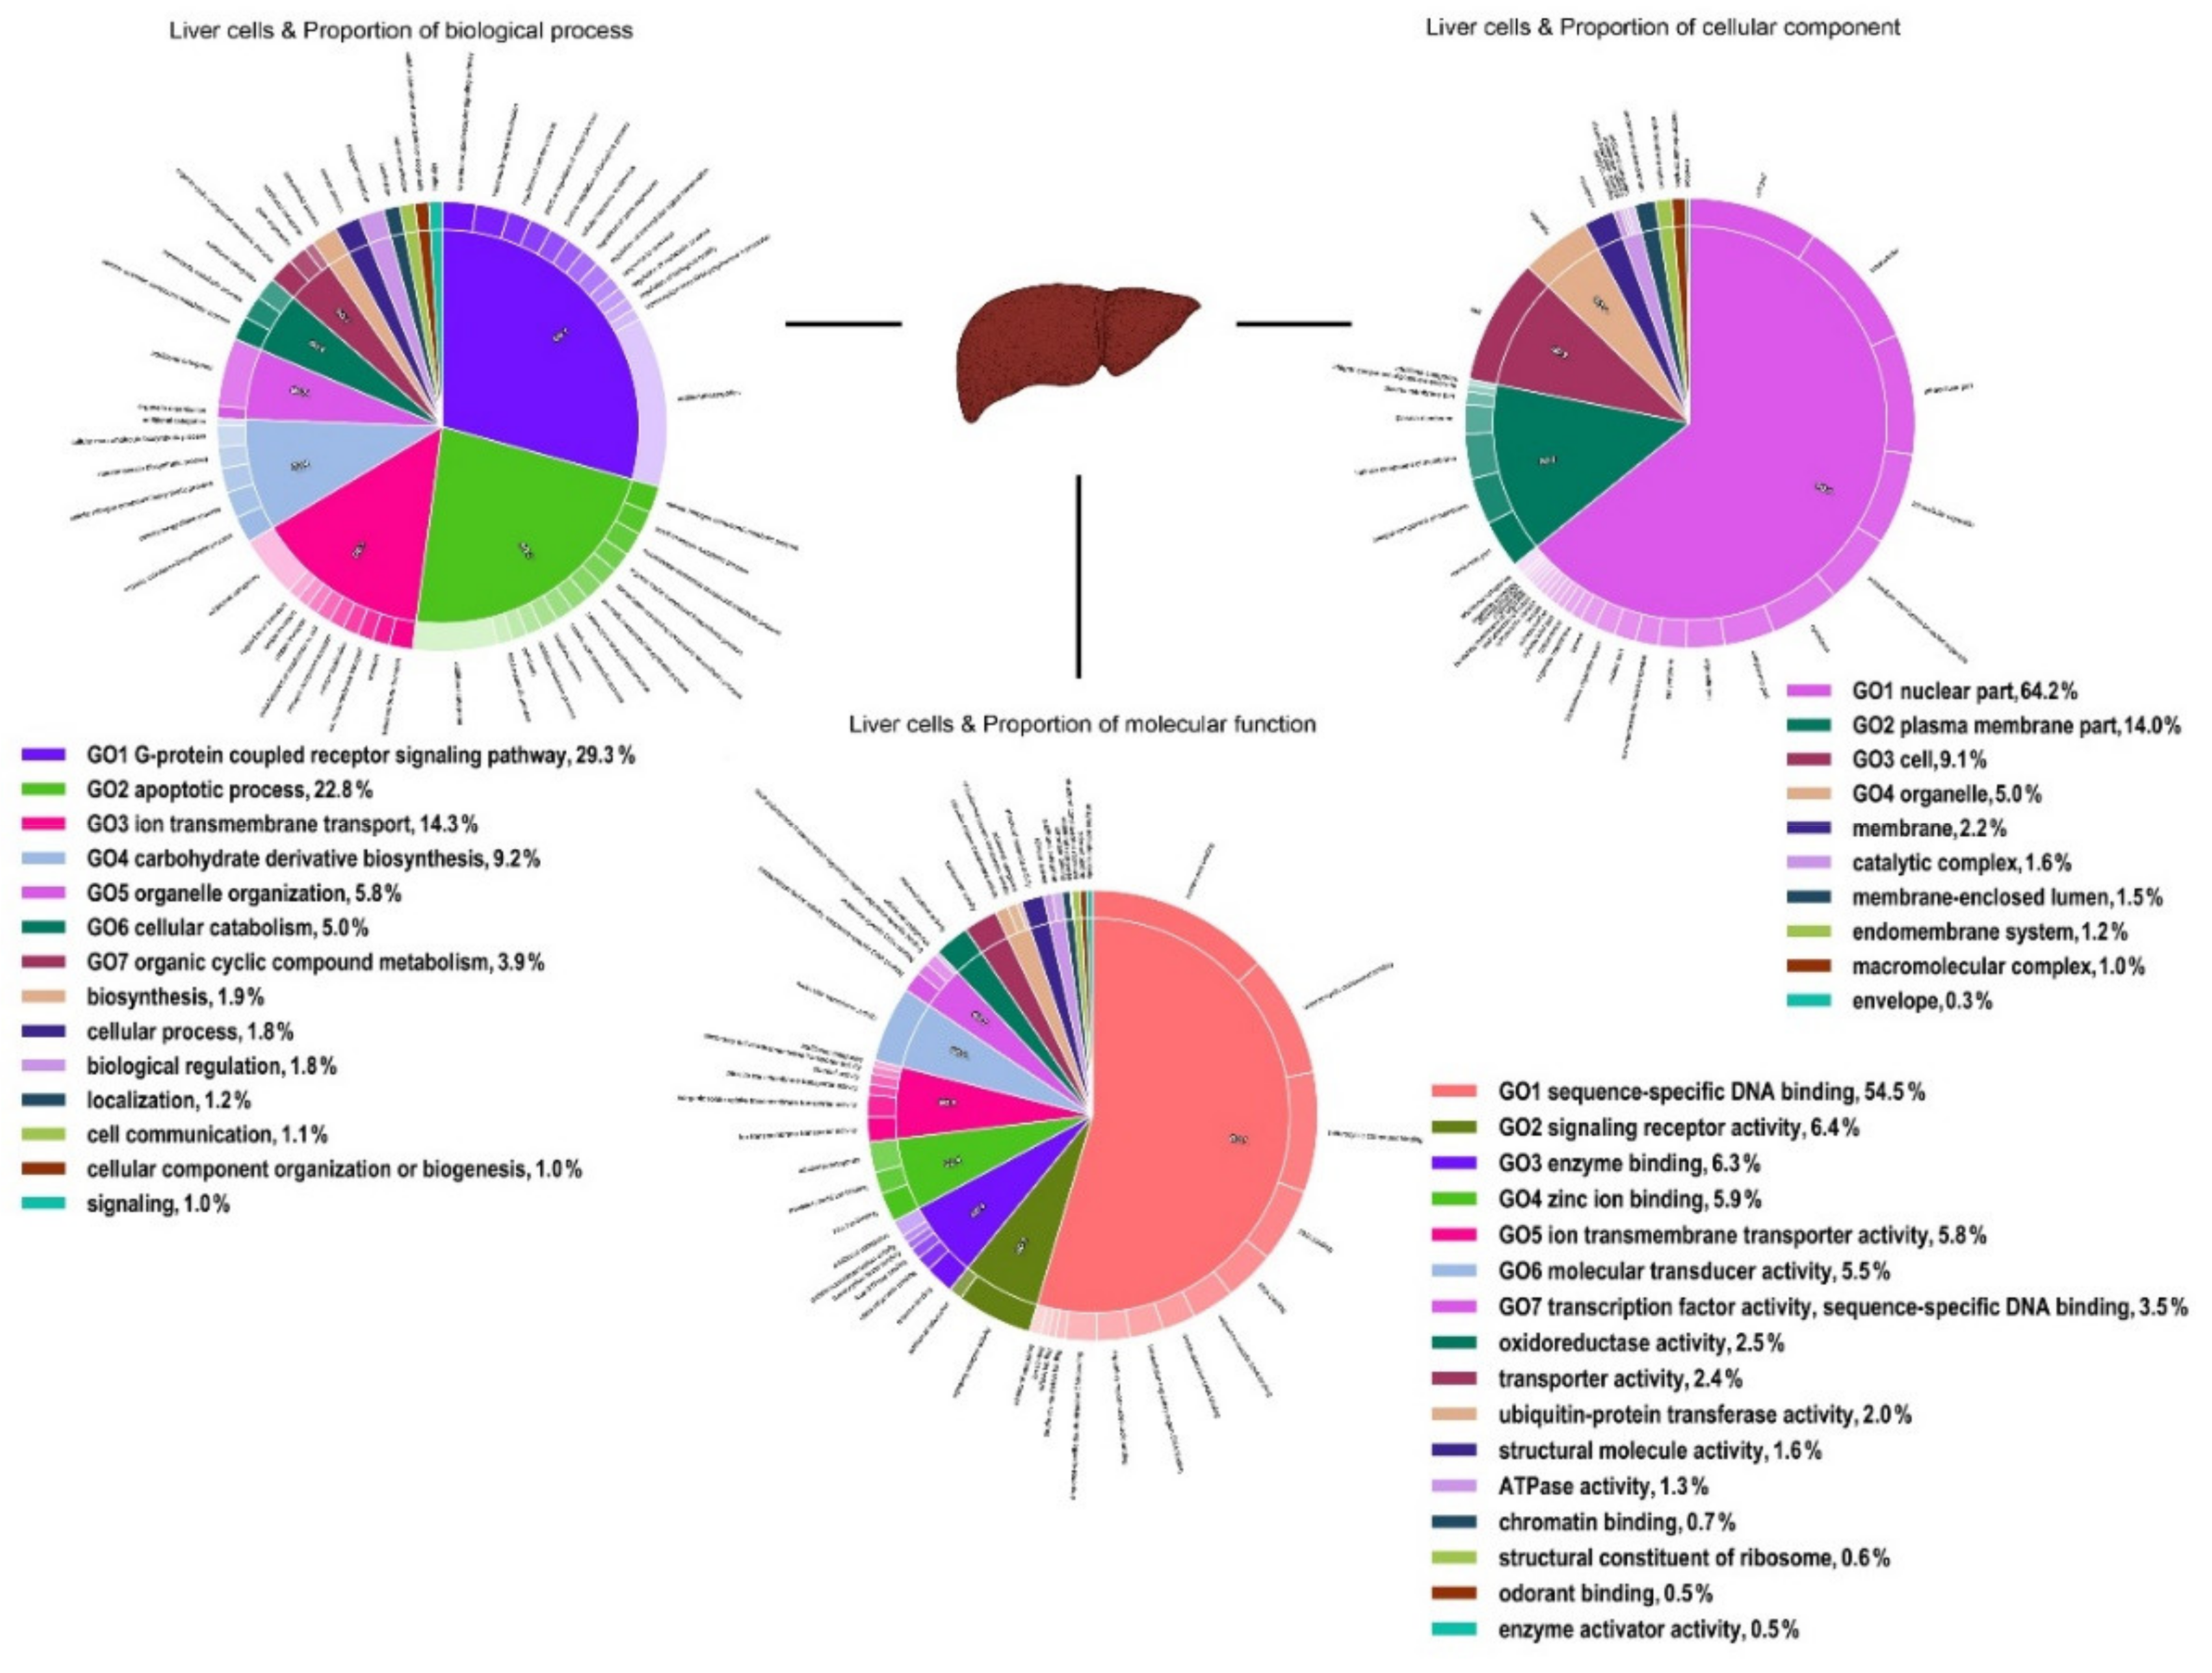
Leading and trailing low-quality or N bases (Phred quality below three), all base pairs with average Phred score < 20, and Illumina adapter contaminations were removed using Trimmomatic v0.39 [41]. A reference transcriptome for each tissue type was assembled de novo in Trinity v2.8.6 (Inchworm, Chrysalis, and Butterfly modules) [42] using default settings. Resulted transcripts were clustered into unique clusters by utilising cd-hit-est from the CD-HIT v4.7 package and setting identity parameters to 98% [43]. The longest reading frame within each transcript was predicted in TransDecoder v5.5.0 [44]. All transcripts were functionally annotated using the Trinotate pipeline [45]. In Trinotate, all transcripts were searched against known proteins and core metabolic pathways deposited in Swiss-Prot protein (https://www.uniprot.org/), NCBI non-redundant protein (https://www.ncbi.nlm.nih.gov/refseq/), and Kyoto Encyclopaedia of Genes and Genomes (KEGG) (https://www.genome.jp/kegg/) databases. In addition, the protein domains for all transcripts were predicted in HMMER v3.1 [46] based on the similarity to the known proteins in the Pfam (https://pfam.xfam.org/) database. Transmembrane proteins and ribosomal RNA were separately identified using TmHMM v2 [47] and RNAMMER v1.2 [48], respectively. The Benchmarking Universal Single-Copy Orthologs (BUSCO V3) pipeline [49] was executed in protein mode to evaluate the completeness of the gene content of the reference transcriptome of each tissue compared to the core mammalian gene content (Mammalia-0db-10, created on 2019-11-20).
From all specimens, quality-filtered sequences were aligned against the corresponding assembled transcriptome using Bowtie2 [50], BWA-ALN [51], and BWA-MEM aligners [52] and mapping statistics from each alignment file were estimated separately in SAMtools v1.9 flagstat script [53].
A combination of SAMtools v1.9 mpileup command [53] and Varscan2 v2.3.7 [54] were used to identify single nucleotide polymorphic sites (SNPs) in each tissue type. Default settings were used for variant calling, an exception being the p-values in Varscan2, which were lowered to 0.001 to increase prediction accuracy. Functional impacts of the polymorphic sites on protein sequences were predicted using the KisSplice2reftranscriptome v1.3.3 pipeline [55].
Two datasets were created and investigated in parallel to unravel variability in the functional content of each tissue type. The first consisted of ten transcripts within each tissue’s reference transcriptome that showed the highest number of polymorphic sites, as reported in the Varscan2 output files. In the second dataset, the abundance of each transcript was estimated in RSEM v1.3.1 [56], and 5% of the transcripts with the highest normalised level of expression (estimated as per million mapped reads, TPM) were sub-selected for further functional analysis.
The enrichments of the ten most polymorphic transcripts in each tissue type, for particular biological functions in terms of Gene Ontology categories (GO terms) [57], were investigated using the g: Profiler online server [58] and the annotated genome of the grey short-tailed opossum, Monodelphis domestica, was used as the closest high-quality annotated gene set.
The tissue-specific expression profiles and intra-individual variations in the functional content of polymorphic sites were statistically tested using the WEGO v2.0 online tool [59] and visualised using a combination of the REVIGO online server [60] and CirGO [61]. The signal of pervasive selection (the ratio of non-synonymous to synonymous amino acid substitution, dN/dS ratio) in one particular liver transcript with an exceptionally high number of polymorphic sites was tested using a fixed-effects likelihood model [62] implemented in the online server Datamonkey [63].
The functional content of the assembled transcripts and two generated datasets, in terms of core metabolic pathways, was reconstructed by mapping transcripts against the KEGG database using the KEGG mapper online server [64] and results were summarized in GAEV [65].

3. Results

The histological reports confirmed that three of the brain cerebral cortex biopsies originated from the proximal cortex, while the remainder originated from deeper within the cerebral cortex white matter (Supplementary Materials Figures S1–S4).
The RNA sequencing run yielded 183,517,606 and 178,725,338 raw sequences from liver and brain cerebral cortex, respectively. Liver tissue sequences were assembled into 58,001 transcripts (candidate genes and isoforms), with a mean contig length of 813.37 and a GC content of 42.57%. From the cerebral cortex brain tissue, Trinity assembled sequences with a total of 64,735 transcripts, a mean contig length of 738.13, and a GC content of 42.68% (Table 1). CDHIT subsumed all transcripts into 57,221 and 63,679 unique clusters with more than 98% sequence identity for liver and brain cerebral cortex, respectively.
The semi-global BWA-MEM aligner performed better, in terms of mapping quality and percentage of aligned sequences, compared to two other aligners, and was selected for downstream analysis. The overall alignment rate was estimated at 90.93% for liver sequences and 79.80% for brain cerebral cortex sequences. The alignment rate in both tissue types lies within the recommended range in the Trinity pipeline for a complete reference transcriptome assembly (https://github.com/trinityrnaseq/trinityrnaseq/wiki/RNA-Seq-Read-Representation-by-Trinity-Assembly). From a total of 9226 searched BUSCOs, 3290 and 2446 of the core mammalian’s complete BUSCOs were identified in the hepatic and brain cerebral cortex transcriptomes, respectively (Supplementary Materials Table S1). Tissue-specific transcriptomes, especially in non-model organisms, are very unlikely to produce complete mammalian BUSCOs and that should be interpreted within the biological context of the study, rather than as a direct metric for estimating the completeness of the assembled transcriptomes.
Varscan2 identified 35,300 (one SNP for every 1339 bp) and 23,805 (one SNP for every 2007 bp) variable sites in liver and brain cerebral cortex transcripts, respectively. The number of polymorphic sites with transitions was estimated to be three times higher than the number of transversions in both tissue types. The polymorphism landscape in brushtail possum cerebral cortex was more heterogeneous compared to hepatic cells. Only 25% (5939 out of 23,805) of the polymorphic sites in cerebral cortex tissues were successfully genotyped across all four sampled tissues compared to 70% shared polymorphisms (24,924 out of 35,225) among hepatic tissues.
KisSplice identified 34,329 (22,887 synonymous and 11,442 synonymous) and 4695 (3244 synonymous and 1451 non-synonymous) codon substitutions in hepatic and cerebral cortex tissues, respectively. The reported high levels of heterogeneity in gene expression profiles among different sections of the cerebral cortex provide the most likely explanation for the observed pattern of codon substitutions.
In the hepatic cells, non-synonymous mutations of the codons GTT to ATT, ACG to ATG (substitution of amino acid valine to isoleucine) and GTC to ATC (substitution of amino acid threonine to methionine) had the highest frequency. In the brain cerebral cortex, non-synonymous mutation of the codons GTG to CTG (substitution of amino acid valine to leucine) AAA to AGA (substitution of amino acid lysin to arginine) and AGT to AAT (substitution of amino acid serine to asparagine) were prevalent. The highest rate of synonymous amino acid substitutions was observed for aspartate (mutation in codon GAC to GAT or GAT to GAC) and asparagine (mutations in the codon AAC to AAT) in the hepatic cells and for amino acids aspartate (mutation in the codon GAC to GAT) and proline (mutation in the codon CCA to CCG) in the brain cortical cells (Supplementary Materials Tables S4 and S5)
A transcript in the liver was of particular interest because of an exceptionally large number of polymorphic sites (127 SNPs). The BLASTX search of this transcript showed high sequence identity (88% similarity) to various isoforms of multidrug resistance proteins reported in koala, Phascolarctos cinereus (NCBI reference XP_020843128.1), and common wombat, Vombatus ursinus (NCBI Reference Sequence: XP_027703707.1). In all four brushtail possums, alignment of the protein-coding sequences of this transcript demonstrated 19 candidate sites that were under pervasive purifying selection (dN/dS < 1, p-value < 0.05). The majority of the non-synonymous amino acid substitutions in these transcripts (6 out of 30) were in the form of valine to isoleucine substitutions. The synonymous substitution for amino acids alanine and isoleucine (11 out of 45) constituted a considerable number of substitution patterns in the same transcript.
Searching all assembled transcripts against multiple databases showed a considerable number of uncharacterised transcripts within both tissue types (Supplementary Materials Figures S5 and S6).
The analysis of the functional content of both transcriptomes in terms of Gene Ontology (GO) illustrated that GO terms associated with biochemical pathways involved in cellular components (cells, organelle and organelle parts, membrane, and extracellular regions), molecular functions (catalytic activity, binding, molecular function regulators, and molecular transducer activity), and biological processes (response to stimulus, cellular process, biological regulation, metabolic process, and biogenesis) dominated the functional diversity of both tissue types ( Figure 1; Figure 2).
The hepatic cells were more homogeneous in their gene ontology profiles across individuals. Only two metabolic pathways involved in the biological process, anatomical structure developments and multicellular organism developments, showed statistically significant differences in the number of associated polymorphic sites (2 test p-value < 0.05) across the four individuals (Figure 3). The brain biopsies taken from different sections of the cerebral cortex demonstrated more heterogenous profiles in their polymorphism landscape. Twelve metabolic pathways involved in cellular components (neurone part, extracellular organelle-complex, and extracellular space), molecular functions (catalytic, hydrolase, transferase, and protein-binding activities), and a biological process linked to transposition showed a significant level of variation across different parts of the cerebral cortex (2 test p-value < 0.05) (Figure 4).
Comparing the liver and brain datasets consisting of the ten most polymorphic sites against the closely related grey short-tailed opossum illustrated significant enrichment for various metabolic pathways (Figure 5; Figure 6).
The dataset of 5% highly expressed transcripts illustrated that the expression profile between two tissue types differs significantly (2 test p-value < 0.05) in the metabolic pathways linked to 58 GO terms (Supplementary Materials Figure S7).
The metabolic pathways analysis of the transcripts against the KEGG database indicated that the liver transcriptome was linked to 394 core metabolic pathways and 23 complete metabolic modules. Brain cerebral cortex transcriptome was involved in 379 core metabolic pathways and eight complete metabolic modules (Supplementary Materials Tables S2 and S3).
In the liver tissue, the most polymorphic transcripts were involved in eight KEGG metabolic pathways including lipid metabolism, nucleotide metabolism, amino acid metabolism, cofactor and vitamin metabolism, xenobiotics biodegradation and metabolism, and the endocrine system. Mapping the ten most polymorphic transcripts in the brain cerebral cortex against the KEGG database indicated their involvement in 14 core biological pathways, including core metabolic pathways, biosynthesis of secondary metabolites, metabolism of cofactors and vitamins, signal transduction, signalling molecules and interaction, transport and catabolism, the cellular community, and the excretory system.
The dataset consisting of 5% of the most abundant transcripts of hepatic cells was linked to 354 biological pathways and eight complete metabolic modules (Table 2). The highly expressed transcripts in the brain cerebral cortex were associated with 342 biological pathways and four complete metabolic modules (Table 3). A total of 22 genes in the liver transcriptomes and ninegenes in the cerebral cortex were directly linked to the metabolic pathways that involved drug and xenobiotic substances metabolism (Table 4; Table 5).

4. Discussion

The potential of pests, pathogens, and invasive species to evade conventional population control measures represents a major threat across the globe [67]. Resistance against antibiotics and anthropogenic toxicants occurs in all domains of life, from bacteria to arthropods and vertebrates [68,69,70,71,72]. The genomic basis of developing resistance in non-rodent vertebrates continues to be underrepresented in research and suffers from a lack of functional genomic studies. The current study is the first to characterise the functional content and diversity of the liver and brain cerebral cortex transcriptomes of a non-rodent mammalian pest, the marsupial common brushtail possum, in New Zealand.
The functional content and polymorphism landscape of liver and brain cerebral cortex transcriptomes in brushtail possums are involved in a diverse array of biological processes. The functional content of these tissue types plays a critical part in the detoxification of xenobiotic substances [73,74] and modulation of complex behaviours [75,76] that potentially promote the development of physiological and behavioural tolerance against chemical compounds.
Enzymes produced from cytochrome P450 gene groups (such as CYP1A2, CYP2E1, CYP3A4, CYP3A5, CYP2B6, CYP2C8, and CYP2C19) dominate the biochemical pathways involved in drug and xenobiotic substance metabolism in brushtail possum hepatic cells. Polymorphisms in this group of heme-containing proteins influence the speed and efficiency of chemical compound breakdown in the liver and other organs [77,78]. Similarly, the CYP2C group of genes has been reported to show high levels of expression in liver tissues of the herbivorous koala (Phascolarctos cinereus) [79].
The detoxification of the harmful component of compound 1080, fluoroacetate, takes place in the hepatocytes [14,80,81,82]. Polymorphism in the liver transcripts for the metabolic pathways involved in response to drugs and xenobiotic substances is not unexpected. Nonetheless, an exceptionally high number of polymorphic sites associated with these pathways, particularly a contig with high similarity to the multidrug resistance protein family reported from other marsupials, suggest the potential of standing genomic variation within New Zealand populations that may allow alternative responses to population control chemicals.
Multidrug resistance proteins confer increased drug resistance through a decrease in drug accumulations resulting from increased drug efflux [83,84]. Members of this ATP-binding cassette protein super-family function as active transporters of various organic substances, anionic conjugates, and xenobiotic substances, including glutathione, glucuronide, and sulfate conjugates [85,86]. Metabolic pathways that involve glutathione and a unique glutathione transferase are closely linked to the detoxification of compound 1080 and other similar-acting toxicants in hepatic cells [14,80,81,82]. Moreover, the estimated ratio of synonymous to non-synonymous amino acid substitutions in this transcript indicates that parts of the multi-drug resistance metabolic pathways in brushtail possum hepatic cells may be subject to a significant level of purifying selection against less beneficial genotypes. The pre-adaptations of founder populations with natural exposure to this toxicant in Australia, and the fitness implication of the observed evolutionary dynamics, are yet to be fully understood and require comparative functional genomic studies between a larger sample of brushtail possums in their native range in Australia and invaded habitat in New Zealand.
In the current study, several enriched metabolic pathways were identified in the brushtail possum cerebral cortex transcriptome that regulate a wide range of core neurobiological processes, such as organic substance transport, response and regulation of biological processes, cell communications, neurochemical signalling, and locomotion. The biochemical pathways involved in drug and xenobiotic substance metabolism in the cerebral cortex are largely different from those identified in liver cells. The products of several genes in the brushtail possum cerebral cortex (Table 5) are associated with the development of resistance against platinum-based anti-malignancy drugs in humans. The complex dynamics of resistance involve a combination of decreased drug influx, increased drug efflux, intracellular detoxification by glutathione, decreased binding, increased DNA repair, decreased mismatch repair, and defective apoptosis [87,88]. However, the physiological significance of these metabolic pathways in the brushtail possum cerebral cortex in response to the chemicals remains to be investigated.
The delicate interplay between brain cerebral cortex polymorphisms and modulation of complex behaviours is an active area of research in neurobiology [89,90]. While addressing these associations lies beyond the scope of the current study, our results suggest a considerable variation in the transcriptomic repertoire of thebrushtail possum cerebral cortex that is necessary to modulate complex behaviours. Ross et al. [91] suggested that a single exposure to a sub-lethal dose of chemical toxicants in brushtail possums triggers the development of long-lasting bait-shyness behaviours in wild and captive populations. To what extent bait-shyness represents learned behaviour within an individual subsequent to sub-lethal exposure, and its heritability across multiple generations, requires more neurogenomic research.
Instances of developing tolerance against 1080 have already been reported in some wild and laboratory- populations with natural exposure to fluoroacetate [82], including wild populations of European rabbit (Oryctolagus cuniculus) in Australia [71], brushtail possums in south-western Australia [92], and laboratory brown rats (Rattus norvegicus) [93]. The current study did not aim to identify the development of practical resistance against toxins in New Zealand’s brushtail possum population. Rather, we demonstrated that these populations harbour considerable levels of functional variation in the metabolic pathways that could potentially promote the development of tolerance against chemicals, such as compound 1080 and other similar-acting toxicants. To determine the sensitivity of the current populations to long-term toxin exposure requires formal toxicology trials to measure the lethal concentrations in the laboratory and over time. The power of genetic data to conclusively predict the development of tolerance against toxins remains limited. The small scale of this study only allows for some preliminary conclusions that are consistent with what we would expect to see from a species that has been under intense anthropogenic selection pressures, including both trapping and toxins, for generations.
As conservation efforts to eradicate invasive mammals intensify towards the objectives of the New Zealand Predator-Free 2050 horizon, we strongly advocate combined and multifaceted population control strategies that simultaneously target different aspects of an invasive species’ life history, behaviour, and physiology in time and space, and thus prevent or delay the potential development of resistance against any specific population control measure [67,94]. The ecological and economic impacts of brushtail possums potentially developing tolerance against population control measures necessitate constant monitoring of current populations and their response to management plans.

Supplementary Materials

The following are available online at https://www.mdpi.com/2073-4425/11/4/436/s1, Figures S1–S4: The histological images and reports of the four brain cerebral cortex biopsies, Table S1: The gene content of the liver and brain transcriptomes estimated in the BUSCO v3, Figures S5 and S6: The number of transcripts that was annotated by producing significant matches against different databases, Figure S7: The Gene Ontology terms of the top 5% highly expressed transcripts that differ significantly between the liver and brain cerebral cortex cells. Table S1. The gene content of the brushtail possum’s liver and brain cerebral cortex transcriptomes compared to the core-mammalian BUSCOs. Tables S2 and S3: Definition and number of KEGG metabolic pathways in the liver and brain cerebral cortex transcriptomes. Tables S4 and S5: Liver and brain synonymous/non-synonymous amino acid substitution. The raw sequences generated for this study were submitted to the Sequence Read Archive (SRA) at the NCBI database under Bio Project submission numbers PRJNA623153 and PRJNA623060.

Author Contributions

Conceptualization, A.E.-K., A.M.P., J.G.R., and E.C.M.; methodology, A.E.-K., A.M.P., J.G.R., E.C.M., P.R.T., and B.J.v.V.; validation, A.E.-K., A.M.P., J.G.R., E.C.M., P.R.T., and J.B.; formal analysis, A.E.-K, S.P.P., and D.M.M.; resources, A.M.P., J.G.R., E.C.M., P.R.T., and B.J.v.V.; writing—original draft preparation, A.E.-K., S.P.P., D.M.M., A.M.P., J.G.R., E.C.M., P.R.T., and B.J.v.V.; writing—review and editing, A.E.-K., S.P.P., D.M.M., A.M.P., J.G.R., E.C.M., P.R.T., and B.J.v.V.; funding acquisition, J.G.R., A.M.P., E.C.M., P.R.T., and B.J.v.V. A.E.-K., S.P.P., and D.M.M. contributed equally. All authors have read and agreed to the final version of the manuscript.

Funding

This study was funded by the New Zealand Ministry of Business, Innovation, and Employment under contract number LINX0902 to Lincoln University. Analytical platforms were provided by South African National Research Fund grant number 110728 to B.J.V. and a University of Johannesburg Global Excellence Stature Postdoctoral Fellowship to A.E.-K.

Acknowledgments

Authors acknowledge resources and support from Arizona State University Core Genomics facilities and in particular Mr Jason Steel for advice on study design, specimen collections, and sequencing. The authors express their gratitude to Prof Neil Gemmell at the University of Otago and Dr Tomas Nagy for his encouraging support. We would like to thank two anonymous reviewers for their constructive comments on the initial version of the manuscript. The computational resources for the current study were provided by the Center for High-Performance Computing in Cape Town, the University of Johannesburg IT service, and Lincoln University.

Conflicts of Interest

The authors declare no conflict of interest.

References

  1. Laird, M.; Bradshaw, J. The Break-up of a Long-Term Relationship: The Cretaceous Separation of New Zealand from Gondwana. Gondwana Res. 2004, 7, 273–286. [Google Scholar] [CrossRef]
  2. Wilmshurst, J.M.; Anderson, A.J.; Higham, T.F.; Worthy, T.H. Dating the Late Prehistoric Dispersal of Polynesians to New Zealand Using the Commensal Pacific Rat. Proc. Natl. Acad. Sci. USA 2008, 105, 7676–7680. [Google Scholar] [CrossRef] [PubMed] [Green Version]
  3. Wilmshurst, J.M.; Higham, T.F.; Allen, H.; Johns, D.; Phillips, C. Early Maori Settlement Impacts in Northern Coastal Taranaki, New Zealand. N. Zl. J. Ecol. 2004, 28, 167–179. [Google Scholar]
  4. Parkes, J.; Murphy, E. Management of Introduced Mammals in New Zealand. N. Z J. Zool. 2003, 30, 335–359. [Google Scholar] [CrossRef] [Green Version]
  5. Robertson, H.; Baird, K.; Dowding, J.; Elliott, G.; Hitchmough, R.; Miskelly, C.; McArthur, N.; O’Donnell, C.; Sagar, P.; Scofield, R. Conservation Status of New Zealand Birds, 2016; New Zealand Threat Classification Series 19; New Zealand Department of Conservation: Wellington, New Zealand, 2017. [Google Scholar]
  6. Emami-Khoyi, A.; Paterson, A.M.; Hartley, D.A.; Boren, L.J.; Cruickshank, R.H.; Ross, J.G.; Murphy, E.C.; Else, T.-A. Mitogenomics Data Reveal Effective Population Size, Historical Bottlenecks, and the Effects of Hunting on New Zealand Fur Seals (Arctocephalus Forsteri). Mitochondrial DNA Part A 2018, 29, 567–580. [Google Scholar] [CrossRef]
  7. Thomson, G.M. The Naturalisation of Animals and Plants in New Zealand; Cambridge University Press: Cambridge, UK, 1922. [Google Scholar]
  8. Pracy, L.T. Introduction and Liberation of the Opossum (Trichosurus vulpecula) into New Zealand; New Zealand Forest Service: New Zealand, 1962. [Google Scholar]
  9. Cowan, P. Brushtail Possum. In The Handbook of New Zealand Mammals, 2nd ed.; Oxford University Press: Oxford, UK, 2005. [Google Scholar]
  10. Brown, K.; Innes, J.; Shorten, R. Evidence That Possums Prey on and Scavenge Birds’ Eggs, Birds and Mammals. Notornis 1993, 40, 169–177. [Google Scholar]
  11. Murphy, E.C.; Russell, J.C.; Broome, K.G.; Ryan, G.J.; Dowding, J.E. Conserving New Zealand’s Native Fauna: A Review of Tools Being Developed for the Predator Free 2050 Programme. J. Ornithol. 2019, 160, 883–892. [Google Scholar] [CrossRef]
  12. Green, W. The Use of 1080 for Pest Control: A Discussion Document; Animal Health Board and the Department of Conservation: New Zealand, 2004. [Google Scholar]
  13. Ogilvie, S.; Miller, A.; Ataria, J.M.; Waiwai, J.; Doherty, J. Uptake of 1080 by Watercress and Puha—Culturally Important Plants Used for Food; Lincoln University Wildlife Management Report series [59]; Lincoln University: Christchurch, New Zealand, 2009. [Google Scholar]
  14. Eason, C.; Miller, A.; Ogilvie, S.; Fairweather, A. An Updated Review of the Toxicology and Ecotoxicology of Sodium Fluoroacetate (1080) in Relation to Its Use as a Pest Control Tool in New Zealand. N. Zeal. J. Ecol. 2011, 35, 1–20. [Google Scholar]
  15. King, D.; Oliver, A.; Mead, R. The Adaptation of Some Western Australian Mammals to Food Plants Containing Fluoroacetate. Aust. J. Zool. 1978, 26, 699–712. [Google Scholar] [CrossRef]
  16. Prentis, P.J.; Wilson, J.R.; Dormontt, E.E.; Richardson, D.M.; Lowe, A.J. Adaptive Evolution in Invasive Species. Trends Plant Sci. 2008, 13, 288–294. [Google Scholar] [CrossRef]
  17. Leger, E.A.; Rice, K.J. Invasive California Poppies (Eschscholzia Californica) Grow Larger Than Native Individuals under Reduced Competition. Ecol. Lett. 2003, 6, 257–264. [Google Scholar] [CrossRef] [Green Version]
  18. Triggs, S.; Green, W. Geographic Patterns of Genetic Variation in Brushtail Possums Trichosurus vulpecula and Implications for Pest Control. N. Zeal. J. Ecol. 1989, 12, 1–10. [Google Scholar]
  19. Sarre, S.D.; Aitken, N.; Adamack, A.T.; MacDonald, A.J.; Gruber, B.; Cowan, P. Creating New Evolutionary Pathways through Bioinvasion: The Population Genetics of Brushtail Possums in New Zealand. Mol. Ecol. 2014, 23, 3419–3433. [Google Scholar] [CrossRef] [PubMed]
  20. Cao, D. De Novo Transcriptome Analysis of Taxus Chinensis Var. Mairei to Identify Significant Pathways Associated with the Fruit Color of This Species. Biochem. Syst. Ecol. 2019, 84, 1–7. [Google Scholar] [CrossRef]
  21. Stahl, B.A.; Gross, J.B.; Speiser, D.I.; Oakley, T.H.; Patel, N.H.; Gould, D.B.; Protas, M.E. A Transcriptomic Analysis of Cave, Surface, and Hybrid Isopod Crustaceans of the Species Asellus Aquaticus. PLoS ONE 2015, 10, e0140484. [Google Scholar] [CrossRef] [Green Version]
  22. Soewarto, J.; Hamelin, C.; Bocs, S.; Mournet, P.; Vignes, H.; Berger, A.; Armero, A.; Martin, G.; Dereeper, A.; Sarah, G. Transcriptome Data from Three Endemic Myrtaceae Species from New Caledonia Displaying Contrasting Responses to Myrtle Rust (Austropuccinia Psidii). Data Brief 2019, 22, 794–811. [Google Scholar] [CrossRef]
  23. Liu, G.-H.; Xu, M.-J.; Chang, Q.-C.; Gao, J.-F.; Wang, C.-R.; Zhu, X.-Q. De Novo Transcriptomic Analysis of the Female and Male Adults of the Blood Fluke Schistosoma turkestanicum. Parasites Vectors 2016, 9, 143. [Google Scholar] [CrossRef] [Green Version]
  24. Bankers, L.; Neiman, M. De Novo Transcriptome Characterization of a Sterilizing Trematode Parasite (Microphallus Sp.) from Two Species of New Zealand Snails. G3 Genes Genomes Genet. 2017, 7, 871–880. [Google Scholar]
  25. Yang, M.; Wang, Q.; Wang, S.; Wang, Y.; Zeng, Q.; Qin, Q. Transcriptomics Analysis Reveals Candidate Genes and Pathways for Susceptibility or Resistance to Singapore Grouper Iridovirus in Orange-Spotted Grouper (Epinephelus coioides). Dev. Comp. Immunol. 2019, 90, 70–79. [Google Scholar] [CrossRef]
  26. Sarwar, M.B.; Ahmad, Z.; Rashid, B.; Hassan, S.; Gregersen, P.L.; De la O. Leyva, M.; Nagy, I.; Asp, T.; Husnain, T. De Novo Assembly of Agave sisalana Transcriptome in Response to Drought Stress Provides Insight into the Tolerance Mechanisms. Sci. Rep. 2019, 9, 396. [Google Scholar] [CrossRef] [Green Version]
  27. Patel, K.V.; Bohonak, A.J.; Simovich, M.A.; Goddard, N.S.; Graige, N.S. Discovery and Validation of Species–Specific Diagnostic SNP Markers for the Endangered San Diego Fairy Shrimp (Branchinecta sandiegonensis) and the Versatile Fairy Shrimp (Branchinecta lindahli). Conserv. Genet. Resour. 2018, 10, 897–905. [Google Scholar] [CrossRef]
  28. Chen, X.; Mei, J.; Wu, J.; Jing, J.; Ma, W.; Zhang, J.; Dan, C.; Wang, W.; Gui, J.-F. A Comprehensive Transcriptome Provides Candidate Genes for Sex Determination/Differentiation and SSR/SNP Markers in Yellow Catfish. Mar. Biotechnol. 2015, 17, 190–198. [Google Scholar] [CrossRef] [PubMed] [Green Version]
  29. Lipka, A.; Paukszto, L.; Majewska, M.; Jastrzebski, J.P.; Panasiewicz, G.; Szafranska, B. De Novo Characterization of Placental Transcriptome in the Eurasian Beaver (Castor fiber L.). Funct. Integr. Genom. 2019, 19, 421–435. [Google Scholar] [CrossRef] [PubMed] [Green Version]
  30. Dearden, P.K.; Gemmell, N.J.; Mercier, O.R.; Lester, P.J.; Scott, M.J.; Newcomb, R.D.; Buckley, T.R.; Jacobs, J.M.; Goldson, S.G.; Penman, D.R. The Potential for the Use of Gene Drives for Pest Control in New Zealand: A Perspective. J. R. Soc. N. Zeal. 2018, 48, 225–244. [Google Scholar] [CrossRef]
  31. Hu, D.G.; Marri, S.; McKinnon, R.A.; Mackenzie, P.I.; Meech, R. Deregulation of the Genes That Are Involved in Drug Absorption, Distribution, Metabolism, and Excretion in Hepatocellular Carcinoma. J. Pharmacol. Exp. Ther. 2019, 368, 363–381. [Google Scholar] [CrossRef] [Green Version]
  32. Porseryd, T.; Volkova, K.; Reyhanian Caspillo, N.; Källman, T.; Dinnetz, P.; Porsh Hällström, I. Persistent Effects of Developmental Exposure to 17α-Ethinylestradiol on the Zebrafish (Danio rerio) Brain Transcriptome and Behavior. Front. Behav. Neurosci. 2017, 11, 69. [Google Scholar] [CrossRef] [Green Version]
  33. Saaristo, M.; Wong, B.B.; Mincarelli, L.; Craig, A.; Johnstone, C.P.; Allinson, M.; Lindström, K.; Craft, J.A. Characterisation of the Transcriptome of Male and Female Wild-Type Guppy Brains with RNA-Seq and Consequences of Exposure to the Pharmaceutical Pollutant, 17α-Ethinyl Estradiol. Aquat. Toxicol. 2017, 186, 28–39. [Google Scholar] [CrossRef]
  34. Tourancheau, A.; Rouleau, M.; Guauque-Olarte, S.; Villeneuve, L.; Gilbert, I.; Droit, A.; Guillemette, C. Quantitative Profiling of the UGT Transcriptome in Human Drug-Metabolizing Tissues. Pharm. J. 2018, 18, 251. [Google Scholar] [CrossRef] [Green Version]
  35. Zygmunt, M.; Piechota, M.; Rodriguez Parkitna, J.; Korostyński, M. Decoding the Transcriptional Programs Activated by Psychotropic Drugs in the Brain. Genes Brain Behav. 2019, 18, e12511. [Google Scholar] [CrossRef]
  36. Tolosa, L.; Jiménez, N.; Pelechá, M.; Castell, J.V.; Gómez-Lechón, M.J.; Donato, M.T. Long-Term and Mechanistic Evaluation of Drug-Induced Liver Injury in Upcyte Human Hepatocytes. Arch. Toxicol. 2019, 93, 519–532. [Google Scholar] [CrossRef] [Green Version]
  37. Kontkanen, O.; Törönen, P.; Lakso, M.; Wong, G.; Castrén, E. Antipsychotic Drug Treatment Induces Differential Gene Expression in the Rat Cortex. J. Neurochem. 2002, 83, 1043–1053. [Google Scholar] [CrossRef] [PubMed]
  38. Corton, J.C.; Bushel, P.R.; Fostel, J.; Raegan, B. Sources of Variance in Baseline Gene Expression in the Rodent Liver. Mutat. Res./Genet. Toxicol. Environ. Mutagenesis 2012, 746, 104–112. [Google Scholar] [CrossRef] [PubMed] [Green Version]
  39. Merienne, N.; Meunier, C.; Schneider, A.; Seguin, J.; Nair, S.S.; Rocher, A.B.; Le Gras, S.; Keime, C.; Faull, R.; Pellerin, L. Cell-Type-Specific Gene Expression Profiling in Adult Mouse Bain Reveals Normal and Disease-State Signatures. Cell Rep. 2019, 26, 2477–2493.e2479. [Google Scholar] [CrossRef] [Green Version]
  40. Nadler, J.J.; Zou, F.; Huang, H.; Moy, S.S.; Lauder, J.; Crawley, J.N.; Threadgill, D.W.; Wright, F.A.; Magnuson, T.R. Large-Scale Gene Expression Differences across Brain Regions and Inbred Strains Correlate with a Behavioral Phenotype. Genetics 2006, 174, 1229–1236. [Google Scholar] [CrossRef] [PubMed] [Green Version]
  41. Bolger, A.M.; Lohse, M.; Usadel, B. Trimmomatic: A Flexible Trimmer for Illumina Sequence Data. Bioinformatics 2014, 30, 2114–2120. [Google Scholar] [CrossRef] [PubMed] [Green Version]
  42. Haas, B.J.; Papanicolaou, A.; Yassour, M.; Grabherr, M.; Blood, P.D.; Bowden, J.; Couger, M.B.; Eccles, D.; Li, B.; Lieber, M. De Novo Transcript Sequence Reconstruction from RNA-Seq Using the Trinity Platform for Reference Generation and Analysis. Nat. Protoc. 2013, 8, 1494. [Google Scholar] [CrossRef]
  43. Li, W.; Godzik, A. Cd-Hit: A Fast Program for Clustering and Comparing Large Sets of Protein or Nucleotide Sequences. Bioinformatics 2006, 22, 1658–1659. [Google Scholar] [CrossRef] [Green Version]
  44. Haas, B.; Papanicolaou, A. Transdecoder (Find Coding Regions within Transcripts). 2016. Available online: https://github.com/TransDecoder/TransDecoder (accessed on 17 June 2019).
  45. Bryant, D.M.; Johnson, K.; DiTommaso, T.; Tickle, T.; Couger, M.B.; Payzin-Dogru, D.; Lee, T.J.; Leigh, N.D.; Kuo, T.-H.; Davis, F.G. A Tissue-Mapped Axolotl De Novo Transcriptome Enables Identification of Limb Regeneration Factors. Cell Rep. 2017, 18, 762–776. [Google Scholar] [CrossRef] [Green Version]
  46. Finn, R.D.; Clements, J.; Eddy, S.R. HMMER Web Server: Interactive Sequence Similarity Searching. Nucleic Acids Res. 2011, 39, W29–W37. [Google Scholar] [CrossRef] [Green Version]
  47. Krogh, A.; Larsson, B.; Von Heijne, G.; Sonnhammer, E.L. Predicting Transmembrane Protein Topology with a Hidden Markov Model: Application to Complete Genomes. J. Mol. Biol. 2001, 305, 567–580. [Google Scholar] [CrossRef] [Green Version]
  48. Lagesen, K.; Hallin, P.; Rødland, E.A.; Stærfeldt, H.-H.; Rognes, T.; Ussery, D.W. RNAmmer: Consistent and Rapid Annotation of Ribosomal RNA Genes. Nucleic Acids Res. 2007, 35, 3100–3108. [Google Scholar] [CrossRef] [PubMed]
  49. Seppey, M.; Manni, M.; Zdobnov, E.M. Busco: Assessing Genome Assembly and Annotation Completeness. In Gene Prediction; Springer: Berlin/Heidelberg, Germany, 2019; pp. 227–245. [Google Scholar]
  50. Langmead, B.; Salzberg, S.L. Fast Gapped-Read Alignment with Bowtie 2. Nat. Methods 2012, 9, 357. [Google Scholar] [CrossRef] [PubMed] [Green Version]
  51. Li, H.; Durbin, R. Fast and Accurate Short Read Alignment with Burrows–Wheeler Transform. Bioinformatics 2009, 25, 1754–1760. [Google Scholar] [CrossRef] [PubMed] [Green Version]
  52. Li, H. Aligning Sequence Reads, Clone Sequences and Assembly Contigs with BWA-MEM. arXiv 2013, arXiv:1303.3997. [Google Scholar]
  53. Li, H.; Handsaker, B.; Wysoker, A.; Fennell, T.; Ruan, J.; Homer, N.; Marth, G.; Abecasis, G.; Durbin, R. The Sequence Alignment/Map Format and SAMtools. Bioinformatics 2009, 25, 2078–2079. [Google Scholar] [CrossRef] [Green Version]
  54. Koboldt, D.C.; Zhang, Q.; Larson, D.E.; Shen, D.; McLellan, M.D.; Lin, L.; Miller, C.A.; Mardis, E.R.; Ding, L.; Wilson, R.K. VarScan 2: Somatic Mutation and Copy Number Alteration Discovery in Cancer by Exome Sequencing. Genome Res. 2012, 22, 568–576. [Google Scholar] [CrossRef] [Green Version]
  55. Sacomoto, G.A.; Kielbassa, J.; Chikhi, R.; Uricaru, R.; Antoniou, P.; Sagot, M.-F.; Peterlongo, P.; Lacroix, V. KISSPLICE: De-Novo Calling Alternative Splicing Events from Rna-Seq Data. BMC Bioinform. 2012, 13, S5. [Google Scholar] [CrossRef] [Green Version]
  56. Li, B.; Dewey, C.N. RSEM: Accurate Transcript Quantification from Rna-Seq Data with or without a Reference Genome. BMC Bioinform. 2011, 12, 323. [Google Scholar] [CrossRef] [Green Version]
  57. Ashburner, M.; Ball, C.A.; Blake, J.A.; Botstein, D.; Butler, H.; Cherry, J.M.; Davis, A.P.; Dolinski, K.; Dwight, S.S.; Eppig, J.T. Gene Ontology: Tool for the Unification of Biology. Nat. Genet. 2000, 25, 25. [Google Scholar] [CrossRef] [Green Version]
  58. Reimand, J.; Kull, M.; Peterson, H.; Hansen, J.; Vilo, J. G: Profiler—A Web-Based Toolset for Functional Profiling of Gene Lists from Large-Scale Experiments. Nucleic Acids Res. 2007, 35, W193–W200. [Google Scholar] [CrossRef]
  59. Ye, J.; Zhang, Y.; Cui, H.; Liu, J.; Wu, Y.; Cheng, Y.; Xu, H.; Huang, X.; Li, S.; Zhou, A. WEGO 2.0: A Web Tool for Analyzing and Plotting Go Annotations, 2018 Update. Nucleic Acids Res. 2018, 46, W71–W75. [Google Scholar] [CrossRef] [PubMed]
  60. Supek, F.; Bošnjak, M.; Škunca, N.; Šmuc, T. REVIGO Summarizes and Visualizes Long Lists of Gene Ontology Terms. PLoS ONE 2011, 6, e21800. [Google Scholar] [CrossRef] [PubMed] [Green Version]
  61. Kuznetsova, I.; Lugmayr, A.; Siira, S.J.; Rackham, O.; Filipovska, A. CirGO: An Alternative Circular Way of Visualising Gene Ontology Terms. BMC Bioinform. 2019, 20, 84. [Google Scholar] [CrossRef] [PubMed] [Green Version]
  62. Kosakovsky Pond, S.L.; Frost, S.D. Not So Different after All: A Comparison of Methods for Detecting Amino Acid Sites under Selection. Mol. Biol. Evol. 2005, 22, 1208–1222. [Google Scholar] [CrossRef] [Green Version]
  63. Weaver, S.; Shank, S.D.; Spielman, S.J.; Li, M.; Muse, S.V.; Kosakovsky Pond, S.L. Datamonkey 2.0: A Modern Web Application for Characterizing Selective and Other Evolutionary Processes. Mol. Biol. Evol. 2018, 35, 773–777. [Google Scholar] [CrossRef] [Green Version]
  64. Kanehisa, M.; Sato, Y. KEGG Mapper for Inferring Cellular Functions from Protein Sequences. Protein Sci. 2019, 29, 28–35. [Google Scholar] [CrossRef] [Green Version]
  65. Huynh, T.; Xu, S. Gene Annotation Easy Viewer (Gaev): Integrating KEGG’s Gene Function Annotations and Associated Molecular Pathways. F1000Research 2018, 7, 416. [Google Scholar] [CrossRef]
  66. Gurevich, A.; Saveliev, V.; Vyahhi, N.; Tesler, G. QUAST: Quality Assessment Tool for Genome Assemblies. Bioinformatics 2013, 29, 1072–1075. [Google Scholar] [CrossRef]
  67. Dunlop, E.S.; McLaughlin, R.; Adams, J.V.; Jones, M.; Birceanu, O.; Christie, M.R.; Criger, L.A.; Hinderer, J.L.; Hollingworth, R.M.; Johnson, N.S. Rapid Evolution Meets Invasive Species Control: The Potential for Pesticide Resistance in Sea Lamprey. Can. J. Fish. Aquat. Sci. 2017, 75, 152–168. [Google Scholar] [CrossRef]
  68. Tammer, I.; Geginat, G.; Lange, S.; Kropf, S.; Lodes, U.; Schlüter, D.; Lippert, H.; Meyer, F. Antibiotic Consumption and the Development of Antibiotic Resistance in Surgical Units. Zent. Fur Chir. 2016, 141, 53–61. [Google Scholar]
  69. Vontas, J.; Grigoraki, L.; Morgan, J.; Tsakireli, D.; Fuseini, G.; Segura, L.; de Carvalho, J.N.; Nguema, R.; Weetman, D.; Slotman, M.A. Rapid Selection of a Pyrethroid Metabolic Enzyme CYP9K1 by Operational Malaria Control Activities. Proc. Natl. Acad. Sci. USA 2018, 115, 4619–4624. [Google Scholar] [CrossRef] [PubMed] [Green Version]
  70. Nacci, D.; Proestou, D.; Champlin, D.; Martinson, J.; Waits, E.R. Genetic Basis for Rapidly Evolved Tolerance in the Wild: Adaptation to Toxic Pollutants by an Estuarine Fish Species. Mol. Ecol. 2016, 25, 5467–5482. [Google Scholar] [CrossRef] [PubMed]
  71. Twigg, L.E.; Martin, G.R.; Lowe, T.J. Evidence of Pesticide Resistance in Medium-Sized Mammalian Pests: A Case Study with 1080 Poison and Australian Rabbits. J. Appl. Ecol. 2002, 39, 549–560. [Google Scholar] [CrossRef] [Green Version]
  72. Cowan, P.E.; Gleeson, D.M.; Howitt, R.L.; Ramón-Laca, A.; Esther, A.; Pelz, H.J. Vkorc1 Sequencing Suggests Anticoagulant Resistance in Rats in New Zealand. Pest Manag. Sci. 2017, 73, 262–266. [Google Scholar] [CrossRef]
  73. Joseph, P. Transcriptomics in Toxicology. Food Chem. Toxicol. 2017, 109, 650–662. [Google Scholar] [CrossRef]
  74. Kohonen, P.; Parkkinen, J.A.; Willighagen, E.L.; Ceder, R.; Wennerberg, K.; Kaski, S.; Grafström, R.C. A Transcriptomics Data-Driven Gene Space Accurately Predicts Liver Cytopathology and Drug-Induced Liver Injury. Nat. Commun. 2017, 8, 15932. [Google Scholar] [CrossRef]
  75. Huo, C.; Liu, X.; Zhao, J.; Zhao, T.; Huang, H.; Ye, H. Abnormalities in Behaviour, Histology and Prefrontal Cortical Gene Expression Profiles Relevant to Schizophrenia in Embryonic Day 17 Mam-Exposed C57bl/6 Mice. Neuropharmacology 2018, 140, 287–301. [Google Scholar] [CrossRef]
  76. Lisowski, P.; Wieczorek, M.; Goscik, J.; Juszczak, G.R.; Stankiewicz, A.M.; Zwierzchowski, L.; Swiergiel, A.H. Effects of Chronic Stress on Prefrontal Cortex Transcriptome in Mice Displaying Different Genetic Backgrounds. J. Mol. Neurosci. 2013, 50, 33–57. [Google Scholar] [CrossRef] [Green Version]
  77. Guengerich, F.P. Cytochrome P450 and Chemical Toxicology. Chem. Res. Toxicol. 2008, 21, 70–83. [Google Scholar] [CrossRef]
  78. Ingelman-Sundberg, M.; Sim, S.C.; Gomez, A.; Rodriguez-Antona, C. Influence of Cytochrome P450 Polymorphisms on Drug Therapies: Pharmacogenetic, Pharmacoepigenetic and Clinical Aspects. Pharmacol. Ther. 2007, 116, 496–526. [Google Scholar] [CrossRef]
  79. Johnson, R.N.; O’Meally, D.; Chen, Z.; Etherington, G.J.; Ho, S.Y.; Nash, W.J.; Grueber, C.E.; Cheng, Y.; Whittington, C.M.; Dennison, S. Adaptation and Conservation Insights from the Koala Genome. Nat. Genet. 2018, 50, 1102–1111. [Google Scholar] [CrossRef] [PubMed]
  80. Mead, R.J. The Biochemistry and Co-Evolutionary Role of Monofluoracetic Acid in Relation to Plant-Animal Interaction in Australia; University of Western Australia: Perth, Australia, 1980. [Google Scholar]
  81. Twigg, L.; Mead, R.; King, D. Metabolism of Fluoroacetate in the Skink (Tiliqua rugosa) and the Rat (Rattus norvegicus). Aust. J. Biol. Sci. 1986, 39, 1–16. [Google Scholar] [CrossRef] [PubMed]
  82. Twigg, L.E.; King, D.R. The Impact of Fluoroacetate-Bearing Vegetation on Native Australian Fauna: A Review. Oikos 1991, 61, 412–430. [Google Scholar] [CrossRef] [Green Version]
  83. Zaman, G.; Flens, M.; Van Leusden, M.; De Haas, M.; Mülder, H.; Lankelma, J.; Pinedo, H.; Scheper, R.; Baas, F.; Broxterman, H. The Human Multidrug Resistance-Associated Protein MRP Is a Plasma Membrane Drug-Efflux Pump. Proc. Natl. Acad. Sci. USA 1994, 91, 8822–8826. [Google Scholar] [CrossRef] [Green Version]
  84. Cole, S.P.; Sparks, K.E.; Fraser, K.; Loe, D.W.; Grant, C.E.; Wilson, G.M.; Deeley, R.G. Pharmacological Characterization of Multidrug Resistant MRP-Transfected Human Tumor Cells. Cancer Res. 1994, 54, 5902–5910. [Google Scholar]
  85. Loe, D.W.; Deeley, R.; Cole, S. Biology of the Multidrug Resistance-Associated Protein, Mrp. Eur. J. Cancer 1996, 32, 945–957. [Google Scholar] [CrossRef]
  86. Gao, M.; Yamazaki, M.; Loe, D.W.; Westlake, C.J.; Grant, C.E.; Cole, S.P.; Deeley, R.G. Multidrug Resistance Protein Identification of Regions Required for Active Transport of Leukotriene C4. J. Biol. Chem. 1998, 273, 10733–10740. [Google Scholar] [CrossRef] [Green Version]
  87. Ohmichi, M.; Hayakawa, J.; Tasaka, K.; Kurachi, H.; Murata, Y. Mechanisms of Platinum Drug Resistance. Trends Pharmacol. Sci. 2005, 26, 113–116. [Google Scholar] [CrossRef]
  88. Wernyj, R.P.; Morin, P.J. Molecular Mechanisms of Platinum Resistance: Still Searching for the Achilles’Heel. Drug Resist. Updates 2004, 7, 227–232. [Google Scholar] [CrossRef]
  89. Berretz, G.; Arning, L.; Gerding, W.M.; Friedrich, P.; Fraenz, C.; Schlüter, C.; Epplen, J.T.; Güntürkün, O.; Beste, C.; Genç, E. Structural Asymmetry in the Frontal and Temporal Lobes Is Associated with PCSK6 VNTR Polymorphism. Mol. Neurobiol. 2019, 56, 7765–7773. [Google Scholar] [CrossRef]
  90. Smedler, E.; Abé, C.; Pålsson, E.; Ingvar, M.; Landén, M. CACNA1C Polymorphism and Brain Cortical Structure in Bipolar Disorder. J. Psychiatry Neurosci. JPN 2019, 45, 190029. [Google Scholar] [PubMed]
  91. Ross, J.; Hickling, G.; Morgan, D.; Eason, C. The Role of Non-Toxic Prefeed and Postfeed in the Development and Maintenance of 1080 Bait Shyness in Captive Brushtail Possums. Wildl. Res. 2000, 27, 69–74. [Google Scholar] [CrossRef]
  92. Twigg, L.E. Occurrence of Fluoroacetate in Australian Plants and Tolerance to 1080 in Indigenous Australian Animals. In Proceedings of the Science Workshop, Christchurch, New Zealand; 1994; pp. 97–115. [Google Scholar]
  93. Kandel, A.; Chenoweth, M.B. Tolerance to Fluoroacetate and Fluorobutyrate in Rats. J. Pharmacol. Exp. Ther. 1952, 104, 248–252. [Google Scholar] [PubMed]
  94. Guillemaud, T. The Skill and Style to Model the Evolution of Resistance to Pesticides and Drugs. Evol. Appl. 2010, 3, 375–390. [Google Scholar]
Figure 1. Functional annotation of all polymorphic transcripts in brushtail possum liver cells based on Gene Ontology (GO) categorisation. The X-axis indicates GO functions and the Y-axis shows the percentage of transcripts in log (10) scales.
Genes 11 00436 g001
Figure 2. Functional annotation of all polymorphic transcripts in brushtail possum brain cerebral cortex cells based on Gene Ontology (GO) categorisation. The X-axis indicates GO functions and the Y-axis shows the percentage of transcripts in log (10) scales.
Genes 11 00436 g002
Figure 3. Intra-individual variation in the functional content of polymorphic transcripts in brushtail possum liver cells based on Gene Ontology (GO) categorisation. The X-axis indicates GO functions and the Y-axis shows the percentage of transcripts.
Genes 11 00436 g003
Figure 4. Intra-individual variation in the functional content of polymorphic transcripts in brushtail possum cerebral cortex cells based on Gene Ontology (GO) categorisation. The X-axis indicates GO functions and the Y-axis shows the percentage of transcripts.
Genes 11 00436 g004
Figure 5. Functional enrichment of 10 transcripts with the highest levels of polymorphism, based on Gene Ontology (GO) categorisation, in brushtail possum liver cells compared to the grey short-tailed opossum (Monodelphis domestica) complete gene set.
Genes 11 00436 g005
Figure 6. Functional enrichment of 10 transcripts with the highest levels of polymorphism, based on Gene Ontology (GO) categorisation, in brushtail possum cerebral cortex cells compared to the grey short-tailed opossum (Monodelphis domestica) complete gene set.
Genes 11 00436 g006
Table 1. Summary statistics of the reference transcriptome assembly of the New Zealand brushtail possum’s liver and brain cerebral cortex tissue as estimated in QUAST v.4.0 [66].
Assembly NameLiver CellsBrain Cells
Number of contigs 58,00164,735
Number of contigs ≥ 1000 bp13,36112,385
Number of contigs ≥ 5000 bp605612
Number of contigs ≥ 10,000 bp1924
Total length bp47,176,16547,783,051
Total length ≥ 1000 bp29,238,91827,088,346
Total length ≥ 5000 bp3,994,5864,080,570
Total length ≥ 10,000 bp245,362318,579
Largest contig 18,15921,422
GC %42.5742.68
N5014471247
N75 607508
L5086609524
L7521,24024,749
Table 2. Kyoto Encyclopaedia of Genes and Genomes (KEGG) metabolic pathway names and number of instances identified in the top 5% of the highly expressed genes within the brushtail possum liver transcriptome.
Metabolic PathwayNumber
Global and overview maps591
Carbohydrate metabolism134
Energy metabolism65
Lipid metabolism118
Nucleotide metabolism12
Amino acid metabolism152
Metabolism of other amino acids25
Glycan biosynthesis and metabolism17
Metabolism of cofactors and vitamins54
Metabolism of terpenoids and polyketides10
Biosynthesis of other secondary metabolites12
Xenobiotics biodegradation and metabolism60
Transcription8
Translation98
Folding, sorting, and degradation70
Replication and repair3
Membrane transport5
Signal transduction228
Signalling molecules and interaction35
Transport and catabolism116
Cell growth and death60
Cellular community—eukaryotes54
Cellular community—prokaryotes2
Cell motility23
Immune system181
Endocrine system185
Circulatory system24
Digestive system67
Excretory system18
Nervous system81
Sensory system14
Development and regeneration21
Aging23
Environmental adaptation49
Table 3. Kyoto Encyclopaedia of Genes and Genomes (KEGG) metabolic pathway names and number of instances identified in the top 5% of the highly expressed genes within the brushtail possum cerebral cortex transcriptome.
Metabolic PathwayNumber
Global and overview maps254
Carbohydrate metabolism62
Energy metabolism59
Lipid metabolism30
Nucleotide metabolism11
Amino acid metabolism51
Metabolism of other amino acids6
Glycan biosynthesis and metabolism10
Metabolism of cofactors and vitamins9
Metabolism of terpenoids and polyketides5
Biosynthesis of other secondary metabolites6
Xenobiotics biodegradation and metabolism10
Transcription14
Translation104
Folding, sorting and degradation61
Replication and repair6
Membrane transport1
Signal transduction442
Signaling molecules and interaction39
Transport and catabolism128
Cell growth and death100
Cellular community - eukaryotes79
Cellular community - prokaryotes2
Cell motility32
Immune system184
Endocrine system256
Circulatory system46
Digestive system66
Excretory system41
Nervous system196
Sensory system29
Development and regeneration44
Aging26
Environmental adaptation68
Table 4. Name and description of the putative genes involved in drug and xenobiotic substance metabolic pathways in brushtail possum liver cells as predicted using the KEGG database.
Gene NameDescription
frmA, ADH5, adhCS-(hydroxymethyl)glutathione dehydrogenase/alcohol dehydrogenase
AOXaldehyde oxidase
DPYDdihydropyrimidine dehydrogenase (NADP+)
MAO, aofHmonoamine oxidase
FMOdimethylaniline monooxygenase (N-oxide forming)
UGTglucuronosyltransferase
GST, gstglutathione S-transferase
ndk, NMEnucleoside-diphosphate kinase
CES1carboxylesterase 1
DPYS, dht, hydAdihydropyrimidinase
dut, DUTdUTP pyrophosphatase
PIK3R1_2_3phosphoinositide-3-kinase regulatory subunit α/β/delta
CES2carboxylesterase 2
CYP1A2cytochrome P450 family 1 subfamily A polypeptide 2
CYP2E1cytochrome P450 family 2 subfamily E polypeptide 1
GSTK1glutathione S-transferase kappa 1
ADH1_7alcohol dehydrogenase 1/7
CYP3A4cytochrome P450 family 3 subfamily A polypeptide 4
CYP3A5cytochrome P450 family 3 subfamily A polypeptide 5
CYP2B6cytochrome P450 family 2 subfamily B polypeptide 6
CYP2C8cytochrome P450 family 2 subfamily C polypeptide 8
CYP2C19cytochrome P450 family 2 subfamily C polypeptide 19
Table 5. Name and description of the putative genes involved in drug and xenobiotic metabolic pathways in brushtail possum brain cerebral cortex cells as predicted using the KEGG database.
Gene NameDescription
CBR1carbonyl reductase 1
hprT, hpt, HPRT1hypoxanthine phosphoribosyltransferase
GST, gstglutathione S-transferase
ndk, NMEnucleoside-diphosphate kinase
dut, DUT dUTP pyrophosphatase
PIK3R1_2_3phosphoinositide-3-kinase regulatory subunit α/β/delta
TOP2DNA topoisomerase II
ERK, MAPK1_3mitogen-activated protein kinase 1/3
AKT RACserine/threonine-protein kinase

