Article

Transcriptomic Analysis Provides Insights into the Differential Effects of Aluminum on Peanut (Arachis hypogaea L.)

1
Guangzhou Key Laboratory for Research and Development of Crop Germplasm Resources, Innovative Institute for Modern Seed Industry, Zhongkai University of Agriculture and Engineering, Guangzhou 510225, China
2
Department of Botany, Division of Science and Technology, University of Education, Lahore 54770, Pakistan
*
Author to whom correspondence should be addressed.
Genes 2022, 13(10), 1830; https://doi.org/10.3390/genes13101830
Submission received: 23 August 2022 / Revised: 1 October 2022 / Accepted: 5 October 2022 / Published: 10 October 2022
(This article belongs to the Special Issue Peanut Genetics and Omics)

Abstract

:
In acidic soils, high concentrations of aluminum ions (Al3+) in dissolved form reduce root growth and development of most crops. In addition, Al3+ is also a beneficial element in some plant species in low concentrations. However, the regulatory mechanism of the growth and development of peanut (Arachis hypogaea L.) treated with different concentrations of Al3+ has been rarely studied. In this study, peanut seedlings were treated with AlCl3.18H2O in Hoagland nutrient solution at four different concentrations of Al3+, i.e., 0 (pH 6.85), 1.25 (pH 4.03), 2.5 (pH 3.85), and 5 (pH 3.69) mmol/L, which are regarded as Al0, Al1, Al2, and Al3. The results showed that low concentrations of Al treatment (Al1) promoted peanut growth, while high concentrations of Al treatments (Al2 and Al3) significantly inhibited peanut growth. Compared with the control (Al0), transcriptome analysis showed that the differentially expressed genes (DEGs) of starch and sucrose metabolic pathways were significantly enriched at low concentrations, i.e., Al1 treatment, whereas the expression of AhERD6 (sugar transporter) was significantly up-regulated, and the soluble sugar content was significantly increased. The DEGs of the plant hormone signaling transduction pathway were significantly enriched at high concentrations of Al2 and Al3 treatments, whereas the expression of AhNCED1 (9-cis-epoxycarotenoid dioxygenase) was significantly up-regulated, and the content of ABA was significantly increased. Moreover, the expression of transcription factors (TFs) in peanut was affected by different concentrations of Al. Overall, low concentrations of Al1 promoted peanut growth by increasing soluble sugar content, while high concentrations of Al2 and Al3 inhibited the growth of peanut, induced AhNCED1 gene expression, and increased endogenous ABA content. For peanut, the exposure of Al at low concentrations not only derived an adaptive mechanism to cope with Al stress, but also acted as a stimulator to promote its growth and development.

1. Introduction

Aluminum (Al) is the most abundant metallic element on Earth, accounting for 7.45% of total mineral weight [1]. Usually, Al in soil mainly exists in the form of stable aluminum oxides and aluminosilicates, which are not easily absorbed by plants [2]. When soil is acidified, H+ will replace Al in soil minerals to form active Al that reacts with other components in the soil to form different forms of Al, e.g., exchangeable Al (EXAl), hydroxy adsorbed Al (HyAl), organic complex Al (OrAl), iron oxide bound Al (DCBAl), interlayer Al (InAl) and amorphous aluminosilicates, and gibbsite (NcAl) [3]. Among them, EXAl and HyAl are toxic to plants [4,5], whilst EXAl is the most active free Al compound in soil. When soil pH is strongly acidic, EXAl mainly exists in the form of A13+, as it is the most easily adsorbed by negative charges, thereby entering plant cells [6]. When plants accumulate excess A13+, the most obvious symptom is an inhibited root system [7]. Under Al stress, uptake of essential elements such as magnesium (Mg), phosphorus (P), iron (Fe), and molybdenum (Mo) through roots is inhibited, resulting in stunted plant development, reduced leaf area, yellowing, and ultimately, death of plants [8]. Moreover, P utilization efficiency and Fe transport efficiency with Al tolerance may be adapted to acidic soils, implying that the molecular mechanisms behind their co-evolution are complex [9,10].
Previously, low concentrations of Al3+ have been shown to have beneficial effects on a number of plant species, especially those native to the tropics in acidic soils [11]. Low concentrations of Al3+ alleviate H+ and P toxicity under low pH conditions and excess P, respectively [12]. Al3+-promoted growth has also been observed in low-P conditions and in plants tolerant to low pH, which means that the phenomenon that Al3+ promotes plant growth also exists in the absence of excess H+ and P [13]. Low concentrations of Al3+ in rice promoted growth and increased soluble sugar content in roots [11]. Soluble sugars might act as osmo-protectants, and low concentrations of Al3+ induced the expression of a sugar transporter (ERD6), which facilitated the transport of soluble sugars to specific tissues or organelles [11]. Thus, low concentrations of Al3+ act as bio-stimulants in crops to promote growth and development. However, there is no evidence whether the peanut generally grown in South China has also evolved such mechanisms to promote growth under low concentrations of Al3+.
Plants generally protect themselves against higher Al3+ concentration through external exclusion and/or internal protection mechanisms [14,15]. The external exclusion mechanism induces the production of organic acids such as malic acid, citric acid, and oxalic acid to combine with Al3+ to form a non-toxic complex, thereby preventing Al3+ from entering the root tip cells of plants [16]. The internal tolerance mechanism involves the adsorption of Al3+ by hemicellulose and pectin in the cell wall and the transfer of Al3+ into the vacuole by organic acid transporters in the cytoplasm [14]. There are two main families of transporters associated with organic acid secretion, multi-drug and toxic compound extrusion (MATE) and aluminum-activated malate transporter (ALMT). MATE and ALMT were reported to control citrate and malate secretion, respectively [9]. AhFRDL1 encoding MATE family proteins have been cloned in peanut. Al induced the expression of the AhFRDL1 gene and the secretion of citrate in peanut root tips, and AhFRDL1 was involved in peanut aluminum tolerance by regulating citrate secretion [10]. Al stress-induced ALMT expression has been demonstrated in a variety of plants [17]. TaALMT1, AtALMT1, GmAMLT1 in wheat (Triticum aestivum L.), Arabidopsis thaliana, and soybean (Glycine max) are involved in malate secretion, whereas the expression levels of these genes are higher in resistant cultivars than in susceptible cultivars [18]. AhALMT9 in peanut has high homology with AtALMT1 in Arabidopsis [15]. The cell wall prevented Al3+ from entering cells by inducing the expression of pectin methylesterase (PME) family genes and enhancing the activity of the PME enzyme [19]. Furthermore, OsSTAR1 and OsSTAR2 encoded the nucleotide-binding domain and transmembrane region of the ABC transporter, respectively, whilst OsSTAR1 and OsSTAR2 masked the binding site of Al3+ on the cell wall by regulating the transport of UDP-glucose, thereby improving the Al tolerance of rice [18]. ALS3 encodes the gene for the ABC transporter and is localized on the cytoplasmic membrane [18]. Larsen et al. [18] found that the main function of AtALS3 was to transport Al3+ from the root tip to the vacuole. The ABA phytohormone pathway is a central regulator of most abiotic stress tolerance mechanisms [20]. Al stress has been found to induce ABA accumulation in various plants [21]. For example, Hou et al. [18] found that abscisic acid (ABA) is involved in the regulation of citrate secretion in soybean roots, whilst the addition of ABA inhibitors inhibits the growth of soybean roots, indicating that ABA induces Al tolerance of soybeans. In addition, previous studies have shown that transcription factors (TFs) such as STOP1, ART1, and WRKY play important roles in plant tolerance to Al [14,22,23].
Peanut (Arachis hypogaea L.) is one of the world’s four major oil crops and an essential economic crop in China [15]. Peanut planting areas in Southern China are mainly composed of red and yellow soil having acidic properties. In the second soil survey, the pH of the soil was mostly 6.0–6.5 in South China. Current soil fertility monitoring results show that the pH of the soil has dropped by 0.2–0.5 pH units [24]. According to the physicochemical characteristics of Al in soil, Al can easily be replaced by H+ in acidic soils [6]. However, the mechanism of the effect of different concentrations of Al3+ on the growth and development of peanut remains less focused. The present study was therefore conducted to assess the effects of low and high concentrations of Al on the growth and transcriptional regulation mechanisms in peanut. This study provides a theoretical basis to understand the ecological adaptability of peanut under Al contaminated conditions.

2. Materials and Methods

2.1. Plant Materials and Treatment Conditions

The hydroponic experiment was carried out in the Guangzhou Key Laboratory for Research and Development of Crop Germplasm Resources, Zhongkai University of Agriculture and Engineering, Guangzhou, China (23104 N, 113281 E) from March to July 2021. The peanut cultivar “Guihua58” was provided by the Guangxi Academy of Agricultural Sciences, Nanning, China. Homogenous seeds were surface sterilized and germinated in a Petri dish on wet filter paper with 20 seeds per Petri dish. After three days, the seeds were transferred to a plastic culture bowl and continued to cultivate with Hoagland nutrient solution. After one week of growth, peanut seedlings were treated with AlCl3.18H2O in Hoagland nutrient solution at four different concentrations of Al3+, i.e., 0 (pH 6.85), 1.25 (pH 4.03), 2.5 (pH 3.85), and 5 (pH 3.69) mmol/L, and regarded as Al0, Al1, Al2, and Al3. Plant height was measured and recorded every 24 h after exposure to Al treatment. The nutrient solution was replaced once every three days. Leaves were taken after 14 days of treatment. The fresh leaves were stored at −80 °C in a freezer immediately for transcriptome sequencing, ABA content, soluble sugar content, and gene expression determination. Experimental treatments were arranged in a completely randomized design (CRD) with three biological samples and three technical replicates/Data were compiled using Microsoft Excel 2010 (Microsoft, Chicago, IL, USA). SPSS Statistics 20.0 (IBM, Chicago, IL, USA) was used for one-way analysis of variance, and Tukey’s test at the 5% significance level was used to separate treatment means. The R programming language was used for mapping (Auckland, New Zealand).

2.2. Raw Sequencing Data

After RNA extraction, magnetic beads with Oligo (dT) were used to enrich eukaryotic mRNA. A fragmentation buffer was added to interrupt mRNA randomly. The first cDNA was synthesized using mRNA as a template and a six-base random hexamer as a primer, then buffer, dNTPs, RNase H, and DNA polymerase I were added to synthesize the second cDNA, and the cDNA was purified with AMPure XP beads. The purified double-stranded cDNA was repaired, A-tailed, and connected to the sequencing adapter, and then AMPure XP beads were used for fragment size selection. Finally, the cDNA library was obtained by PCR enrichment. Qubit 2.0 and Agilent 2100 were used to detect the library’s concentration and insert size, and the library’s effective concentration was accurately quantified using the Q-PCR method to ensure the quality of the library. High-throughput sequencing was performed with NovaSeq 6000, and the sequencing read length was PE150. Initially, the obtained clean reads were filtered to obtain high-quality clean reads. The following filtering criteria were followed: i.e., remove reads containing adapters; remove reads with all A bases; remove reads with N ratio greater than 10%; remove low-quality reads (the number of bases with quality value Q ≤ 20 accounts for more than 50% of the entire reads). The normalization method was fragments per kilobase of transcript per million mapped reads (FPKM) method, and the formula was FPKM = 106C [NL(10−3]−1 (C is the number of sequenced fragments aligned to gene A, N is the total number of sequenced fragments aligned to the reference gene, and L is the number of bases of gene A). The differentially expressed genes (DEGs) between the comparison groups were obtained by standardizing processing and screening conditions. The default parameters were FDR = 0.01 and FC = 2. Raw sequencing data have been uploaded in the NCBI Gene Expression Omnibus under Accession Number PRJNA754251 (https://www.ncbi.nlm.nih.gov/sra/?term=PRJNA754251 (accessed on 12 August 2021)).

2.3. Enrichment Analysis

Raw data analysis was performed using BMKCloud (www.biocloud.net). The differentially expressed genes (DEGs) between the comparison groups were obtained by standardizing processing and screening conditions. The default parameters were FDR = 0.01 and FC = 2. The KEGG database was used for functional annotation, classification statistics, and metabolic pathway analysis of DEGs in the comparison group [15].

2.4. Real-Time Quantitative RT-PCR

RNA extraction was performed using the RNAprep Pure Plant Kit (TianGen Biotech, Beijing, China). RNA quality detection was performed using a micro-spectrophotometer (Allsheng, Nano-300, Hangzhou, China). cDNA synthesis used the PrimeScriptRT Reagent Kit with the gDNA Eraser Kit (TaKaRa, Beijing, China). Then, 2× SYBR Green qPCR Mixture Kit (Hlingene Corporation, Shanghai, China) and Option Real-Time PCR System (Bio-Rad, CFX96, Hercules, CA, USA) instruments were used for real-time fluorescent quantitative PCR. Data were analyzed using the 2−∆∆CT method. cDNA was used as a template, three biological replicates were set for each sample, the actin gene was used as an internal reference gene, primar 5.0 was used to design qPCR primers, and primers were synthesized by Sangon Biotech (Shanghai, China) (Table 1).

2.5. Determination of Soluble Sugar Content

Leaves (50 mg) were ground into powder in an ice bath, and 50 mL of 80% ethanol was used for extraction at room temperature. After centrifuging the supernatant, 80% ethanol was added to make up 10 mL. The extraction was added to a 50 mL centrifuge tube, and 5 mL of anthrone (0.4% in concentrated sulfuric acid) was added. The reaction was stopped after 15 min at 95 °C in a water bath. Sucrose (0.015% w/v) was used to construct the standard curve. Soluble sugar content was measured at absorbance at 600 nm [11].

2.6. Determination of ABA Content

The cartridge was activated with 4 mL of methanol and 2 mL of 0.1 M aqueous ammonia solution. Fresh leaves (100 mg) were homogenized with 1 mL of extraction solution (acetonitrile/water = 1:1, containing sodium diethyldithiocarbamate) in an ice bath for 4 h at 4 °C and 12,000 rpm for 10 min. The supernatant was concentrated in vacuo; 0.1 M aqueous ammonia solution was added to the volume to 2 mL and then passed through the MAX cartridge. The MAX cartridge was washed with 2 mL of 0.1 M ammonia solution and 2 mL of 0.1 M ammonia solution with 60% methanol, and finally, 0.2 mL of methanol was added to dissolve it. The chromatographic system was an ultra-high-performance liquid system (Vanquish, Thermo, Waltham, MA, USA), and the mass spectrometry system was a Q-executive high-resolution mass spectrometry detection system (Vanquish, Thermo, USA). The liquid chromatography column used was Waters HSS T3 (50 × 2.1 mm, 1.8 μm). The sample volume was 2 μL. The column temperature was 40 °C. The CAS number of the ABA standard product was 14375-45-2, and the gradient concentration of the standard sample was 0.2, 0.5, 1, 10, 40, 80, 120, 160, 200, and 300 ng mL−1. The retention time of ABA was 3.58 min. The equation was Y = 4.441 × 10⁵ X. The fit was 0.9992 [15].

3. Results

3.1. Effects of Different Concentrations of Al3+ on the Morphological Characteristics of Peanut and the Expression of AhALMT9 and AhFRDL1 Genes

Compared with Al0, the Al1 treatment increased peanut plant height by 9%. However, Al2 and Al3 reduced plant height by 21% and 40%, respectively (Figure 1A,B). The expression levels of AhALMT9 and AhFRDL1 genes were measured in peanut leaves under the different Al concentrations treatment. Compared with Al0, the gene expression of AhALMT9 and AhFRDL1 was significantly up-regulated under Al2 and Al3 treatments which were up-regulated by 1.3–1.5 times and 1.7–8.7 times, respectively. Compared with Al0, the AhALMT9 gene expression was significantly reduced by 77% under the Al1 treatment (Figure 1C). Compared with Al0, the expression of the AhFRDL1 gene was insignificantly different under the Al1 treatment (Figure 1D).

3.2. Sequencing Statistics

Sequencing data of all samples were quality evaluated. The original bases of the sequencing data of each sample were between 5,777,435,056 and 7,275,220,472, the GC content of the sequence was between 45.43% and 46.01%, and the Q30 value was above 92.77% (Table 2).

3.3. Mapping of Reads to the Reference Genome

Clean reads were compared with the reference genome, and the number of effective sequences that could be aligned on the reference genome for each sample sequence was between 36,691,674 and 45,441,812, and the contrast ratio was above 94.04% and 8.46% of multiple mapped reads on the reference genome. The unique mapped reads on the reference genome reached more than 84.8% (Table 3). Data showed that the sequencing quality of the transcriptome data was good, the experimental process was pollution-free, and the selected reference genome information could meet the needs of subsequent analysis.

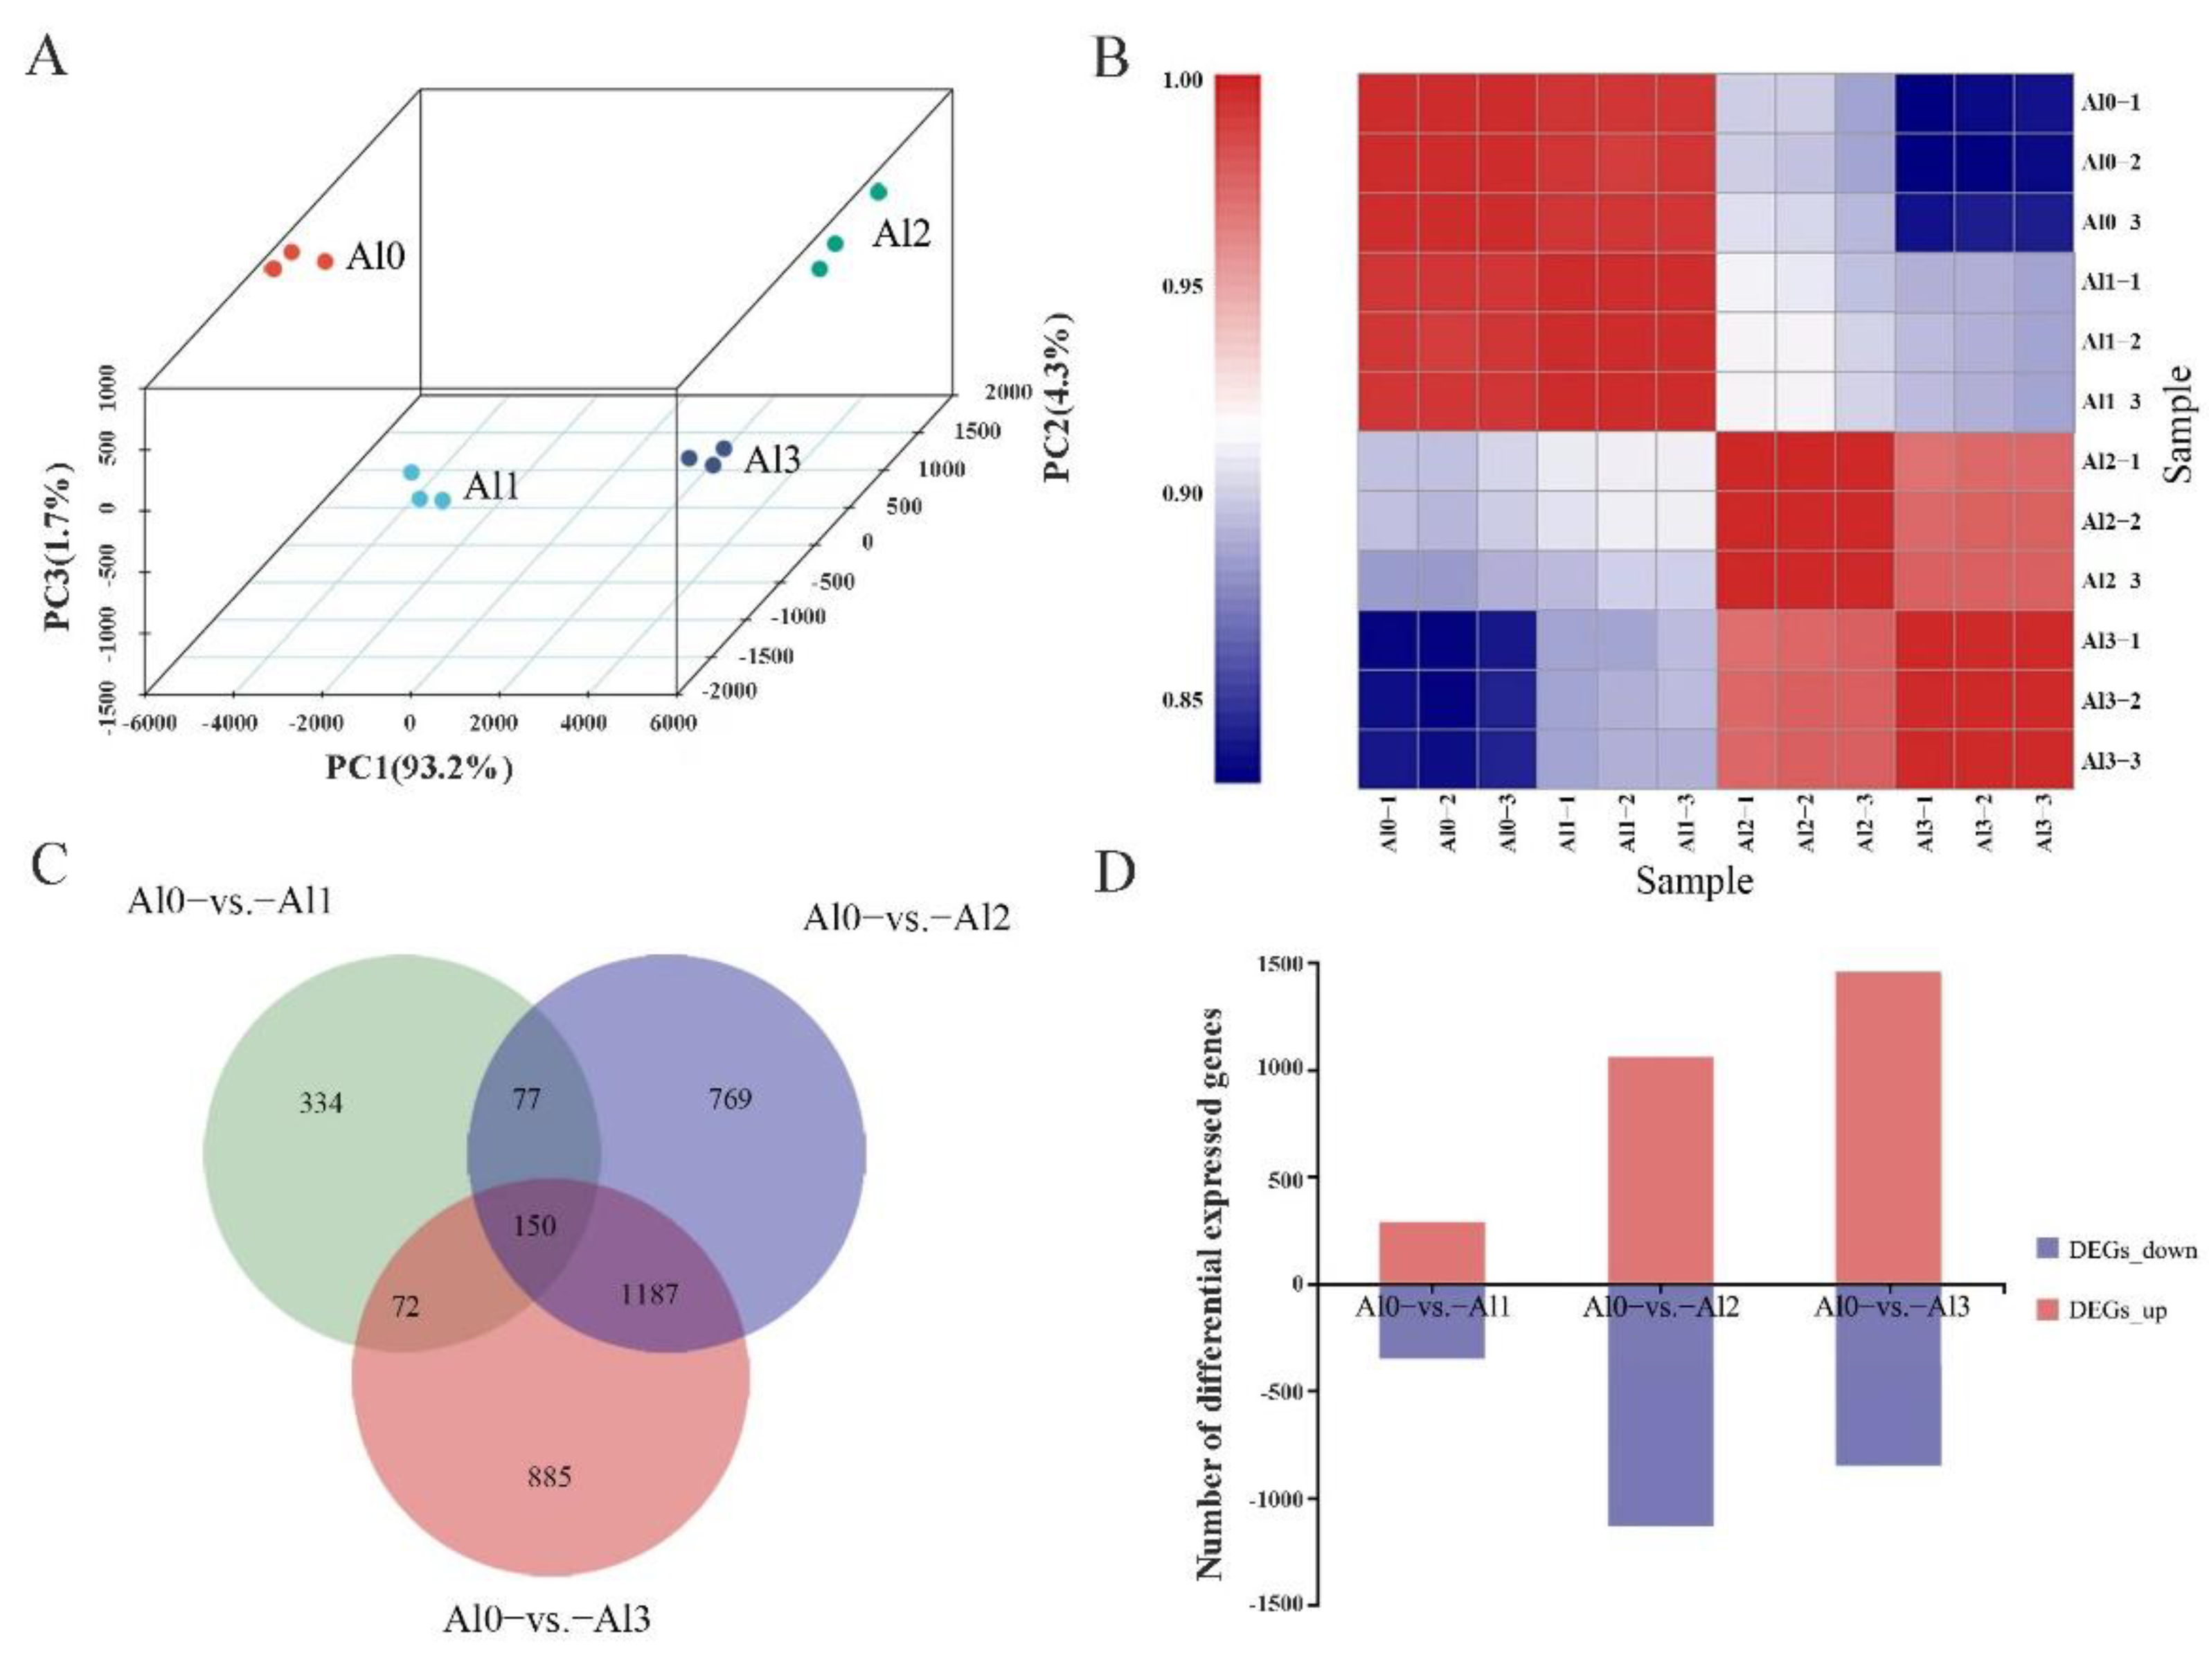
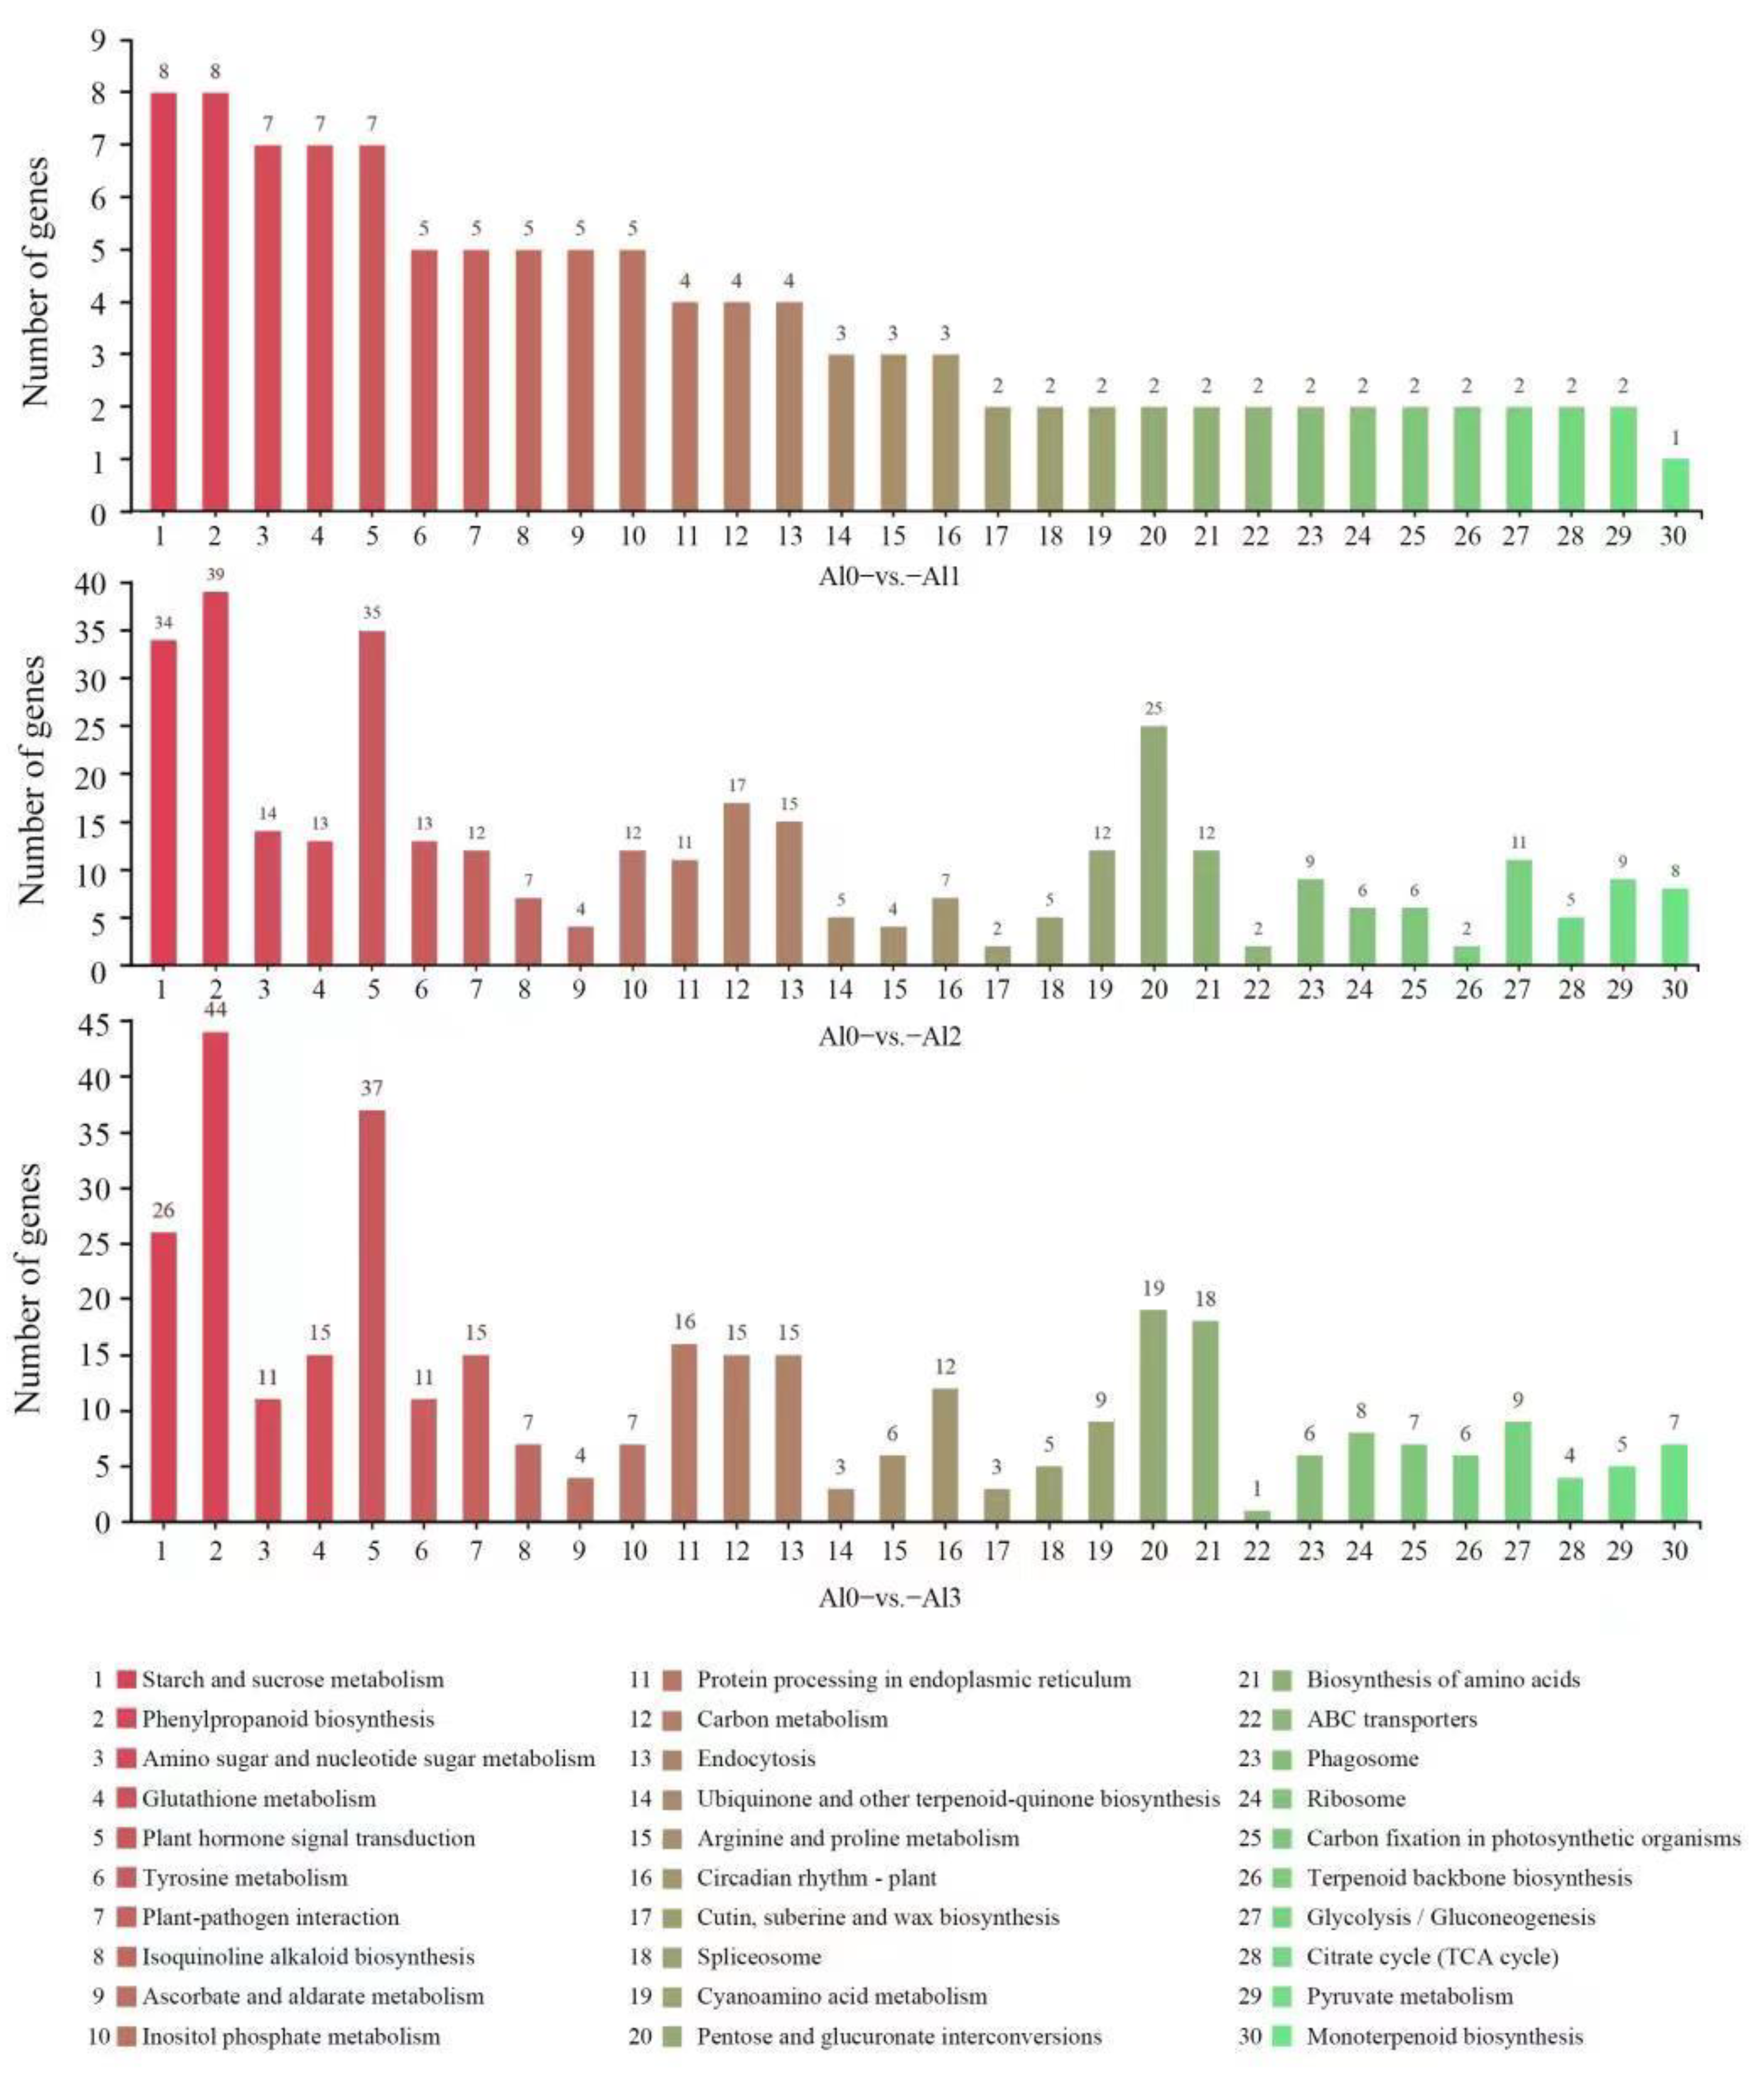
3.4. DEGs Identification and KEGG Pathway Analysis

Principal component analysis (PCA) (Figure 2A) and sample-to-sample clustering analysis (Figure 2B) indicated that the same cultivar of control and Al treatment were clustered together. They showed that the library construction quality and sequencing quality results of the sequencing sample were reliable and could be used for subsequent analysis. The distance between each sample point represented the distance of the sample by PCA analysis. The closer the distance, the higher the similarity between the samples, and the better the repeatability between the samples. The Venn diagram showing overlapping and unique DEGs between different peanut samples Al0 vs. Al1, Al0 vs. Al2, and Al0 vs. Al3 is presented in Figure 2C. Through the comparison between samples, the results showed that for Al0 vs. Al1, a total of 633 DEGs were obtained, of which 285 were up-regulated and 348 were down-regulated. For Al0 vs. Al2, 2183 DEGs were obtained, of which 1058 were up-regulated and 1125 were down-regulated. For Al0 vs. Al3, 2294 DEGs were obtained, of which 1447 were up-regulated and 847 were down-regulated. Through the screening and analysis of DEGs between sample groups, it was found that the number of DEGs of Al0 vs. Al3 was the largest, indicating that with the increase in Al concentration, more genes in peanut leaves participated in expression regulation in response to Al stress (Figure 2D).
The DEGs in the Al0 vs. Al1 sample group were enriched in 53 pathways, with 88 genes annotated with KEGG. The DEGs in the Al0 vs. Al2 sample group were enriched into 102 pathways, with 362 genes annotated with KEGG. The DEGs in the Al0 vs. Al3 sample group were enriched in 96 pathways, with 413 genes annotated with KEGG. The KEGG pathway of DEGs was plotted according to the enrichment factor by histogram, and the enrichment results of the top 20 were displayed. The results showed that the KEGG pathways significantly enriched in the Al0 vs. Al1 sample group were starch and sucrose metabolism pathway. The KEGG pathways were significantly enriched in the Al0 vs. Al2 and Al0 vs. Al3, including the phenylpropanoid biosynthesis and plant hormone signal transduction pathway (Figure 3). Therefore, low-concentration Al1 treatment focused on starch and sucrose metabolism pathway, and high-concentration Al2 and Al3 treatments focused on plant hormone signal transduction pathway.

3.5. Effect of Different Al3+ Concentrations on the Soluble Sugar Content and AhERD6 Transcript Levels

The content of soluble sugar in peanut leaves was determined under different Al concentrations. Compared with Al0, the soluble sugar content was increased by 2.86 times under Al1 treatment, but found statistically to with Al2 and Al3 treatments (Figure 4A). The expression of the AhERD6 gene in peanut leaves was determined under different Al concentrations. Compared with Al0, the expression of AhERD6 increased by 2.22 times in the Al1 treatment, there was no significant difference in the Al2 treatment, and it decreased by 40% in the Al3 treatment (Figure 4B).

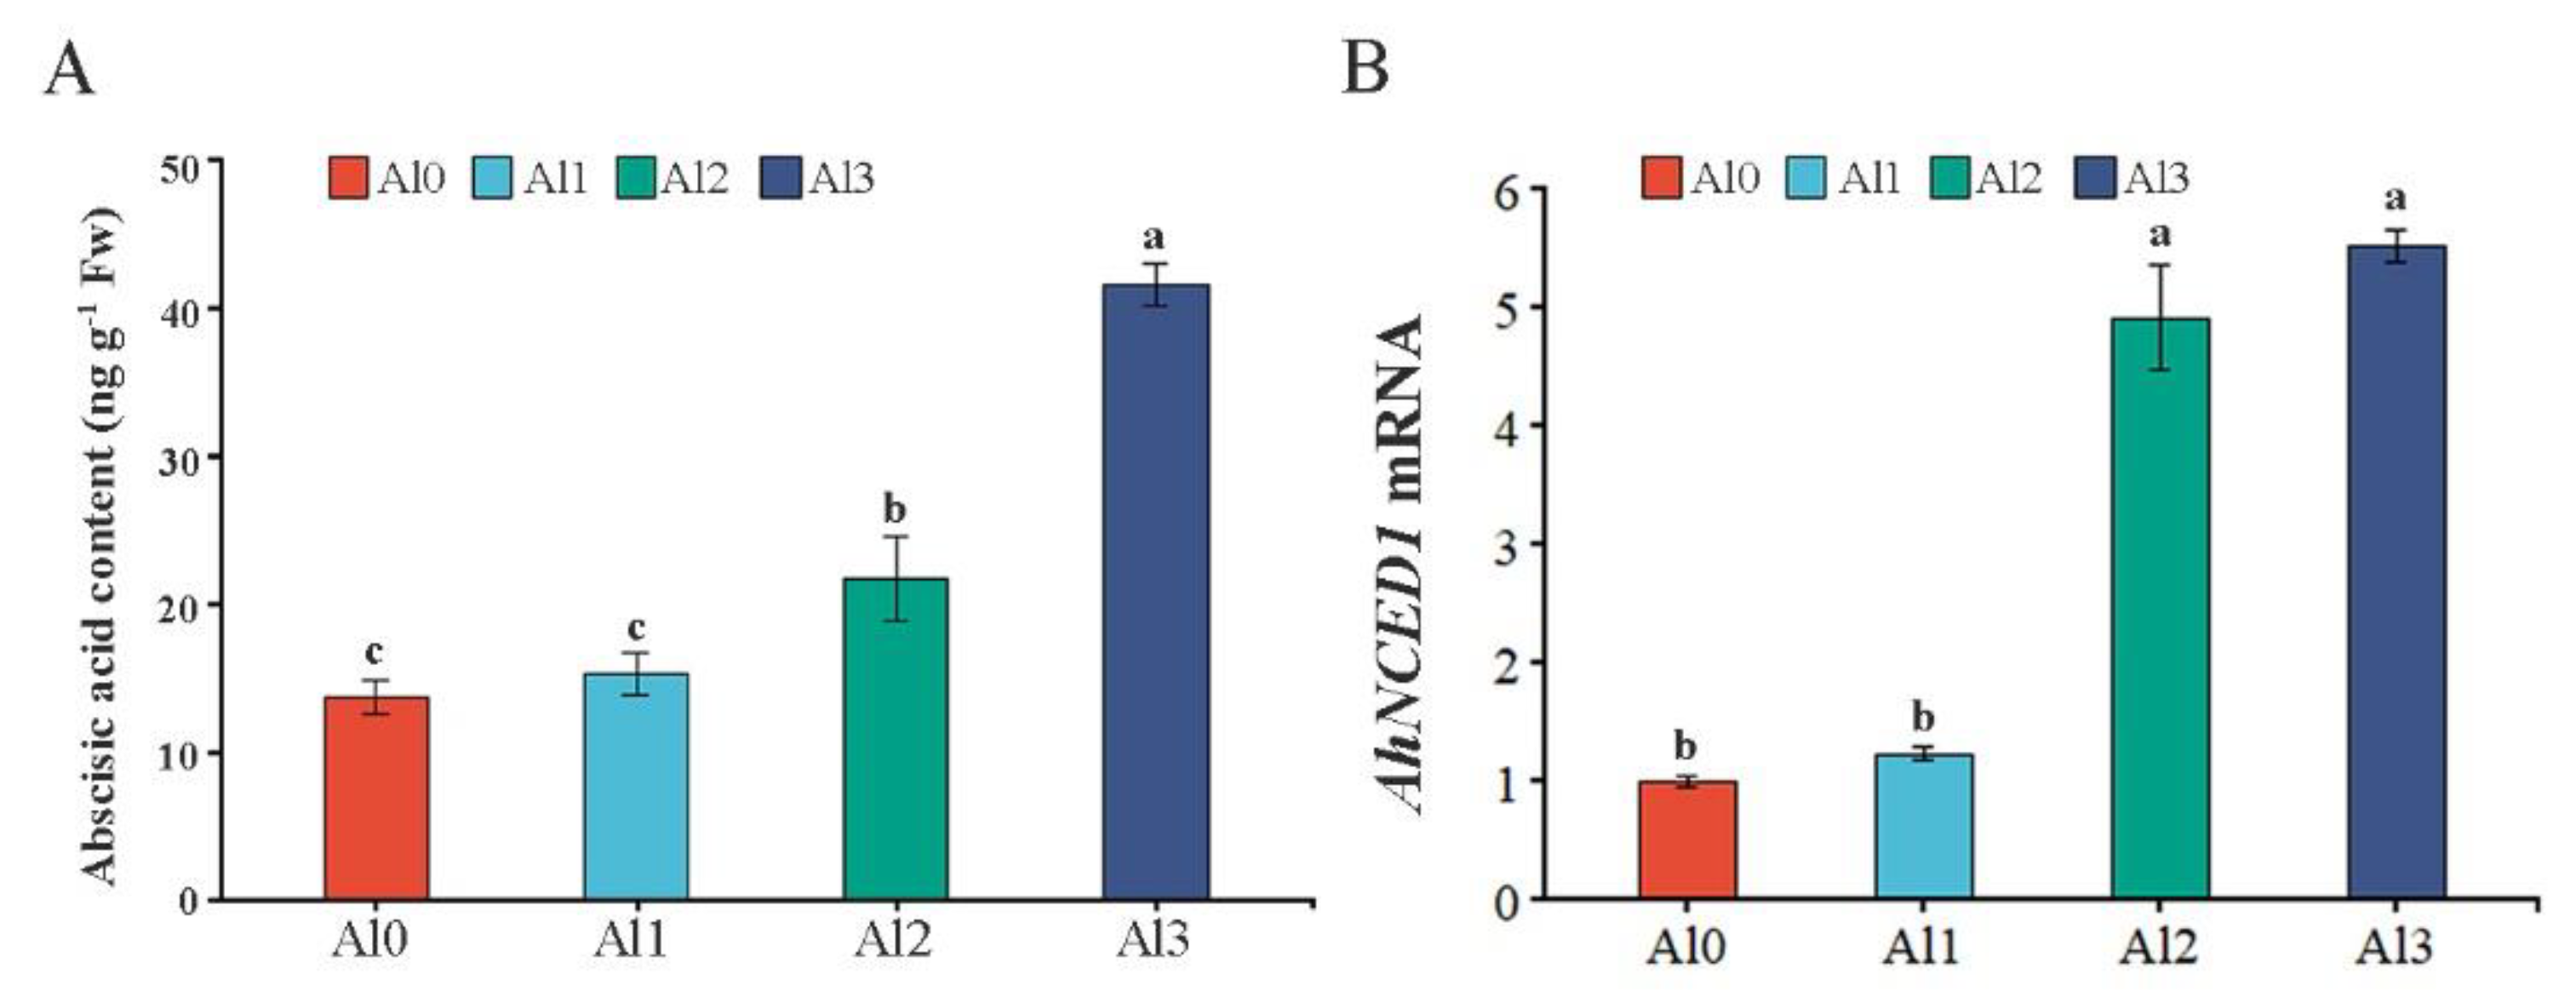
3.6. Effect of Different Al3+ Concentrations on the ABA Content and AhNCED1 Transcript Levels

The content of ABA in peanut leaves was determined under different Al concentrations. Compared with Al0, the ABA content was increased by 59% and 3.02 times under the Al2 and Al3 treatments, respectively, but found statistically similar to the Al1 treatment (Figure 5A). NCED was the key enzyme involved in ABA synthesis in higher plants [25]. In addition, the expression of AhNCED1 increased by 4.91 and 5.52 times in Al2 and Al3 treatments, respectively, compared with Al0. Moreover, no significant difference was noted for the Al1 treatment regarding AhNCED1 (Figure 5B).

3.7. Effect of Different Al3+ Concentrations on the Regulation of TFs Expression

The key TFs associated with Al3+ treatments in peanut were exhibited in Figure 5. Among them, the MYB (4), bHLH (9), NAC (6), ASR (7), STOP1 (3), MADS-box (5), ABI5 (2), RAE (4), and WRKY (15) were differently expressed in different treatments (Figure 6A). Ten genes from the differentially expressed transcription factor genes were randomly selected for validation by qRT-PCR analysis (Figure 6B). The randomly selected gene expression was consistent with the results calculated by the FPKM value obtained by sequencing, indicating that the transcriptome data were reliable (Table 4).

4. Discussion

Heavy metal in excess concentrations often results in deleterious impacts on crop plants [26,27]. Among the plethora of heavy metals, Pb, Cd, As, Cr, and Al are amongst the most dangerous for plant growth and productivity and are widely reported in metal-polluted soils [28,29,30,31]. The study found that low concentrations of Al1 treatment promoted plant height in peanut, while high concentrations of Al2 and Al3 inhibited plant height. The expression of the AhALMT9 and AhFRDL1 genes was up-regulated under high concentrations of Al3+, i.e., Al2 and Al3, whereas low concentrations of Al1 treatment did not promote the expression of these two genes. STOP1 is a key transcription factor that positively regulates the expression of ALMT1 in plant aluminum tolerance [32]. RAE1 encoded an F-box protein capable of degrading STOP1 by ubiquitination [33]. Therefore, according to previous studies, we speculated that under high concentrations of Al3+, i.e., Al2 and Al3, the STOP1 protein was accumulated, and the expression of RAE1 was induced by STOP1 at the same time. RAE1 degrades the excessive accumulation of the STOP1 protein through ubiquitination and promotes the expression of the AhALMT9 gene. Under the action of low concentrations of Al1, the accumulation of STOP1 was not affected, so the AhALMT9 gene expression induced by STOP1 was insignificant. Similarly, for the AhFRDL1 gene, there was similar regulation at the transcriptional level.
This study showed that the DEGs in the Al0 vs. Al1 sample group were significantly enriched in starch and sucrose metabolic pathways. The DEGs in the Al0 vs. Al2 and the Al0 vs. Al3 sample groups were significantly enriched in the plant hormone signal transduction pathway (Supplementary Materials Figure S1). Soluble sugars not only played their roles in cellular metabolism and structural components, but also served as signals regulating plant growth and development [11,34,35]. Previous studies have found that the soluble sugar concentration may be closely correlated with tolerance to saline stress [36]. Low concentrations of Al3+ significantly increased the soluble sugar content in rice shoots [11]. It was found in sunflower that Al3+ treatments at 100 μM and 200 μM significantly increased the soluble sugar content [37]. These results were different from Hajiboland et al. [38], who reported that the soluble sugar contents in young leaves and roots of tea were not affected substantially under Al3+ treatment, whereas the soluble sugar content in old leaves was decreased. However, this study found that low concentrations of Al1 promoted peanut growth by increasing the content of soluble sugar, and the content of soluble sugar after high concentrations of Al2 and Al3 treatments was statistically similar to the control, indicating that low concentrations of Al1 could stimulate peanut growth and increase biomass). ABA induced the expression of AtALMT1, suggesting that ABA acted as a signal involved in the mechanism of Al tolerance [39]. Exogenous ABA enhanced Al-induced secretion of soybean citrate [18]. NCED involved in ABA biosynthesis was induced by Al stress and regulated stomatal conductance [40]. After treatment of rice root tips with ABA and Al, respectively, one-third of differentially expressed genes were found to be identical, suggesting potential crosstalk between Al and ABA signaling [41]. This study found that high concentrations of Al2 and Al3 promoted the up-regulation of ABA content in peanut leaves, while low concentrations of Al1 did not increase ABA content, indicating that high concentrations of Al2 and Al3 made peanuts sensitive to Al, induced the expression of AhNCED1, and increased endogenous ABA content.
In the present study, it was found that the expression of a large number of TFs was different in different concentrations of Al3+ treatment in peanut. Genes encoding bHLH, NAC, and STOP1 have negative FC in Al1 and gradually become positive FC in Al2 and Al3. WRKY46 could negatively regulate the expression of ALMT1 under Al stress, but WRKY22 could positively regulate the expression of FRDL4 under Al stress in rice [42]. The expression of ASR was induced by ABA, and the expression of the ASR1 and ASR5 genes was also induced by Al stress [43]. ASR1 and ASR5 have complementary roles, specifically binding to a cis-acting element in the STAR1 (sensitive to Al rhizotoxicity) promoter to activate STAR1 expression [44]. STAR1 and STAR2 encoded ATP-binding proteins that transported UDP-glucose and masked Al-binding sites in the cell wall [44]. GsMAS1 was a MADS-box transcription factor, and overexpression of GsMAS1 in Arabidopsis could improve Al tolerance [45]. Al treatment induced the expression of the NAC gene in rice, and Al promoted its growth by mediating the expression of NAC [46]. ABI5 positively regulated tolerance against Al stress in rice [41]. STOP1 and ART1 could positively regulate the expression of genes responsive to Al stress (FRDL and ALMT, etc.), but the genes encoding STOP1 and ART1 did not respond to Al-induced expression [47]. The zinc finger transcription factor STOP1 was a key transcription factor regulating the expression of AtALMT1, which may be regulated by Al at the post-transcriptional or post-translational level [23,32,33]. ART1 and STOP1 play a very important role in regulating Al tolerance in plants. Studies have found that after the ART1 and STOP1 fragments in tobacco (Nicotiana tabacum) and moss (Physocmitrella patens) are knocked out, plants are observed to be sensitive to Al3+ [18]. Therefore, The TFs played an important role in Al regulation of peanut growth and development.

5. Conclusions

Low concentrations of Al1 (1.25 mmol/L pH 4.03) promoted peanut growth by increasing soluble sugar content, while high concentrations of Al2 (2.5 mmol/L pH 3.85) and Al3 (5 mmol/L pH 3.65) inhibited peanut growth and induced the production of endogenous ABA content. Therefore, this study showed that Al acted as a stimulant to promote the accumulation of peanut biomass. However, the adaptive mechanism of peanut in response to Al stress needs further research in the future.

Supplementary Materials

The following supporting information can be downloaded at: https://www.mdpi.com/article/10.3390/genes13101830/s1, Figure S1: Effect of different Al3+ concentrations on the plant hormone content.

Author Contributions

Y.Z., G.B. and X.W. designed the experiment. G.B., S.L., Q.Z. and J.Q. performed the experiment, data collection, lab analysis, and data analysis. S.L., Q.Z., J.Q. and X.L. contributed in providing chemicals, reagent, analyses, and tools. G.B. and S.L. prepare the initial draft. G.B. and U.A. finalized the initial draft. All authors have read and agreed to the published version of the manuscript.

Funding

This study was supported by the Natural Science Foundation of China (32071737, 32111530289, and 32101802), a grant from the Applied Basic Research Programs of Science and Technology Commission Foundation of Guangdong Province (2019A1515110867), and grants from the Department of Education of Guangdong Province (2020ZDZX1013). It was also supported by the Department of Science and Technology of Guangdong Province (2021A050530073) and the Agricultural and Rural Department of Guangdong Province (KB1708008) and the Postgraduate Science and Technology Innovation Project of Zhongkai University of Agriculture and Engineering (KJCX2022024).

Institutional Review Board Statement

Not applicable.

Informed Consent Statement

Not applicable.

Data Availability Statement

The authors affirm that all data necessary for confirming the conclusions of the article are present within the article, figures, and tables.

Acknowledgments

This study was supported by the Natural Science Foundation of China (32071737, 32111530289, and 32101802), a grant from the Applied Basic Research Programs of Science and Technology Commission Foundation of Guangdong Province (2019A1515110867), and grants from the Department of Education of Guangdong Province (2020ZDZX1013). It was also supported by the Department of Science and Technology of Guangdong Province (2021A050530073) and the Agricultural and Rural Department of Guangdong Province (KB1708008) and the Postgraduate Science and Technology Innovation Project of Zhongkai University of Agriculture and Engineering (KJCX2022024).

Conflicts of Interest

The authors declare no conflict of interest.

References

  1. Zheng, A.Z.; Li, C.X. Influences and improvement of Al toxin on plants in acid red soil. Hubei Agr. Sci. 2004, 6, 41–43. [Google Scholar] [CrossRef]
  2. Chauhan, D.K.; Yadav, V.; Vaculík, M.; Gassmann, W.; Pike, S.; Arif, N.; Singh, V.P.; Deshmukh, R.; Sahi, S.; Tripathi, D.K. Aluminum toxicity and aluminum stress-induced physiological tolerance responses in higher plants. Crit. Rev. Biotechnol. 2021, 41, 715–730. [Google Scholar] [CrossRef] [PubMed]
  3. Shao, Z.C.; He, Q.; Wang, W.J. Aluminum morphology in red soil. Acta Pedol. Sin. 1998, 35, 38–48. [Google Scholar] [CrossRef]
  4. Dahlgren, R.A.; Ugolini, F.C. Aluminum fractionation of soil solutions from unperturbed and tephra-treated spodosols, Cascade Range, Washington, USA. Soil Sci. Soc. Am. J. 1989, 53, 559–566. [Google Scholar] [CrossRef]
  5. Wang, J.W.; Luo, S.M.; Feng, Y.Q. Aluminum forms in Acid Sulfate Soils. Chin. J. Appl. Ecol. 2000, 11, 735–740. [Google Scholar] [CrossRef]
  6. Ma, J.F. Plant root responses to three abundant soil minerals: Silicon, aluminum and iron. Crit. Rev. Plant Sci. 2005, 24, 267–281. [Google Scholar] [CrossRef]
  7. Ma, J.F. Syndrome of aluminum toxicity and diversity of aluminum resistance in higher plants. Int. Rev. Cytol. 2007, 264, 225–252. [Google Scholar] [CrossRef]
  8. Rahman, M.A.; Lee, S.H.; Ji, H.C.; Kabir, A.H.; Jones, C.S.; Lee, K.W. Molecular sciences importance of mineral nutrition for mitigating aluminum toxicity in plants on acidic soils: Current status and opportunities. Int. J. Mol. Sci. 2018, 19, 3073. [Google Scholar] [CrossRef] [Green Version]
  9. Sun, L.L.; Tian, J.; Zhang, H.Y.; Liao, H. Phytohormone regulation of root growth triggered by P deficiency or Al toxicity. J. Exp. Bot. 2016, 67, 3655–3664. [Google Scholar] [CrossRef] [Green Version]
  10. Qiu, W.; Wang, N.Q.; Dai, J.; Wang, T.Q.; Kochian, L.V.; Liu, J.P.; Zuo, Y.M. AhFRDL1-mediated citrate secretion contributes to adaptation to iron deficiency and aluminum stress in peanuts. J. Exp. Bot. 2019, 70, 2783–2886. [Google Scholar] [CrossRef]
  11. Moreno-Alvarado, M.; García-Morales, S.; Trejo-Téllez, L.I.; Hidalgo-Contreras, J.V.; Gómez-Merino, F.C. Aluminum enhances growth and sugar concentration, alters macronutrient status and regulates the expression of NAC transcription factors in rice. Front. Plant Sci. 2017, 8, 73. [Google Scholar] [CrossRef] [PubMed] [Green Version]
  12. Watanabe, T.; Jansen, S.; Osaki, M. Al-Fe interactions and growth enhancement in Melastoma malabathricum and Miscanthus sinensis dominating acid sulphate soils. Plant Cell Environ. 2006, 29, 2124–2132. [Google Scholar] [CrossRef] [PubMed]
  13. Osaki, M.; Watanabe, T.; Tadano, T. Beneficial effect of aluminum on growth of plants adapted to low pH soils. Soil Sci. Plant Nutr. 1997, 43, 551–563. [Google Scholar] [CrossRef]
  14. Yamaji, N.; Huang, C.F.; Nagao, S.; Yano, M.; Sato, Y.; Nagamura, Y.; Ma, J.F. A zinc finger transcription factor ART1 regulates multiple genes implicated in aluminum tolerance in rice. Plant Cell 2009, 21, 3339–3349. [Google Scholar] [CrossRef] [Green Version]
  15. Bao, G.G.; Zhou, Q.; Li, S.Y.; Ashraf, U.; Huang, S.; Miao, A.M.; Cheng, Z.S.; Wan, X.R.; Zheng, Y.X. Transcriptome analysis revealed the mechanisms involved in ultrasonic seed treatment-induced aluminum tolerance in peanut. Front. Plant Sci. 2022, 12, 807021. [Google Scholar] [CrossRef]
  16. Chen, J.G.; Lai, Q.; Zeng, B.Q.; Guo, L.B.; Ye, G.Y. Progress on Molecular Mechanism of Aluminum Resistance in Rice. Rice Sci. 2020, 27, 454–467. [Google Scholar] [CrossRef]
  17. Ma, J.F.; Ryan, P.R.; Delhaize, E. Aluminium tolerance in plants and the complexing role of organic acids. Trends Plant Sci. 2001, 6, 273–278. [Google Scholar] [CrossRef]
  18. Huang, K.; Zhang, H.Y.; Zhang, H.Q.; Li, Y.; Zu, Y.Q.; Chen, J.J. Research Progress on the Molecular Mechanism of Plants Response to Aluminum Toxicity. Biotechnol. Bull. 2021, 37, 125–135. [Google Scholar] [CrossRef]
  19. Jia, Y.J.; Pei, Y.K.; Zhu, Y.T.; Hu, X.Q.; Hou, Y.X. Research progress on pectin methesterase response to disease resistance and aluminum tolerance. Mol. Plant Breed. 2020, 19, 4127–4132. [Google Scholar] [CrossRef]
  20. Ranjan, A.; Sinha, R.; Lal, S.K.; Bishi, S.K.; Singh, A.K. Phytohormone signalling and cross-talk to alleviate aluminium toxicity in plants. Plant Cell Rep. 2021, 40, 1331–1343. [Google Scholar] [CrossRef]
  21. Vishwakarma, K.; Upadhyay, N.; Kumar, N.; Yadav, G.; Singh, J.; Mishra, R.K.; Kumar, V.; Verma, R.; Upadhyay, R.G.; Pandey, M.; et al. Abscisic acid signaling and abiotic stress tolerance in plants: A review on current knowledge and future prospects. Front. Plant Sci. 2017, 8, 161. [Google Scholar] [CrossRef] [PubMed] [Green Version]
  22. Li, C.X.; Yan, J.Y.; Ren, J.Y.; Sun, L.; Xu, C.; Li, G.X.; Ding, Z.J.; Zheng, S.J. A WRKY transcription factor confers aluminum tolerance via regulation of cell wall modifying genes. J. Integr. Plant Biol. 2020, 8, 1176–1192. [Google Scholar] [CrossRef] [PubMed]
  23. Zhang, Y.; Zhang, J.; Guo, J.; Zhou, F.; Singh, S.; Xu, X.; Xie, Q.; Yang, Z.; Huang, C.F. F-box protein RAE1 regulates the stability of the aluminum-resistance transcription factor STOP1 in Arabidopsis. Proc. Natl. Acad. Sci. USA 2019, 116, 319–327. [Google Scholar] [CrossRef] [PubMed] [Green Version]
  24. Li, J.C.; Lin, Z.; Lin, H.M. Research on the land degradation status andprevention countermeasures in south China. J. Anhui Agric. Sci. 2013, 41, 418. [Google Scholar] [CrossRef]
  25. Bao, G.G.; Zhuo, C.; Qian, C.; Xiao, T.; Guo, Z.; Lu, S. Co-expression of NCED and ALO improves vitamin C level and tolerance to drought and chilling in transgenic tobacco and Stylothanthes plants. Plant Biotechnol. J. 2016, 14, 206–214. [Google Scholar] [CrossRef] [PubMed]
  26. Ashrafab, U.; Mahmoodc, M.H.; Hussaind, S.; Abbase, F.; Anjumd, S.A.; Tang, X.R. Lead (Pb) distribution and accumulation in different plant parts and its associations with grain Pb contents in fragrant rice. Chemosphere 2020, 248, 126003. [Google Scholar] [CrossRef] [PubMed]
  27. Ashraf, U.; Mahmood, S.; Anjum, S.A.; Abbas, R.N.; Rasul, F.; Iqbal, J.; Mo, Z.W.; Tang, X.R. Exogenous Gamma-Aminobutyric Acid Application Induced Modulations in the Performance of Aromatic Rice Under Lead Toxicity. Front Plant Sci. 2022, 22, 933694–933709. [Google Scholar] [CrossRef]
  28. Anjum, S.A.; Ashrafab, U.; Khan, I.; Tanveer, M.; Shahid, M.; Shakoor, A.; Wang, L.C. Phyto-toxicity of chromium in maize: Oxidative damage, osmolyte accumulation, anti-oxidative defense and chromium uptake. Pedosphere 2017, 27, 262–273. [Google Scholar] [CrossRef]
  29. Anjum, S.A.; Tanveer, M.; Hussain, S.; Ashraf, U.; Khan, I.; Wang, L.C. Alteration in growth, leaf gas exchange, and photosynthetic pigments of maize plants under combined cadmium and arsenic stress. Water Air Soil Pollut. 2017, 228, 1–12. [Google Scholar] [CrossRef]
  30. Ma, L.; Kong, L.L.; Gui, R.F.; Yang, X.J.; Zhang, J.W.; Gong, Q.; Qin, D.J.; Zhuang, M.S.; Umair, A.; Mo, Z.W. Application of hydrogen-rich water modulates physio-biochemical functions and early growth of fragrant rice under Cd and Pb stress. Environ. Sci. Pollut. Res. 2021, 28, 58558–58569. [Google Scholar] [CrossRef]
  31. Huang, S.H.; Rao, G.S.; Ashraf, U.; He, L.X.; Zhang, Z.Z.; Zhang, H.L.; Mo, Z.W.; Pan, S.G.; Tang, X.R. Application of inorganic passivators reduced Cd contents in brown rice in oilseed rape-rice rotation under Cd contaminated soil. Chemosphere 2020, 259, 127404. [Google Scholar] [CrossRef] [PubMed]
  32. Fang, Q.; Zhou, F.; Zhang, Y.; Singh, S.; Huang, C.F. Degradation of STOP1 mediated by the F-box proteins RAH1 and RAE1 balances aluminum resistance and plant growth in Arabidopsis thaliana. Plant J. 2021, 106, 493–506. [Google Scholar] [CrossRef] [PubMed]
  33. Fang, Q.; Zhang, J.; Zhang, Y.; Fan, N.; van den Burg, H.A.; Huang, C.F. Regulation of aluminum resistance in Arabidopsis involves the SUMOylation of the zinc finger transcription Factor STOP1. Plant Cell 2020, 32, 3921–3938. [Google Scholar] [CrossRef] [PubMed]
  34. Ashraf, U.; Hussain, S.; Anjum, S.A.; Abbas, F.; Tanveer, M.; Noor, M.A.; Tang, X.R. Alterations in growth, oxidative damage, and metal uptake of five aromatic rice cultivars under lead toxicity. Plant Physiol. Biochem. 2017, 115, 461–471. [Google Scholar] [CrossRef]
  35. Ashraf, U.; Tang, X.R. Yield and quality responses, plant metabolism and metal distribution pattern in aromatic rice under lead (Pb) toxicity. Chemosphere 2017, 176, 141–155. [Google Scholar] [CrossRef]
  36. Kong, X.; Pan, J.; Zhang, M.; Xing, X.; Zhou, Y.; Liu, Y.; Li, D.; Li, D. ZmMKK4, a novel group C mitogen-activated protein kinase kinase in maize (Zea mays), confers salt and cold tolerance in transgenic Arabidopsis. Plant Cell Environ. 2011, 34, 1291–1303. [Google Scholar] [CrossRef]
  37. Yan, X.X.; Yang, G.Z.; Yin, W.; Xiong, L.L.; Ma, R.R.; Li, C.D. Effects of lead and aluminum stress on germination and physiological and biochemical characteristics of two kinds of leguminous forage. J. Qinghai University. 2018, 36, 1–7. [Google Scholar] [CrossRef]
  38. Hajiboland, R.; Rad, S.B.; Barceló, J.; Poschenrieder, C. Mechanisms of aluminum-induced growth stimulation in tea (Camellia sinensis). J. Inorg. Biochem. 2013, 176, 616–625. [Google Scholar] [CrossRef]
  39. Kobayashi, Y.; Kobayashi, Y.; Sugimoto, M.; Lakshmanan, V.; Iuchi, S.; Kobayashi, M.; Bais, H.P.; Koyama, H. Characterization of the complex regulation of AtALMT1 expression in response to phytohormones and other inducers. Plant Physiol. 2013, 162, 732–740. [Google Scholar] [CrossRef] [Green Version]
  40. Gavassi, M.A.; Silva, G.S.; Silva, C.; Thompson, A.J.; Habermann, G. NCED expression is related to increased ABA biosynthesis and stomatal closure under aluminum stress. Environ. Exp. Bot. 2021, 185, 104404. [Google Scholar] [CrossRef]
  41. Fan, W.; Xu, J.M.; Wu, P.; Yang, Z.X.; Lou, H.Q.; Chen, W.W.; Jin, J.F.; Zheng, S.J.; Yang, J.L. Alleviation by abscisic acid of Al toxicity in rice bean is not associated with citrate efflux but depends on ABI5-mediated signal transduction pathways. J. Integr. Plant Biol. 2019, 61, 140–154. [Google Scholar] [CrossRef] [PubMed]
  42. Li, G.Z.; Wang, Z.Q.; Yokosho, K.; Ding, B.; Fan, W.; Gong, Q.Q.; Li, G.X.; Wu, Y.R.; Yang, J.L.; Ma, J.F.; et al. Transcription factor WRKY22 promotes aluminum tolerance via activation of OsFRDL4 expression and enhancement of citrate secretion in rice (Oryza sativa). New Phytol. 2018, 219, 149–162. [Google Scholar] [CrossRef] [PubMed] [Green Version]
  43. Arenhart, R.A.; Schunemann, M.; Neto, L.B.; Margis, R.; Wang, Z.Y.; Margis-Pinheiro, M. Rice ASR1 and ASR5 are complementary transcription factors regulating aluminium responsive genes. Plant Cell Environ. 2016, 39, 645–651. [Google Scholar] [CrossRef] [PubMed]
  44. Huang, C.F.; Yamaji, N.; Mitani, N.; Yano, M.; Nagamura, Y.; Ma, J.F. A bacterial-type ABC transporter is involved in aluminum tolerance in rice. Plant Cell 2009, 21, 655–667. [Google Scholar] [CrossRef] [PubMed] [Green Version]
  45. Zhang, X.; Li, L.; Yang, C.; Cheng, Y.; Han, Z.; Cai, Z.; Nian, H.; Ma, Q. GsMAS1 encoding a MADS-box transcription factor enhances the tolerance to aluminum stress in Arabidopsis thaliana. Int. J. Mol. Sci. 2020, 21, 2004. [Google Scholar] [CrossRef] [PubMed] [Green Version]
  46. Escobar-Sepúlveda, H.F.; Trejo-Téllez, L.I.; García-Morales, S.; Gómez-Merino, F.C. Expression patterns and promoter analyses of aluminum-responsive NAC genes suggest a possible growth regulation of rice mediated by aluminum, hormones and NAC transcription factors. PLoS ONE 2017, 12, e0186084. [Google Scholar] [CrossRef]
  47. Iuchi, S.; Koyama, H.; Iuchi, A.; Kobayashi, Y.; Kitabayashi, S.; Kobayashi, Y.; Ikka, T.; Hirayama, T.; Shinozaki, K.; Kobayashi, M. Zinc finger protein STOP1 is critical for proton tolerance in Arabidopsis and coregulates a key gene in aluminum tolerance. Proc. Natl. Acad. Sci. USA 2007, 104, 9900–9905. [Google Scholar] [CrossRef]
Figure 1. Effects of different concentrations of Al3+ on the morphological characteristics of peanut and the expression of AhALMT9 and AhFRDL1 genes. Plant height was measured for 14 days of Al treatment (A). Effect of different concentrations of Al on peanut plant height (B). qRT-PCR analysis of relative transcription levels of AhALMT9 (C) and AhFRDL1 (D). Al0, Al1, Al2 and Al3 represent 0 (pH 6.85), 1.25 (pH 4.03), 2.5 (pH 3.85) and 5 (pH 3.69) mmol/L AlCl3.18H2O solutions, respectively. Data are means (±SE), n = 3. Marking the same letters means p ≥ 0.05 (LSD), there is no significant difference, the difference between different letters means p < 0.05 (LSD), and the difference is significant.
Genes 13 01830 g001
Figure 2. DEG identification and KEGG pathway analysis. Principal component analysis (PCA). The same color represents the same treatment, different colors represent different treatments (A). Sample-to-sample clustering analysis. The red color depicts the up-regulation, and blue color depicts the down-regulation in the gene expression pattern (B). Venn diagram showing overlapping and unique DEGs between different peanut samples Al0 vs. Al1, Al0 vs. Al2, and Al0 vs. Al3 (C). Statistical chart of DEGs under different concentrations of Al3+. Red indicates up-regulation, and blue indicates down-regulation (D).
Genes 13 01830 g002
Figure 3. Regulations of the KEGG pathway. Al0, Al1, Al2, and Al3 represent 0 (pH 6.85), 1.25 (pH 4.03), 2.5 (pH 3.85), and 5 (pH 3.69) mmol/L AlCl3.18H2O solutions, respectively. Different colors represent different biological processes, and numbers represent the number of DEGs in the same biological process under different Al treatment conditions.
Genes 13 01830 g003
Figure 4. Effect of different Al3+ concentrations on the soluble sugar content and AhERD6 transcript levels. The effect of Al treatments on soluble sugar content (A). qRT-PCR analysis of relative transcription levels of AhERD6 (B). Al0, Al1, Al2, and Al3 represent 0 (pH 6.85), 1.25 (pH 4.03), 2.5 (pH 3.85), and 5 (pH 3.69) mmol/L AlCl3.18H2O solutions, respectively. Data are means (±SE), n = 3. Marking the same letters means p ≥ 0.05 (LSD), there is no significant difference, the difference between different letters means p < 0.05 (LSD), and the difference is significant.
Genes 13 01830 g004
Figure 5. Effect of different Al3+ concentrations on the ABA content and AhNCED1 transcript levels. The effect of Al treatments on ABA content (A). qRT-PCR analysis of relative transcription levels of AhNCED1 (B). Al0, Al1, Al2, and Al3 represent 0 (pH 6.85), 1.25 (pH 4.03), 2.5 (pH 3.85), and 5 (pH 3.69) mmol/L AlCl3.18H2O solutions, respectively. Data are means (±SE), n = 3. Marking the same letters means p ≥ 0.05 (LSD), there is no significant difference, the difference between different letters means p < 0.05 (LSD), and the difference is significant.
Genes 13 01830 g005
Figure 6. Effect of different Al3+ concentrations on the regulation of TFs expression. Heatmap of known 38 TFs genes. Red means down-regulation, and blue means up-regulation (A). Compare the FPKM value obtained by RNA-seq analysis with the gene relative transcript levels obtained by qRT-PCR analysis (B). * means p ≥ 0.05 (LSD). Data were analyzed using the 2−∆∆CT method.
Genes 13 01830 g006
Table 1. Primer sequences of genes.
Gene NameGene IDPrimer Sequences
AhFRDL1LOC112769177F 5′-TGATGCTGAAACCAAAGAGTTCCTACC-3′
R 5′-CAGATGAAGCCGAAGGGATATGCC-3′
AhALMT9LOC112802199F 5′-ACCACACTCTCTCCCTCCAAATCC-3′
R 5′-ACAGCAGCCTCTCCTTCTTCTCC-3′
AhWRKY1LOC112766106F 5′-TTGCTTGGATACTTGGATTGGACTCTC-3′
R 5′-TGGTTGGTTGGTTGGTTGAATTGAATG-3′
AhWRKY23LOC112710566F 5′-AAGCGTGTGGAGCGGTCATTTAC-3′
R 5′-AATGGCTGAACGAGGCATAACTGG-3′
AhWRKY44LOC112759075F 5′-ACAGTCACAGCATTACACCACCTTC-3′
R 5′-AGCCTTCTGATCCTCCTCTATGTTCTG-3′
AhOFP1LOC112728150F 5′-ACCCCAAAGATTCACCACCACAAAG-3′
R 5′-AGAAGAGACAGAGGAGGAGGAAGTAAC-3′
AhOFP13LOC112780116F 5′-GGAGATGGTTGAGTGTCATGGAGTG-3′
R 5′-GAAGCAGAAGCAGCAATGGTGATAATC-3′
AhbZIP60LOC112727401F 5′-AACCATGCTTTGCGTCTTTGCTTAC-3′
R 5′-AGTCAATGTGTTACTGTAGGGCTTACC-3′
AhAP2-AIL5LOC112723564F 5′-TGGCAATGGCATGATGGACTTCTC-3′
R 5′-ACCACCACTCTCTTGTTGATGATGATG-3′
AhAP2-ANTLOC112756010F 5′-CTTCAAGCACTGCCTCAACAACAAG-3′
R 5′-GCCAGAGAAGGAGAAGAATGAAAGGG-3′
AhNAC29LOC112759194F 5′-TGGTCATGCCGTTGCGTTCTAC-3′
R 5′-ACCACCCTCACTCACATCGTCTC-3′
AhNAC56LOC112707370F 5′-TTCTGGAAGGTATGATGCTAGGAGGAG-3′
R 5′-TGTTAATGGTGTTTGAGGCTGATCCC-3′
AhbHLH13LOC112758465F 5′-TGCTGTTAGGAAGATGGAGGAGAGG-3′
R 5′-GATGAAGACCATTGCGAGGAGGAC-3′
AhbHLH18LOC112720570F 5′-GCCACCACCAGAAACCCAAC-3′
R 5′-AGTCCAGGAACAATGGCGGA-3′
AhbHLH30LOC112802694F 5′-TCACGGCGGACGAAGAAGATTATTC-3′
R 5′-AGCAGATTCATCACCACCACCTTTC-3′
AhbHLH96LOC112765920F 5′-GGACATAGAAGTGACAATGGTGGACAG-3′
R 5′-AGGTGGAGAATGGTGAGGCTTAGAG-3′
AhbHLH115LOC112772203F 5′-GGACATAGATTCTTCAGGAGGCACATC-3′
R 5′-CAGCCAGGTGAAAGCAGCAGAG-3′
AhbHLH122LOC112706635F 5′-ATGTTGTTGATATGCGAGGGATGGG-3′
R 5′-GAGGCGGAGGAGGAGTAGTTCTG-3′
AhMYB14LOC112722417F 5′-AACCTGCACCGTGTCTGATGTTG-3′
R 5′-AAGCCGAATGTCTTGATGGAGTCTG-3′
AhMYB44LOC112766377F 5′-GACCCGTTGACTGCGTTGACTC-3′
R 5′-CTCACTTCCCTGGCAATCACATCC-3′
AhERD6LOC112741105F 5′-ACAGCATTGGGAGCAATACTGATGG-3′
R 5′-CAGCCTACGAAAGTGCCACTAGC-3′
AhNCED1LOC112703460F 5′-TGGAAGGAAGACACAGTTCGCATAC-3′
R 5′-CTTCGCCGCTGGACAGATCAAC-3′
AhactinLOC112787680F 5′-AAGCTGGCTTACATTGCCCT-3′
R 5′-TGACCTGTCCATCAGGCAAC-3′
Table 2. Sequencing statistics.
SampleClean ReadsClean BasesGC Content% ≥ Q30SRX
Al0-120,553,6876,146,509,32246.01%93.00%11,763,364
Al0-223,425,8377,009,817,14845.85%92.97%11,763,363
Al0-324,343,9907,275,220,47245.96%93.16%11,763,362
Al1-123,330,5206,975,644,33645.84%93.14%11,763,361
Al1-222,315,8476,672,118,44845.85%92.97%11,763,360
Al1-320,976,6096,272,951,55245.98%92.96%11,763,359
Al2-119,314,4355,777,435,05645.50%92.89%11,763,358
Al2-221,413,2556,403,612,92045.53%93.07%11,763,357
Al2-321,233,4876,346,252,15645.43%92.81%11,763,356
Al3-121,037,9886,290,647,13445.44%92.81%11,763,355
Al3-222,477,5916,720,640,75245.43%92.77%11,763,354
Al3-322,844,8596,834,289,99845.49%92.88%11,763,353
Note: Q30 values represent the number and percentage of bases with sequencing accuracy of 99.9%.
Table 3. The mapping of reads to the reference genome.
SampleTotal ReadsMapped ReadsUnique Mapped ReadsMultiple Map Reads
Al0-141,107,37438,674,767 (94.08%)35,195,591 (85.62%)3,479,176 (8.46%)
Al0-246,851,67444,198,905 (94.34%)40,263,962 (85.94%)3,934,943 (8.40%)
Al0-348,687,98045,441,812 (93.33%)41,288,361 (84.80%)4,153,451 (8.53%)
Al1-146,661,04043,883,594 (94.05%)39,896,921 (85.50%)3,986,673 (8.54%)
Al1-244,631,69442,028,809 (94.17%)38,235,448 (85.67%)3,793,361 (8.50%)
Al1-341,953,21839,454,492 (94.04%)35,906,710 (85.59%)3,547,782 (8.46%)
Al2-138,628,87036,691,674 (94.99%)33,371,783 (86.39%)3,319,891 (8.59%)
Al2-242,826,51040,650,589 (94.92%)36,919,727 (86.21%)3,730,862 (8.71%)
Al2-342,466,97440,121,437 (94.48%)36,392,658 (85.70%)3,728,779 (8.78%)
Al3-142,075,97639,782,778 (94.55%)36,169,774 (85.96%)3,613,004 (8.59%)
Al3-244,955,18242,699,985 (94.98%)38,830,480 (86.38%)3,869,505 (8.61%)
Al3-345,689,71843,437,766 (95.07%)39,532,547 (86.52%)3,905,219 (8.55%)
Table 4. FC values calculated from randomly selected gene expression and FPKM values obtained by sequencing.
GeneSampleFCGeneSampleFC
AhOFP1Al0_RNA-seq AhOFP1Al0_qRT-PCR
AhOFP1Al1_RNA-seq4.2249179AhOFP1Al1_qRT-PCR4.4242215
AhbZIP60Al0_RNA-seq AhbZIP60Al0_qRT-PCR
AhbZIP60Al1_RNA-seq1.9782843AhbZIP60Al1_qRT-PCR6.1841118
AhbHlH122Al0_RNA-seq AhbHlH122Al0_qRT-PCR
AhbHlH122Al1_RNA-seq0.7069601AhbHlH122Al1_qRT-PCR2.0390607
AhbHlH18Al0_RNA-seq AhbHlH18Al0_qRT-PCR
AhbHlH18Al1_RNA-seq1.4979671AhbHlH18Al1_qRT-PCR3.4426249
AhMYB44Al0_RNA-seq AhMYB44Al0_qRT-PCR
AhMYB44Al1_RNA-seq2.9794002AhMYB44Al1_qRT-PCR2.4741158
AhAP2-AIl5Al0_RNA-seq AhAP2-AIl5Al0_qRT-PCR
AhAP2-AIl5Al1_RNA-seq1.1578537AhAP2-AIl5Al1_qRT-PCR2.1525224
AhAP2-ANTAl0_RNA-seq AhAP2-ANTAl0_qRT-PCR
AhAP2-ANTAl1_RNA-seq0.8790023AhAP2-ANTAl1_qRT-PCR0.3706083
AhbHlH30Al0_RNA-seq AhbHlH30Al0_qRT-PCR
AhbHlH30Al1_RNA-seq1.1577513AhbHlH30Al1_qRT-PCR1.1665719
AhNAC56Al0_RNA-seq AhNAC56Al0_qRT-PCR
AhNAC56Al1_RNA-seq6.5449812AhNAC56Al1_qRT-PCR20.860103
AhNAC29Al0_RNA-seq AhNAC29Al0_qRT-PCR
AhNAC29Al1_RNA-seq1.0325376AhNAC29Al1_qRT-PCR15.497673
Publisher’s Note: MDPI stays neutral with regard to jurisdictional claims in published maps and institutional affiliations.

