
Two New Mitogenomes of Bibionidae and Their Comparison within the Infraorder Bibionomorpha (Diptera)


Key Laboratory of Vector Insects, Institute of Entomology and Molecular Biology, Chongqing Normal University, Chongqing 401331, China
*
Author to whom correspondence should be addressed.
Genes 2023, 14(7), 1485; https://doi.org/10.3390/genes14071485
Submission received: 17 June 2023
/
Revised: 17 July 2023
/
Accepted: 18 July 2023
/
Published: 21 July 2023
(This article belongs to the Section Population and Evolutionary Genetics and Genomics)
Abstract
:Despite the worldwide distribution and rich diversity of the infraorder Bibionomorpha in Diptera, the characteristics of mitochondrial genomes (mitogenomes) are still little-known, and the phylogenetics and evolution of the infraorder remains controversial. In the present study, we report complete and annotated mitogenome sequences of Penthetria simplioipes and Plecia hardyi representing Bibionidae. This is the first report of the complete mitogenomes for the superfamily Bibionoidea. There are 37 genes in each of the complete mitogenomes of all 20 studied species from eight families of four superfamilies within infraorder Bibionomorpha. The Ka/Ks analysis suggests that all 13 PCGs have undergone purifying selection. The gene rearrangement events exist in some families (Keroplatidae, Sciaridae, and Cecidomyiidae) but not in Mycetophilidae in Sciaroidea and also in Scatopsoidea, Anisopodoidea, and Bibionoidea, which suggests that these rearrangement events are derived in the late period in the evolution of the Bibionomorpha. The phylogenetic analysis suggests the phylogenetic relationships of Scatopsoidea + (Anisopodoidea + (Bibionoidea + Sciaroidea)) in Bibionomorpha. The divergence time analysis suggests that Bibionomorpha originated in the Triassic, Scatopsoidea and Anisopodoidea in the late Triassic, Bibionoidea in the Jurassic, and Sciaroidea in the Jurassic to the Cretaceous. The work lays a base for the study of mitogenomes in Bibionomorpha but further work and broader taxon sampling are necessary for a better understanding of the phylogenetics and evolution of the infraorder.
1. Introduction
The infraorder Bibionomorpha is one of the largest groups in Diptera with approximately 16,500 known species worldwide [1]. The insects in the infraorder are mostly tiny flies with a slender dark-colored body, long legs, and simple wings. Species in the infraorder are widely distributed across the world, and usually aggregate under moist shady areas, including leaves, grass clippings, moss, and manure. The feeding habits of their larvae are diverse, including detritophagy, saprophagy, predatory, mycophagy, and phytophagy [2]. Some larvae of bibionids and sciarids are found mostly in decaying organic materials such as forest litter, manure, and humus-rich soils, and play an important role as decomposers. Nevertheless, some species are known as economically significant pests, which cause damage to the roots of cultivated plants. The larvae of Bradysia cause serious damage to onions, carrots, and edible mushrooms [3], and their adults serve as vectors for the pathogen Fusarium foetens on the ornamental plant begonias, causing serious economic loss [4,5].
The classification of the Bibionomorpha has been studied for almost 200 years, and its monophyly has been confirmed by morphological and molecular studies [6,7,8]. The earliest comprehensive classification of the infraorder included 10 families primarily based on their adult character, Perissommatidae, Pachyneuridae, Axymyiidae, Anisopodidae, Canthyloscelidae, Scatopsidae, Cecidomyiidae, Sciaridae, Mycetophilidae sensu lato, and Bibionidae, into Bibionomorpha [6,9]. Nowadays, the infraorder is widely recognized to include four superfamilies (Sciaroidea, Bibionoidea, Anisopodoidea, and Scatopsoidea), 34 families, and almost 1400 genera [1,10].
A comprehensive phylogeny study of Diptera based on 13 protein-coding gene (PCG) and two ribosomal gene (18S, 28S) sequences using Bayesian inference (BI) suggested that the family Anisopodidae was not included in the Bibionomorpha [11]. This result is inconsistent with that of the phylogenetic analyses based on morphological data [9]. The phylogenetic analysis of the infraorder based on three nuclear (18S, 28S, and CAD) and three mitochondrial (12S, 16S, and COXI) genes using maximum likelihood (ML) and BI demonstrated that Bibionoidea and Sciaroidea were monophyletic, the Bibionidae was paraphyletic, Bibionidae and Pachyneuridae were sister groups, and Sciaroidea included Cecidomyiidae [10]. However, earlier studies of Diptera by Oosterbroek et al. demonstrated that Bibionidae was monophyletic, which is consistent with that of phylogenetic analysis based on morphological data [12], and Sciaroidea was paraphyletic based on ribosomal (28S) and protein-coding (CAD, TPI, and PGD) genes [10]. The sister relationship of Bibionidae and Keroplatidae was supported by a comprehensive morphological character matrix [13], but Mantič et al. proposed a sister group to the Keroplatidae is a clade containing all the other groups of Sciaroidea, except Ditomyiidae and Cecidomyiidae [14]. Cecidomyiidae was monophyletic without any doubt [7,15,16]. Cecidomyiidae was the sister group to Sciaroidea based on morphology [2,17,18], Cecidomyiidae + Sciaridae was the sister group to Mycetophilidae based on the character of the larva [7], and Cecidomyiidae was the sister group of the Mycetophilidae + Sciaridae based on the morphology character matrix [19].
Mitochondria are vital organelles in eukaryotic cells, which are involved in oxidative phosphorylation [20]. A fast-increasing number of mitogenomes of insect species have been sequenced and annotated since 2004. In 2009, two complete mitogenomes were published for the first time in the infraorder Bibionomorpha (Mayetiola destructor and Rhopalomyia pomum) [21]. Up to date, complete mitogenome sequences have been reported from three superfamilies; however, there is no complete mitogenome sequence to be reported for the superfamily Bibionoidea in GenBank in the infraorder. The mitogenomes reported in the infraorder are typical circular molecules with the length ranging from 14 kb to 16 kb, and each contains a conserved set of 37 genes, including 13 PCGs, large and small ribosomal genes (rrnL and rrnS), 22 transfer RNAs (tRNA) genes, and a control region (CR) [22,23,24]. There are complicated gene rearrangements to be identified, e.g., inversion and transposition of tRNAs and PCGs in Cecidomyiidae [20], a trnE inversion in Arachnocampa flava in Keroplatidae [11], and inversion and transposition of tRNAs in Sciaridae [25]. The conservative character, maternal inheritance, and straightforward gene orthologs of the mitogenome have made it a significant source for molecular markers to be applied in evolutionary and phylogenetic studies [26]. Phylogenetic studies based on insect mitogenomes have shown good results in Diptera [27], Orthoptera [28], Coleoptera [29], and Hymenoptera [30]. The knowledge of mitogenome characteristics in the infraorder Bibionomorpha is still limited, and mitogenomes of the vast majority of species within Bibionomorpha are still unknown or remain uncompleted, although the whole genomes of several species of Bibionomorpha have recently been published [31].
In this study, we report, for the first time, complete and annotated sequences of mt genomes of P. simplioipes and P. hardyi representing the family Bibionidae. We performed comparative analyses of complete mitogenomes of the 20 species from eight families of four superfamilies from infraorder Bibionomorpha. Additionally, we constructed the phylogenetic relationships and discussed the evolution of the infraorder based on hitherto-known mitogenome sequences. The study also provides a comprehensive information frame for further studies on the mitogenome of the Bibionomorpha.
2. Material and Methods
2.1. Sample Collecting and Mitogenome Sequencing
Samples of two species representing Bibionidae, P. simplioipes and P. hardyi, were collected from the Wuyi Mountains of Fujian Province, China in October 2018, and were preserved in individual vials in silica. After morphological identification using traditional method [32], they were stored in 100% alcohol, and housed at −20 °C until the DNA extraction. Total DNA was extracted from thoracic muscle tissues using the DNeasy tissue kit (Qiagen, Hilden, Germany) following the manufacturer’s instructions. Concentration of extracted genomic DNA was determined by Qubit 2.0 (Invitrogen, Shanghai, China). The genomic DNA library was constructed with 350 bp small fragment, and sequenced using Illumina HiSeq X sequencing technology in HuiTong Company at Shenzhen, China. The adapters and unpaired, short, and low-quality reads were removed from the raw dataset during the quality control by FastQC v 0.11.3 [33].
2.2. Mitogenome Assembly and Annotation
The clean reads of mitogenome were separated and assembled using de novo assembler SPAdes v 3.11.0 with default parameters using the known dipteran mitogenome sequences of Clephydroneura sp. and Drosophila yakuba as references [34]. The contigs of mitogenome were extracted and assembled into mitogenomes through searching against the reference sequences using PRICE (paired-read iterative contig extension) by NOVOPlasty version 2.6.2 [35]. The position and sequences of PCGs, tRNAs, rRNAs, and CR were originally annotated using the MITOS web server [36], and then determined in comparison with published homologous mitogenome sequences in phylogeny-close species using MEGAX [37]. The secondary structures of tRNAs were predicted by the MITOS, ARWEN 1.2, and tRNAscan-SE web Server [38]. The annotation of the mitogenomes was corrected manually using the Geneious v 4.8.5 [39], and final mitogenomes were submitted to the GenBank database.
2.3. Mitogenome Characteristics Analysis
The complete mitogenome for two newly sequenced Bibionoidea species were cyclized using the CGView online server with default parameters [40] (Table 1). Base composition, codon usage, relative synonymous codon usage (RSCU), and amino acid content of 20 species of mitogenome were computed with MEGA v.7.0.26 [41]. Nucleotide compositional bias was calculated using the following formulae: AT-skew = (A − T)/(A + T) and GC-skew = (G − C)/(G + C) by MEGA v.7.0.26, and three-dimensional scatterplots of AT-Skew, GC-Skew and AT% were drawn using Origin Pro v.9.0 [42]. Selection pressure of the 13 PCGs was analyzed by calculating Ka (non-synonymous) and Ks (synonymous substitution) values with DnaSP v6.12.03 [43], and visualized using Origin Pro v.9.0. The gene rearrangement events of tRNAs and PCGs were identified in comparison with the gene order of the ancestor Clephydroneura sp. using the Geneious v 4.8.5.
2.4. Phylogenetic Analysis
Phylogenetic analysis was conducted with both ML and BI using PhyloSuite v.1.2.2 [44]. Two datasets of mitogenomes were used for phylogenetic inference, and two species from the superfamily Tipuloidea, Symplecta hybrida and Tipula cockerelliana were employed as outgroup (Table 2). we constructed two nucleotide datasets: (1) PCG123, all codon positions, and (2) PCG123 + R, all codon positions + two rRNA genes. The nucleotide sequences of 13 PCGs were aligned by codon-based multiple alignments using the L-INS-i algorithm and the rRNAs were aligned using the Q-INS-i strategy in MAFFT [45]. The concatenation of aligned sequences was performed using SequenceMatrix [46]. The selection of best-fit partitioning schemes and substitution models for each dataset were calculated using PartitionFinder 2 with the following settings: branch lengths as linked, and model election as AICc with the greedy algorithm [47]. Partitioning schemes and models are listed in Table S1. ML analysis was performed using IQ tree ver.1.6.8 under edge-linked partition model with 1000 bootstrapped replicates (BP) [48,49]. BI analysis was conducted using MrBayes ver. 3.26 [50] with two MCMC runs, each with four chains (three heated and one cold) run for 10,000,000 generations. Posterior probabilities (PPs) were computed after a 25% burn rate and each set was sampled every 1000 generations. An average deviation of the split frequency of less than 0.01 indicates that the runs had converged. The phylogenetic tree was visualized using FigTreev.1.4.4 and iTOL online tool [51,52].
2.5. Divergence Time Estimation
The divergence time was estimated using BEAST v.1.8.4 [53]. A γ distribution (GTR + I + G) nucleotide substitution model was selected by PartitionFinder 2.0 using AIC, and the speciation Yule model were selected as the tree priors with the uncorrelated lognormal relaxed molecular clock model. Two independent Markov chain Monte Carlo (MCMC) runs, each with a chain length of 100,000,000 generations with sampling every 1000 generations and a first 25% burn-in, were performed to estimate the divergence time. The fossil record of the species Eoditomyia primitiva 180 million years ago (Mya) for Sciaroidea was selected for calibration using the fossil calibration database and reported research searching in this study [54].
3. Results
3.1. Mitogenome Characteristics of Bibionomorpha
The complete mitogenomes of P. simplioipes (GenBank no.: MT511121) and P. hardyi (GenBank: MT511122) are both of circular, closed, and double-stranded structures, with full lengths of 15,349 and 15,456 bp, respectively (Figure 1). The complete mitogenomes of 20 species contained 37 genes (including 13 PCGs, 22 tRNA genes, and 2 rRNA genes) and CR. There are 22 genes (9 PCGs and 13 tRNAs) located on the majority coding strand (J-strand), while the other 15 genes (4 PCGs, 9 tRNAs, and 2 rRNAs) are on the minority strand (N-strand). The length of 20 mitogenome sequences ranges from 14,503 bp (Rhopalomyia pomum) to 16,950 bp (Acnemia nitidicollis), and the length variation mainly results from the CR, intergenic overlap, and spacers. The nucleotide base compositions and the three-dimensional scatter plot of the AT content, AT-skew, and GC-skew of 20 mitogenomes in the infraorder are shown in Table S2 and Figure 2. They all display obvious AT bias with A + T content ranging from 75.8% (Allodia sp.) to 85.7% (Orseolia oryzae). AT-skew values range from −0.034 (Arachnocampa flava) to 0.105 (Orseolia oryzae), and GC-skew from −0.326 (Pnyxia scabiei) to −0.102 (Epicypta sp.). Most of the species of the Bibionidae, Cecidomyiidae, and Sciaridae have similar AT content and AT/GC-skew, which are closely distributed in the three-dimensional scatter plot, whereas the species of the Mycetophilidae is widely distributed in the plot for AT content, AT-skew, and GC-skew. The total PCGs nucleotide length ranges from 10,794 bp (Orseolia oryzae) to 11,237 bp (Sylvicola fenestralis). Most of the PCGs initiate with the typical start codon ATN and TTG, whereas the special start codons TCA, TTG, and TCG are found for cox1; TTG for nad1; and GTG for nad5. The most frequently used stop codons are TAA and T, followed by the stop codons TAG and TA. The RSCU values and amino acid usage frequency of the 20 species of mitogenomes in the infraorder are presented in Table S3 and Figure 3. UUA is the most frequently used codon, followed by UCU, CGA, and GCU. Leu has the highest usage percentage for all mitogenomes investigated with an average of 16.46%, and Cys has the lowest percentage (0.66%). The usage percentages of amino acids reveal no obvious difference among different families. To evaluate the selective pressures of 13 PCGs of the infraorder, pairwise analyses of the non-synonymous (Ka) and synonymous (Ks) substitution ratio (Ka/Ks) are shown in Figure 4. The Ka/Ks ratios for all 13 genes are all less than 1, ranging from 0.03 in cox1 to 0.98 in atp8 in the following order: cox1, cytb, cox3, cox2, atp6, nad5, nad3, nad1, nad4, nad2, nad4L, nad6, and atp8. These results imply that all of these 13 PCGs experienced purifying selection. Most tRNAs can be folded into the typical clover-leaf structure containing four stems and loops except trnS2, in which the dihydrouracil (DHU) arm is absent. The lack of a DHU arm in this infraorder has been commonly observed across all of these 20 mitogenomes. rrnL is located between trnL1 and trnV, and rrnS between trnV and CR. There are 12 mismatched base pairs (G-U) to be found in P. simplioipes tRNAs, and 13 mismatched base pairs (G-U) in P. hardyi (Figure S1).
3.2. Gene Rearrangement Events of Bibionomorpha
Compared with the putative ancestral mitogenome (e.g., Drosophila yakuba), there are no gene rearrangements to be found in the superfamilies Scatopsoidea, Anisopodoidea, and Bibionoidea, and the family Mycetophilidae in Sciaroidea (Figure 5); however, the arrangement events exist in some families in the Sciaroidea. In Keroplatidae, the trnE has been inverted in Arachnocampa flava. In Cecidomyiidae, the arrangement was observed in the genome upstream of nad5 (13 tRNAs and 5 PCGs), and downstream of nad5 with only one rearrangement (trnT and trnP). In Rhopalomyia pomum, three tRNAs (trnE, trnT, and trnP) have been inverted, trnN has been transposed from the position (trnR-trnS1) to a position (trnG-nad3), and trnI has been remote-inverted from the position (rrnS-trnQ) to a position (trnF-trnS1).
In Mayetiola destructor, three tRNAs (trnE, trnT, and trnP) have been inverted, two tRNAs (trnN and trnY) have been transposed from typical position to the position (trnG-nad3) and (trnS1-trnE), respectively, and trnI has been remote-inverted (i.e., translocation + inversion) from a typical position to the position trnR-trnS1. In Orseolia oryzae, ten tRNAs have been remote-inverted, and five tRNAs and five PCGs have been transposed. In Sciaridae, the trnC has been remote-inverted from the position (trnW-trnY) to a position (trnQ-trnM), and the trnA and trnR were switched in Trichosia lengersdorfi. The trnC has been remote-inverted from the position (trnW-trnY) to the position (trnQ-trnM), and the trnY and the trnL2 have been remote-inverted, both of them from between trnC and cox2 to between rrnS and nad2 in Pseudolycoriella sp.
3.3. Phylogenetic Relationships and Divergence Time
Four phylogenetic trees were generated based on datasets PCG123 + R and PCG123 of 24 mitogenomes in Bibionomorpha. Two same topologies of trees from BI analysis (Figure 6) are slightly different from the two same trees from ML (Figure 7) in the positions Arachnocampa flava in Keroplatidae and Pnyxia scabiei in Sciaridae. The former is grouped with Cecidomyiidae in BI, but at the base of Cecidomyiidae + Sciaridae in ML, and the latter with Trichosia lengersdorfi in BI, but at the base of Sciaridae in ML.
The superfamily Scatopsoidea is located at the base of the infraorder Bibionomorpha, and the superfamily Anisopodoidea at the base of the superfamilies Bibionoidea + Sciaroidea. The Bibionoidea + Sciaroidea appears monophyletic with PP = 1 and BP = 100 (Figure 6 and Figure 7), and both of them are sister groups. In Bibionoidea, there are only three species to be investigated, and monophyly of the family Bibionidae cannot be determined. In Sciaroidea, there are four families Mycetophilidae, Keroplatidae, Cecidomyiidae, and Sciaridae to be investigated. The family Mycetophilidae seems monophyletic (PP = 1 and BP = 100), and is a sister group with Keroplatidae + Cecidomyiidae + Sciaridae (PP = 1 and BP = 100). The Sciaridae are monophyletic with PP = 1 and BP = 100. The position of Keroplatidae cannot be determined due to the position difference from both BI and ML analyses.
The PCG + R dataset was used to estimate divergence time because PCG + R and PCG resulted in the same topologies of phylogenetic trees using BI, but PCG + R had higher node support values than PCG in the initial phylogenetic assessment. We choose Sciaroidea as the fossil calibration point, and it was reported to originate at 180 Mya by Grimaldi and Engel. The Bibionomorpha was inferred to originate at 218 Mya, at least, in the Triassic (Figure 8). The superfamily Scatopsoidea is the earliest-appearing group in the investigation in the infraorder, and is estimated to originate at 218 Mya in the late Triassic. Subsequently, the Anisopodoidea appeared at 208 Mya in the late Triassic, and Bibionoidea + Sciaroidea at 190 Mya in the early Jurassic. The divergence of Bibionoidea might be tracked back to 149 Mya in the late Jurassic, and Sciaroidea to 180 Mya, in the early Jurassic. In Sciaroidea, the Mycetophilidae diverged at 150 Mya (in the late Jurassic), and the Keroplatidae at 170 Mya in the Jurassic. The Cecidomyiidae + Sciaridae was derived at 155 Mya in the late Jurassic, the Cecidomyiidae at 101 Mya, and Sciaridae at 134 Mya.
4. Discussion
4.1. Mitogenome Organization and Characteristics
The present study sequenced and annotated mitogenomes of two species in Bibionidae, which is the first report of complete mitogenomes for the superfamily Bibionoidea. There are 37 genes (13 PCGs, 22 tRNAs, and 2 rRNAs) and a CR, with high AT bias in nucleotide composition; the UAA, CGA, and GGA are three most used codons, and the Leu, Phe, and Ile are the most used amino acid in 20 species of Bibionomorpha mitogenomes investigated in this study. All tRNAs have a complete secondary structure except for trnS2, which lacks the DHU arm. All of these characteristics are identical to the reported mitogenomes of other dipterans [27,55]. The Ka/Ks ratios in 13 PCGs range from the 0.03 in cox1 to the 0.98 in atp8, which implies that these PCGs have undergone purifying selection. This is consistent with earlier studies in Culicidae [55,56], and in Mycetophilidae [57].
4.2. Gene Rearrangement of Mitogenomes
There are some rearrangement events in a small number of species in the superfamily Sciaroidea, but not in analyzed representatives of Scatopsoidea, Anisopodoidea, and Bibionoidea. The rearrangements exist in the families Keroplatidae, Sciaridae, and Cecidomyiidae but not in Mycetophilidae in the Sciaroidea. The unique inversion in Arachnocampa flava in Keroplatidae has been reported in other dipteran species, such as Anopheles quadrimaculatus and An. gambiae in Culicidae [58,59]. These three inversions, seven transpositions, and fourteen inverse transpositions (remote inversion) in three species in Cecidomyiidae have also been reported in Paracladura trichoptera in Trichoceridae in Diptera [11]. These two inverse transpositions and three transpositions in Trichosia lengersdorfi and Pseudolycoriella sp. in Sciaridae confirm earlier reports in Sciaridae [25].
Our phylogenetic study shows that the Sciaroidea is located at the top of four superfamilies investigated in this study, and Mycetophilidae and Keroplatidae + Cecidomyiidae + Sciaridae are sister groups in the Sciaroidea. These rearrangements exist only in the clade Keroplatidae + Cecidomyiidae + Sciaridae, which suggests that these rearrangement events appeared in the late period in the evolution of the Bibionomorpha. Their evolutionary mode and dynamics need to be explored with more mitogenome studies.
4.3. Phylogenetics and Evolution
The present study suggests the phylogenetic relationships of Scatopsoidea + (Anisopodoidea + (Bibionoidea + Sciaroidea)) in Bibionomorpha. Earlier molecular-based studies proposed Anisopodoidea to be thet most primitive group in Bibionomorpha [8,10], and another molecular-based study even suggested that the Anisopodoidea be included in one other infraorder Ptychopteromorpha [11]. Our result shows that the superfamily is derived later than Scatopsoidea, but only one species is investigated for both Anisopodoidea and Scatopsoidea in our study. Therefore, the phylogenetic position and monophyly of these two superfamilies are not yet settled. Although based on a very limited taxon sampling, this study supports the earlier research results for the monophyly of Sciaroidea [10,15]. The monophyly of Bibionidae in Bibionoidea is not yet determined due to only two species being included. The present study supports the monophyly of Mycetophilidae and Sciaridae in Sciaroidea, which was reported also based on mitogenomes [25,57]. However, further work and broader taxon sampling are necessary.
The present study suggests the origin of Bibionomorpha in the Triassic, which is consistent with an earlier study on Diptera evolution [60,61,62,63]. During the Triassic period, there were many autodigested fungi and decaying matter, which provided food for early lineages of the infraorder. The superfamilies Scatopsoidea and Anisopodoidea are suggested to be derived in the late Triassic and be the most primitive groups in the infraorder, which is consistent with the results of the previous study [9]. The Bibionoidea diverged in the Upper Jurassic (149 Mya), which is consistent with an earlier study [64]. Keroplatidae dates back to the Jurassic (170 Mya); the inferred dates are earlier than the inference by Blagoderov (105.3–99.7 Mya) [65]. The Mycetophilidae (150 Mya) and Cecidomyiidae + Sciaridae (155 Mya) in Sciaroidea are proposed to be derived in the Jurassic for the first time. The families Sciaridae (134 Mya) and Cecidomyiidae (101 Mya) in Sciaroidea originated in the Cretaceous, which is consistent with anearlier study [8]. In further research, more accurate estimates of divergence times are necessary with more precise fossil records for calibration and more complete sampling.
5. Conclusions
This is the first comprehensive study on the general characteristics of mitogenomes and mitogenomes-based phylogenetics in Bibionomorpha. Two species of mitogenomes are newly sequenced and annotated, and they represent the first report of complete mitogenomes for the family Bibionidae. A total of 20 mitogenomes in Bibionomorpha have been analyzed in the present study, and they are of the same general characteristics as other Diptera insects. Our results show that there are no gene rearrangements found in the superfamilies Scatopsoidea, Anisopodoidea, and Bibionoidea, and the family Mycetophilidae in Sciaroidea, but gene rearrangements exist in some families (Keroplatidae, Sciaridae, and Cecidomyiidae) in the Sciaroidea, which suggests that these rearrangement events are derived in the late period in the evolution of the Bibionomorpha. Our results support the phylogenetic relationships of Scatopsoidea + (Anisopodoidea + (Bibionoidea + Sciaroidea)) in Bibionomorpha, and the monophyly of the families Sciaridae and Mycetophilidae. In addition, we inferred that the Bibionomorpha originated in the Triassic, Scatopsoidea and Anisopodoidea in the late Triassic, Bibionoidea in the Jurassic, and Sciaroidea in the Jurassic to the Cretaceous. Our results demonstrate that the mitogenomes can be used to infer phylogenetic relationships in Bibionomorpha to help understand the history and evolutionary biology of the infraorder Bibionomorpha.
Supplementary Materials
The following supporting information can be downloaded at: https://www.mdpi.com/article/10.3390/genes14071485/s1, Table S1: The best partitions and substitution models for the mitogenome sequences identified by PartitionFinder 2.; Table S2: Composition and skewness of 20 species of mitogenomes in the Bibionomorpha.; Table S3: Relative synonymous codon usage (RSCU) of 20 species of mitogenomes in the Bibionomorpha.; Figure S1. Predicted secondary structures of 22 tRNAs in the mitogenomes of P. simplioipes (A), and P. hardyi (B). Nucleotides highlighted in red indicate mismatch.
Author Contributions
Conceived and designed the research: B.C. and M.-L.X.; performed the specimens collecting and experiments: H.Y., B.C., M.-L.X. and T.-J.L.; analyzed the data and wrote the paper: M.-L.X., B.C., T.-J.L. and H.Y. All authors have read and agreed to the published version of the manuscript.
Funding
This research was supported by the following: The National Natural Science Foundation of China (31872262), and Science and Technology Research Project of Chongqing Education Commission (KJZD-M202100502).
Data Availability Statement
The GenBank number of two newly sequenced species P. simplioipes: MT511121, P. hardyi: MT511122.
Conflicts of Interest
The authors declare no conflict of interest.
References
- Van Nieukerken, E.J.; Kaila, L.; Kitching, I.J.; Kristensen, N.P.; Lees, D.C.; Minet, J.; Mitter, C.; Mutanen, M.; Regier, J.C.; Simonsen, T.J.; et al. Animal biodiversity: An outline of higher-level classification and survey of taxonomic richness. Zootaxa 2011, 3148, 222–229. [Google Scholar]
- Matile, L. Phylogeny and evolution of the larval diet in the Sciaroidea (Diptera, Bibionomorpha) since the Mesozoic, The origin of biodiversity in insects: Phylogenetic tests of evolutionary scenarios. Mém. Mus. Natl. Hist. Nat. Paris Sér. A 1997, 173, 273–303. [Google Scholar]
- Arimoto, M.; Uesugi, R.; Hinomoto, N.; Sueyoshi, M.; Yoshimatsu, S.-I. Molecular marker to identify the fungus gnat, Bradysia sp. (Diptera: Sciaridae), a new pest of Welsh onion and carrot in Japan. Appl. Entomol. Zool. 2018, 53, 419–424. [Google Scholar] [CrossRef]
- Scarlett, K.; Tesoriero, L.; Daniel, R.; Guest, D. Sciarid and shore flies as aerial vectors of Fusarium oxysporumf. sp. cucumerinum in greenhouse cucumbers. Appl. Entomol. Zool. 2014, 138, 368–377. [Google Scholar] [CrossRef]
- Elmer, W.H. Preventing spread of Fusarium wilt of Hiemalis begonias in the greenhouse. Crop. Prot. 2008, 27, 1078–1083. [Google Scholar] [CrossRef]
- Hennig, W. Flügelgeäder und System der Dipteren unter Berücksichtigung der ausdem Mesozoikum beschriebenen Fossilien. Beitr. Zur Entomol. 1954, 4, 245–388. [Google Scholar]
- Oosterbroek, P.; Courtney, G. Phylogeny of the nematocerous families of Diptera (Insecta). Zool. J. Linn. Soc. 1995, 115, 267–311. [Google Scholar] [CrossRef]
- Bertone, M.A.; Courtney, G.W.; Wiegmann, B.M. Phylogenetics and temporal diversification of the earliest true flies (Insecta: Diptera) based on multiple nuclear genes. Syst. Èntomol. 2008, 33, 668–687. [Google Scholar] [CrossRef]
- Hennig, W. Ordnung Diptera (Zweiflügler). Handb. Zool. 1973, 4, 1–227. [Google Scholar]
- Ševčík, J.; Kaspřák, D.; Mantič, M.; Fitzgerald, S.; Ševčíková, T.; Tóthová, A.; Jaschhof, M. Molecular phylogeny of the megadiverse insect infraorder Bibionomorpha sensu lato (Diptera). PeerJ 2016, 4, e2563. [Google Scholar] [CrossRef] [Green Version]
- Beckenbach, A.T. Mitochondrial Genome Sequences of Nematocera (Lower Diptera): Evidence of Rearrangement following a Complete Genome Duplication in a Winter Crane Fly. Genome Biol. Evol. 2011, 4, 89–101. [Google Scholar] [CrossRef] [PubMed] [Green Version]
- Fitzgerald, S.J. Evolution and classification of Bibionidae (Diptera: Bibionomorpha). Ph.D. Thesis, Oregon State University, Corvallis, OR, USA, 2004. [Google Scholar]
- Lambkin, C.L.; Sinclair, B.J.; Pape, T.; Courtney, G.W.; Skevington, J.H.; Meier, R.; Yeates, D.K.; Blagoderov, V.; Wiegmann, B.M. The phylogenetic relationships among infraorders and superfamilies of Diptera based on morphological evidence. Syst. Èntomol. 2012, 38, 164–179. [Google Scholar] [CrossRef]
- Mantič, M.; Sikora, T.; Burdíková, N.; Blagoderov, V.; Kjærandsen, J.; Kurina, O.; Ševčík, J. Hidden in Plain Sight: Comprehensive Molecular Phylogeny of Keroplatidae and Lygistorrhinidae (Diptera) Reveals Parallel Evolution and Leads to a Revised Family Classification. Insects 2020, 11, 348. [Google Scholar] [CrossRef] [PubMed]
- Wood, D.M.; Borkent, A. Phylogeny and classifification of the Nematocera. Man. Nearctic Diptera 1989, 117, 1333–1370. [Google Scholar]
- Sikora, T.; Jaschhof, M.; Mantič, M.; Kaspřák, D.; Ševčík, J. Considerable congruence, enlightening conflict: Molecular analysis largely supports morphology-based hypotheses on Cecidomyiidae (Diptera) phylogeny. Zool. J. Linn. Soc. 2018, 185, 98–110. [Google Scholar] [CrossRef]
- Hippa, H.; Vilkamaa, P. Phylogeny of the Sciaroidea (Diptera): The implication of additional taxa and character data. Zootaxa 2006, 1132, 63–68. [Google Scholar] [CrossRef]
- Amorim, D.D.S.; Rindal, E. Phylogeny of the Mycetophiliformia, with proposal of the subfamilies Heterotrichinae, Ohakuneinae, and Chiletrichinae for the Rangomaramidae (Diptera, Bibionomorpha). Zootaxa 2007, 1535, 1–92. [Google Scholar] [CrossRef]
- Hippa, H.; Vilkamaa, P. The genus Sciarotricha gen. n. (Sciaridae) and the phylogeny of recent and Sciarotricha gen. n. (Sciaridae) and the phylogeny of recent and Sciarotricha fossil Sciaroidea (Diptera). Insect Syst. Evol. 2005, 36, 121–144. [Google Scholar]
- Cameron, S.L. Insect Mitochondrial Genomics: Implications for Evolution and Phylogeny. Annu. Rev. Èntomol. 2014, 59, 95–117. [Google Scholar] [CrossRef] [Green Version]
- Beckenbach, A.T.; Joy, J.B. Evolution of the Mitochondrial Genomes of Gall Midges (Diptera: Cecidomyiidae): Rearrangement and Severe Truncation of tRNA Genes. Genome Biol. Evol. 2009, 1, 278–287. [Google Scholar] [CrossRef] [Green Version]
- Boore, J.L. Animal mitochondrial genomes. Nucleic Acids Res. 1999, 27, 1767–1780. [Google Scholar] [CrossRef] [PubMed] [Green Version]
- Brehm, A.; Harris, D.J.; Hernández, M.; Cabrera, V.M.; Larruga, J.M.; Pinto, F.M.; González, A.M. Structure and evolution of the mitochondrial DNA complete control region in the Drosophila subobscura subgroup. Insect Mol. Biol. 2001, 10, 573–578. [Google Scholar] [CrossRef] [PubMed]
- Junqueira, A.C.M.; Lessinger, A.C.; Torres, T.T.; da Silva, F.R.; Vettore, A.L.; Arruda, P.; Espin, A.M.L.A. The mitochondrial genome of the blowfly Chrysomya chloropyga (Diptera: Calliphoridae). Gene 2004, 339, 7–15. [Google Scholar] [CrossRef] [PubMed]
- Miao, X.; Huang, J.; Menzel, F.; Wang, Q.; Wei, Q.; Lin, X.-L.; Wu, H. Five mitochondrial genomes of black fungus gnats (Sciaridae) and their phylogenetic implications. Int. J. Biol. Macromol. 2020, 150, 200–205. [Google Scholar] [CrossRef] [PubMed]
- Ding, Y.; Yan, Z.; Si, F.; Li, X.; Mao, Q.; Asghar, S.; Chen, B. Mitochondrial genes associated with pyrethroid resistance revealed by mitochondrial genome and transcriptome analyses in the malaria vector Anopheles sinensis (Diptera: Culicidae). Pest Manag. Sci. 2020, 76, 769–778. [Google Scholar] [CrossRef]
- Cameron, S.L.; Lambkin, C.L.; Barker, S.C.; Whiting, M.F. A mitochondrial genome phylogeny of Diptera: Whole genome sequence data accurately resolve relationships over broad timescales with high precision. Syst. Èntomol. 2007, 32, 40–59. [Google Scholar] [CrossRef]
- Chang, H.; Qiu, Z.; Yuan, H.; Wang, X.; Li, X.; Sun, H.; Guo, X.; Lu, Y.; Feng, X.; Majid, M.; et al. Evolutionary rates of and selective constraints on the mitochondrial genomes of Orthoptera insects with different wing types. Mol. Phylogenet. Evol. 2020, 145, 106734. [Google Scholar] [CrossRef]
- Yuan, M.-L.; Zhang, Q.-L.; Zhang, L.; Guo, Z.-L.; Liu, Y.-J.; Shen, Y.-Y.; Shao, R. High-level phylogeny of the Coleoptera inferred with mitochondrial genome sequences. Mol. Phylogenet. Evol. 2016, 104, 99–111. [Google Scholar] [CrossRef]
- Tang, P.; Zhu, J.-C.; Zheng, B.-Y.; Wei, S.-J.; Sharkey, M.; Chen, X.-X.; Vogler, A.P. Mitochondrial phylogenomics of the Hymenoptera. Mol. Phylogenet. Evol. 2018, 131, 8–18. [Google Scholar] [CrossRef]
- Anderson, N.; Jaron, K.S.; Hodson, C.N.; Couger, M.B.; Ševčík, J.; Weinstein, B.; Pirro, S.; Ross, L.; Roy, S.W. Gene-rich X chromosomes implicate intragenomic conflict in the evolution of bizarre genetic systems. Proc. Natl. Acad. Sci. USA 2022, 119, e2122580119. [Google Scholar] [CrossRef]
- Lu, B.L.; Dong, X.S. Fauna Sinica, Insecta, Diptera: Culicidae 1.8; Science Press: Beijing, China, 1997. [Google Scholar]
- Andrews, S. FastQC: A Quality Control Tool for High Throughput Sequence Dat. Available online: http://www.bioinformatics.babraham.ac.uk/projects/fastqc/ (accessed on 6 October 2011).
- Ankevich, B.; Nurk, S.; Antipov, D.; Gurevich, A.A.; Dvorkin, M.; Kulikov, A.S.; Lesin, V.M.; Nikolenko, S.I.; Pham, S.; Prjibelski, A.D.; et al. SPAdes: A new genome assembly algorithm and its applications to single-cell sequencing. J. Comput. Biol. 2012, 19, 455–477. [Google Scholar] [CrossRef] [PubMed] [Green Version]
- Dierckxsens, N.; Mardulyn, P.; Smits, G. NOVOPlasty: De novo assembly of organelle genomes from whole genome data. Nucleic Acids Res. 2016, 45, e18. [Google Scholar]
- Bernt, M.; Donath, A.; Jühling, F.; Externbrink, F.; Florentz, C.; Fritzsch, G.; Pütz, J.; Middendorf, M.; Stadler, P.F. MITOS: Improved de novo metazoan mitochondrial genome annotation. Mol. Phylogenet. Evol. 2013, 69, 313–319. [Google Scholar] [CrossRef] [PubMed]
- Kumar, S.; Stecher, G.; Li, M.; Knyaz, C.; Tamura, K. MEGA X: Molecular Evolutionary Genetics Analysis across Computing Platforms. Mol. Biol. Evol. 2018, 35, 1547–1549. [Google Scholar] [CrossRef] [PubMed]
- Lowe, T.M.; Eddy, S.R. tRNAscan-SE: A program for improved detection of transfer RNA genes in genomic sequence. Nucleic Acids Res. 1996, 25, 955–964. [Google Scholar] [CrossRef]
- Kearse, M.; Moir, R.; Wilson, A.; Stones-Havas, S.; Cheung, M.; Sturrock, S.; Buxton, S.; Cooper, A.; Markowitz, S.; Duran, C.; et al. Geneious Basic: An integrated and extendable desktop software platform for the organization and analysis of sequence data. Bioinformatics 2012, 28, 1647–1649. [Google Scholar] [CrossRef] [Green Version]
- Grant, J.R.; Arantes, A.S.; Stothard, P. Comparing thousands of circular genomes using the CGView Comparison Tool. BMC Genom. 2012, 13, 202. [Google Scholar] [CrossRef] [Green Version]
- Tamura, K.; Stecher, G.; Peterson, D.; Filipski, A.; Kumar, S. MEGA6: Molecular evolutionary genetics analysis version 6.0. Mol. Biol. Evol. 2013, 30, 2725–2759. [Google Scholar] [CrossRef] [Green Version]
- Mikrajuddin, A.K. A simple method for determining surface porosity based on SEM images using Origin Pro software. Indones. J. Phys. 2009, 20, 37–41. [Google Scholar]
- Julio, R.; Albert, F.M.; Carlos, J.S.D.; Sara, G.R.; Pablo, L.; Sebastián, E.R.O.; Alejandro, S.G. DnaSP 6: DNA sequence polymorphism analysis of large data sets. Mol. Biol. Evol. 2017, 34, 3299–3302. [Google Scholar]
- Zhang, D.; Gao, F.; Jakovlić, I.; Zou, H.; Zhang, J.; Li, W.X.; Wang, G.T. PhyloSuite: An integrated and scalable desktop platform for streamlined molecular sequence data management and evolutionary phylogenetics studies. Mol. Ecol. Resour. 2020, 20, 348–355. [Google Scholar] [CrossRef] [PubMed]
- Katoh, K.; Standley, D.M. MAFFT Multiple Sequence Alignment Software Version 7: Improvements in Performance and Usability. Mol. Biol. Evol. 2013, 30, 772–780. [Google Scholar] [CrossRef] [PubMed] [Green Version]
- Vaidya, G.; Lohman, D.J.; Meier, R. SequenceMatrix: Concatenation software for the fast assembly of multi-gene datasets with character set and codon information. Cladistics 2011, 27, 171–180. [Google Scholar] [CrossRef] [PubMed]
- Lanfear, R.; Frandsen, P.B.; Wright, A.M.; Senfeld, T.; Calcott, B. PartitionFinder 2: New Methods for Selecting Partitioned Models of Evolution for Molecular and Morphological Phylogenetic Analyses. Mol. Biol. Evol. 2017, 34, 772–773. [Google Scholar] [CrossRef] [PubMed] [Green Version]
- Minh, B.Q.; Nguyen, M.A.T.; Von Haeseler, A. Ultrafast Approximation for Phylogenetic Bootstrap. Mol. Biol. Evol. 2013, 30, 1188–1195. [Google Scholar] [CrossRef] [Green Version]
- Nguyen, L.-T.; Schmidt, H.A.; Von Haeseler, A.; Minh, B.Q. IQ-TREE: A Fast and Effective Stochastic Algorithm for Estimating Maximum-Likelihood Phylogenies. Mol. Biol. Evol. 2015, 32, 268–274. [Google Scholar] [CrossRef]
- Ronquist, F.; Teslenko, M.; van der Mark, P.; Ayres, D.L.; Darling, A.; Höhna, S.; Larget, B.; Liu, L.; Suchard, M.A.; Huelsenbeck, J.P. MrBayes 3.2: Efficient Bayesian Phylogenetic Inference and Model Choice across a Large Model Space. Syst. Biol. 2012, 61, 539–542. [Google Scholar] [CrossRef] [Green Version]
- Rambaut, FigTree (Version 1.4.3). Available online: https://tree.bio.ed.ac.uk/software/figtree/.2009 (accessed on 10 September 2020).
- Letunic, P.B. Interactive tree of life (iTOL) v3: An online tool for the display and annotation of phylogenetic and other trees. Nucleic Acids Res. 2016, 44, 242–245. [Google Scholar] [CrossRef]
- Drummond, A.J.; Rambaut, A. BEAST: Bayesian evolutionary analysis by sampling trees. BMC Evol. Biol. 2007, 7, 1–8. [Google Scholar] [CrossRef] [Green Version]
- Grimaldi, D.; Engel, M.S. Evolution of the Insects; Cambridge University Press: New York, NY, USA, 2005. [Google Scholar]
- Guo, Z.; Yan, W.; Fu, H.; Yuan, X.L.; Chen, B. Complete mitogenomes of Anopheles peditaeniatus and Anopheles nitidus and phylogenetic relationships within the genus Anopheles inferred from mitogenomes. Parasite. Vector. 2021, 14, 452. [Google Scholar] [CrossRef]
- Hao, Y.-J.; Zou, Y.-L.; Ding, Y.-R.; Xu, W.-Y.; Yan, Z.-T.; Li, X.-D.; Fu, W.-B.; Li, T.-J.; Chen, B. Complete mitochondrial genomes of Anopheles stephensi and An. dirus and comparative evolutionary mitochondriomics of 50 mosquitoes. Sci. Rep. 2017, 7, 7666. [Google Scholar] [CrossRef] [PubMed]
- Wang, Q.; Huang, J.; Wu, H. Mitogenomes provide insights into the phylogeny of Mycetophilidae (Diptera: Sciaroidea). Gene 2021, 783, 145564. [Google Scholar] [CrossRef] [PubMed]
- Ramakodi, M.P.; Singh, B.; Wells, J.D.; Guerrero, F.; Ray, D.A. A 454 sequencing approach to dipteran mitochondrial genome research. Genomics 2015, 105, 53–60. [Google Scholar] [CrossRef] [PubMed]
- Beard, C.B.; Hamm, D.M.; Collins, F.H. The mitochondrial genome of the mosquito Anopheles gambiae: DNA sequence, genome organization, and comparisons with mitochondrial sequences of other insects. Insect Mol. Biol. 1993, 2, 103–124. [Google Scholar] [CrossRef]
- Wiegmann, B.M.; Trautwein, M.D.; Winkler, I.S.; Barr, N.B.; Kim, J.-W.; Lambkin, C.; Bertone, M.A.; Cassel, B.K.; Bayless, K.M.; Heimberg, A.M.; et al. Episodic radiations in the fly tree of life. Proc. Natl. Acad. Sci. USA 2011, 108, 5690–5695. [Google Scholar] [CrossRef]
- Blagoderov, V.; Grimaldi, D.A.; Fraser, N.C. How Time Flies for Flies: Diverse Diptera from the Triassic of Virginia and Early Radiation of the Order. Am. Mus. Novit. 2007, 3572, 1–39. [Google Scholar] [CrossRef]
- Shcherbakov, D.E.; Lukashevich, E.D.; Blagoderov, V.A. Triassic Diptera and initial radiation of the order. Int. J. Dipt. Res. 1995, 6, 75–115. [Google Scholar]
- Krzeminski, W.; Krzeminska, E. Triassic Diptera: Descriptions, revisions and phylogenetic relations. Acta Zool. Cracov. 2003, 46, 153–184. [Google Scholar]
- Evenhuis, N.L. Catalogue of the Fossil Flies of the World; Backhuys Publishers: Leiden, The Netherlands, 1994; pp. 122–133. [Google Scholar]
- Blagoderov, V.A.; Arillo, A. New Sciaroidea (Insecta: Diptera) in Lower Cretaceous amber from Spain. Stud. Dipterol. 2002, 9, 31–40. [Google Scholar]
Figure 1.
Mitogenome structure of P. simplioipes and P. hardyi newly sequenced and annotated in this study. The yellow, blue, red, and purple blocks indicate PCGs, tRNAs, rRNAs, and CR, respectively. The genes on the outer circle are located on the J-strand, whereas the genes on the inner circle are located on the N-strand. L1, L2, S1, and S2 represent the tRNAs tRNA-Leu (CUN), tRNA-Leu (UUR), tRNA-Ser (AGN), and tRNA-Ser (UCN), respectively.
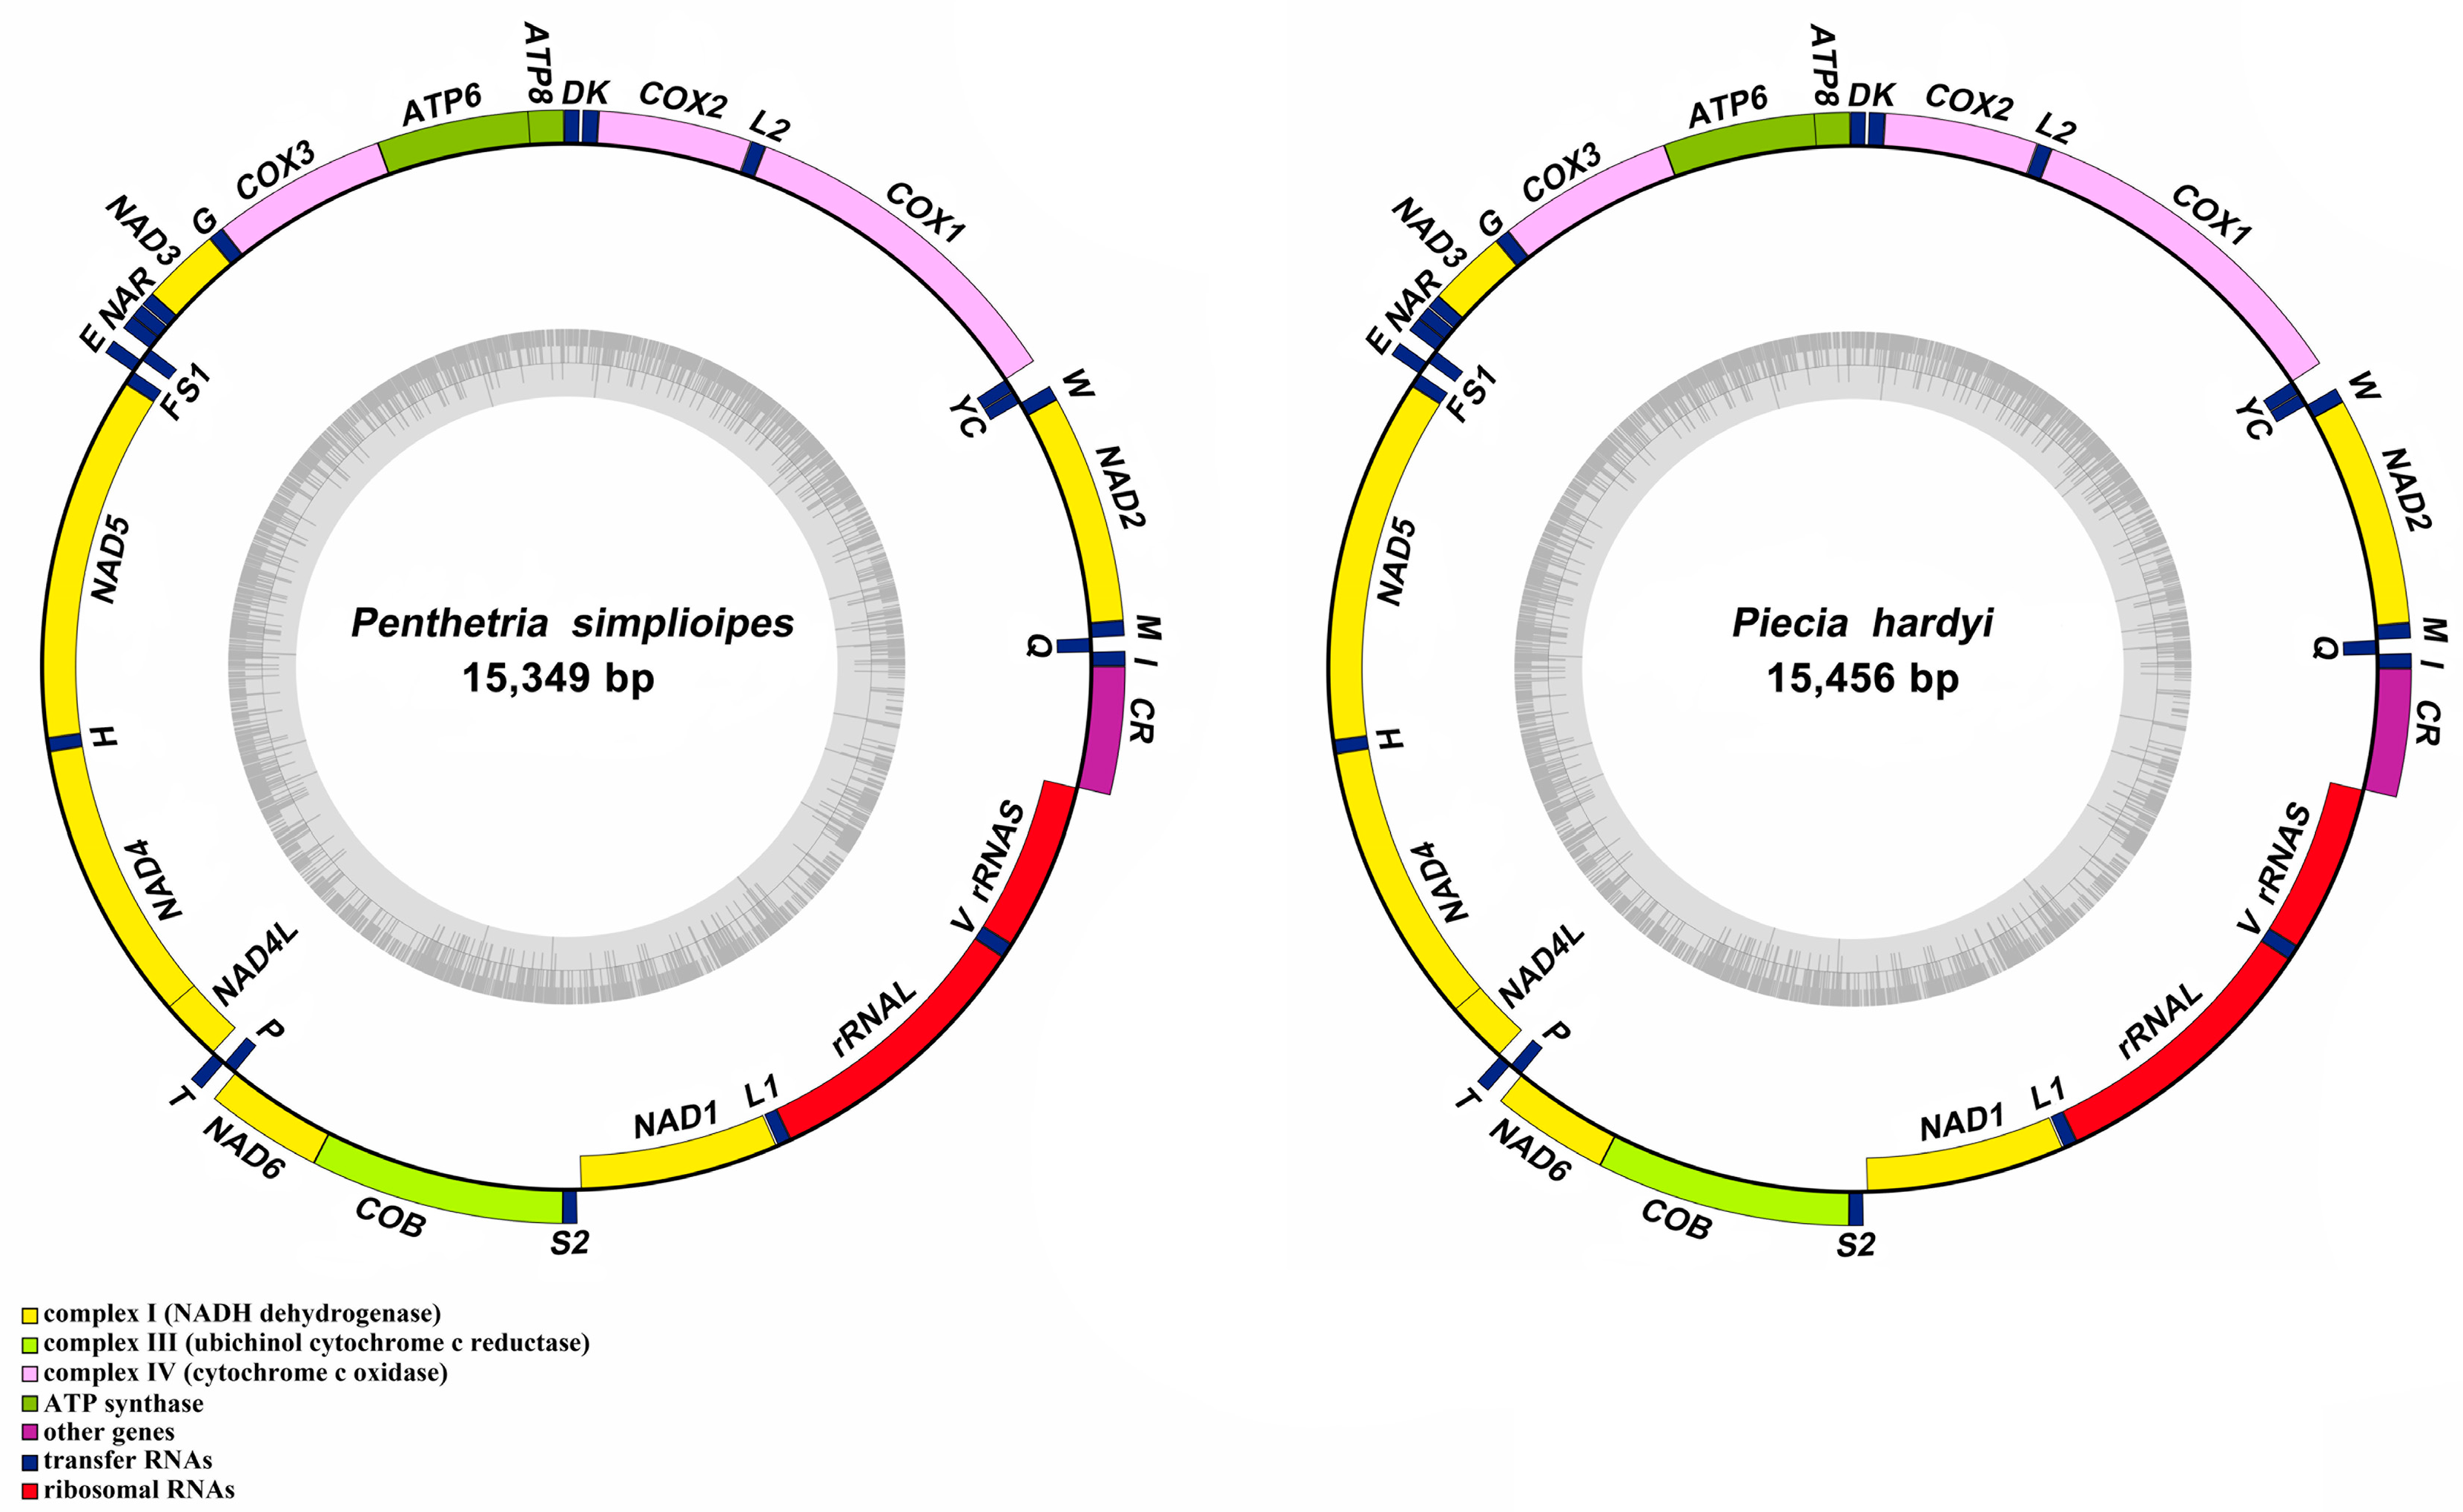
Figure 2.
Three-dimensional scatter plot charts of the AT-Skew, GC-Skew, and AT content from 20 mitogenome sequences in the Bibionomorpha. The different colors of balls represent the different species.
Figure 2.
Three-dimensional scatter plot charts of the AT-Skew, GC-Skew, and AT content from 20 mitogenome sequences in the Bibionomorpha. The different colors of balls represent the different species.
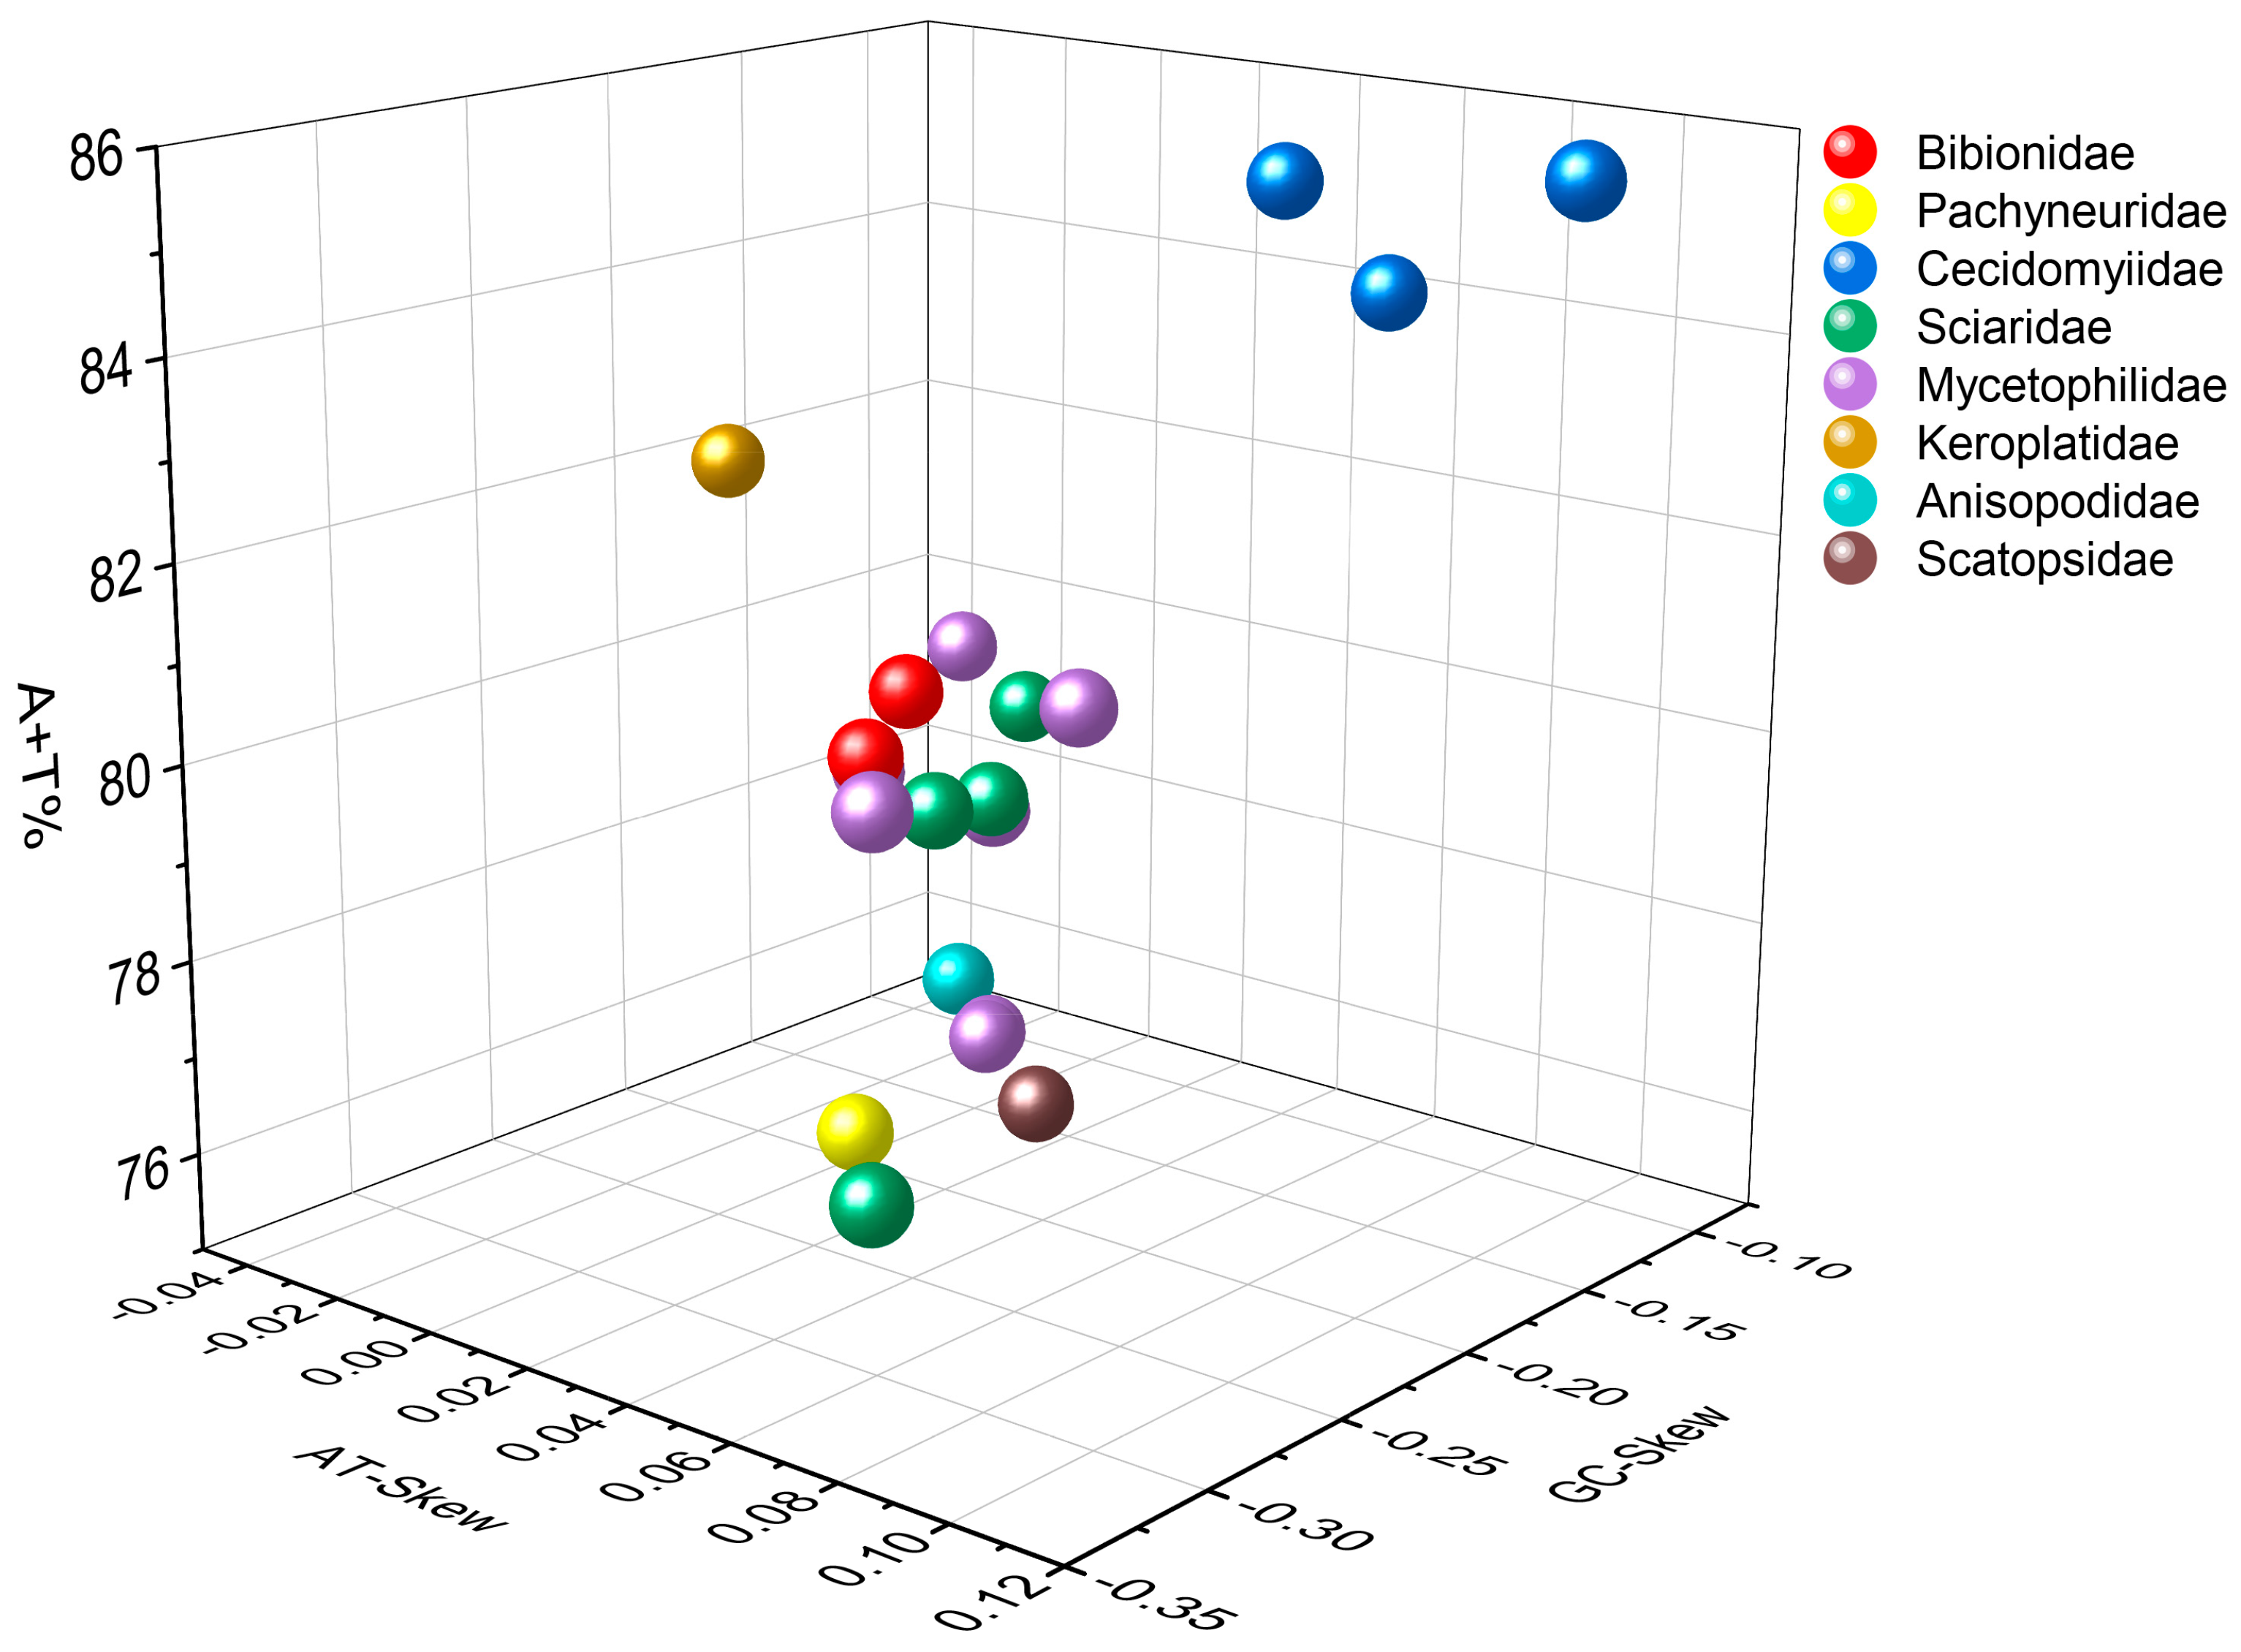
Figure 3.
Frequency percentage of each of 20 coded amino acids in 20 mitogenome sequences in the Bibionomorpha.
Figure 3.
Frequency percentage of each of 20 coded amino acids in 20 mitogenome sequences in the Bibionomorpha.

Figure 4.
Evolutionary rates of 13 protein-coding genes (PCGs) within 20 mitogenomes in the Bibionomorpha. Ks: The number of synonymous substitutions per synonymous site; Ka: The number of non-synonymous substitutions per non-synonymous site; Ka/Ks: The ratio of non-synonymous substitutions to synonymous substitution.

Figure 5.
Mitogenome organization of the Bibionomorpha referenced with the ancestral insect mitogenomes. The underlined symbols are located on the N-strand and others on the J-strand. The white, green, blue, orange, yellow, and pink blocks denote transfer tRNAs, DNAH dehydrogenase, Cytochrome C oxidase, ATP synthetase, and ribosomal RNAs, respectively, with the red gene representing the existence of rearrangement. Abbreviations: Cfu: Coboldia fuscipes, Sfe: Sylvicola fenestralis, Csp: Cramptonomyia spenceri, Psi: Penthetria simplioipes, Pha: Plecia hardyi, Npr: Neoempheria proxima, Esp: Epicypta sp., Exi: Epicypta xiphothorna, Asp1: Azana sp., Ani: Acnemia nitidicollis, Asp2: Allodia sp., Aan: Allodia anglofennica, Afl: Arachnocampa flava, Rpo: Rhopalomyia pomum, Mde: Mayetiola destructor, Oor: Orseolia oryzae, Sru: Sciara ruficauda, Psc: Pnyxia scabiei, Tle: Trichosia lengersdorfi, Psp: Pseudolycoriella sp.
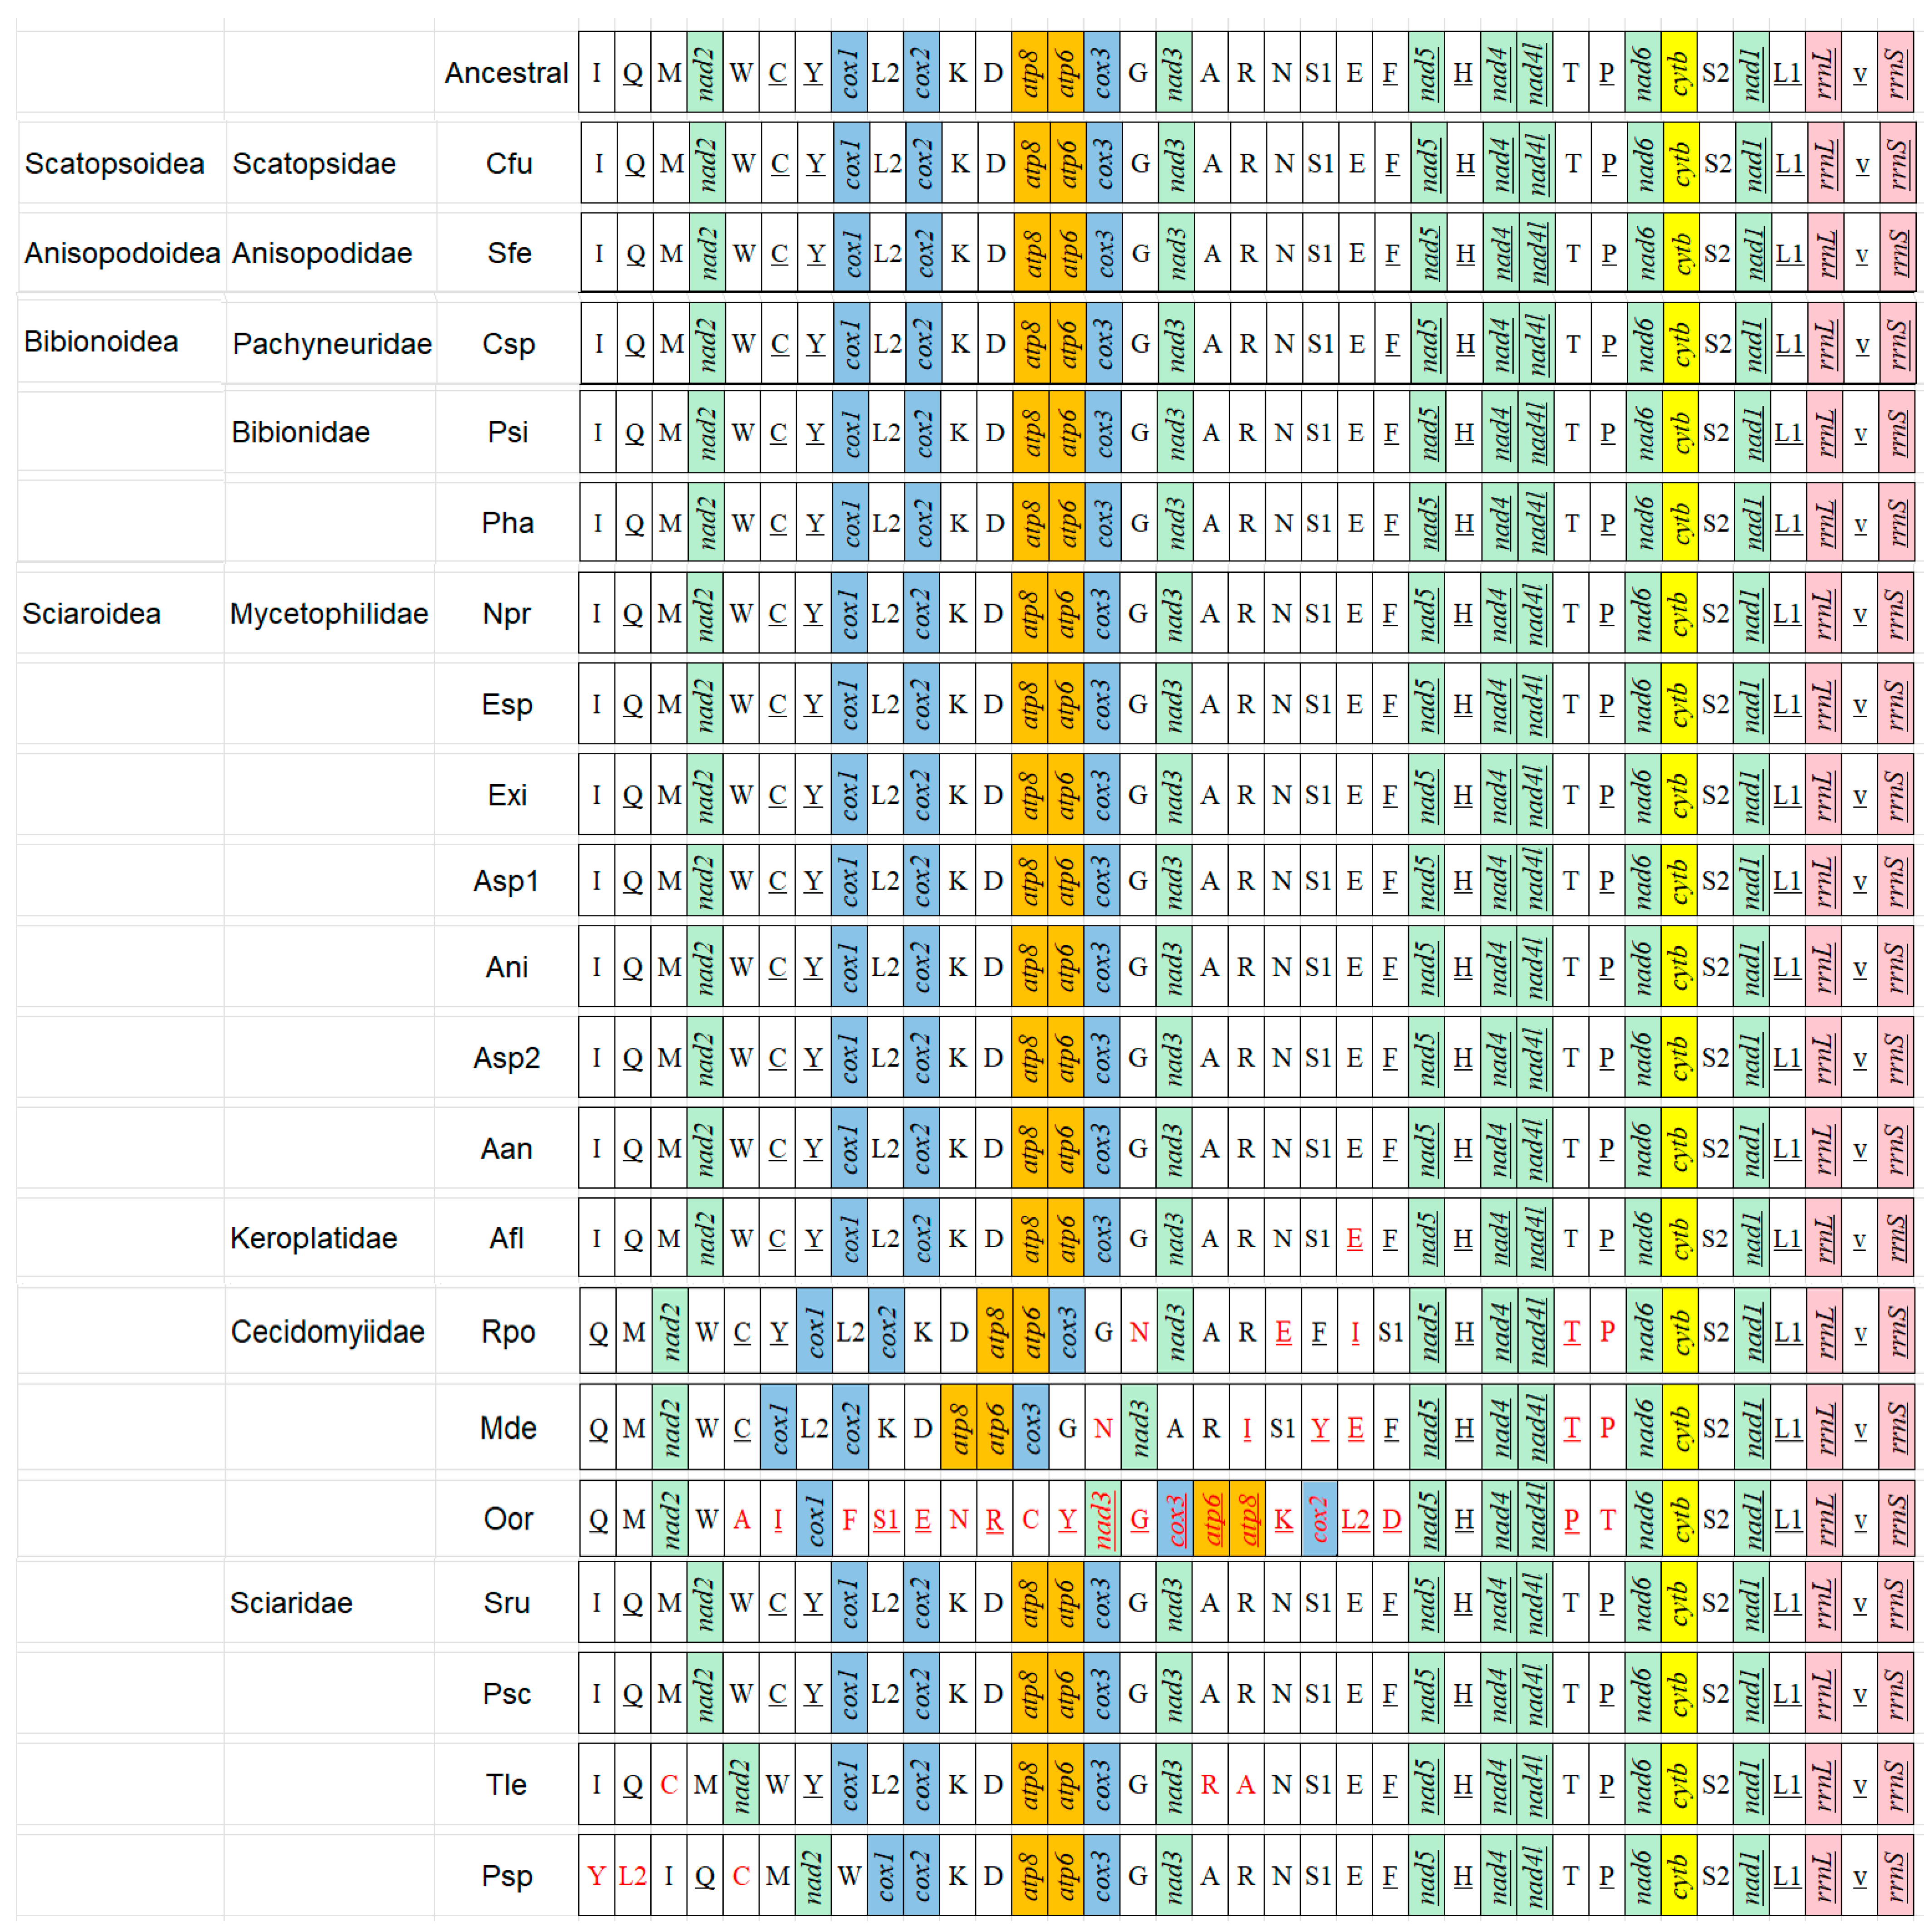
Figure 6.
Mitogenome-based phylogenetic relationships of Bibionomorpha species. They are constructed based on PCG123 + R datasets and PCG123 datasets using BI method. The posterior probabilities PCG123 + R are shown on corresponding nodes in the identical topology of BI tree, with left and right values separately based on PCG123 + R and PCG123 datasets. The different colors of species name blocks represent the different families. The mitogenomes of two species newly sequenced in this study are indicated by pentagrams.
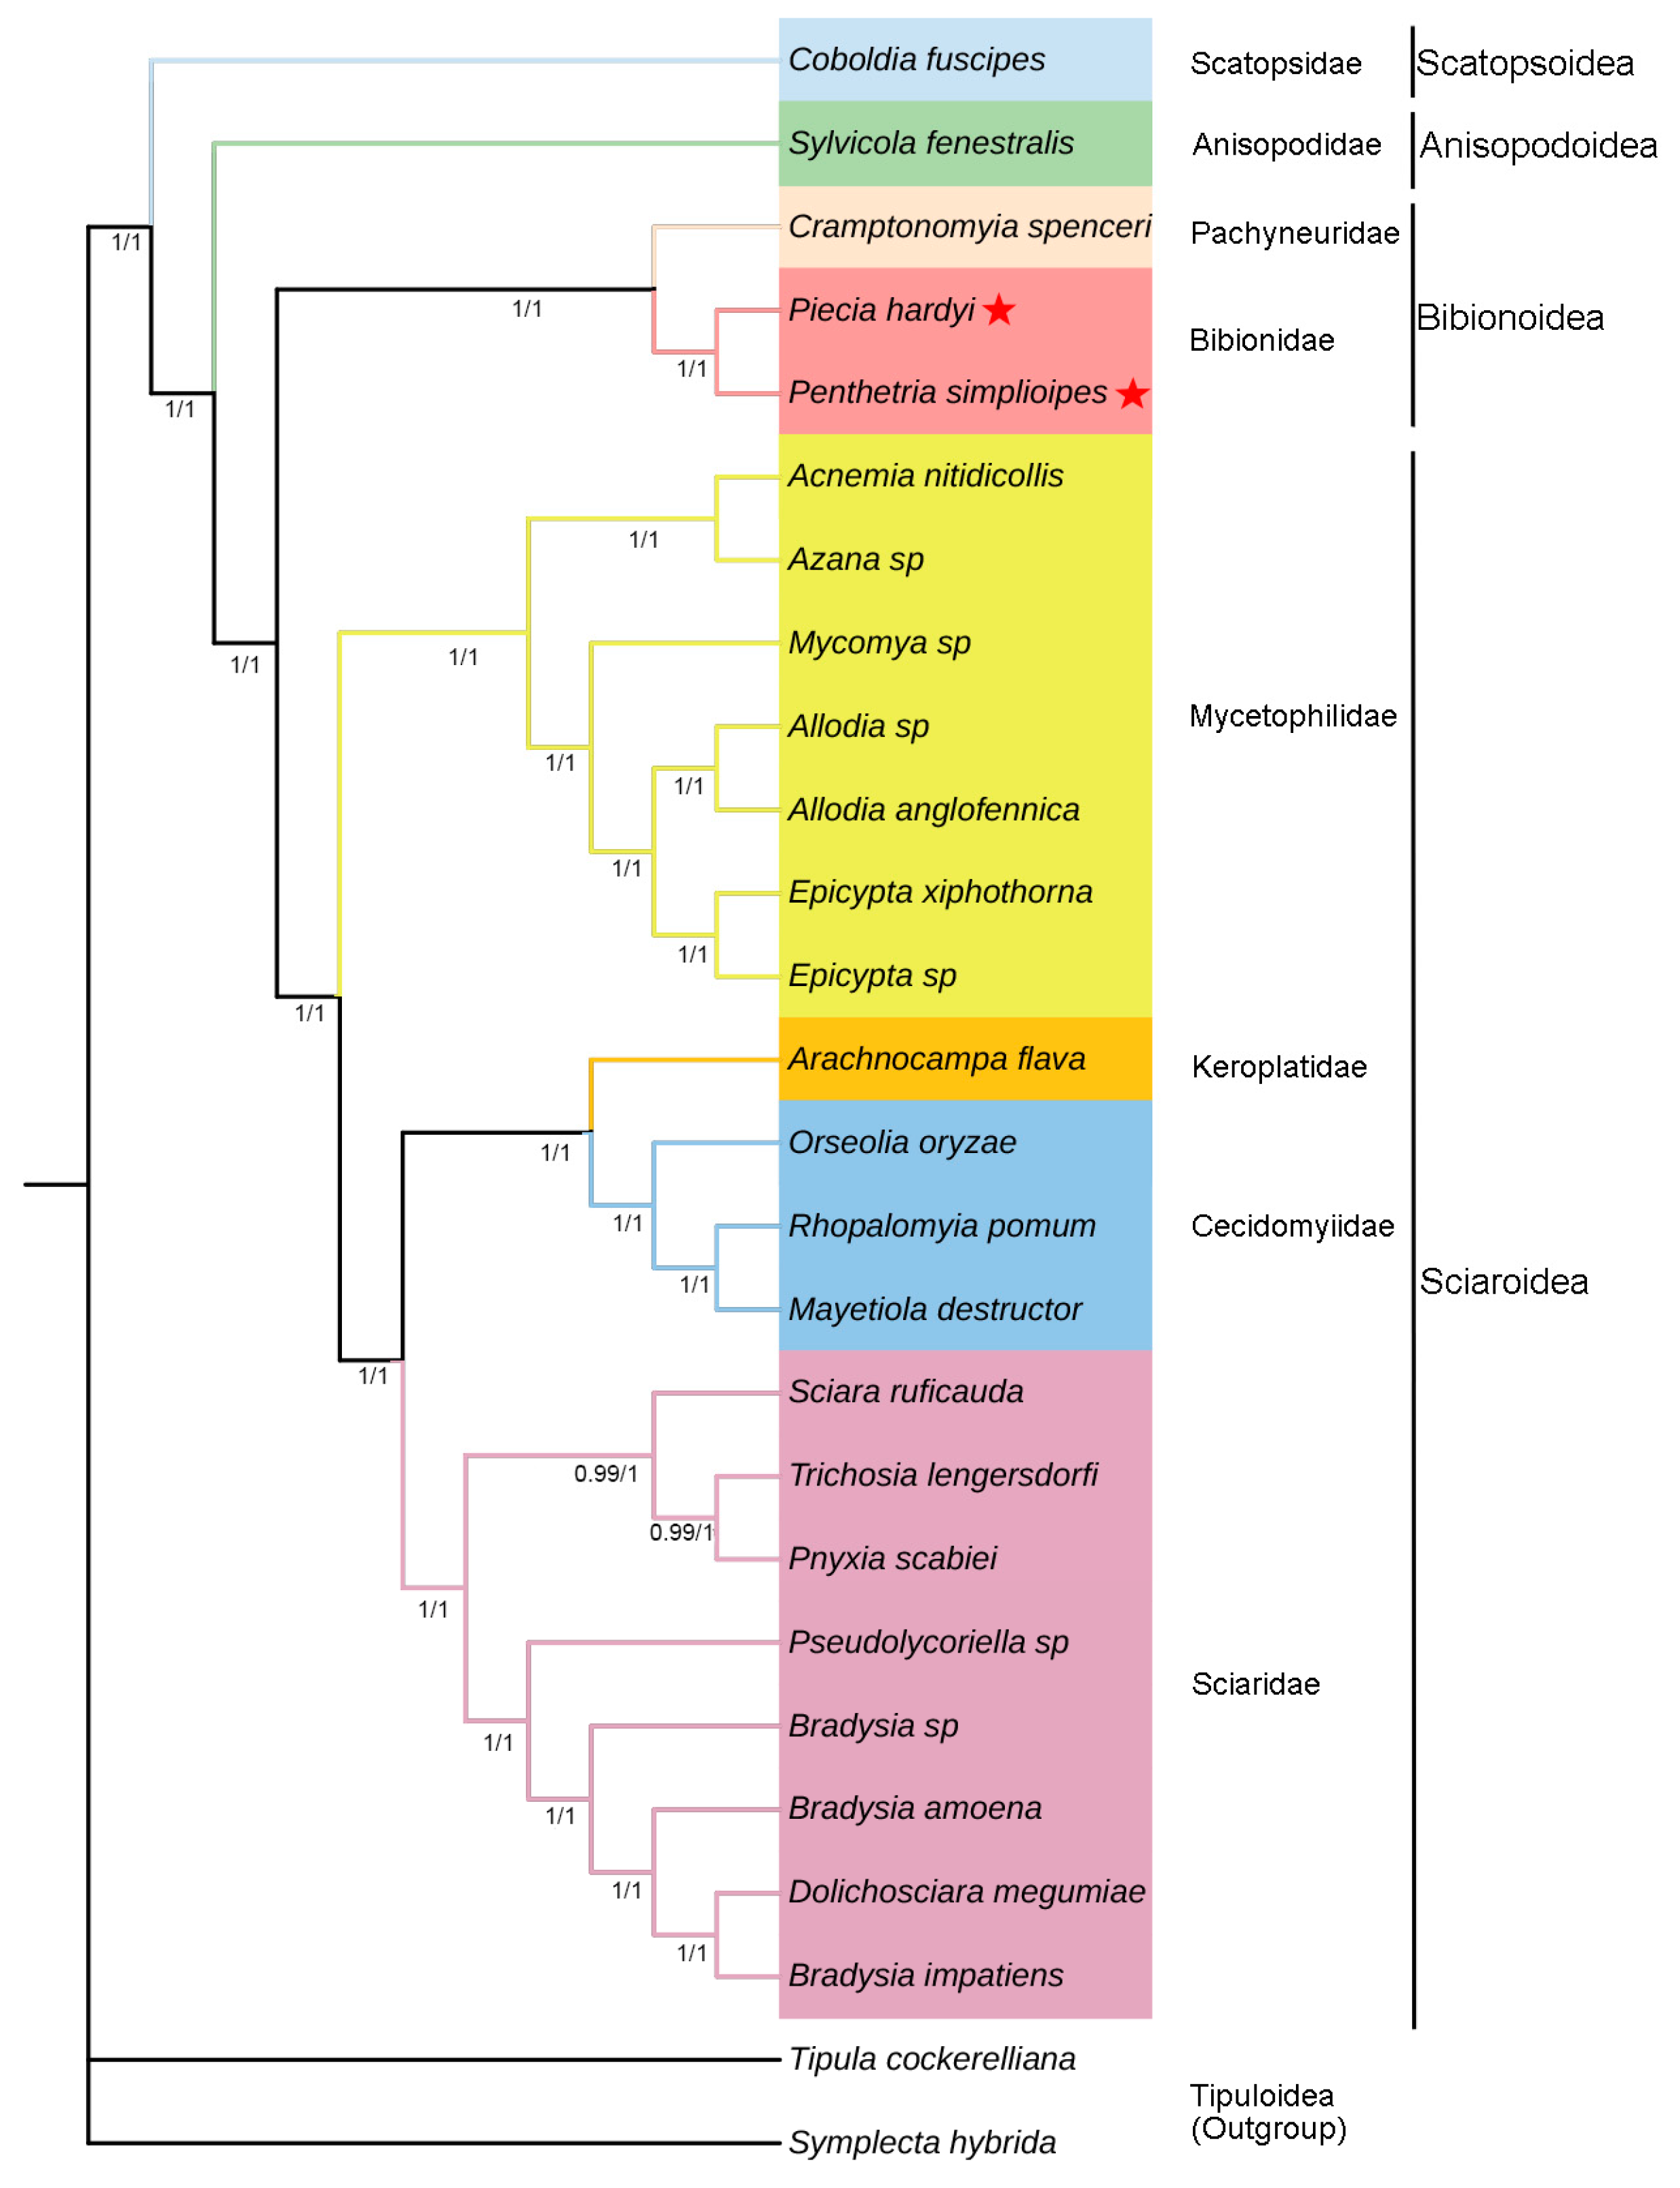
Figure 7.
Mitogenome-based phylogenetic relationships of Bibionomorpha species. They are constructed based on PCG123 + R and PCG123 datasets using ML method. The bootstrap values PCG123 + R are shown on corresponding nodes in the identical topology of ML tree, with left and right values separately based on PCG123 + R and PCG123 datasets. The different colors of species name blocks represent the different families. The mitogenomes of two species newly sequenced in this study are indicated by pentagrams.

Figure 8.
The divergence time produced by the BEAST analysis of the PCG + R dataset using one fossil calibration point, which is indicated by rectangle. Blue bars represent 95% credibility intervals for the ages of the clades. The mitogenomes of two species newly sequenced in this study are indicated by pentagrams. A geological time scale is shown at the bottom.


Table 1.
Organization of the mitogenomes of Penthetria simplioipes (PSI) and Plecia hardyi (PHA) newly sequenced in this study.
Table 1.
Organization of the mitogenomes of Penthetria simplioipes (PSI) and Plecia hardyi (PHA) newly sequenced in this study.
| Gene | Strand | Position (bp) | Length (bp) | Space (+)/Overlap (−) | Start/Stop Codon | ||||
|---|---|---|---|---|---|---|---|---|---|
| PSI | PHA | PSI | PHA | PSI | PHA | PSI | PHA | ||
| trnI | J | 1–67 | 1–71 | 67 | 71 | 0 | 0 | ||
| trnQ | N | 84–152 | 68–138 | 69 | 71 | 16 | −4 | ||
| trnM | J | 211–279 | 136–204 | 69 | 69 | 58 | −3 | ||
| nad2 | J | 279–1325 | 204–1244 | 1047 | 1041 | −1 | −1 | ATA/TAA | ATT/TAA |
| trnW | J | 1326–1395 | 1266–1334 | 70 | 69 | 0 | 21 | ||
| trnC | N | 1394–1459 | 1327–1390 | 66 | 64 | −2 | −8 | ||
| trnY | N | 1465–1533 | 1398–1466 | 69 | 69 | 5 | 7 | ||
| cox1 | J | 1568–3065 | 1501–2998 | 1498 | 1498 | 34 | 34 | ATT/T | ATC/T |
| trnL1 | J | 3065–3132 | 2998–3065 | 68 | 68 | −1 | −1 | ||
| cox2 | J | 3137–3820 | 3069–3761 | 684 | 693 | 4 | 3 | ATT/TAA | ATG/TAA |
| trnK | J | 3824–3896 | 3761–3831 | 73 | 71 | 3 | −1 | ||
| trnD | J | 3903–3974 | 3837–3905 | 72 | 69 | 6 | 5 | ||
| atp8 | J | 3974–4132 | 3906–4067 | 159 | 162 | −1 | 0 | ATT/TAA | ATT/TAA |
| atp6 | J | 4126–4803 | 4061–4735 | 678 | 675 | −7 | −7 | ATG/TAA | ATG/TAA |
| cox3 | J | 4805–5593 | 4739–5527 | 789 | 789 | 1 | 3 | ATG/TAA | ATG/TAA |
| trnG | J | 5594–5660 | 5528–5595 | 67 | 68 | 0 | 0 | ||
| nad3 | J | 5661–6014 | 5596–5947 | 354 | 352 | 0 | 0 | ATT/TAA | ATT/TAA |
| trnR | J | 6020–6085 | 5947–6011 | 66 | 65 | 5 | −1 | ||
| trnA | J | 6083–6149 | 6011–6079 | 67 | 69 | −3 | −1 | ||
| trnN | J | 6149–6218 | 6079–6147 | 70 | 69 | −1 | −1 | ||
| trnS2 | N | 6218–6286 | 6152–6207 | 69 | 56 | −1 | 4 | ||
| trnE | J | 6286–6356 | 6216–6281 | 71 | 66 | −1 | 8 | ||
| trnF | N | 6355–6421 | 6281–6352 | 67 | 72 | −2 | −1 | ||
| nad5 | N | 6421–8152 | 6352–8083 | 1732 | 1732 | −1 | −1 | ATT/T | ATT/T |
| trnH | N | 8153–8219 | 8084–8148 | 67 | 65 | 0 | 0 | ||
| nad4 | N | 8219–9554 | 8149–9489 | 1336 | 1341 | −1 | 0 | ATT/TAA | ATG/TAA |
| nad4L | N | 9548–9844 | 9480–9776 | 297 | 297 | −7 | −10 | ATG/TAA | ATG/TAA |
| trnT | J | 9852–9914 | 9785–9849 | 63 | 65 | 7 | 8 | ||
| trnP | N | 9914–9981 | 9849–9916 | 68 | 68 | −1 | −1 | ||
| nad6 | J | 9983–10,501 | 9918–10,436 | 519 | 519 | 1 | 1 | ATT/TAA | ATA/TAA |
| cytb | J | 10,501–11,637 | 10,445–11,581 | 1137 | 1137 | −1 | 8 | ATG/TAA | ATG/TAA |
| trnS1 | J | 11,641–11,712 | 11,584–11,654 | 72 | 71 | 3 | 2 | ||
| nad1 | N | 11,726–12,658 | 11,672–12,628 | 933 | 957 | 13 | 17 | TTG/TAG | ATT/TAG |
| trnL2 | N | 12,677–12,745 | 12,629–12,700 | 69 | 72 | 18 | 0 | ||
| rrnL | N | 12,746–13,752 | 12,701–14,050 | 1007 | 1350 | 0 | 0 | ||
| trnV | N | 13,753–13,826 | 14,051–14,124 | 74 | 74 | 0 | 0 | ||
| rrnS | N | 13,827–14,611 | 14,125–14,909 | 785 | 785 | 0 | 0 | ||
| CR | 14,612–15,349 | 14,910–15,465 | 738 | 556 | 0 | 0 | |||
Table 2.
Taxonomic and mitogenome information of species used in the present phylogenetic analysis.
| Superfamily | Species | Total | PCGs | tRNA | rRNA | CR | GenBank |
|---|---|---|---|---|---|---|---|
| /Family | Size (bp) | Size (bp) | Size (bp) | Size (bp) | Size (bp) | ID | |
| Bibionoidea | |||||||
| Bibionidae | Penthetria simplioipes | 15,349 | 11,163 | 1513 | 1792 | 738 | MT511121 |
| Piecia hardyi | 15,456 | 11,193 | 1493 | 2084 | 556 | MT511122 | |
| Pachyneuridae | Cramptonomyia spenceri | 16,274 | 11,223 | 1477 | 2138 | 1068 | NC016203 |
| Scatopsoidea | |||||||
| Scatopsidae | Coboldia fuscipes | 15,309 | 11,167 | 1470 | 2111 | 510 | MZ567016 |
| Anisopodoidea | |||||||
| Anisopodidae | Sylvicola fenestralis | 16,234 | 11,237 | 1432 | 2133 | 1232 | NC016176 |
| Sciaroidea | |||||||
| Cecidomyiidae | Mayetiola destructor | 14,759 | 11,209 | 1474 | 2048 | 604 | NC013066 |
| Orseoli aoryzae | 15,286 | 10,794 | 1474 | 1988 | 578 | NC027680 | |
| Rhopalomyia pomum | 14,503 | 10,897 | 1477 | 1995 | 363 | GQ387649 | |
| Sciaridae | Sciara ruficauda | 15,167 | 11,204 | 1476 | 2116 | N/A | MN161586 |
| Bradysia sp. | 15,512 | 11,124 | 1377 | 2130 | N/A | MN161585 | |
| Bradysia amoena | 14,049 | 10,032 | 1484 | 1962 | N/A | NC057971 | |
| Bradysia impatiens | 16,479 | 11,217 | 1450 | 2185 | 370 | MZ202360 | |
| Pnyxia scabiei | 15,437 | 11,215 | 1463 | 2128 | N/A | NC053636 | |
| Trichosia lengersdorfi | 16,171 | 11,222 | 1477 | 2212 | N/A | MN161589 | |
| Pseudolycoriella sp. | 15,981 | 11,224 | 1482 | 2163 | N/A | MN161587 | |
| Dolichosciara megumiae | 15,931 | 11,114 | 1423 | 2132 | N/A | MN161588 | |
| Mycetophilidae | Neoempheria proxima | 15,853 | 11,205 | 1469 | 2112 | 783 | MW116802 |
| Epicypta sp. | 16,279 | 11,199 | 1457 | 2116 | 6145 | MW116800 | |
| Epicypta xiphothorna | 15,902 | 11,196 | 1452 | 2132 | 563 | MW116799 | |
| Azana sp. | 16,654 | 11,226 | 1507 | 2171 | 762 | MW116798 | |
| Acnemia nitidicollis | 16,950 | 11,206 | 1478 | 2132 | N/A | NC050318 | |
| Allodia sp. | 14,899 | 11,199 | 1465 | 2077 | N/A | MN310892 | |
| Allodia anglofennica | 14,897 | 11,196 | 1467 | 2074 | N/A | MN310891 | |
| Keroplatidae | Arachnocampa flava | 16,923 | 11,202 | 1482 | 2103 | 1841 | NC016204 |
| Outgroup (Tipulomorpha) | |||||||
| Tipulidae | Symplecta hybrida | 15,811 | 11,167 | 1456 | 2109 | 897 | NC030519 |
| Tipula cockerelliana | 14,453 | 11,154 | 1378 | 1837 | N/A | NC030520 | |
Disclaimer/Publisher’s Note: The statements, opinions and data contained in all publications are solely those of the individual author(s) and contributor(s) and not of MDPI and/or the editor(s). MDPI and/or the editor(s) disclaim responsibility for any injury to people or property resulting from any ideas, methods, instructions or products referred to in the content. |
© 2023 by the authors. Licensee MDPI, Basel, Switzerland. This article is an open access article distributed under the terms and conditions of the Creative Commons Attribution (CC BY) license (https://creativecommons.org/licenses/by/4.0/).
Share and Cite
MDPI and ACS Style
Xiao, M.-L.; Yuan, H.; Li, T.-J.; Chen, B. Two New Mitogenomes of Bibionidae and Their Comparison within the Infraorder Bibionomorpha (Diptera). Genes 2023, 14, 1485. https://doi.org/10.3390/genes14071485
AMA Style
Xiao M-L, Yuan H, Li T-J, Chen B. Two New Mitogenomes of Bibionidae and Their Comparison within the Infraorder Bibionomorpha (Diptera). Genes. 2023; 14(7):1485. https://doi.org/10.3390/genes14071485
Chicago/Turabian StyleXiao, Mei-Ling, Huan Yuan, Ting-Jing Li, and Bin Chen. 2023. "Two New Mitogenomes of Bibionidae and Their Comparison within the Infraorder Bibionomorpha (Diptera)" Genes 14, no. 7: 1485. https://doi.org/10.3390/genes14071485
Note that from the first issue of 2016, this journal uses article numbers instead of page numbers. See further details here.