Article

Genome-Wide Identification of Trehalose-6-phosphate Synthase (TPS) Gene Family Reveals the Potential Role in Carbohydrate Metabolism in Peach

1
College of Horticulture Science and Engineering, Shandong Agricultural University, Tai’an 271018, China
2
College of Agriculture and Forestry Sciences, Linyi University, Linyi 276000, China
*
Authors to whom correspondence should be addressed.
Genes 2024, 15(1), 39; https://doi.org/10.3390/genes15010039
Submission received: 6 December 2023 / Revised: 22 December 2023 / Accepted: 25 December 2023 / Published: 26 December 2023
(This article belongs to the Section Plant Genetics and Genomics)

Abstract

:
Trehalose-6-phosphate synthase (TPS) is essential for plant growth and development, linking trehalose-6-phosphate (T6P) to carbon metabolism. However, little is known about the TPS gene family in peaches and their potential roles in regulating carbohydrates in peach fruit. In this study, nine TPS genes were identified in the peach genome and named according to the homologous genes in Arabidopsis. Phylogenetic analysis showed that three subfamilies were identified, including TPSI, TPSII-1, and TPSII-2, which were also consistent with gene structure analysis. Considerable cis-elements were enriched in the promoters, including plant hormone-related elements. Tissue-specific analysis showed that these TPS genes were mainly expressed in leaves, stems, and fruit, showing different expression patterns for each gene. In addition, during fruit development, the content of trehalose-6-phosphate (T6P) was positively correlated with the expression of PpTPS7a and negatively with sucrose non-fermenting-1-related kinase 1 (SnRK1) activity. Transient overexpression and silencing of PpTPS7a in peach fruit validated its function in regulating T6P content and SnRK1 activity.
Keywords:
peach; TPS; T6P; gene family

1. Introduction

Trehalose (α-d-glucopyranosyl-1,1-α-d-glucopyranoside) is a non-reducing disaccharide in which two glucose units are linked by α, α-1,1-glycosidic bonds [1]. Most species, including bacteria, yeast, and plants, can use it as an energy and carbon source. Trehalose also contributes significantly to the processes of signal transduction, membrane protection, and osmotic pressure maintenance [2,3]. Trehalose functions as a signaling molecule in directing metabolic pathways, regulating plant development, and protecting proteins [4]. Under adverse environmental conditions, such as low temperatures, drought, and salt stress, trehalose is synthesized massively [5].
In the metabolism of trehalose, T6P is synthesized by TPS using glucose-6-phosphate (G6P) and UDP-glucose (UDPG) as substrates, while trehalose is synthesized by trehalose-6-phosphate phosphatase (TPP) using T6P as substrates. As a substrate, trehalose is used to synthesize glucose by trehalose hydrolase (TRE) [6,7]. TPS genes were found in many plant species [8]. For example, there were 11 TPS genes (AtTPS1AtTPS11) in Arabidopsis, 11 members in rice (OsTPS1OsTPS11), and 12 members in Populus (PtTPS1PtTPS12) [9,10,11]. However, TPS genes in peaches have not been systematically investigated.
TPS genes have been found to regulate carbohydrate metabolism, which further affects plant growth [12]. TPS genes are further divided into two subfamilies, class I and class II. In Arabidopsis, TPS genes in class I (except AtTPS3) have TPS enzyme activity, while they are absent in class II [10,13]. TPS genes in class I could improve plant tolerance to stress. For example, overexpression of the OsTPS1 gene increased tolerance to drought, high salinity, and cold stress in rice [14]. AtTPS1 is crucial for the metabolic regulation of Arabidopsis thaliana [15]. Recently, the functions of TPS genes in class II have been discovered. ATTPS5 functioned as a negative regulator of ABA signaling and regulated alginate content [16], while ATTPS6 was involved in the regulation of plant architecture [17]. Overexpression of OsTPS8 in rice improved plant salt tolerance [18]. Then Overexpression of the wheat trehalose 6-phosphate synthase 11 gene enhances cold tolerance in A. thaliana [19]. To better understand the function of TPS genes, it is crucial to further identify and characterize the TPS gene family in plants.
T6P plays a crucial role in plant growth and development and participates in trehalose biosynthesis [20]. T6P had been identified as inhibiting the activity of sucrose non-fermenting-1-related kinase 1 (SnRK1) [21], while changes in SnRK1 activity could also have an influence on the content of sucrose and T6P [22]. In our earlier studies, SnRK1 boosted sorbitol metabolism by activating sorbitol dehydrogenase (SDH), and it also increased sucrose buildup in peach fruit. SnRK1 is involved in sugar metabolism and has the potential to be used for improving fruit quality [23]. These studies showed a regulatory network among T6P, sugar, and SnRK1.
Peach (Prunus persica L.) is an economically important fruit crop in the world and is always considered the model plant in the Rosaceae family due to its small genome size [24]. During the past several years, a number of studies have reported the analyses of large-scale genome resequencing data in peach, with an attempt to understand the origin, evolution, and domestication of peach, as well as to identify genome regions highly associated with important traits [25]. However, little is known about the TPS gene family in peaches and their potential roles in regulating carbohydrates in peach fruit. In this study, we carried out genome-wide identification of TPS genes and analyzed their function in peach fruit. The identified TPS genes and their potential function in regulating SnRK1 provide insights into carbohydrate metabolism in peach fruit.

2. Materials and Methods

2.1. Identification of PpTPS Gene Family in Peach

The whole genome sequence of the peach cultivar ‘Lovell’ was downloadable at (P. persica genome assembly Prunus_persica_NCBIv2—NCBI—NLM (nih.gov)) (accessed on 11 August 2023) [26]. The conserved domain (PF00982) of the TPS protein was obtained from Pfam (xfam.org) (accessed on 15 August 2023). HMMER (biosequence analysis using profile hidden Markov models) was used to construct the HMM model to obtain the candidate TPS proteins in peach. The identified TPS genes were further deposited into NCBI to check the TPS domain. The chromosome length was extracted from the gene annotation file. As well, genomic locations of TPS gene family members on the peach genome were extracted, and gene distribution was plotted using ‘Gene Location Visualize (Advanced)’ in TBtools ((Toolbox for Biologists) v1.120) [27]. The physical and chemical properties of PpTPS proteins were further analyzed using TBtools [28].

2.2. Collinearity Analysis and System Evolution Analysis

The amino acid sequences of TPS genes in tomato (Solanum lycopersicum), apple (Malus domestica), and Arabidopsis (A. thaliana TAIR10) were downloaded from the NCBI (www.ncbi.nlm.nih.gov) website (accessed on 17 August 2023). Multiple sequence alignments were carried out using clustalW (genome.jp) (accessed on 17 August 2023) [29]. A neighbor-joining tree was constructed with the default parameter using MEGA (MEGA11) software [30].

2.3. Analysis of Gene Structure and Conserved Domain

MEME5.5.3 (meme-suite.org) (accessed on 18 August 2023) was used to predict and assess the conserved protein motifs of the PpTPS protein sequence. To produce an XML file, the input motif parameter is set to 15, while the other parameters are left at their default values [31]. To create the structural diagram of the conserved protein motif in TBtools’ gene structural view (Advanced). The peach genome GFF3 format file was entered in order to determine the CDS and UTR structure of the displayed gene.

2.4. Promoter Element Analysis

From the JGI website (Phytozome (doe.gov)) (accessed on 18 August 2023), the promoter sequences of PpTPS genes were selected and downloaded as 1.5 kb upstream 5′UTR. To predict the promoter elements, all promoter sequences were submitted to the PlantCARE database. The distribution and heat map of the promoter elements were plotted using TBtools [32].

2.5. Plant Material Acquisition, RNA Extraction and qRT-PCR

The peach variety “Xiahui 5” is planted in the experimental base of Shandong Agricultural University, with fruit round, creamy yellow pericarp, more than 80% of the fruit surface with red, white meat, delicate flesh, ripe in mid-July, and a fruiting time of about 100 days [33]. Samples of leaves, stems, flowers, and fruits were collected. Total RNA was extracted from the samples using an RNA extraction kit (Tiangen, Beijing, China), and the RNA purity was determined using an ultra-micro UV analyzer to confirm that the OD260/OD230 ratio was between 1.8 and 2.1. First-strand cDNA was synthesized using the PrimeScript first-strand cDNA synthesis kit (Takara, Dalian, China). Real-time quantitative polymerase chain reaction (qRT-PCR) was performed on the ABI7500 system using the SYBR premix ExTaq (Takara, Dalian, China) with the following procedure: 95 °C for 5 min, followed by 45 cycles at 95 °C for 10 s, 58 °C for 10 s, and 72 °C for 20 s. Reaction volume is 25 μL (including UItraSYBR Mixture (CWBIO, Taizhou, China) 12.5 μL, primer-F 0.5 μL, primer-R 0.5 μL, ddH2O 10.5 μL, cDNA 1 μL), with three biological replicates per sample. The relative expression level was calculated by the 2−ΔΔCT method [34]. Primers for qRT-PCR are listed in Table S1.

2.6. Determination of T6P Content and SnRK1 Activity

The T6P content and SnRK1 enzyme activity were determined using ELISA kits. The peach fruits of the experimental and control groups were ground into powder in liquid nitrogen. Then, PBS lysate at a 1:9 ratio was added, and the samples were fully lysed by vortex oscillation. Centrifuged at 10,000 rpm for 20 min to collect the supernatant. Then, the supernatant obtained for each sample was divided into three for T6P and enzyme activity detection. Firstly, Set standard wells and test sample wells on an enzyme-labeled plate. Then, dilution of samples with sample diluent (sample final dilution is 5-fold). Adding HRP reagent, incubating at 37 °C, and adding chromogen solution, evade the light preservation for 15 min at 37 °C. Data were obtained by reading with a microplate reader (CMax Plus, Molecular Devices, Shanghai, China). The concentration and absorbance readings of the standards are used to create a standard curve in Excel, and the readings of the other samples were carried over into the standard curve equation to calculate the final result. The whole experiment was repeated three times.

2.7. Transient Overexpression and Silencing in Peach Fruit

The CDS sequences were obtained from the NCBI website and used for full-length primer design. Then, the PpTPS7a sequence was amplified from a cDNA library. BamHI and EcoRI were selected as restriction sites for the PRI101-AN vector. The amplified CDS sequences were further cloned into the pRI101-AN vector. EcoRI and BamHI were selected as restriction sites for the TRV2 vector. Finding the fragment with the best silencing effect on the PpTPS7a gene can be achieved by (Welcome to pssRNAit: Designing Effective and Specific Plant RNAi siRNAs with Genome-wide Off-target Gene Assessment (zhaolab.org)) (accessed on 23 August 2023) [35]. The specific silencing primers of PpTPS7a were designed and cloned into the TRV2 vector, and TRV1 was used as an auxiliary. Recombinant plasmid was added to the Agrobacterium competent cells GV3101 and placed on ice for five minutes, in liquid nitrogen for five minutes, in a 37 °C metal bath for five minutes, and on ice for five minutes to transform into colonies. In transient overexpression experiments, pRI101-AN is an empty vector as the control, while in transient silencing, TRV2 is the empty vector + TRV1 is the control. For the transient overexpression assay, peach fruits were cut into 1–2 cm-thick pieces, immersed in resuspended MMA buffer, and the liquid was injected into the fruit with an evacuation device. The infested fruit was then placed in MS medium in the dark for 24 h before being put under normal conditions. Finally, the samples were collected and frozen at −80 °C for downstream analysis.

3. Results

3.1. Identification of PpTPS Gene Family in Peach

To identify TPS genes, TPS and TPP domains were both considered using HMMER (v3.1). According to the TPS genes in Arabidopsis and tomato [36], nine TPS genes were identified in the peach genome. There were two TPS classes in Arabidopsis, including TPS1–4 in class I and TPS5–11 in class II [37]. Following the gene name in Arabidopsis, we named these nine TPS genes as PpTPS1a, PpTPS1b, PpTPS5, PpTPS6, PpTPS7a, PpTPS7b, PpTPS9a, PpTPS9b, and PpTPS10. PpTPS genes were irregularly distributed across four chromosomes. Among them, PpTPS6, PpTPS9b, and PpTPS10 genes were distributed on Chr.1, PpTPS7a was distributed on Chr.3, PpTPS1a, PpTPS1b, and PpTPS7b were distributed on Chr.4, and PpTPS1b and PpTPS7b were found to be close to each other. PpTPS5 and PpTPS9a are distributed on Chr.5 (Figure 1).
We investigated the physicochemical properties of these PpTPS proteins. As shown in Table 1, the predicted proteins of PpTPS genes include 840 (PpTPS7a) to 926 (PpTPS1a) amino acids, with an average of 871, and the molecular weight ranged from 95,686.72 Da (PpTPS7a) to 104,186.14 Da (PpTPS1b), with an average of 98,590.65 Da. The isoelectric point (pI) of a protein is an essential physiological measure that is mostly determined by the ratio of acidic to basic amino acids. The TPS protein has a theoretical isoelectric point between 5.4182 and 9.2656, and its isoelectric point is less than 7, indicating that it is an acidic protein. The hydrophilic coefficient of the protein is represented by the GRAVY value (Table 1). It is clear that PpTPS9b has the highest hydrophilicity, suggesting it is an acidic hydrophilic protein.

3.2. Gene Collinearity Analysis of PpTPS Genes

In order to investigate the evolutionary mechanism of the PpTPS gene, collinearity analysis was carried out, and three gene pairs, PpTPS1a/PpTPS1b, PpTPS7a/PpTPS7b, and PpTPS9a/PpTPS10, were identified (Figure 2a). This result indicated that the number of PpTPS gene families was mainly driven by duplication. In addition, we also constructed a collinearity map using the PpTPS genes in peach and Arabidopsis. A total of 11 pairs of genes were identified (Figure 2b), suggesting the high homology between these two species. The findings demonstrated that the TPS genes had high conservation during evolution.

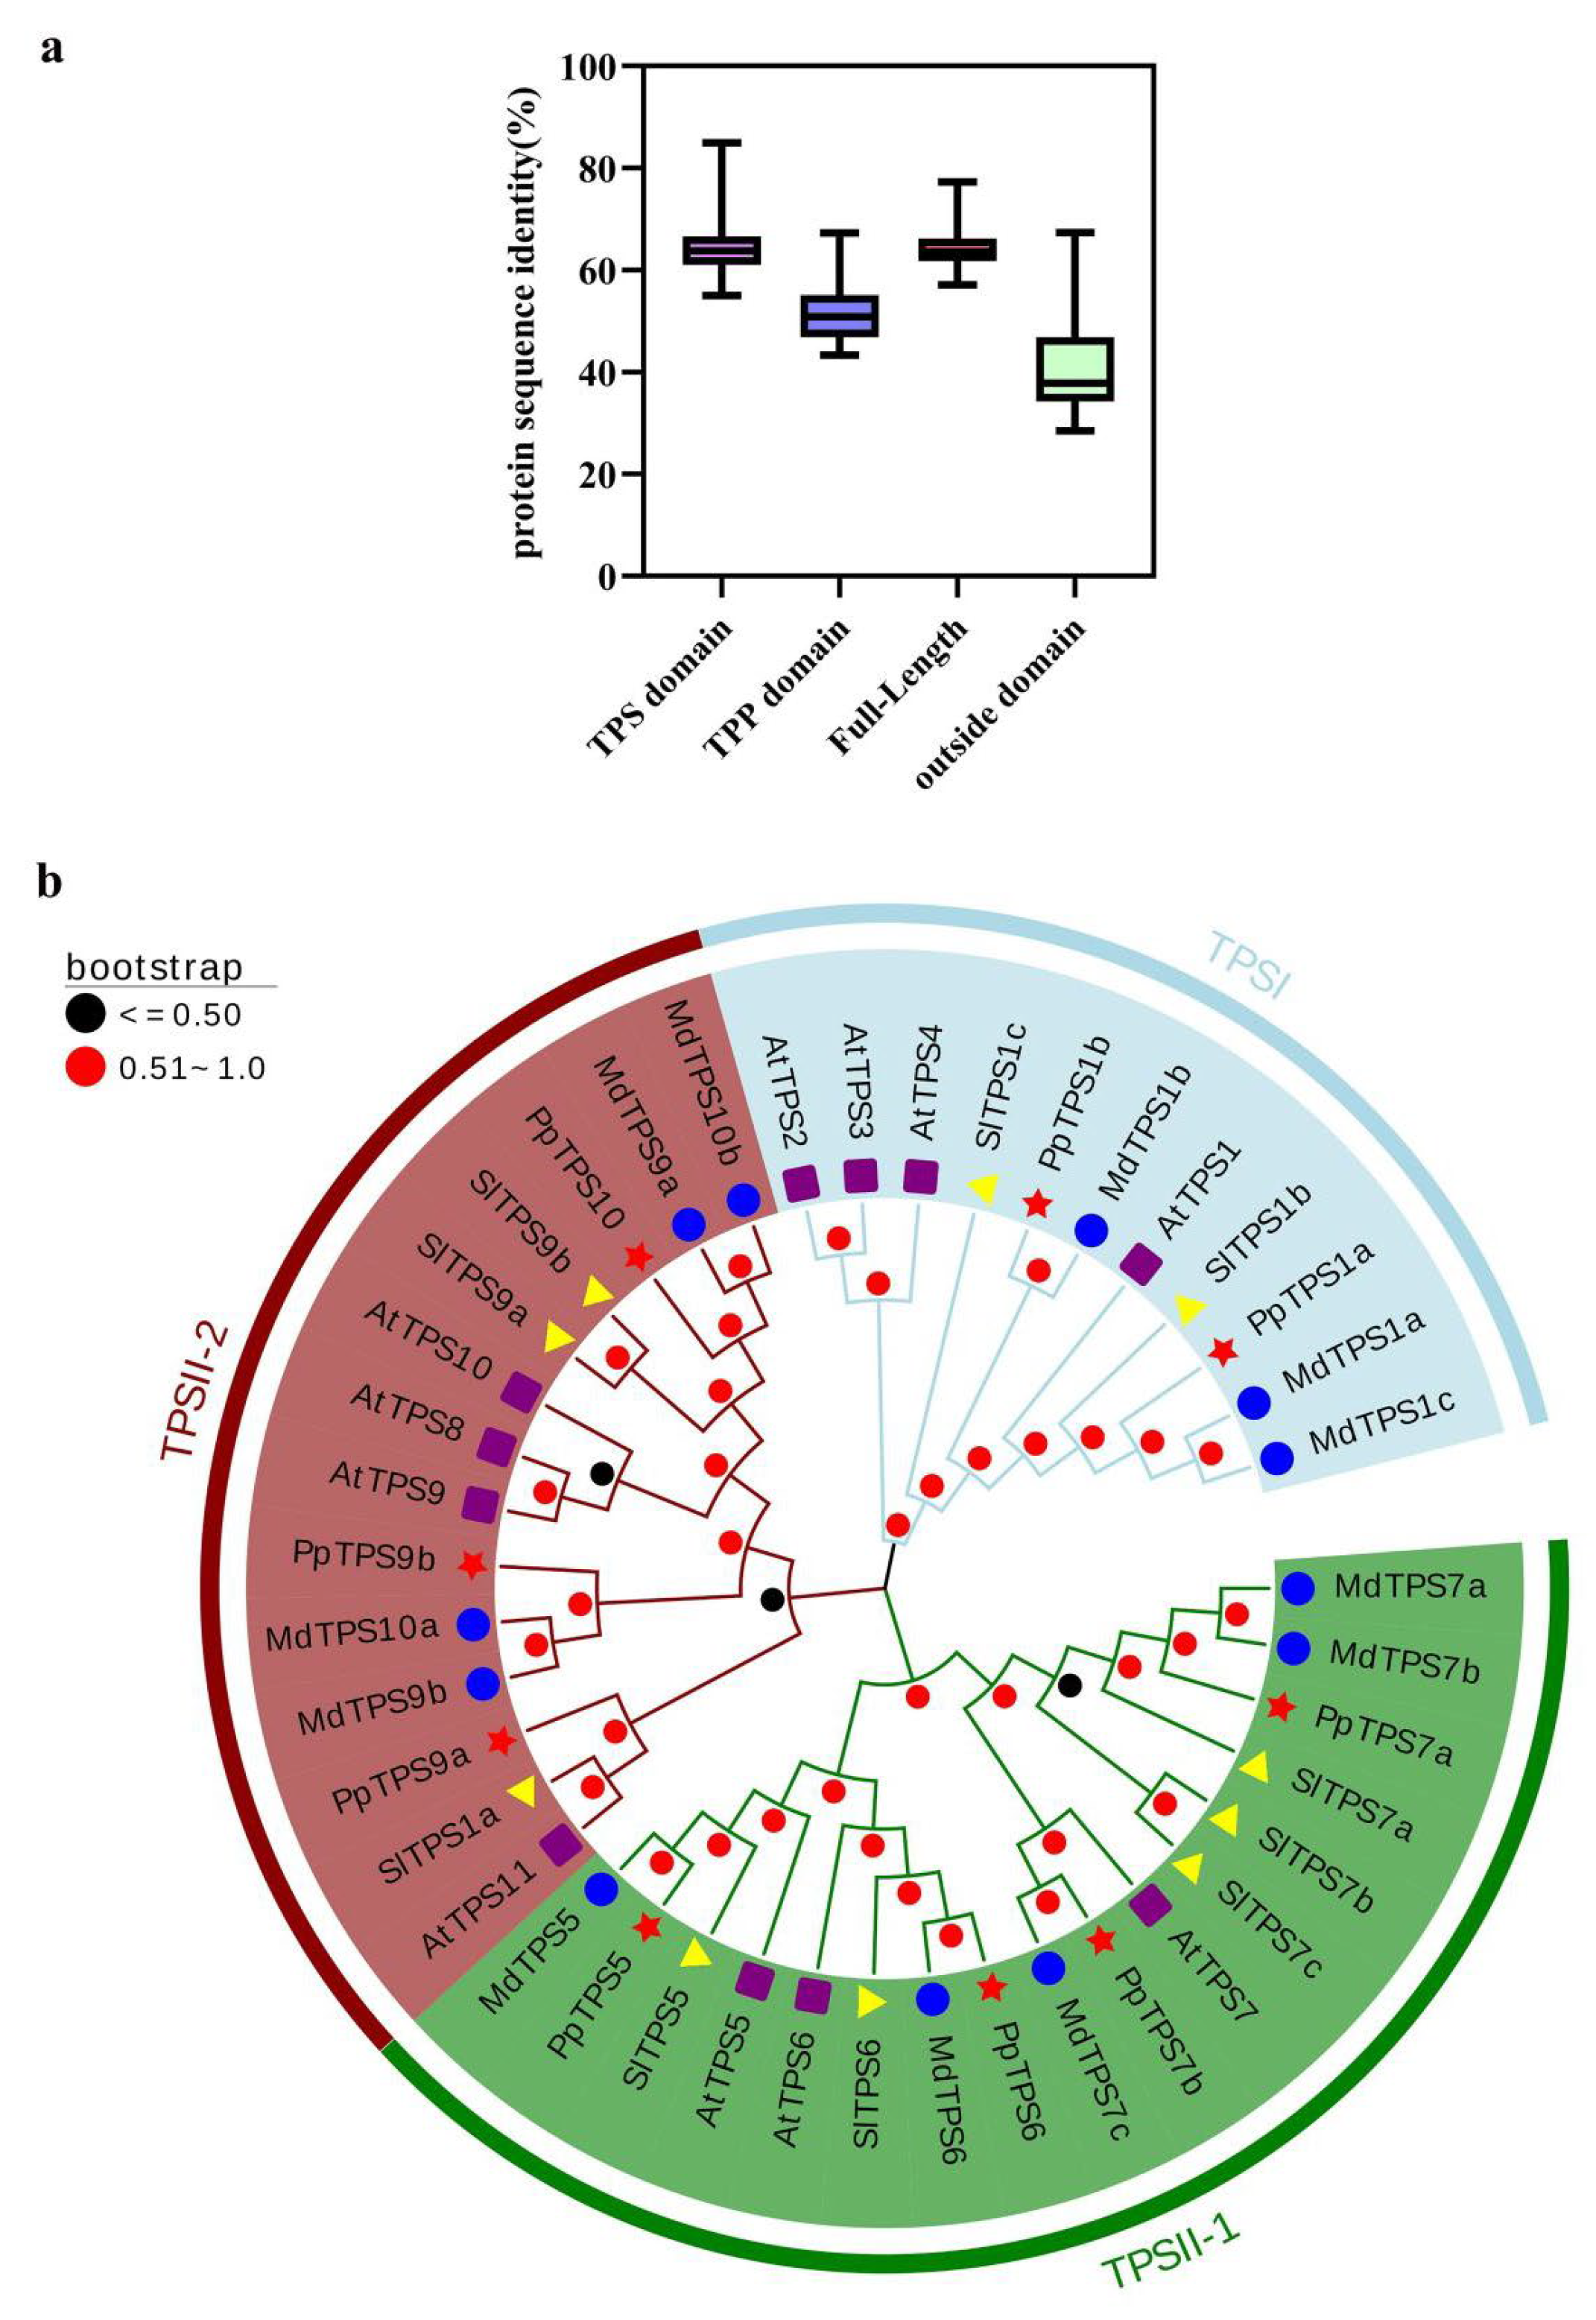
3.3. Multiple Sequence Alignment and Phylogenetic Analysis

To evaluate the characteristics of the PpTPS gene family, we carried out multiple sequence alignments of amino acid sequences using Clustalw (2.0.11) tools (Figures S1 and S2). Further PpTPS gene sequences were put together to be compared (Figure S3). As a result, the catalytic core of PpTPS was substantially conserved, indicating its potential function in T6P synthesis. The homology of the nine PpTPS ranged from 57.14 to 77.26%, showing the highest homology between PpTPS1a and PpTPS1b and the lowest homology between PpTPS5 and PpTPS7a. The average amino acid homology of the nine PpTPS was roughly 52%. Approximately 65% of the amino acid sequences in the TPS domain and 64% in the TPP domain showed homology. In comparison, only 40% of amino acid sequences were identical outside these two domains (Figure 3a).
Phylogenetic analysis was performed using TPS genes in tomato, apple, Arabidopsis, and peach (Figure 3b). The neighbor-joining (NJ) tree showed that there are two main subfamilies of TPS genes, TPSI and TPSII. In subfamily TPSII, two significant branches were observed and named (TPSII-1, TPSII-2) according to the bootstrap values.

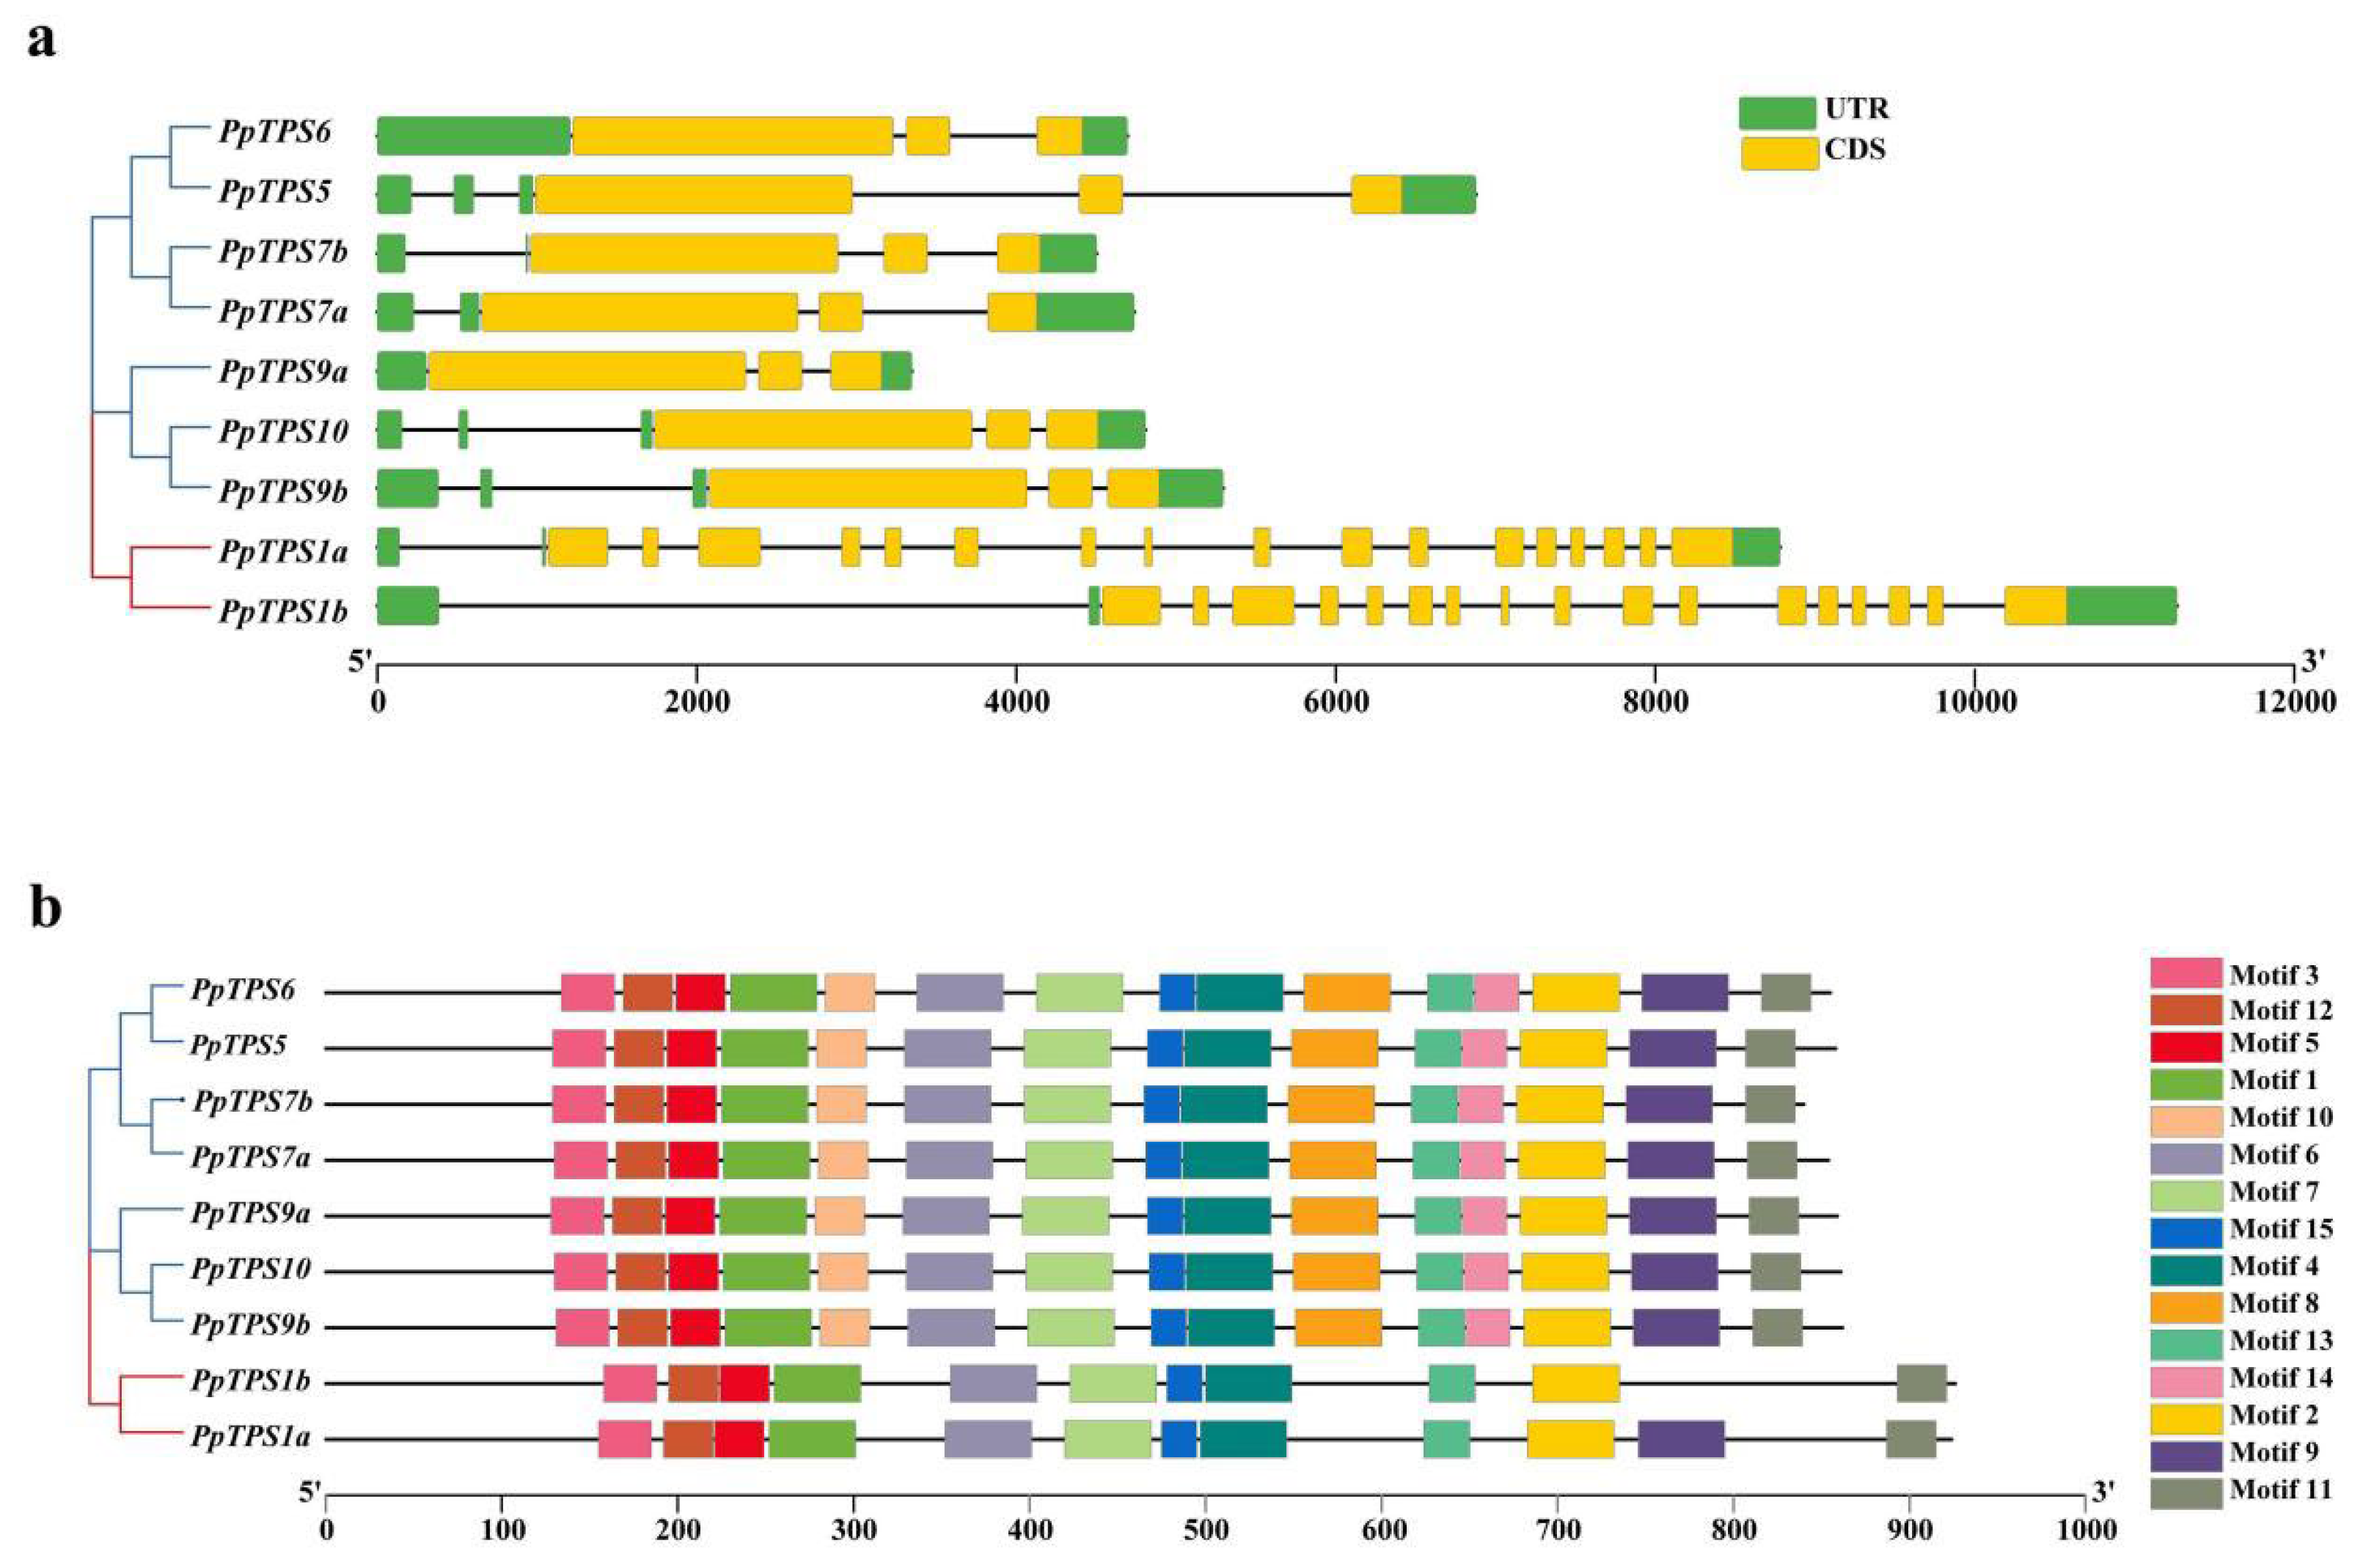
3.4. Gene Structure and Protein Domain of PpTPS

The PpTPS gene structure was analyzed and viewed using TBtools software ((Toolbox for Biologists) v1.120) [27] (Figure 4a). The results showed that the number of introns and exons of PpTPS1a and PpTPS1b was higher than that of the other PpTPS genes. In addition, the CDS lengths of the nine PpTPS genes were highly similar (2523–2781 bp), although their total gene lengths varied greatly (3288–13,161 bp). Fifteen conserved motifs were identified in PpTPS, and their distribution in each subfamily was similar (Figure 4b), indicating similar functions as well. Motifs 1, 3, 4, 5, 6, 10, 12, and 15 together constitute the TPS domain, and Motifs 11, 13, and 14 constitute the TPP domain. All PpTPS genes have TPS and TPP domains. The analysis of conserved motifs and gene structure further supported the phylogenetic analysis of the PpTPS gene family.

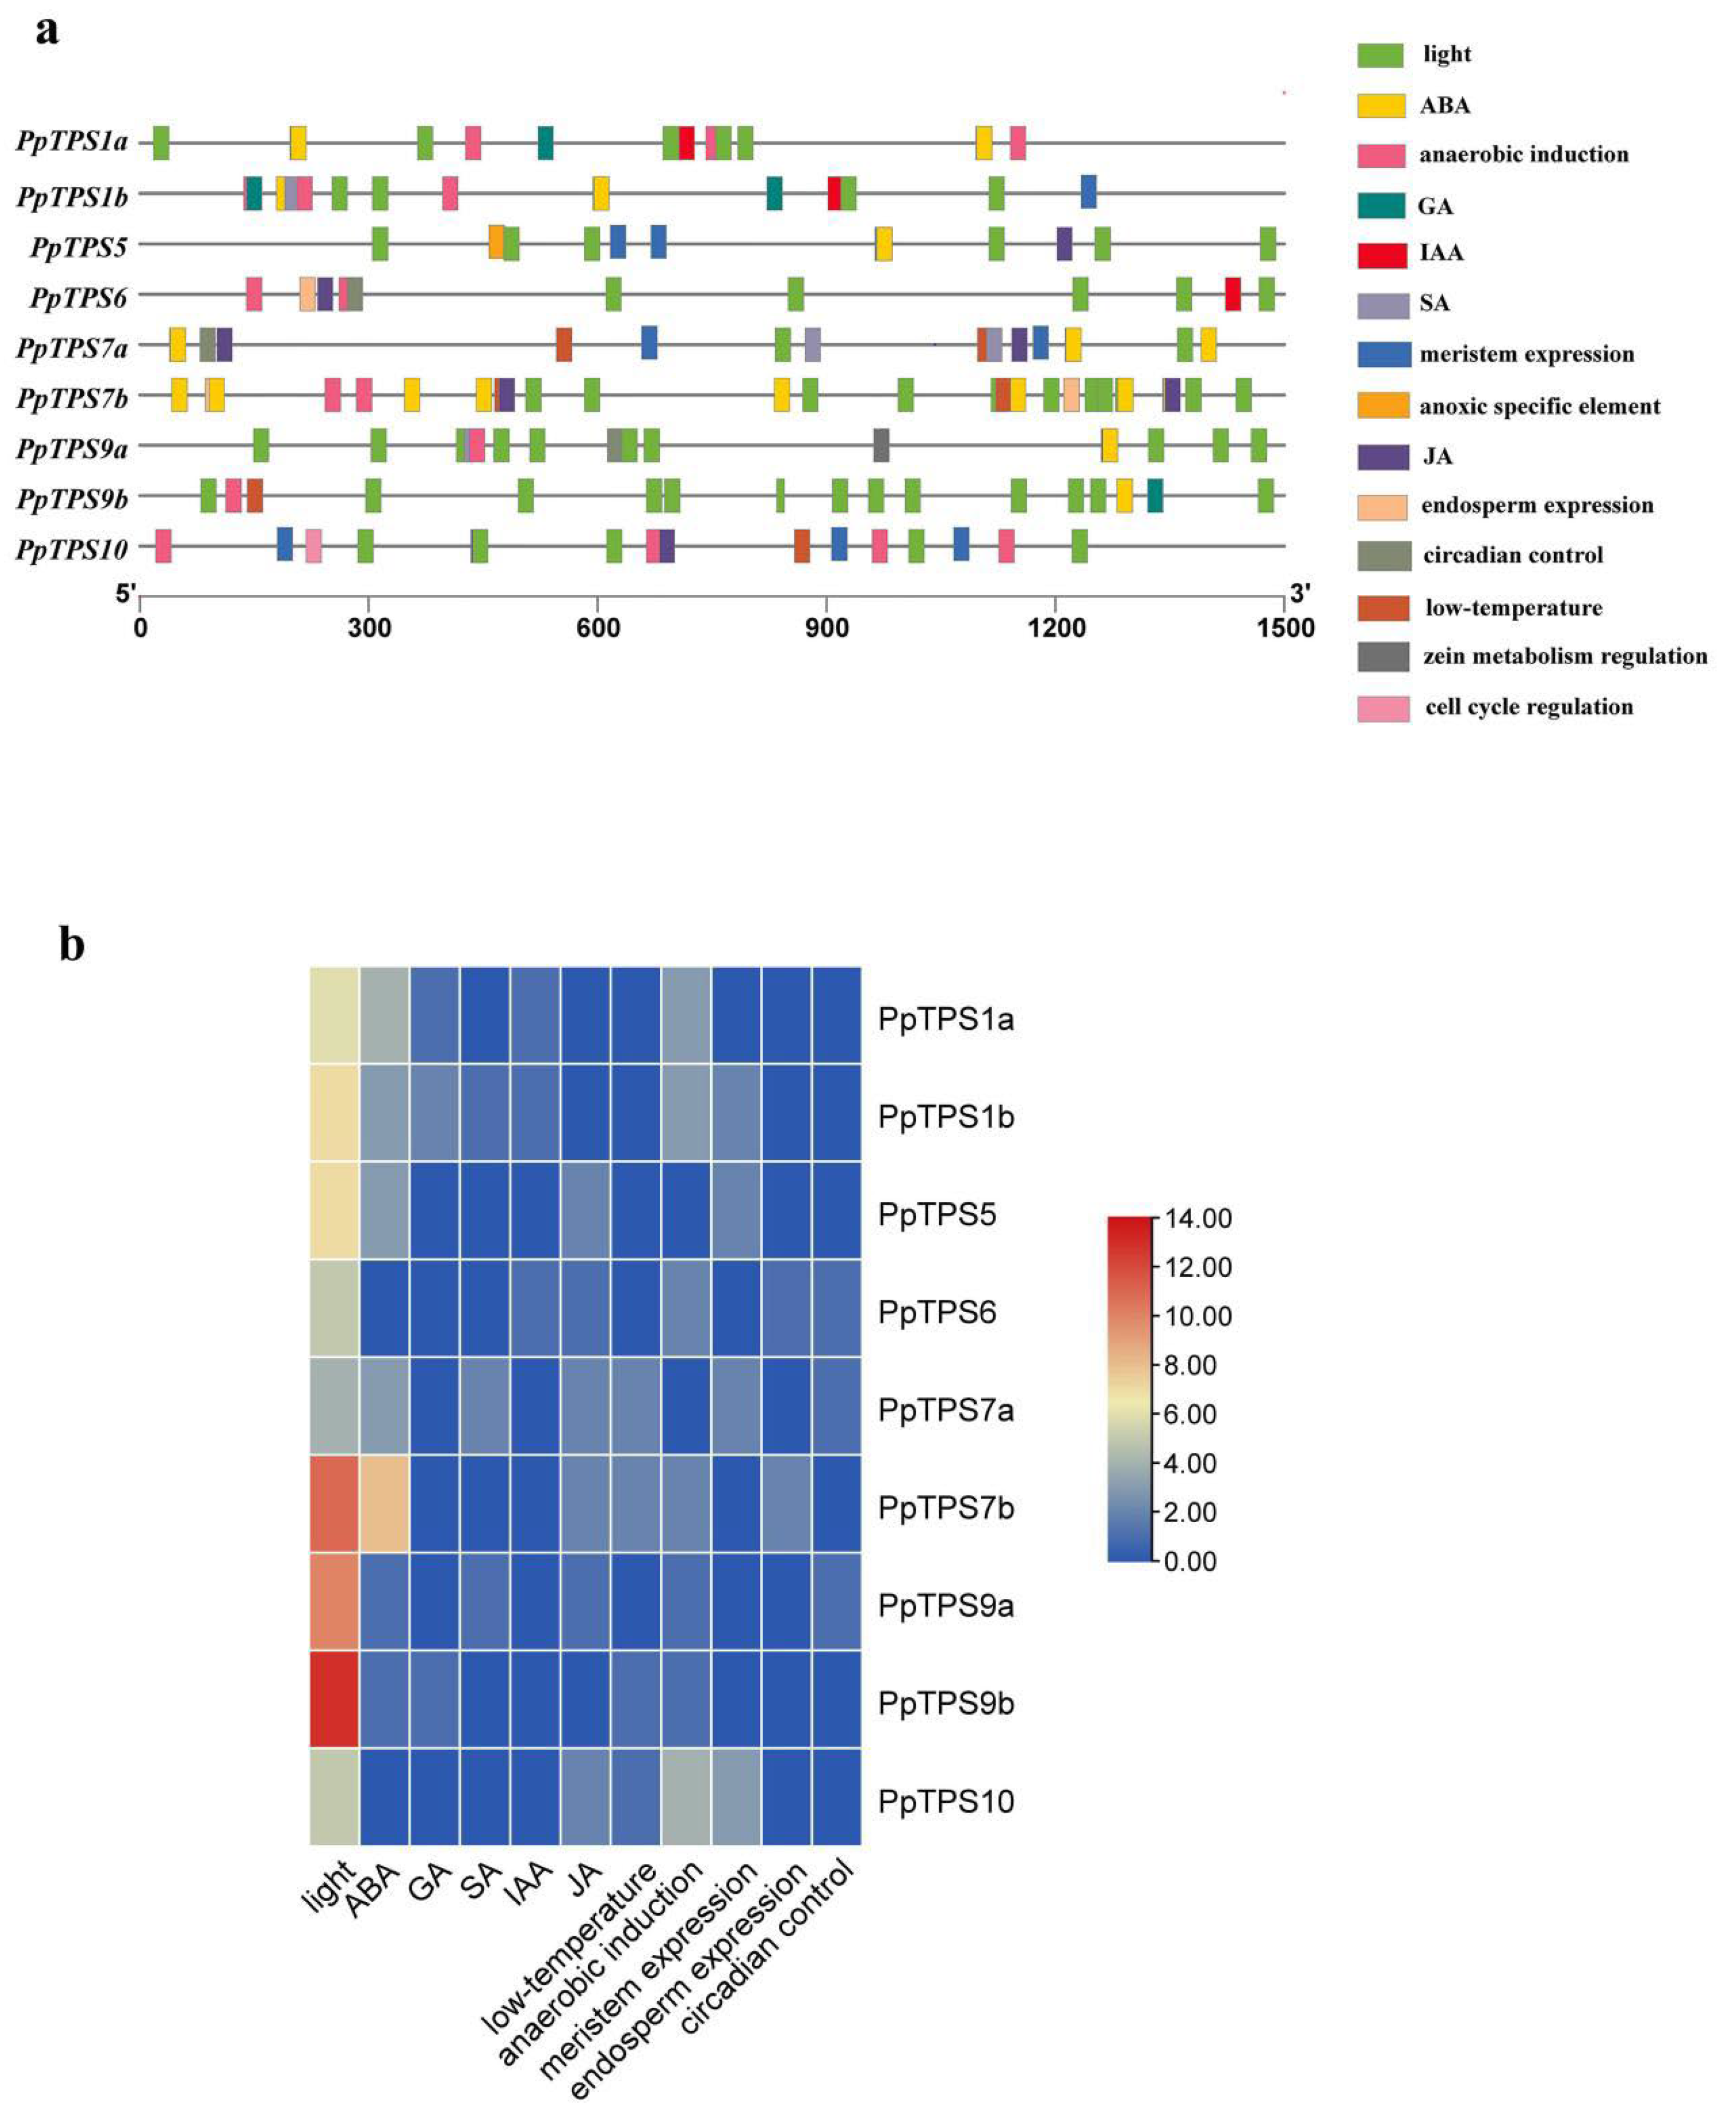
3.5. Promoter Element Analysis

The promoter sequences of nine PpTPS genes (a 1.5-kb sequence upstream of the 5′UTR) were submitted to the PlantCARE database for promoter cis-element analysis, and a total of 21 cis-elements were identified. In addition to the basic promoter elements, such as TATA-box and CAAT-box, the remaining elements were related to plant hormones, plant growth and development, and abiotic stress (Figure 5a). Many plant hormone-related cis-elements were found in the promoter of PpTPS7b, while defense and stress-related cis-elements were found in PpTPS1a and PpTPS9a, and cis-elements that respond to low temperatures were found in PpTPS7a, PpTPS7b, PpTPS9b, and PpTPS10 (Figure 5b). The presence of hormone response elements (ABA, GA, SA, and IAA) indicated that PpTPS genes might be involved in plant hormone signaling pathways, which was consistent with a previous study [16]. For example, OsTPS8 controls yield-related traits and confers salt stress tolerance by enhancing suberin deposition. TPS5 negatively regulates ABA signaling by influencing ABA, ROS level, and NR activity during seed germination and stomatal closure in Arabidopsis [18]. As well, the ABRE element in the TPS gene promoter can regulate the response of genes to ABA and salt stress [38,39].

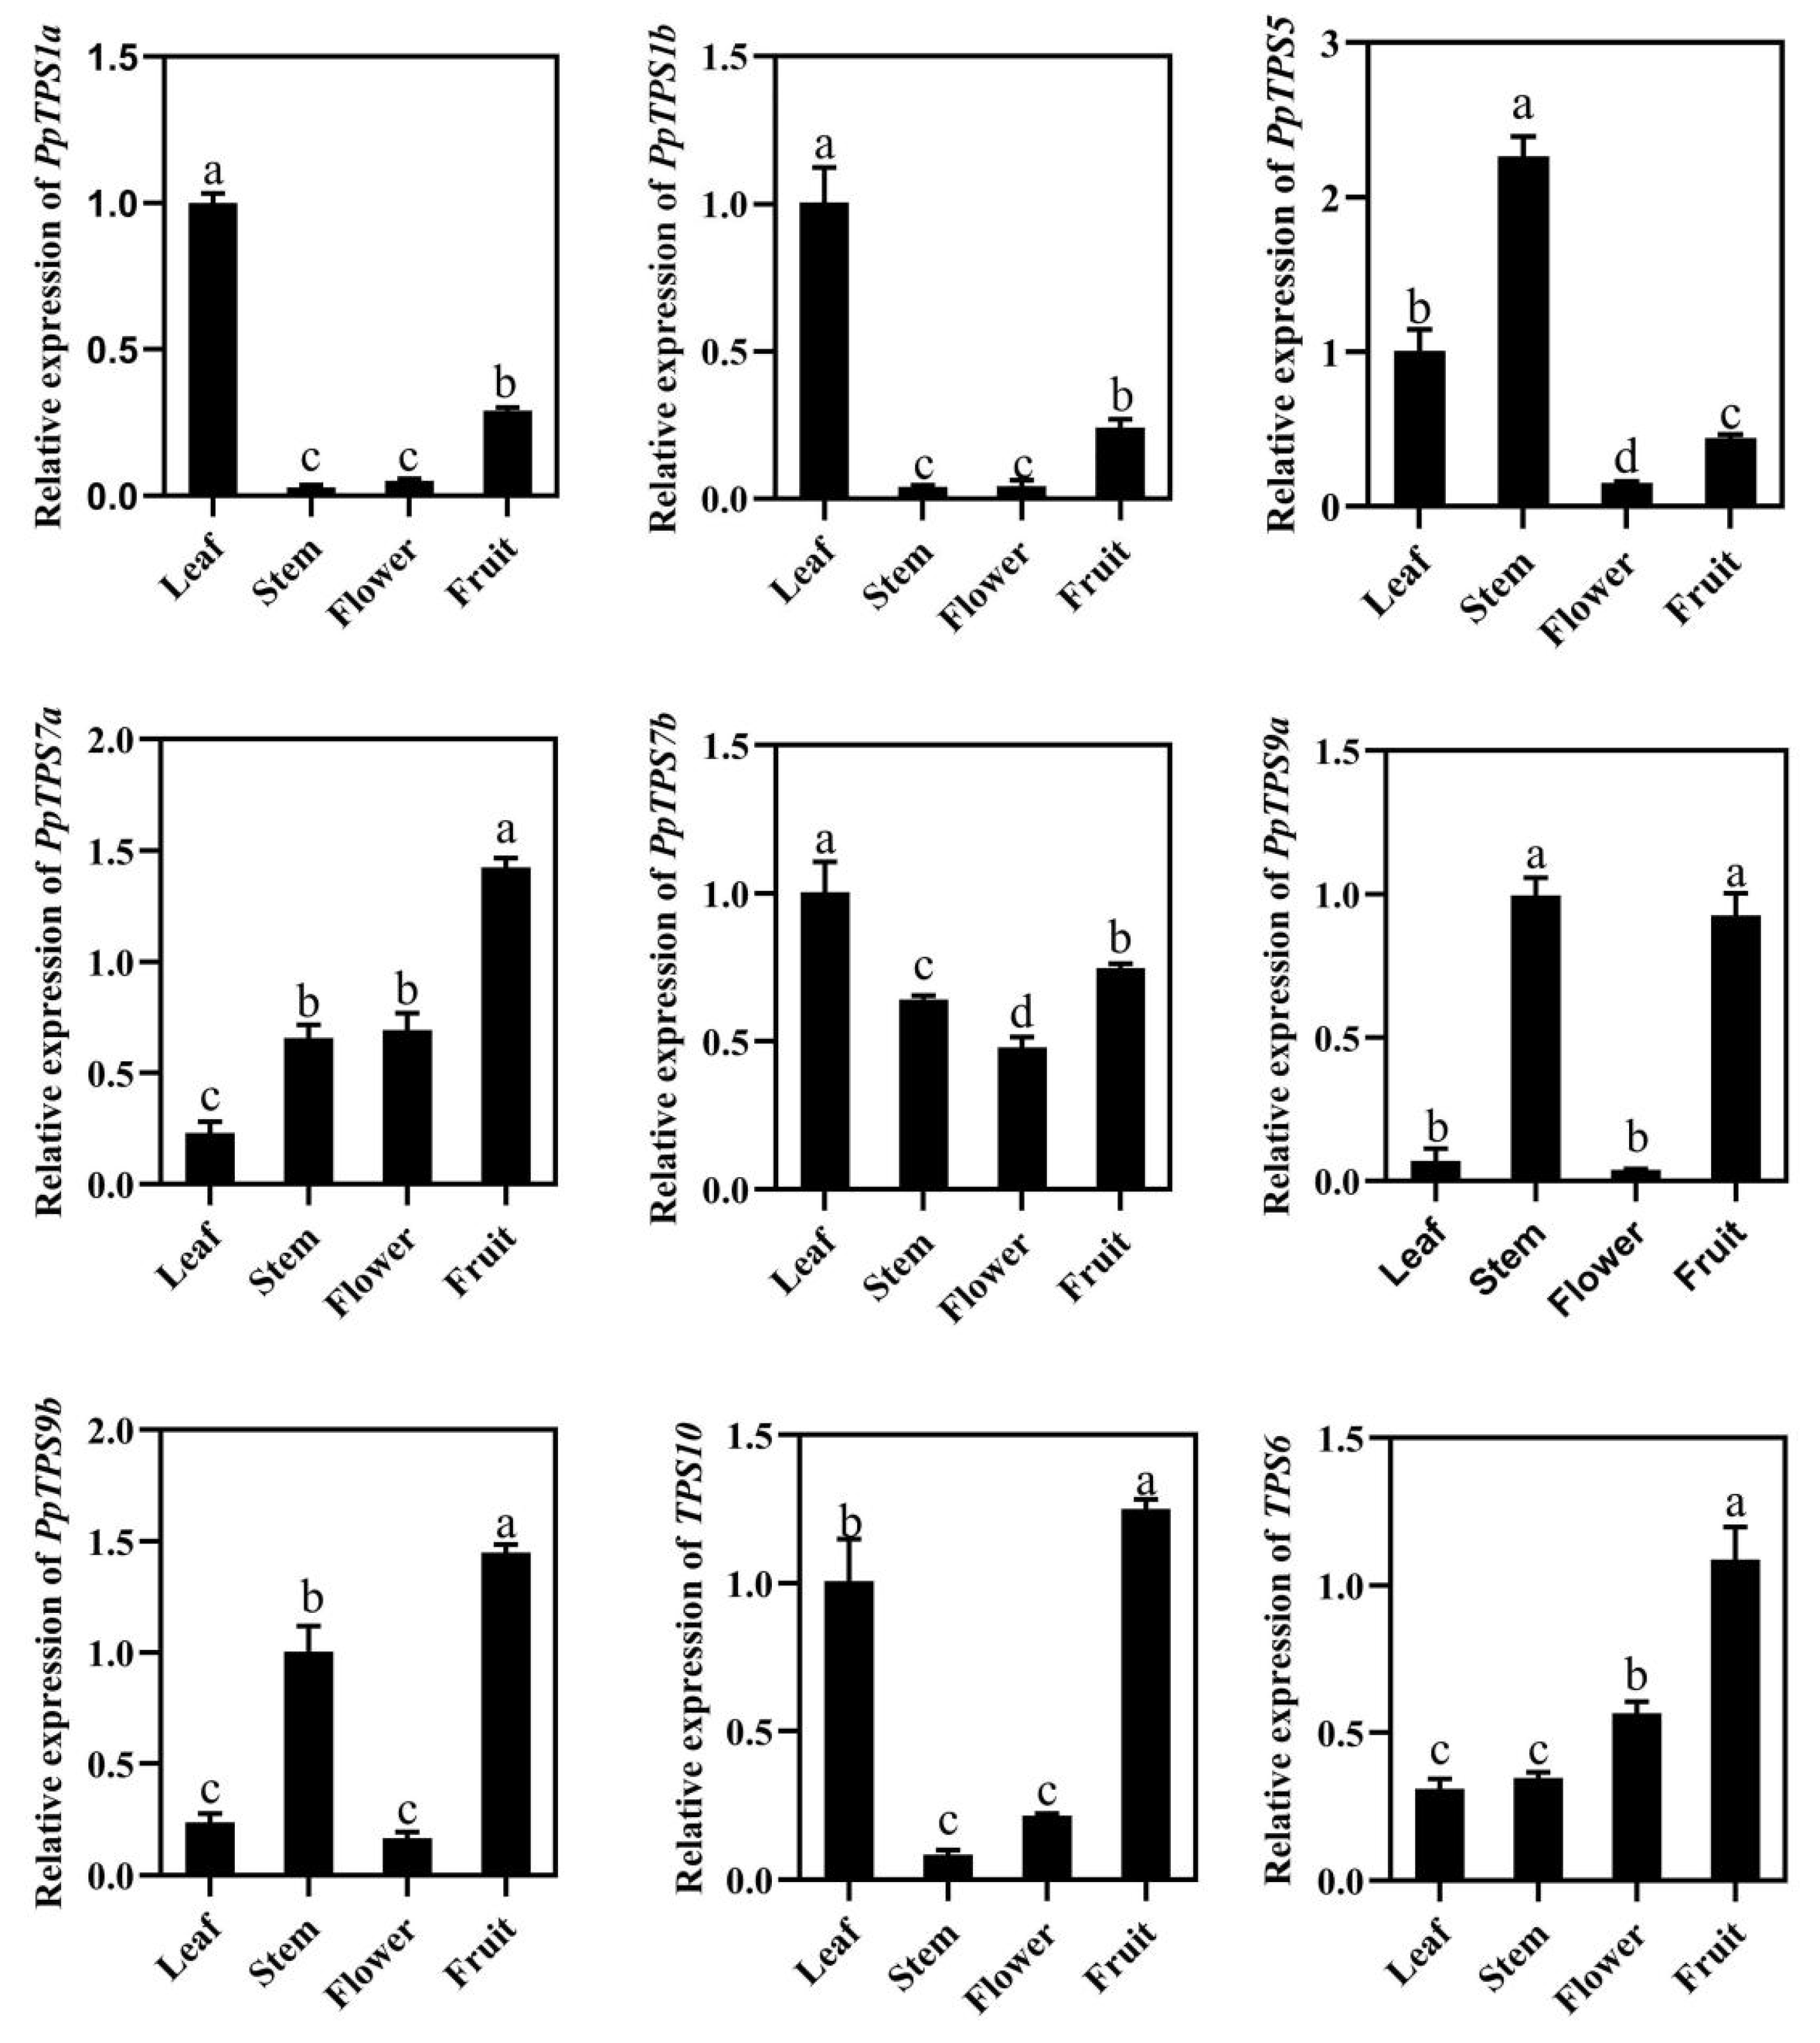
3.6. Tissue Specific Expression Pattern of PpTPS Genes in Peach

Tissue-specific expression patterns of PpTPS were analyzed. In general, the PpTPS gene is preferentially expressed in specific tissues. In subfamily TPSI, PpTPS1a and PpTPS1b were specifically expressed in leaves, showing similar expression patterns. In subfamily TPSII, PpTPS5 was highly expressed in stems, PpTPS6 and PpTPS7a were highly expressed in fruits, PpTPS7b was non-specific, PpTPS9a and PpTPS9b were highly expressed in stems and fruits, and PpTPS10 was highly expressed in leaves and fruits (Figure 6). These results indicated that PpTPS genes might participate in plant and fruit development in different manners.

3.7. Expression Profile of PpTPS during Peach Fruit Development

To explore the expression pattern of PpTPS genes during peach fruit development, their expressions were further analyzed. As shown in Figure 7a, the expression patterns of genes in subfamily TPSI were consistent and gradually decreased during fruit development. However, the gene expression patterns were different in subfamily TPSII. As we know, T6P was synthesized by TPS using glucose-6-phosphate (G6P) and UDP-glucose (UDPG), which further participate in carbohydrate metabolism via SnRK1. To understand the potential roles of PpTPS in fruit development, the T6P contents were determined in fruit at different developmental stages. The results showed that the T6P contents increased during fruit development while decreasing at 75 DAFB (Figure 7c). To identify the key TPS gene responsible for T6P synthesis, a correlation analysis between T6P and TPS gene expression levels was carried out, showing that PpTPS7a has the highest correlation coefficient (Figure S4 and Figure 7e). Due to the correlation between T6P and SnRK1 activity, we measured the SnRK1 enzyme activity at different stages of development stage (Figure 7b) and found that it was completely opposite to the change in T6P content (Figure 7d).

3.8. Functional Validation of PpTPS7a in Peach Fruit

To validate the function of PpTPS7a, transient overexpression and gene silencing were performed in peach fruit. Overexpression of the PpTPS7a gene could significantly increase the T6P content (Figure 8a,b). while silencing PpTPS7a resulted in a decrease in T6P (Figure 8d,e). In addition, the enzyme activity of SnRK1 was also affected in transient expression fruit, showing decreased activity in overexpression fruit and increased silencing (Figure 8c,f). In conclusion, the PpTPS7a gene was mainly expressed in fruits and played a function in T6P synthesis during peach fruit development, which further regulated SnRK1 protein kinase activity.

4. Discussion

TPS is a central enzyme in trehalose metabolism, which is essential for plant growth and stress tolerance [40]. In this study, nine TPS genes were identified in the peach genome. TPS genes have been identified in many plant species, such as A. thaliana (AtTPS1AtTPS11) [10,37], Oryza sativa (OsTPS1OsTPS11) [11], and Populus trichocarpa (PtTPS1PtTPS12) [9]. Compared to Arabidopsis, rice, and populus, there were fewer TPS genes in peaches, which suggested that TPS genes were amplified to different extents in different species. Phylogenetic analyses showed that PpTPS genes were mainly grouped into two subfamilies (Figure 3b), in agreement with TPS genes in other plants [41]. Multiple sequence comparisons showed that the average amino acid sequence concordance within the domains of TPS and TPP was high, while the amino acid sequences outside the domains varied widely (Figure 3a). These non-conserved regions may contribute to the functional differences in TPS genes.
The PpTPS gene structure showed that the number of introns and exons in class I was much higher than that in class II. In agreement with the findings of other studies, TPS genes in classes I and II have experienced different selective pressures, and TPS genes in class II have lost some introns during evolution due to strong selective pressures [42]. It has been shown that the apparent differences in expression patterns and functions between classes I and II might be related to extensive variation in exon and intron structure [43]. Further research is needed to explore the evolutionary origins of TPS gene introns and their impact on TPS protein function. To further investigate the evolutionary mechanism of PpTPS genes, collinearity analyses of TPS genes in peach and Arabidopsis were performed. A total of 11 TPS genes in Arabidopsis were matched with peach, while only three pairs of genes were found to be covariant in peach. This result indicated that TPS genes had high conservation. As well, in cotton, TPS family members seem to experience strong negative selection, which implies that these TPS were functionally conservative [44].
Numerous response elements were revealed in this study, including those in response to environment (light, anaerobic, low temperature) and plant hormones (IAA, GA, SA, ABA, and MeJA). The presence of hormone response elements (ABA, GA, SA, IAA) and environment response elements (light, anaerobic, low temperature) indicated that PpTPS genes might be involved in plant hormone and stress resistance signaling pathways, which was consistent with previous studies [45,46]. For example, overexpression of AtTPS1 in Arabidopsis significantly improves drought tolerance [47]. Overexpression of OsTPS8 in rice improves salt stress tolerance [18]. OsTPS1 increases rice seed resistance to cold, salt, and drought [14]. While the promoters of PpTPS1a and PpTPS1b contain ABA, a low-temperature-responsive element (Figure 5a), we hypothesize that when peach trees are stimulated by changes in the external environment, the expression of PpTPS1a and PpTPS1b would be regulated, affecting T6P levels to maintain homeostasis in vivo. In this study, the light-responsive element (G-box) and the abscisic acid-responsive element (ABRE) are the two major cis-acting elements of the PpTPS family, as demonstrated in other studies. For example, light quality affects tomato growth by influencing the TPS1-T6P signaling pathway [48], and the ABRE element in the TPS gene promoter might participate in the response to ABA [16].
Tissue-specific expression patterns of PpTPS may explain their important role in specific tissues. PpTPS1a and PpTPS1b were specifically expressed in leaves, showing similar expression patterns. Two class I TPS genes also showed similar tissue expression patterns in watermelon [49]. PpTPS5, PpTPS9a, and PpTPS9b were highly expressed in stems, which may mediate stem development, PpTPS6 and PpTPS7a were highly expressed in fruits; which might play an important role in fruit development. The function of class II TPS genes remains to be explored.
The gene expression pattern of PpTPS genes was analyzed during peach fruit development. The expression patterns of class I TPS genes were consistent and gradually decreased during fruit development, while the gene expression patterns were different in class II. As we know, T6P is a key sugar signaling molecule that further participates in carbohydrate metabolism by inhibiting SnRK1 [50,51]. In this study, we found that SnRK1 was completely opposite to the changes in T6P content during peach fruit development, which was consistent with previous studies. The correlation analysis between T6P and TPS expressions was carried out, showing that PpTPS7a has the highest correlation coefficient (R2 = 0.6208) (Figure S4 and Figure 7e). T6P is mainly synthesized by TPS1 [52], while the expression of PpTPS1a and PpTPS1b during peach fruit development is not positively correlated with T6P content. Transient overexpression and gene silencing were performed in peach fruit, showing that the PpTPS7a gene played a role in T6P synthesis. T6P (trehalose-6-phosphate) is a plant compound that has a significant impact on metabolism, growth, and development [53]. PpTPS7a was shown to be significantly positively related to T6P concentration during fruit development, implying that it plays a role in peach fruit growth and development. The enzyme activity of SnRK1 was affected in transient expression fruit, showing decreased activity in overexpression PpTPS7a fruit and increased in silencing (Figure 8c,f). This result indicated that PpTPS7a might further participate in carbohydrate metabolism via SnRK1. In vitro kinase activity and cell tests have shown that SnRK1 is highly connected with class II T6P synthase (TPS)-like proteins, which regulate SnRK1 kinase activity and limit SnRK1 nuclear signal transmission [54]. PpTPS7a is a class II TPS protein with decreased SnRK1 activity in PpTPS7a overexpression fruit. PpTPS7a may interact with SnRK1 and inhibit its activity. Regulation of carbohydrate metabolism in peach fruit through the TPS-T6P-SnRK1 pathway.
Our study revealed a new mechanism for the regulation of T6P levels in peach fruit, which not only extended the function of TPS genes in class II but also provided a theoretical basis for carbohydrate regulation in peach fruit.

5. Conclusions

In summary, we identified nine PpTPS genes from peach and analyzed their conserved protein motifs, gene structure, chromosome distribution, cis-acting elements in the promoter region, and molecular evolution. The identified TPS genes and their potential function in regulating T6P-SnRK1 signaling provided insights into carbohydrate metabolism in peach fruit.

Supplementary Materials

The following supporting information can be downloaded at: https://www.mdpi.com/article/10.3390/genes15010039/s1, Table S1: The primer sequences of PpTPS genes for qRT-PCR and gene cloning; Figure S1: Comparison of TPS family full-length amino acids and TPS domains; Figure S2: Comparison of the TPS family’s TPP domains and amino acid sequences outside of the domain; Figure S3: Multiple sequence comparison of TPS; Figure S4: Correlation investigation of TPS expression and T6P content change during fruit development.

Author Contributions

For J.G. designed and managed the project. S.F., Z.W., J.L. and S.Z. performed experiments, material sampling, laboratory data measurements, and analyzed the data, and S.F. wrote the first draft of the manuscript. F.P., J.G., Y.L. and Y.X. revised the manuscript. All authors have read and agreed to the published version of the manuscript.

Funding

This study was supported by grants from the Agricultural Improved Variety Engineering Program of Shandong Province (2020LZGC007) and the Natural Science Foundation of Shandong Province of China (ZR2022QC022).

Institutional Review Board Statement

Not applicable.

Informed Consent Statement

Not applicable.

Data Availability Statement

Data are contained in the article and Supplementary Materials.

Acknowledgments

We thank Peng Futian of the Peach Research Group, College of Horticulture, Shandong Agricultural University, for his help with the experimental materials.

Conflicts of Interest

The authors declare no conflict of interest.

References

  1. Wiemken, A. Trehalose in yeast, stress protectant rather than reserve carbohydrate. Antonie Leeuwenhoek 1990, 58, 209–217. [Google Scholar] [CrossRef] [PubMed]
  2. Park, M.; Mitchell, W.J.; Rafii, F. Effect of Trehalose and Trehalose Transport on the Tolerance of Clostridium perfringens to Environmental Stress in a Wild Type Strain and Its Fluoroquinolone-Resistant Mutant. Int. J. Microbiol. 2016, 2016, 4829716. [Google Scholar] [CrossRef] [PubMed]
  3. Wingler, A. The function of trehalose biosynthesis in plants. Phytochemistry 2002, 60, 437–440. [Google Scholar] [CrossRef] [PubMed]
  4. Müller, J.; Boller, T.; Wiemken, A. Trehalose and trehalase in plants: Recent developments. Plant Sci. 1995, 112, 1–9. [Google Scholar] [CrossRef]
  5. Olsson, C.; Jansson, H.; Swenson, J. The Role of Trehalose for the Stabilization of Proteins. J. Phys. Chem. B 2016, 120, 4723–4731. [Google Scholar] [CrossRef] [PubMed]
  6. Cabib, E.; Leloir, L.F. The biosynthesis of trehalose phosphate. J. Biol. Chem. 1958, 231, 259–275. [Google Scholar] [CrossRef] [PubMed]
  7. Lunn, J.E.; Delorge, I.; Figueroa, C.M.; Van Dijck, P.; Stitt, M. Trehalose metabolism in plants. Plant J. 2014, 79, 544–567. [Google Scholar] [CrossRef]
  8. Ramon, M.; Rolland, F. Plant development: Introducing trehalose metabolism. Trends Plant Sci. 2007, 12, 185–188. [Google Scholar] [CrossRef]
  9. Gao, Y.; Yang, X.; Yang, X.; Zhao, T.; An, X.; Chen, Z. Characterization and expression pattern of the trehalose-6-phosphate synthase and trehalose-6-phosphate phosphatase gene families in Populus. Int. J. Biol. Macromol. 2021, 187, 9–23. [Google Scholar] [CrossRef]
  10. Vandesteene, L.; Ramon, M.; Le Roy, K.; Van Dijck, P.; Rolland, F. A Single Active Trehalose-6-P Synthase (TPS) and a Family of Putative Regulatory TPS-Like Proteins in Arabidopsis. Mol. Plant 2010, 3, 406–419. [Google Scholar] [CrossRef]
  11. Zang, B.; Li, H.; Li, W.; Deng, X.W.; Wang, X. Analysis of trehalose-6-phosphate synthase (TPS) gene family suggests the formation of TPS complexes in rice. Plant Mol. Biol. 2011, 76, 507–522. [Google Scholar] [CrossRef]
  12. Eastmond, P.J.; van Dijken, A.J.; Spielman, M.; Kerr, A.; Tissier, A.F.; Dickinson, H.G.; Jones, J.D.; Smeekens, S.C.; Graham, I.A. Trehalose-6-phosphate synthase 1, which catalyses the first step in trehalose synthesis, is essential for Arabidopsis embryo maturation. Plant J. 2002, 29, 225–235. [Google Scholar] [CrossRef] [PubMed]
  13. Ramon, M.; De Smet, I.; Vandesteene, L.; Naudts, M.; Leyman, B.; Van Dijck, P.; Rolland, F.; Beeckman, T.; Thevelein, J.M. Extensive expression regulation and lack of heterologous enzymatic activity of the Class II trehalose metabolism proteins from Arabidopsis thaliana. Plant Cell Environ. 2009, 32, 1015–1032. [Google Scholar] [CrossRef] [PubMed]
  14. Li, H.W.; Zang, B.S.; Deng, X.W.; Wang, X.P. Overexpression of the trehalose-6-phosphate synthase gene OsTPS1 enhances abiotic stress tolerance in rice. Planta 2011, 234, 1007–1018. [Google Scholar] [CrossRef] [PubMed]
  15. Zacharaki, V.; Ponnu, J.; Crepin, N.; Langenecker, T.; Hagmann, J.; Skorzinski, N.; Musialak-Lange, M.; Wahl, V.; Rolland, F.; Schmid, M. Impaired KIN10 function restores developmental defects in the Arabidopsis trehalose 6-phosphate synthase1 (tps1) mutant. New Phytol. 2022, 235, 220–233. [Google Scholar] [CrossRef] [PubMed]
  16. Tian, L.; Xie, Z.; Lu, C.; Hao, X.; Wu, S.; Huang, Y.; Li, D.; Chen, L. The trehalose-6-phosphate synthase TPS5 negatively regulates ABA signaling in Arabidopsis thaliana. Plant Cell Rep. 2019, 38, 869–882. [Google Scholar] [CrossRef] [PubMed]
  17. Chary, S.N.; Hicks, G.R.; Choi, Y.G.; Carter, D.; Raikhel, N.V. Trehalose-6-phosphate synthase/phosphatase regulates cell shape and plant architecture in Arabidopsis. Plant Physiol. 2008, 146, 97–107. [Google Scholar] [CrossRef] [PubMed]
  18. Vishal, B.; Krishnamurthy, P.; Ramamoorthy, R.; Kumar, P.P. OsTPS8 controls yield-related traits and confers salt stress tolerance in rice by enhancing suberin deposition. New Phytol. 2019, 221, 1369–1386. [Google Scholar] [CrossRef] [PubMed]
  19. Liu, X.; Fu, L.; Qin, P.; Sun, Y.; Liu, J.; Wang, X. Overexpression of the wheat trehalose 6-phosphate synthase 11 gene enhances cold tolerance in Arabidopsis thaliana. Gene 2019, 710, 210–217. [Google Scholar] [CrossRef]
  20. Yadav, U.P.; Ivakov, A.; Feil, R.; Duan, G.Y.; Walther, D.; Giavalisco, P.; Piques, M.; Carillo, P.; Hubberten, H.M.; Stitt, M.; et al. The sucrose-trehalose 6-phosphate (Tre6P) nexus: Specificity and mechanisms of sucrose signalling by Tre6P. J. Exp. Bot. 2014, 65, 1051–1068. [Google Scholar] [CrossRef]
  21. Zhang, Y.; Primavesi, L.F.; Jhurreea, D.; Andralojc, P.J.; Mitchell, R.A.; Powers, S.J.; Schluepmann, H.; Delatte, T.; Wingler, A.; Paul, M.J. Inhibition of SNF1-related protein kinase1 activity and regulation of metabolic pathways by trehalose-6-phosphate. Plant Physiol. 2009, 149, 1860–1871. [Google Scholar] [CrossRef] [PubMed]
  22. Peixoto, B.; Moraes, T.A.; Mengin, V.; Margalha, L.; Vicente, R.; Feil, R.; Höhne, M.; Sousa, A.G.G.; Lilue, J.; Stitt, M.; et al. Impact of the SnRK1 protein kinase on sucrose homeostasis and the transcriptome during the diel cycle. Plant Physiol. 2021, 187, 1357–1373. [Google Scholar] [CrossRef] [PubMed]
  23. Yu, W.; Peng, F.; Wang, W.; Liang, J.; Xiao, Y.; Yuan, X. SnRK1 phosphorylation of SDH positively regulates sorbitol metabolism and promotes sugar accumulation in peach fruit. Tree Physiol. 2021, 41, 1077–1086. [Google Scholar] [CrossRef] [PubMed]
  24. Shulaev, V.; Korban, S.S.; Sosinski, B.; Abbott, A.G.; Aldwinckle, H.S.; Folta, K.M.; Iezzoni, A.; Main, D.; Arús, P.; Dandekar, A.M.; et al. Multiple models for Rosaceae genomics. Plant Physiol. 2008, 147, 985–1003. [Google Scholar] [CrossRef] [PubMed]
  25. Verde, I.; Abbott, A.G.; Scalabrin, S.; Jung, S.; Shu, S.; Marroni, F.; Zhebentyayeva, T.; Dettori, M.T.; Grimwood, J.; Cattonaro, F.; et al. The high-quality draft genome of peach (Prunus persica) identifies unique patterns of genetic diversity, domestication and genome evolution. Nat. Genet. 2013, 45, 487–494. [Google Scholar] [CrossRef] [PubMed]
  26. Arús, P.; Verde, I.; Sosinski, B.; Zhebentyayeva, T.; Abbott, A.G. The peach genome. Tree Genet. Genomes 2012, 8, 531–547. [Google Scholar] [CrossRef]
  27. Chen, C.; Chen, H.; Zhang, Y.; Thomas, H.R.; Frank, M.H.; He, Y.; Xia, R. TBtools: An Integrative Toolkit Developed for Interactive Analyses of Big Biological Data. Mol. Plant 2020, 13, 1194–1202. [Google Scholar] [CrossRef]
  28. Finn, R.D.; Tate, J.; Mistry, J.; Coggill, P.C.; Sammut, S.J.; Hotz, H.R.; Ceric, G.; Forslund, K.; Eddy, S.R.; Sonnhammer, E.L.; et al. The Pfam protein families database. Nucleic Acids Res. 2008, 36, D281–D288. [Google Scholar] [CrossRef]
  29. Thompson, J.D.; Gibson, T.J.; Higgins, D.G. Multiple sequence alignment using ClustalW and ClustalX. Curr. Protoc. Bioinform. 2002, 2, 2–3. [Google Scholar] [CrossRef]
  30. Yockteng, R.; Almeida, A.M.; Morioka, K.; Alvarez-Buylla, E.R.; Specht, C.D. Molecular evolution and patterns of duplication in the SEP/AGL6-like lineage of the Zingiberales: A proposed mechanism for floral diversification. Mol. Biol. Evol. 2013, 30, 2401–2422. [Google Scholar] [CrossRef]
  31. Bailey, T.L.; Boden, M.; Buske, F.A.; Frith, M.; Grant, C.E.; Clementi, L.; Ren, J.; Li, W.W.; Noble, W.S. MEME SUITE: Tools for motif discovery and searching. Nucleic Acids Res. 2009, 37, W202–W208. [Google Scholar] [CrossRef]
  32. Rombauts, S.; Déhais, P.; Van Montagu, M.; Rouzé, P. PlantCARE, a plant cis-acting regulatory element database. Nucleic Acids Res. 1999, 27, 295–296. [Google Scholar] [CrossRef] [PubMed]
  33. Huan, C.; Jiang, L.; An, X.; Yu, M.; Xu, Y.; Ma, R.; Yu, Z. Potential role of reactive oxygen species and antioxidant genes in the regulation of peach fruit development and ripening. Plant Physiol. Biochem. 2016, 104, 294–303. [Google Scholar] [CrossRef] [PubMed]
  34. Derveaux, S.; Vandesompele, J.; Hellemans, J. How to do successful gene expression analysis using real-time PCR. Methods 2010, 50, 227–230. [Google Scholar] [CrossRef] [PubMed]
  35. Ahmed, F.; Senthil-Kumar, M.; Dai, X.; Ramu, V.S.; Lee, S.; Mysore, K.S.; Zhao, P.X. pssRNAit: A Web Server for Designing Effective and Specific Plant siRNAs with Genome-Wide Off-Target Assessment. Plant Physiol. 2020, 184, 65–81. [Google Scholar] [CrossRef]
  36. Glinski, M.; Weckwerth, W. Differential multisite phosphorylation of the trehalose-6-phosphate synthase gene family in Arabidopsis thaliana: A mass spectrometry-based process for multiparallel peptide library phosphorylation analysis. Mol. Cell. Proteom. 2005, 4, 1614–1625. [Google Scholar] [CrossRef] [PubMed]
  37. Blázquez, M.A.; Santos, E.; Flores, C.L.; Martínez-Zapater, J.M.; Salinas, J.; Gancedo, C. Isolation and molecular characterization of the Arabidopsis TPS1 gene, encoding trehalose-6-phosphate synthase. Plant J. 1998, 13, 685–689. [Google Scholar] [CrossRef] [PubMed]
  38. Jiang, W.; Fu, F.-L.; Zhang, S.-Z.; Wu, L.; Li, W.-C. Cloning and Characterization of Functional Trehalose-6-Phosphate Synthase Gene in Maize. J. Plant Biol. 2010, 53, 134–141. [Google Scholar] [CrossRef]
  39. Jin, X.F.; Xiong, A.S.; Peng, R.H.; Liu, J.G.; Gao, F.; Chen, J.M.; Yao, Q.H. OsAREB1, an ABRE-binding protein responding to ABA and glucose, has multiple functions in Arabidopsis. BMB Rep. 2010, 43, 34–39. [Google Scholar] [CrossRef]
  40. Jang, I.C.; Oh, S.J.; Seo, J.S.; Choi, W.B.; Song, S.I.; Kim, C.H.; Kim, Y.S.; Seo, H.S.; Choi, Y.D.; Nahm, B.H.; et al. Expression of a bifunctional fusion of the Escherichia coli genes for trehalose-6-phosphate synthase and trehalose-6-phosphate phosphatase in transgenic rice plants increases trehalose accumulation and abiotic stress tolerance without stunting growth. Plant Physiol. 2003, 131, 516–524. [Google Scholar] [CrossRef]
  41. Yang, H.L.; Liu, Y.J.; Wang, C.L.; Zeng, Q.Y. Molecular evolution of trehalose-6-phosphate synthase (TPS) gene family in Populus, Arabidopsis and rice. PLoS ONE 2012, 7, e42438. [Google Scholar] [CrossRef] [PubMed]
  42. Xu, Y.; Wang, Y.; Mattson, N.; Yang, L.; Jin, Q. Genome-wide analysis of the Solanum tuberosum (potato) trehalose-6-phosphate synthase (TPS) gene family: Evolution and differential expression during development and stress. BMC Genom. 2017, 18, 926. [Google Scholar] [CrossRef] [PubMed]
  43. Reddy, A.S.; Marquez, Y.; Kalyna, M.; Barta, A. Complexity of the alternative splicing landscape in plants. Plant Cell 2013, 25, 3657–3683. [Google Scholar] [CrossRef] [PubMed]
  44. Mu, M.; Lu, X.K.; Wang, J.J.; Wang, D.L.; Yin, Z.J.; Wang, S.; Fan, W.L.; Ye, W.W. Genome-wide Identification and analysis of the stress-resistance function of the TPS (Trehalose-6-Phosphate Synthase) gene family in cotton. BMC Genet. 2016, 17, 54. [Google Scholar] [CrossRef]
  45. Miranda, J.A.; Avonce, N.; Suárez, R.; Thevelein, J.M.; Van Dijck, P.; Iturriaga, G. A bifunctional TPS-TPP enzyme from yeast confers tolerance to multiple and extreme abiotic-stress conditions in transgenic Arabidopsis. Planta 2007, 226, 1411–1421. [Google Scholar] [CrossRef] [PubMed]
  46. Zhu, F.; Li, M.; Sun, M.; Jiang, X.; Qiao, F. Plant hormone signals regulate trehalose accumulation against osmotic stress in watermelon cells. Protoplasma 2022, 259, 1351–1369. [Google Scholar] [CrossRef] [PubMed]
  47. Avonce, N.; Leyman, B.; Mascorro-Gallardo, J.O.; Van Dijck, P.; Thevelein, J.M.; Iturriaga, G. The Arabidopsis trehalose-6-P synthase AtTPS1 gene is a regulator of glucose, abscisic acid, and stress signaling. Plant Physiol. 2004, 136, 3649–3659. [Google Scholar] [CrossRef]
  48. Song, J.; Mao, H.; Cheng, J.; Zhou, Y.; Chen, R.; Zeng, L.; Li, H.; Wang, Y. Identification of the trehalose-6-phosphate synthase gene family in Medicago truncatula and expression analysis under abiotic stresses. Gene 2021, 787, 145641. [Google Scholar] [CrossRef]
  49. Dan, Y.; Niu, Y.; Wang, C.; Yan, M.; Liao, W. Genome-wide identification and expression analysis of the trehalose-6-phosphate synthase (TPS) gene family in cucumber (Cucumis sativus L.). PeerJ 2021, 9, e11398. [Google Scholar] [CrossRef]
  50. Griffiths, C.A.; Sagar, R.; Geng, Y.; Primavesi, L.F.; Patel, M.K.; Passarelli, M.K.; Gilmore, I.S.; Steven, R.T.; Bunch, J.; Paul, M.J.; et al. Chemical intervention in plant sugar signalling increases yield and resilience. Nature 2016, 540, 574–578. [Google Scholar] [CrossRef]
  51. Lawlor, D.W.; Paul, M.J. Source/sink interactions underpin crop yield: The case for trehalose 6-phosphate/SnRK1 in improvement of wheat. Front. Plant Sci. 2014, 5, 418. [Google Scholar] [CrossRef]
  52. O’Hara, L.E.; Paul, M.J.; Wingler, A. How do sugars regulate plant growth and development? New insight into the role of trehalose-6-phosphate. Mol. Plant 2013, 6, 261–274. [Google Scholar] [CrossRef]
  53. Schluepmann, H.; Berke, L.; Sanchez-Perez, G.F. Metabolism control over growth: A case for trehalose-6-phosphate in plants. J. Exp. Bot. 2011, 63, 3379–3390. [Google Scholar] [CrossRef]
  54. Van Leene, J.; Eeckhout, D.; Gadeyne, A.; Matthijs, C.; Han, C.; De Winne, N.; Persiau, G.; Van De Slijke, E.; Persyn, F.; Mertens, T.; et al. Mapping of the plant SnRK1 kinase signalling network reveals a key regulatory role for the class II T6P synthase-like proteins. Nat. Plants 2022, 8, 1245–1261. [Google Scholar] [CrossRef]
Figure 1. Distribution of PpTPS genes on peach genome. Chromosomes are indicated by long black rectangles. The PpTPS genes are marked in red.
Genes 15 00039 g001
Figure 2. Collinearity analysis. (a) Collinearity analysis of TPS genes in peach. (b) Collinearity analysis of TPS genes in peach and Arabidopsis.
Genes 15 00039 g002
Figure 3. Multiple sequence alignment and phylogenetic analysis. (a) Calculation of sequence identity of TPS domain, TPP domain, full-length protein sequence, and extra-structural domain sequence. (b) Evolutionary tree constructed by PpTPS and TPS gene families of tomato, Arabidopsis, and apple. The yellow triangles represent tomatoes, purple squares represent Arabidopsis, blue circles represent apples, red pentagram represents the peach.
Genes 15 00039 g003
Figure 4. Gene structure and conserved motif analysis of PpTPS genes. (a) Gene structure of PpTPS gene. (b) Distribution of conserved motifs in PpTPS proteins.
Genes 15 00039 g004
Figure 5. Analysis of the cis-elements of the PpTPS gene promoter. (a) Cis-elements identified in the promoters of the PpTPS gene. (b) Heat map of the cis-elements of each gene.
Genes 15 00039 g005
Figure 6. Tissue specific expression analysis of PpTPS genes. Note: Different letters indicate significant differences.
Genes 15 00039 g006
Figure 7. (a) Relative expression levels of PpTPS gene during fruit development. (b) Determination of T6P contents during fruit development. (c) SnRK1 activity during fruit development. (d) Correlation analysis between T6P content and SnRK1 activity. (e) Correlation analysis between PpTPS7a expression and T6P contents. Note: DAFB means number of days since flowering.
Genes 15 00039 g007
Figure 8. Gene function of PpTPS7a. (a) Relative expression level of PpTPS7a in transient overexpression peach fruit. (b) T6P content after transient overexpression of PpTPS7a. (c) SnRK1 activity after transiently overexpression of PpTPS7a. (d) Relative expression level of PpTPS7a in transient silencing peach fruit. (e) T6P content after silencing. (f) SnRK1 activity after silencing.
Genes 15 00039 g008
Table 1. Physical and chemical properties of TPS gene family members in peach.
NameGene AccessionaaChromChr-StartChr-EndMW (Da)pIGRAVY
PpTPS1aPrupe.4G071400926Chr.434978943506676104,186.146.88−0.285
PpTPS1bPrupe.4G155900924Chr.489267838938050104,373.736.37−0.378
PpTPS5Prupe.5G031500858Chr.53611189361810397,218.495.67−0.19
PpTPS6Prupe.1G334900855Chr.1316475743165227196,726.255.9−0.19
PpTPS7aPrupe.3G113100840Chr.39435987944049195,686.726.19−0.244
PpTPS7bPrupe.4G067300854Chr.43258754326349396,553.115.8−0.267
PpTPS9aPrupe.5G176400862Chr.5149590381496433497,797.316.39−0.185
PpTPS9bPrupe.1G095500859Chr.17551683755502997,549.836.25−0.207
PpTPS10Prupe.1G256200861Chr.1266524712665727997,224.265.88−0.24
Note: aa indicates amino acid length, MW indicates molecular weight, pI indicates theoretical isoelectric point, GRAVY indicates grand average of hydropathicity multiple sequence alignment.
Disclaimer/Publisher’s Note: The statements, opinions and data contained in all publications are solely those of the individual author(s) and contributor(s) and not of MDPI and/or the editor(s). MDPI and/or the editor(s) disclaim responsibility for any injury to people or property resulting from any ideas, methods, instructions or products referred to in the content.

