Article

In Vitro Low-Bortezomib Doses Induce Apoptosis and Independently Decrease the Activities of Glutathione S-Transferase and Glutathione Peroxidase in Multiple Myeloma, Taking into Account the GSTT1 and GSTM1 Gene Variants

by
Szymon Zmorzynski
1,*,
Sylwia Popek-Marciniec
1,
Beata Biernacka
2,
Aneta Szudy-Szczyrek
3,
Sylwia Chocholska
3,
Wojciech Styk
4,
Joanna Czerwik-Marcinkowska
5 and
Grazyna Swiderska-Kolacz
5
1
Laboratory of Genetics, Academy of Zamosc, 22-400 Zamosc, Poland
2
Institute of Nursing and Obstetrics, Academy of Zamosc, 22-400 Zamosc, Poland
3
Chair and Department of Haematooncology and Bone Marrow Transplantation, Medical University of Lublin, 20-059 Lublin, Poland
4
Academic Laboratory of Psychological Tests, Medical University of Lublin, 20-059 Lublin, Poland
5
Institute of Biology, Jan Kochanowski University, 25-369 Kielce, Poland
*
Author to whom correspondence should be addressed.
Genes 2024, 15(3), 387; https://doi.org/10.3390/genes15030387
Submission received: 17 February 2024 / Revised: 13 March 2024 / Accepted: 19 March 2024 / Published: 21 March 2024
(This article belongs to the Section Human Genomics and Genetic Diseases)

Abstract

:
Background: Multiple myeloma (MM) is a malignancy derived from plasma cells. Bortezomib affects the concentration of reduced glutathione (GSH) and the activity of glutathione enzymes. The aim of our study was to analyze deletion (null/present) variants of GSTT1 and GSTM1 genes and their association with the levels of glutathione and its enzymes in bortezomib-treated cell cultures derived from MM patients. Materials and Methods: This study included 180 individuals (80 MM patients and 100 healthy blood donors) who were genotyped via multiplex PCR (for the GSTT1/GSTM1 genes). Under in vitro conditions, MM bone marrow cells were treated with bortezomib (1–4 nM) to determine apoptosis (via fluorescence microscopy), GSH concentration, and activity of glutathione enzymes (via ELISA). Results: Bortezomib increased the number of apoptotic cells and decreased the activity of S-glutathione transferase (GST) and glutathione peroxidase (GPx). We found significant differences in GST activity between 1 nM (GSTT1-null vs. GSTT1-present), 2 nM (GSTT1-null vs. GSTT1-present), and 4 nM (GSTM1-null vs. GSTM1-present) bortezomib: 0.07 vs. 0.12, p = 0.02; 0.06 vs. 0.10, p = 0.02; and 0.03 vs. 0.08, p = 0.01, respectively. Conclusions: Bortezomib affects the activities of GST and GPx. GST activity was associated with GSTT1 and GSTM1 variants but only at some bortezomib doses.

1. Introduction

Multiple myeloma (MM) is a plasma cell malignancy of the bone marrow [1]. Different factors are involved in the etiology and pathogenesis of this disease, including genetic factors [2]. In the treatment of MM, agents with various mechanisms of action are used. One of these agents is bortezomib, which plays a role as a potent and reversible inhibitor of the 26S proteasome. It is a protein complex responsible for the degradation of intracellular proteins. Bortezomib-mediated inhibition of the proteasome leads to cancer cell apoptosis [3].
Moreover, bortezomib affects redox homeostasis in multiple myeloma cells [4]. It decreases the levels of intracellular reduced glutathione (GSH), which is an important endogenous antioxidant [4]. It protects the genome, proteins, and fats against the harmful effects of reactive oxygen species (ROS) and regulates metabolic processes and apoptosis [5,6]. ROS neutralization and cellular oxidative stress handling involve the glutathione system, which includes GSH and interacts with glutathione enzymes, such as glutathione peroxidase (GPx, EC 1.11.1.9), glutathione reductase (GR, EC 1.8.1.7), and glutathione S-transferases (GSTs, EC. 2.5.1.18), [7]. GPx reduces hydrogen peroxide to water, while GR converts oxidized glutathione (GSSG) into its reduced form [8]. These differences depend on the presence of two types of GSTs: GST theta-1, which is encoded by the GSTT1 gene (locus 22q11.2), and GST mu-1, which is encoded by the GSTM1 gene (locus 1p13.3) [9,10]. The variants of the GSTT1 and GSTM1 genes are examples of deletion polymorphisms. The null genotype means that the coding regions of both alleles at a single locus are deleted. The null variants are located in coding regions of the GSTT1 and GSTM1 genes and are associated with deletions of all exons and introns. However, noncoding regions of each gene, including the promoter, 5′-UTR and 3′-UTR, are present. Null genotypes result in a complete lack of corresponding enzyme activity [11].
Considering the above, we decided to analyze the relationship between GSH concentration and the activity of glutathione enzymes (GST, GPx, and GR) in combination with bortezomib in vitro (doses of 1 nM, 2 nM, and 4 nM) and its proapoptotic effect on multiple myeloma cells, taking into account the variants of the GSTT1 and GSTM1 genes. The hypotheses of the present research assumed that the activity of antioxidant enzymes and concentrations of GSH would depend on the concentration of bortezomib in the culture medium, and that a higher concentration of bortezomib would result in greater dynamics of changes in the activity of antioxidant enzymes. Moreover, the correlation between apoptosis and the levels of the studied antioxidant markers was analyzed. To our knowledge, such analyses with low-bortezomib doses have not been carried out in multiple myeloma patients.

2. Materials and Methods

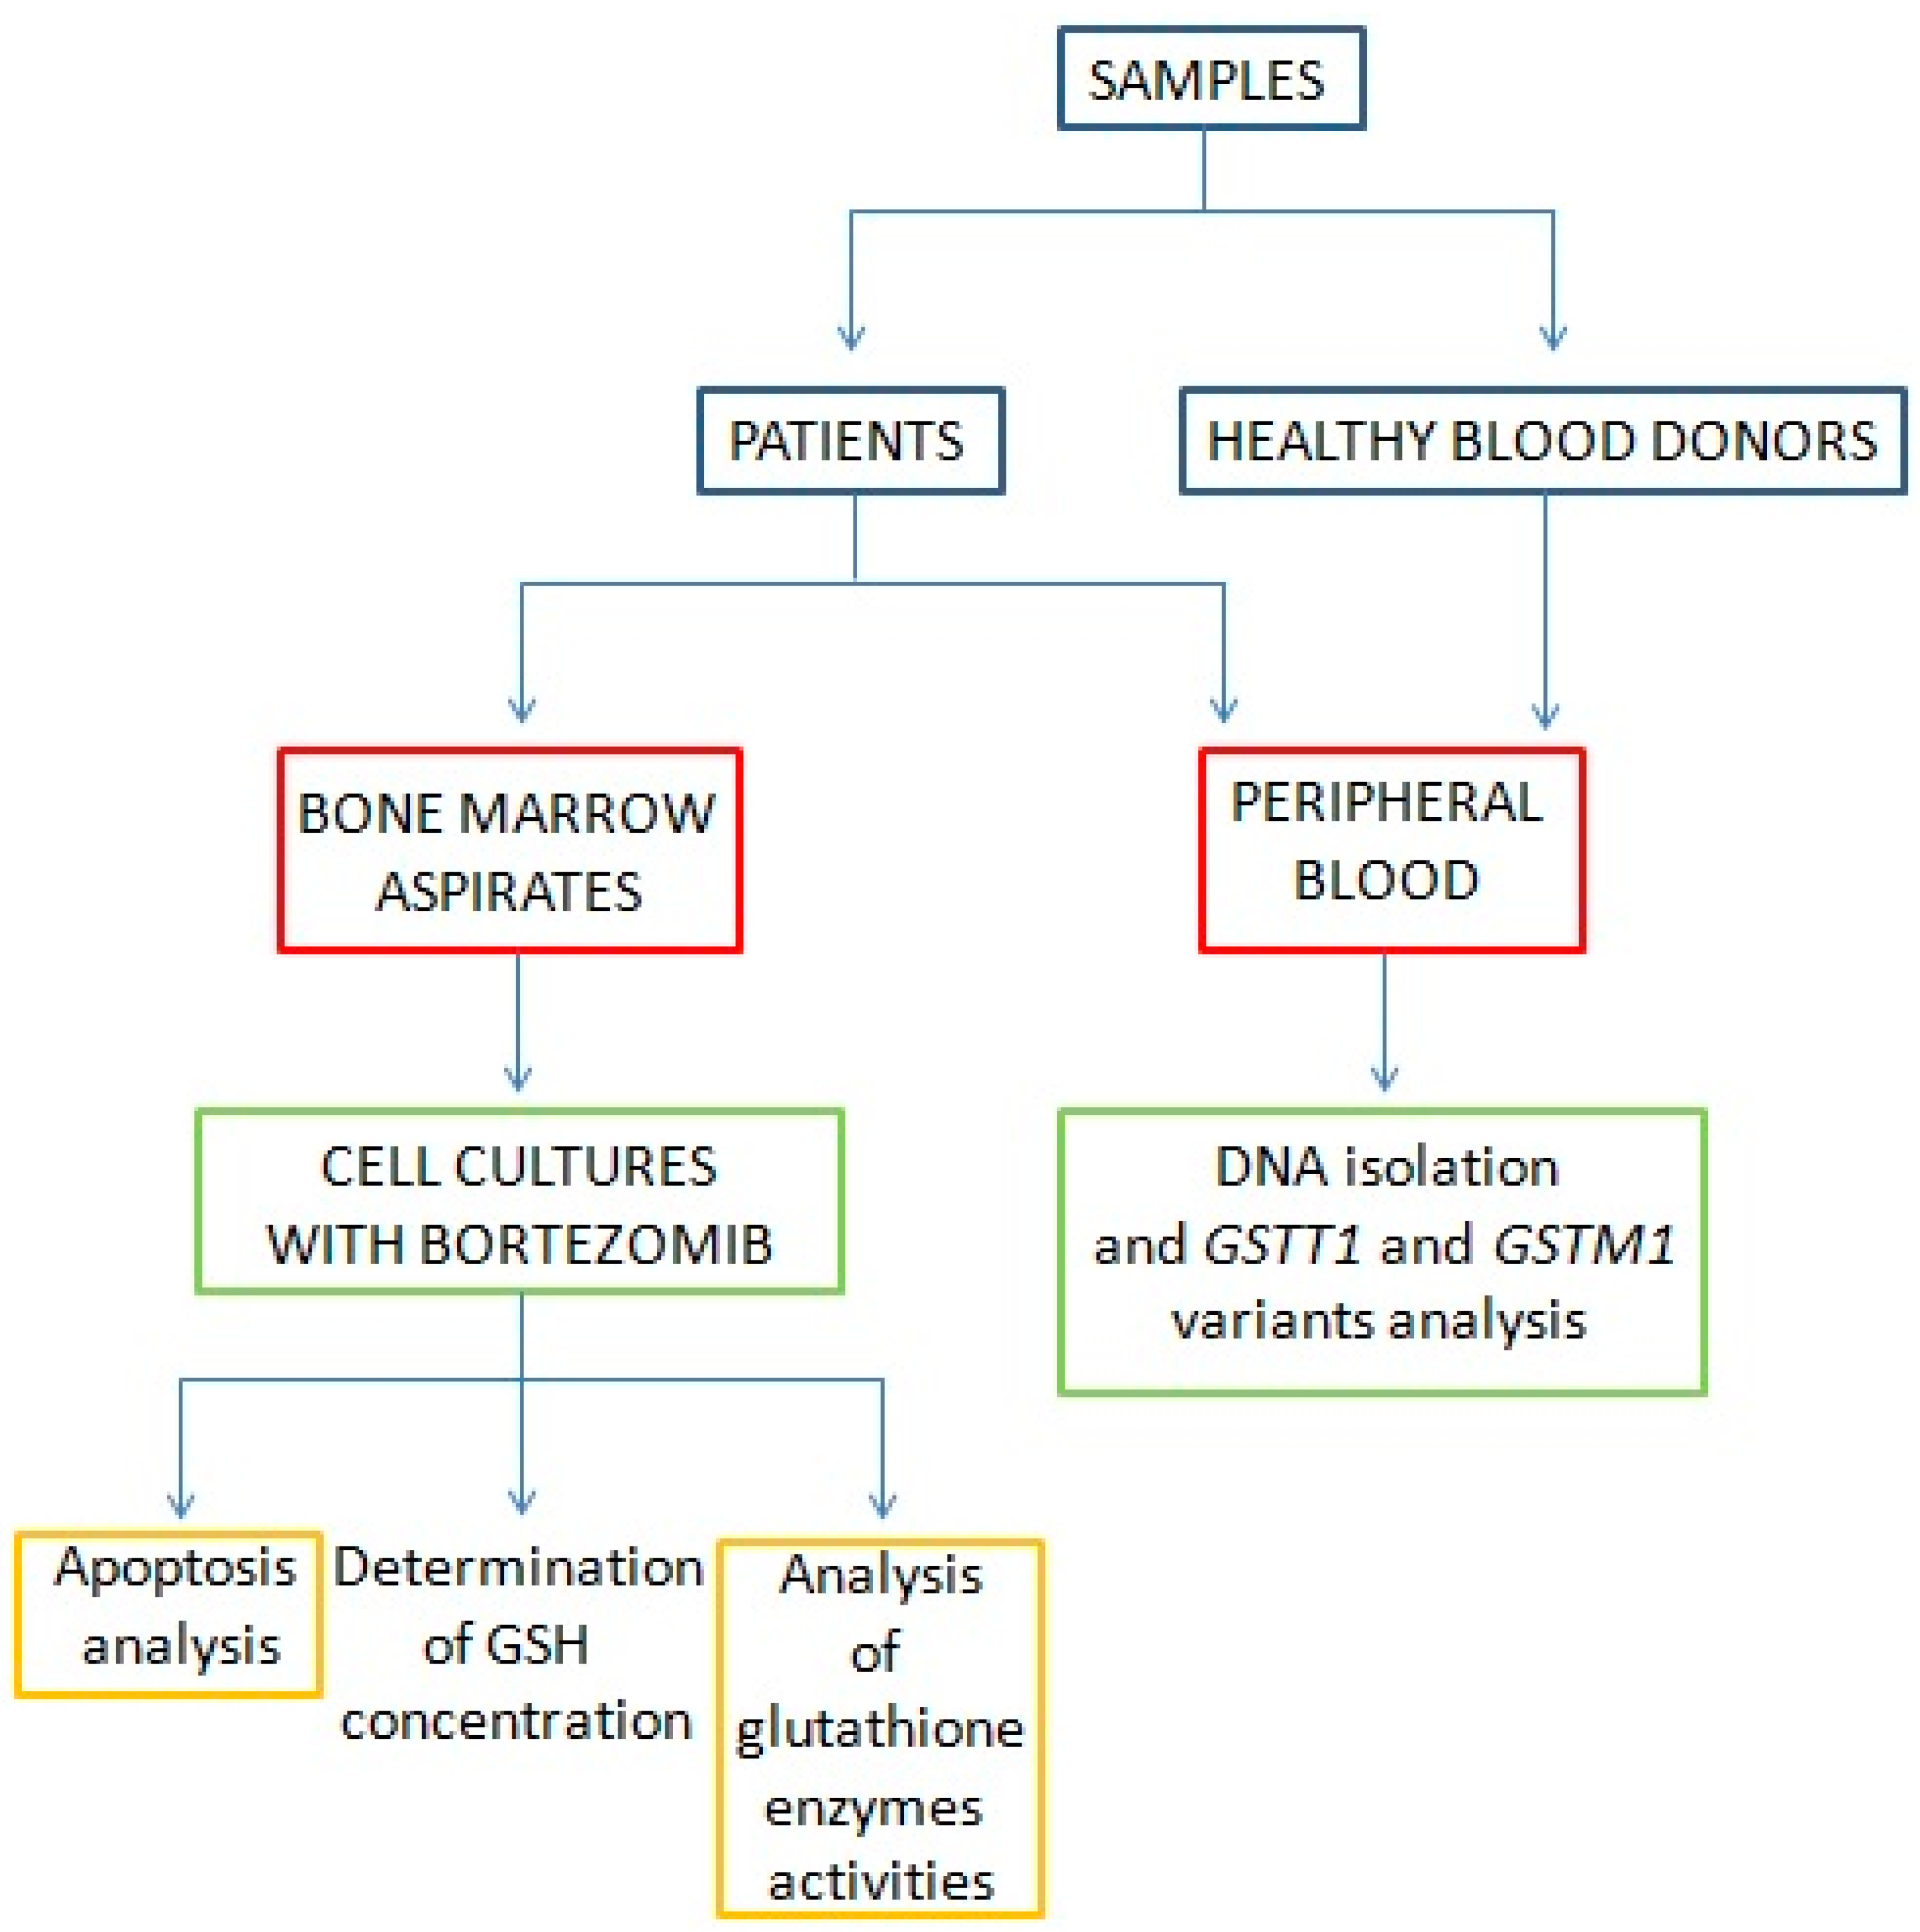
2.1. Patients and Samples

This study included 180 individuals, with 80 newly diagnosed patients with MM and 100 healthy blood donors. From the MM patients, bone marrow aspirates and peripheral blood samples were collected. MM patients were hospitalized (between 2013–2020) at the Chair and Department of Haematooncology and Bone Marrow Transplantation, Medical University of Lublin.
Peripheral blood obtained from 100 healthy blood donors (50 males and 50 females) served as control samples. Their mean age was 34.4 years (range 18–61 years). Healthy blood donors were selected from the Regional Blood Donation and Blood Treatment Center in Kielce.
The study obtained a positive opinion from the Bioethics Committee at Medical University of Lublin (no. KE-0254/165/2013 and no. KE-0254/337/2016) and at Jan Kochanowski University of Kielce (No. KB-41/2016), according to the ethical standards established by the Helsinki Declaration. The patients and healthy blood donors provided written informed consent.
Peripheral blood (from MM patients and healthy blood donors) was used to isolate DNA and to determine variants of the GSTT1 and GSTM1 genes.
Cell cultures were established from MM bone marrow aspirates to carry out in vitro research with bortezomib. Experiment overflow is shown in Figure 1.
The general characteristics of the MM patients are shown in Table 1.

2.2. Multiple Myeloma Cell Culture and In Vitro Bortezomib Treatment

Bone marrow aspirates were stratified on a Lymphoprep (Axis-Shield PoC As, Oslo, Norway), and the lymphocyte fraction was used to establish cell cultures, which were grown in 15 mL of culture medium (RPMI 1640) supplemented with L-glutamine (Biomed, Lublin, Poland), 10% inactivated fetal calf serum (Biomed, Lublin, Poland), 1% antibiotic antimycotic (A&E Scientific, Enghien, Belgium), and different doses (1 nM, 2 nM, or 4 nM) of bortezomib (LC Laboratories, Woburn, MA, USA, 200 mg/mL). Bortezomib was dissolved in DMSO (with its final concentration in the culture medium lower than 0.1%). The cell cultures without bortezomib (with 0.1% DMSO) were used as a control. Then, the lymphocyte fraction (about 1 mL) was added to the culture medium (with a volume of 15 mL). The cultures were carried out under appropriate conditions, at 37 °C and with 5% CO2 for 24 h (without granulocyte colony-stimulating factor) and were routinely terminated. The cell suspensions were used to determine the number of apoptotic/necrotic/viable cells, the GSH concentration, and the activities of GPx, GR, and GST.

2.3. In Vitro Determination of Apoptotic, Necrotic, and Viable Cells

Apoptotic, necrotic, and viable cells were detected with an Annexin V-Cy3 Apoptosis Detection Kit according to the manufacturer’s protocol (Millipore Sigma, Burlington, MA, USA). For fluorescence microscopy, viable cells were stained with 6-CF (6-carboxyfluorescein) (green), and necrotic cells were stained with AnnCy3 (Annexin V Cy3.18). Cells that had started the apoptotic process were stained with both AnnCy3 (red) and 6-CF (green) (Figure 2).

2.4. Trypan Blue Exclusion Test of Cell Viability

A volume of cell suspension with a volume of 0.4% trypan blue was mixed in a ratio of 1:1 and covered with a coverslip. After 3 min, changes in cell staining were observed, with the nuclei of dead cells stained blue. Cells were counted within 3 to 5 min of mixing with trypan blue.

2.5. Analysis of Glutathione Enzyme Activities

The activities of glutathione enzymes, GPx, GR, and GST were also analyzed.

2.5.1. Glutathione Peroxidase (GPx) Activity

GPx activity was measured using a Glutathione Peroxidase Cellular Activity Assay Kit (Millipore Sigma, Burlington, MA, USA; cat. no. MAK437) according to the manufacturer’s instructions. Extinction was measured spectrophotometrically (TK Biotech, Warsaw, Poland) at a wavelength of λ = 340 nm every 15 s for 1 min. GPx activity was expressed in U· mg−1 protein.

2.5.2. Glutathione Reductase (GR) Activity

GR activity was measured using a Glutathione Reductase Assay Kit (Millipore Sigma, Burlington, MA, USA; cat. no. GRSA). A plate reader (TK Biotech, Warsaw, Poland) was used to measure GR activity at a wavelength of 412 nm (in U · mg−1 protein).

2.5.3. Glutathione S-transferase (GST) Activity

GST activity was measured using a Glutathione S-transferase (GST) Assay Kit (Millipore Sigma, Burlington, MA, USA; cat. no. MAK453). A plate reader (TK Biotech, Warsaw, Poland) was used to measure the GST activity at a wavelength of 340 nm (in U · mg−1 protein).

2.6. Determination of Reduced Glutathione (GSH) Concentration

The GSH concentration was determined using a Sigma Aldrich Glutathione Assay Kit (Millipore Sigma, Burlington, MA, USA; cat. no. MAK364) and a plate reader (TK Biotech, Warsaw, Poland) at a wavelength of 450 nm. The total protein concentration was determined according to the method of Lowry et al. [12].

2.7. DNA Isolation

DNA isolation from peripheral blood (from healthy blood donors, n = 100; from MM patients, n = 80) was performed using a commercial kit (Qiagen, Hilden, Germany) according to the manufacturer’s procedure. The concentration and quality of the DNA were checked using a NanoDrop device (Thermo Fisher Scientific, Waltham, MA, USA). DNA was used to determine the GSTT1 and GSTM1 gene variants via PCR.

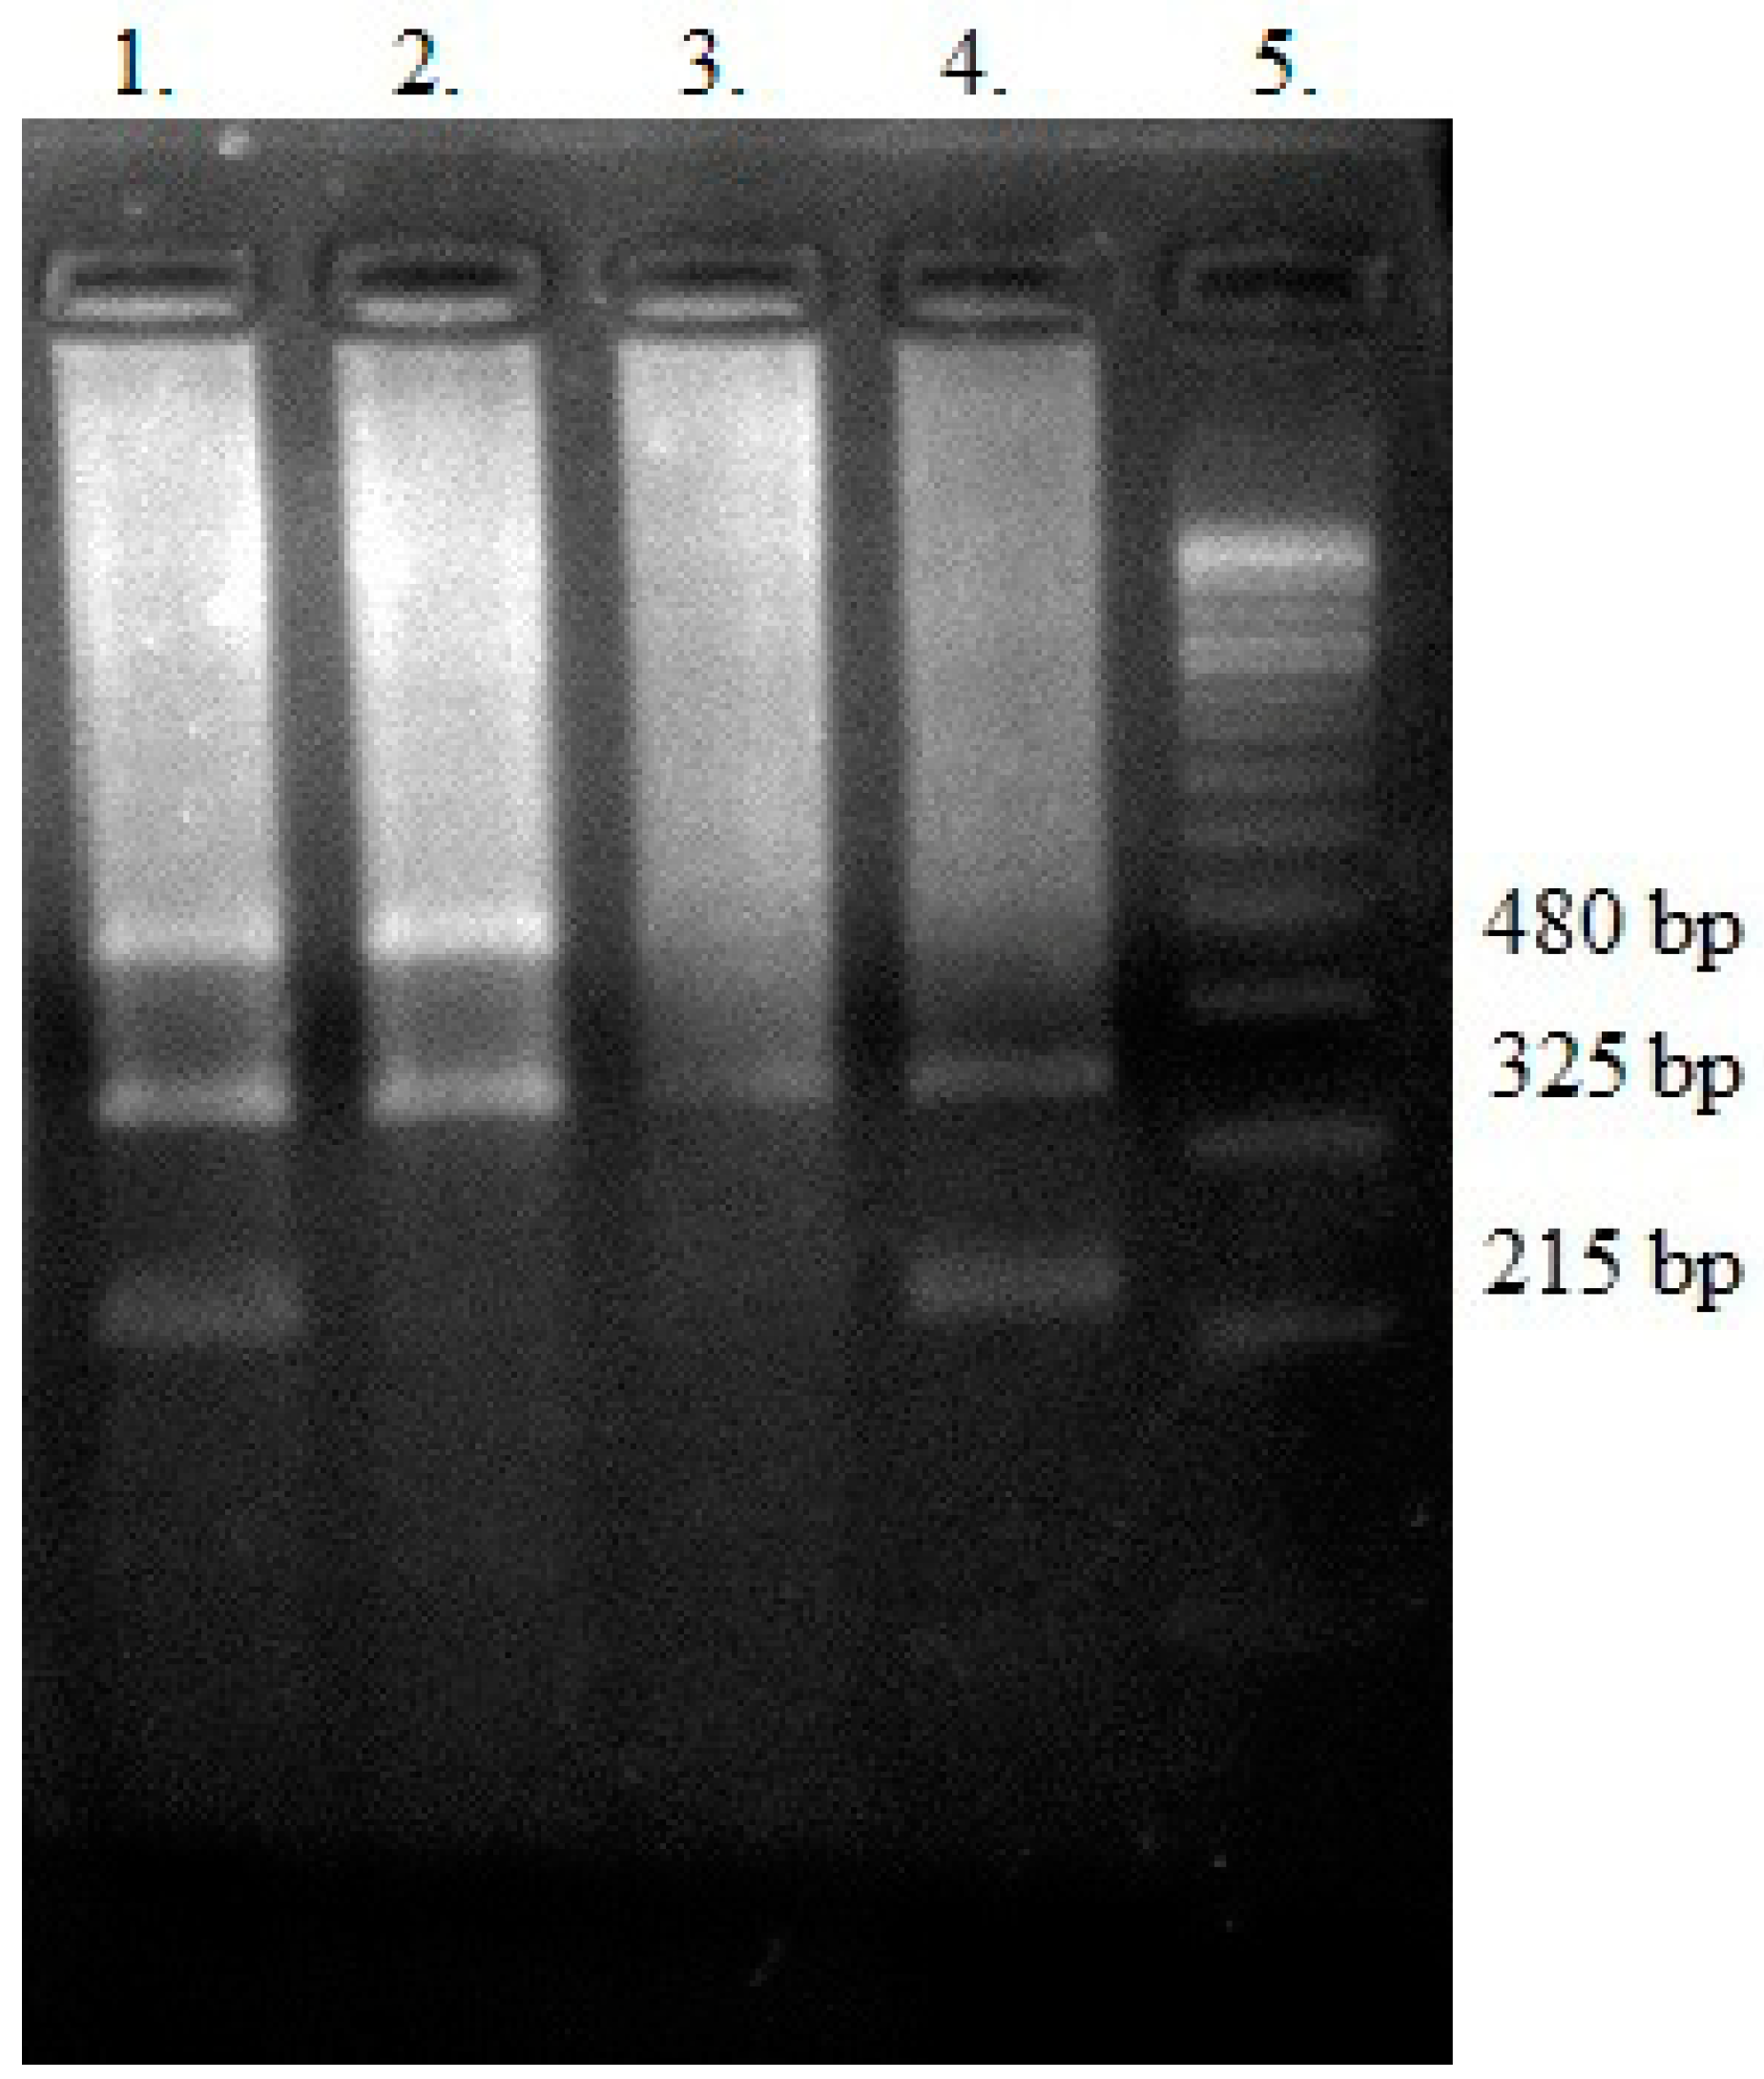
2.8. Genotyping—Polymerase Chain Reaction (PCR) Multiplex

For analysis of GSTT1 and GSTM1 polymorphisms, the multiplex PCR method was applied. The β-globin gene was used as an internal control. The primers and band sizes obtained via multiplex PCR were determined as previously described [13].
For the multiplex PCR, the protocol described by Abdel-Rahman et al. was used with minor modifications [14].
The PCR products were analyzed on 3% agarose gels, stained with SimplySafe (Eurx, Gdansk, Poland) and visualized in G:Box (Syngene, Cambridge, UK) (Figure 3). An independent PCR analysis was carried out for each sample.

2.9. Statistical Analysis

The laboratory values of MM patients with polymorphisms were compared using an independent t test for continuous variables and the chi-square test for categorical variables. The associations of the studied variants with prognostic factors were evaluated using the chi-square test or Fisher’s exact test (for expected values <5). The quantitative data are shown as the frequency or percentage. Deviation of genotype frequencies in controls and patients from Hardy-Weinberg equilibrium (HWE) was assessed by the chi-square test with Yates’s correction for the groups with <5 patients [15]. For the 95% confidence interval (CI), we assumed p = 0.05 and χ2 = 3.84; therefore, if χ2 ≤ 3.84 and the corresponding p ≥ 0.05, then the population was in HWE. Logistic regression was used to evaluate the fold change risk of MM. The Kaplan-Meier method and the log-rank test were used for survival analysis. We assumed a 5% error of inference, and a p-value < 0.05 indicated a statistically significant difference. Statistical analysis was performed using JASP 0.16.3 software.

3. Results

The present study included 180 individuals (80 MM patients and 100 healthy blood donors). The detailed clinical characteristics of the MM patients are shown in Table 1. In our in vitro study, bortezomib affected the number of viable, apoptotic, and necrotic cells (Table 2). Moreover, it changed the concentration of GSH, as well as glutathione enzymes.

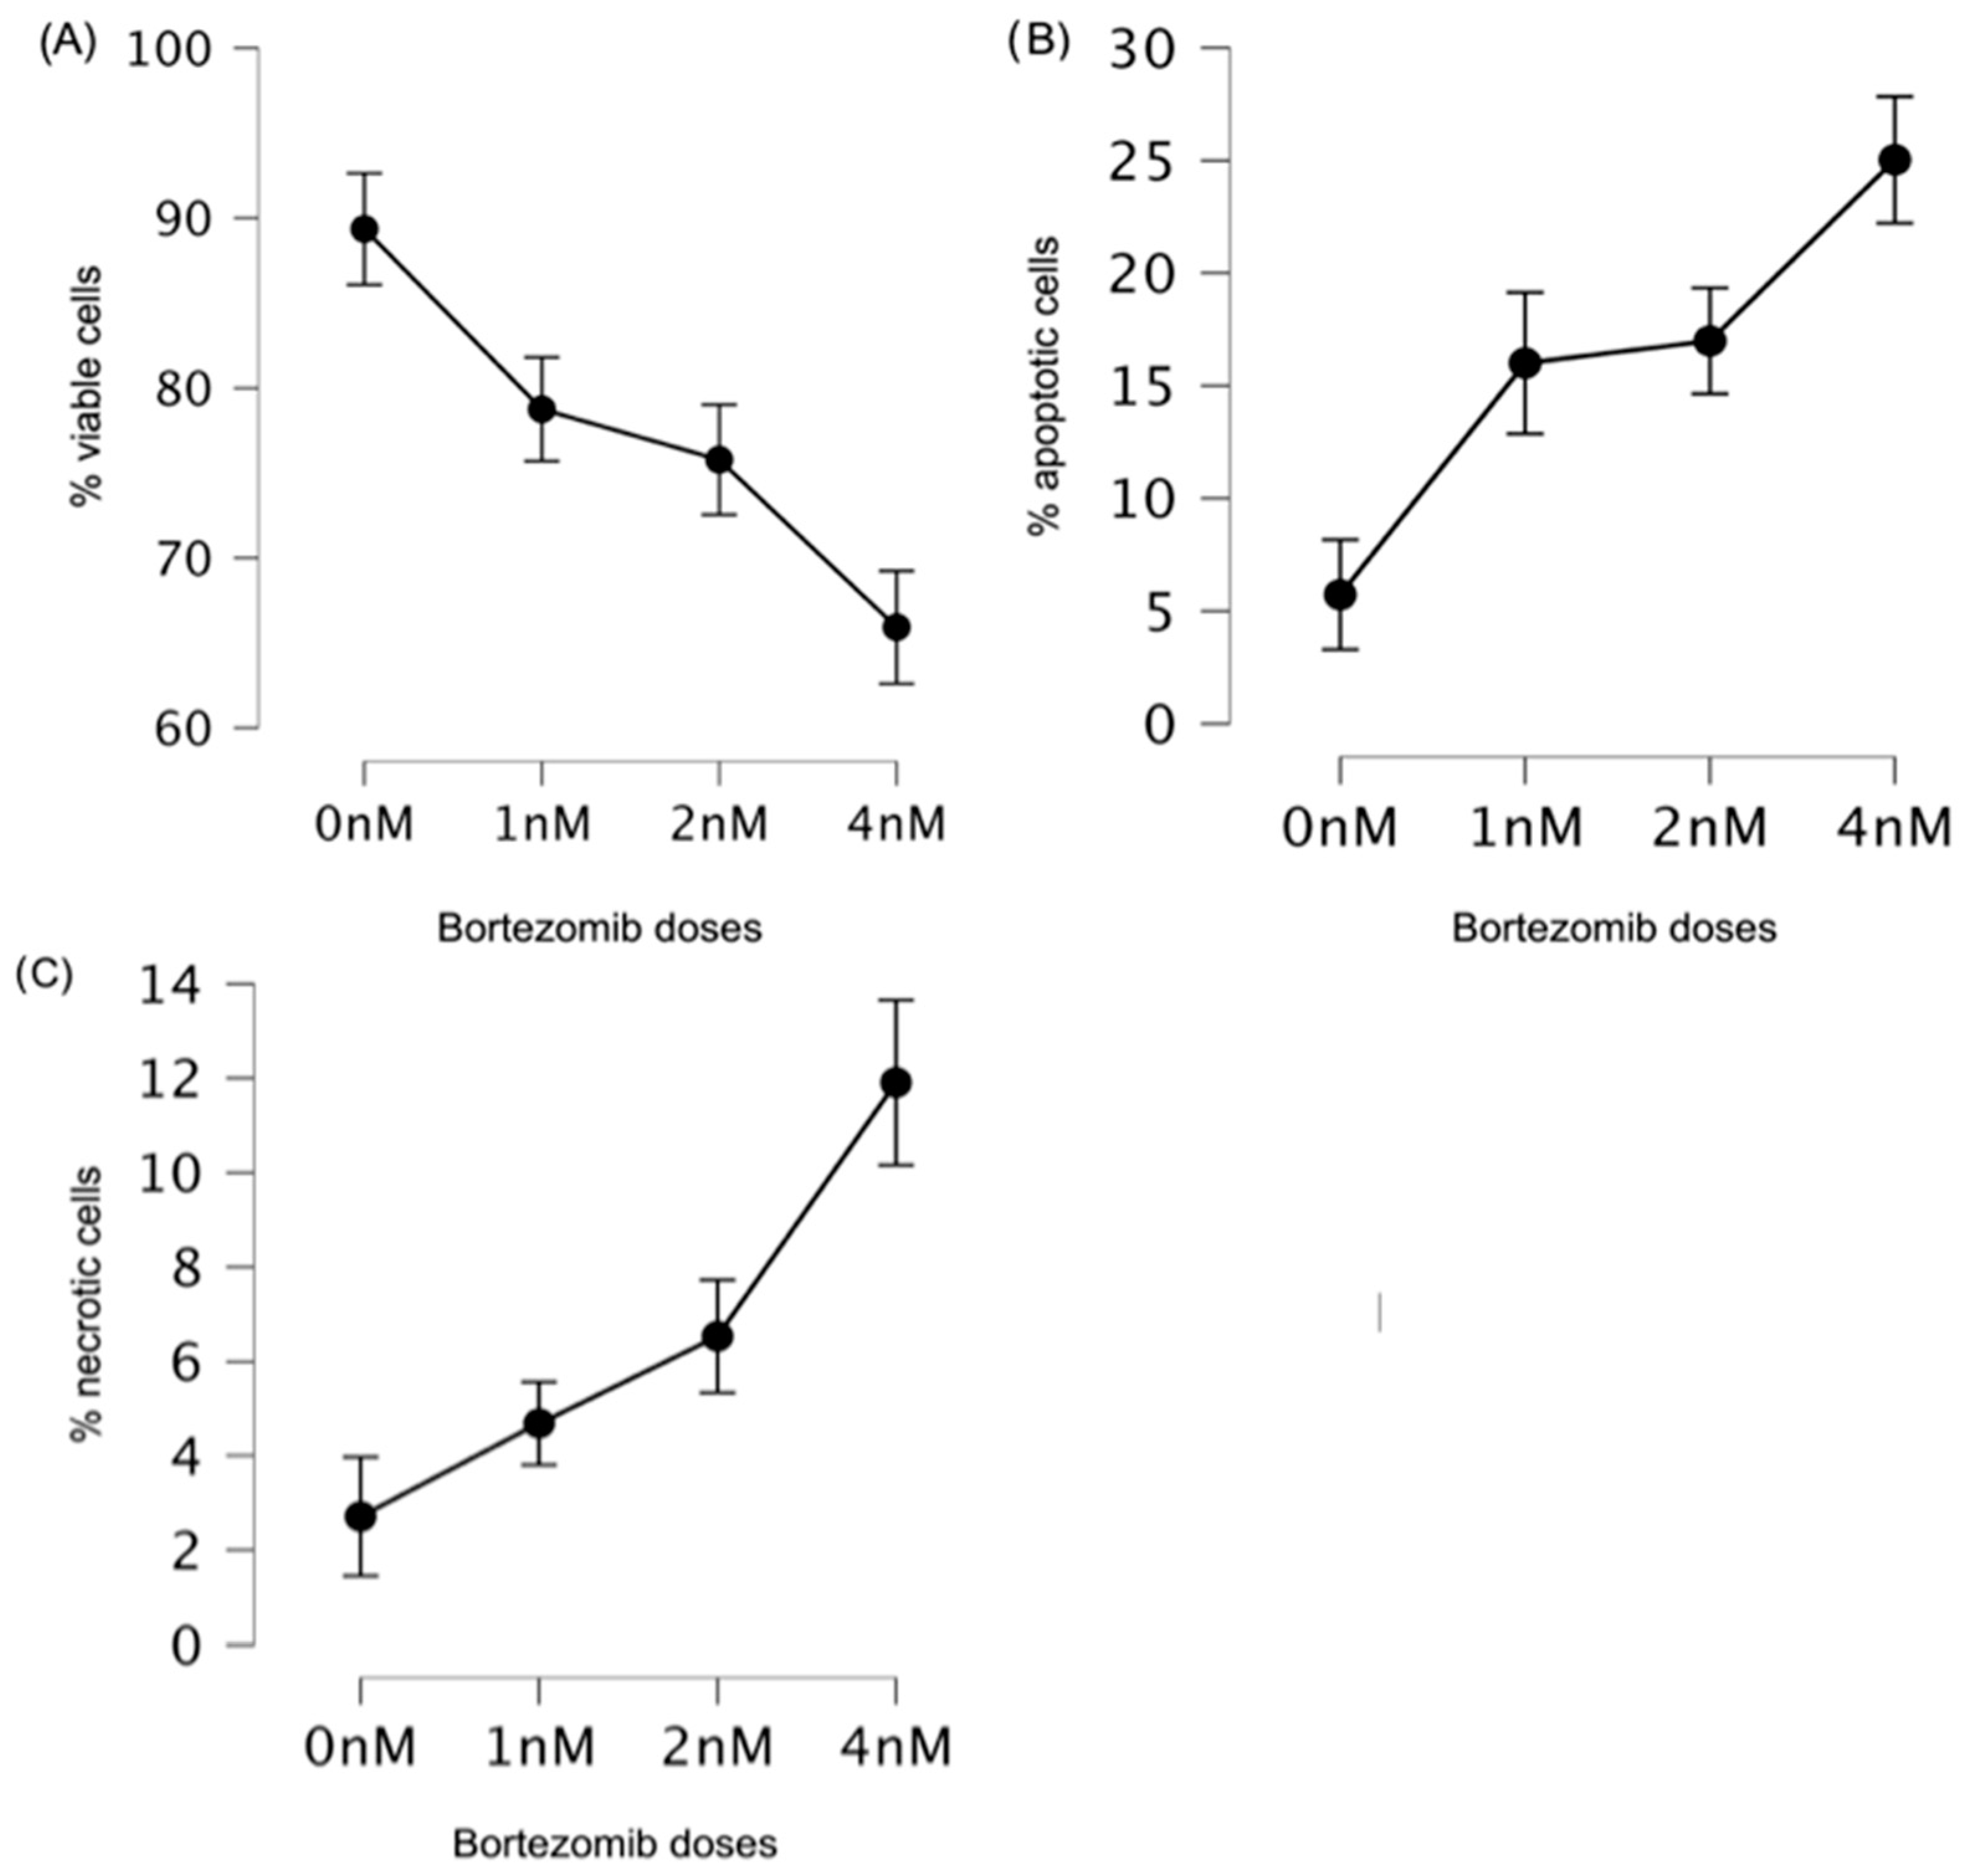
3.1. Low Doses of Bortezomib Decreased the Number of Viable Cells and Induced Apoptosis in Multiple Myeloma

The number of viable cells was assessed in a fluorescence microscopy test and in a trypan blue exclusion test of cell viability. We did not observe statistically significant results between results obtained in these two tests in control samples (89.36% ± 7.51% vs. 87.57% ± 6.88, p = 0.11), at 1 nM (78.75% ± 12.28% vs. 78.29% ± 14.17%, p = 0.82), at 2 nM (75.78% ± 12.64% vs. 76.69% ± 14.63%, p = 0.67), or at 4 nM of bortezomib (65.92% ± 12.78% vs. 69.94 ± 15.41%, p = 0.07, respectively). Considering that there were no significant differences in the two assays assessing cell viability, in further studies we included the number of viable cells assessed by fluorescence microscopy assay. Bortezomib significantly decreased the number of viable cells at all doses (1–4 nM) in comparison to the control (0 nM) (Figure 4A).
Compared to those of the control (0 nM), the results obtained at all bortezomib doses (1–4 nM) were significantly different (Table 3). The differences between doses of 1 nM and 4 nM, as well as between 2 nM and 4 nM were significant (p < 0.01). The difference between 1 nM vs. 2 nM doses was statistically insignificant (Table 3).
Moreover, bortezomib increased the number of apoptotic and necrotic cells (Figure 4B,C). Compared to those of the control (0 nM) and between the studied bortezomib doses (except 1 nM vs. 2 nM), the differences in the number of apoptotic cells were statistically significant (Table 4).
For necrotic cells, similar results were observed to those obtained when analyzing the number of apoptotic cells. The percentage of necrotic cells was lower than that of apoptotic cells, and no statistically significant differences were observed between the 0 nM and 1 nM doses or between the 1 nM and 2 nM doses (Table 5).

3.2. Differences in the Reduced Glutathione (GSH) Concentration between the Control (0 nM) and Bortezomib Treatment Groups (1 nM, 2 nM, and 4 nM)

Bortezomib did not significantly change the level of GSH (Table 6). Moreover, a difference at the level of tendency was observed in the GSH concentration between the control (0 nM) and 4 nM of bortezomib (p = 0.05) (Table 6).

3.3. Changes in Glutathione Enzyme Activities

Bortezomib significantly decreased GST activity at all bortezomib doses (Figure 5A, Table 7). For GR, the only significant difference was observed at a dose of 4 nM relative to the control (0 nM vs. 4 nM, p = 0.02) (Table 8). When analyzing the activity of GPx, we observed statistically significant differences between the control and 2 nM or 4 nM of bortezomib, as well as in the groups 1 nM vs. 4 nM and 2 nM vs. 4 nM (Table 9).

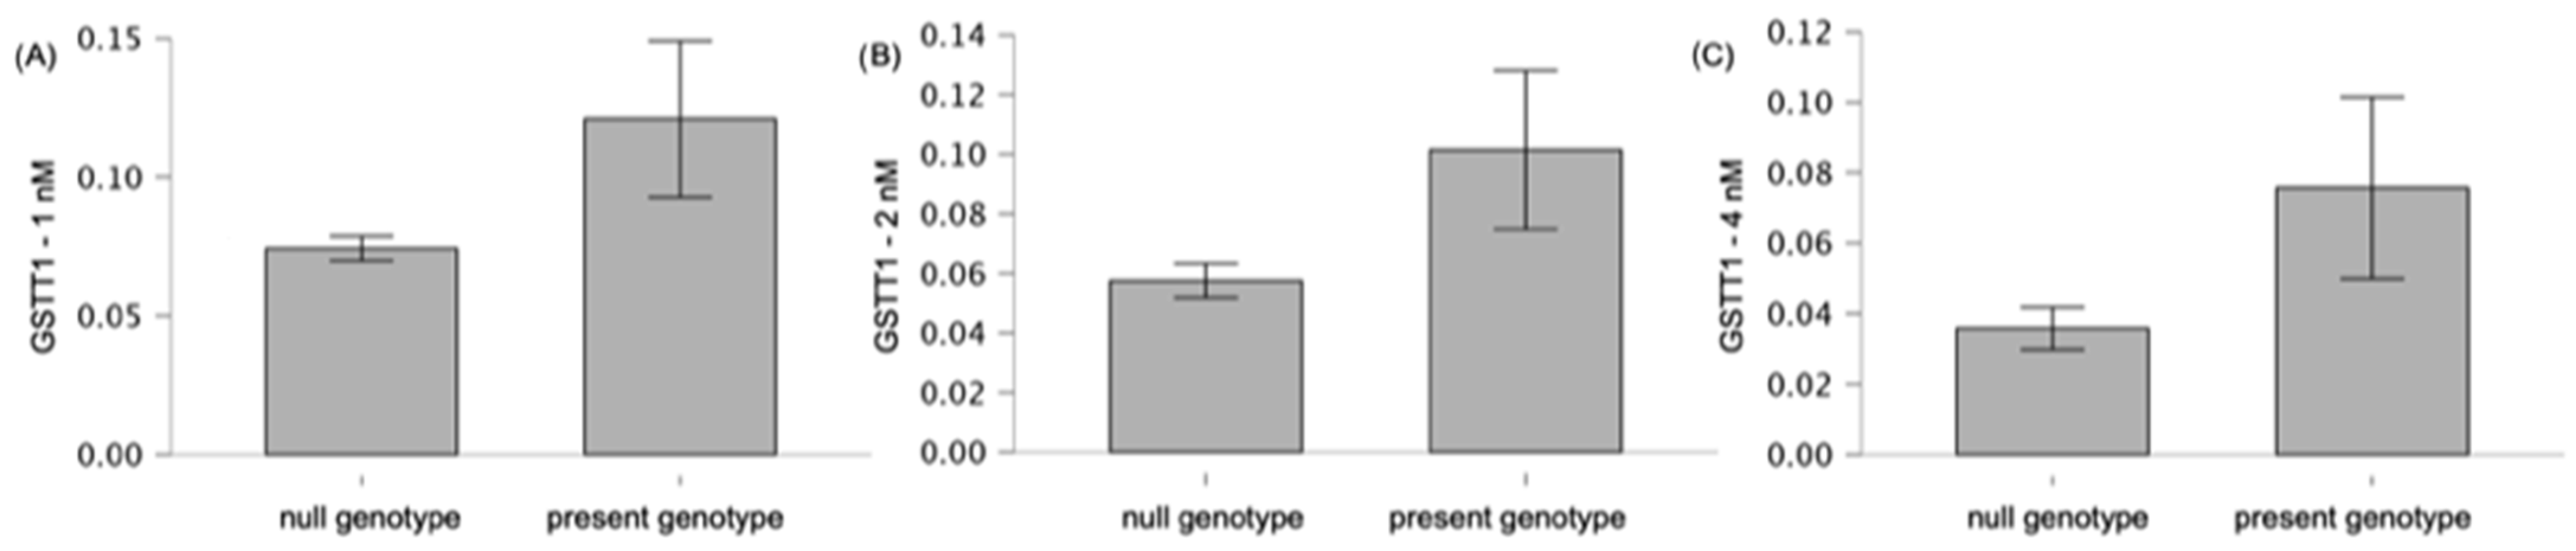
3.4. GSTT1 and GSTM1 Variants in the Context of the Analyzed Antioxidant Parameters

Genotyping was successful for all individuals investigated within the study. The HWE test confirmed that the genotypic frequencies (of GSTT1 and GSTM1) for healthy individuals (controls) and MM patients were balanced (Table 10). The allelic frequencies of both GST variants between the study and control groups were not significantly different.
We did not observe an association between the GSTT1 or GSTM1 variant alone (Table 11) or in combination (Table 12) and the risk of MM. Moreover, these variants were not associated with the presence of chromosomal aberrations in MM patients; OR = 0.85 (0.22–3.08 95%CI), p = 0.94 for GSTT1 variants, and OR = 0.36 (0.1–1.26 95%CI), p = 0.1 for GSTM1 variants.
We observed a statistically significant difference in the activity of GST at 1 nM and at 2 nM of bortezomib in the group with the null genotype of GSTT1 gene and the present genotype of the GSTT1 gene (null vs. present genotype); 0.07 vs. 0.12, p = 0.02 and 0.06 vs. 0.10, p = 0.02, respectively (Figure 6). In the case of 4 nM, a difference in GST activity (0.04 vs. 0.08 null genotype vs. present genotype, respectively) was observed at the level of tendency (p = 0.08).
Taking into account the variant of the GSTM1 gene (null genotype vs. present genotype), we found a statistically significant difference in GST activity at bortezomib doses of 4 nM (0.03 vs. 0.08, p = 0.01) (Figure 7). At the 2 nM dose, we observed a difference in GST activity between the null genotype and the present genotype of the GSTM1 gene, with a trend of 0.06 vs. 0.10, p = 0.08.
According to the log-rank test, we observed a difference in PFS at the level of tendency (p = 0.05) between the studied GSTM1 variants (Figure 8). We did not observe a significant relationship between the levels of GSH or glutathione enzymes or between the number of apoptotic/necrotic/viable cells and OS or PFS.

3.5. Correlations of the Analyzed Antioxidant Parameters

To determine the associations between variables, we used Spearman’s partial correlation analysis to account for the additional effect of the bortezomib dose. We did not find correlations between the studied antioxidant parameters and the number of apoptotic/necrotic/viable cells. These findings indicate that the observed changes in GSH concentration and enzyme activity are not the result of apoptosis and/or necrosis.
We observed statistically significant correlations between GSH levels and GR activity (rho = 0.34, p < 0.001), between GSH levels and GPx activity (rho = 0.29, p < 0.001), between GST levels and GR activity (rho = −0.20, p < 0.05), and between GPx and GR activity (rho = 0.18, p < 0.05).

4. Discussion

In our study, we analyzed the concentration of GSH and the activities of glutathione enzymes (GST, GR, GPx) taking into account GSTT1 and GSTM1 variants. Glutathione and its enzymes are among the many indicators of oxidative stress. To our knowledge, this is the first study analyzing the glutathione concentration and enzyme activities in the context of deletion variants in the GSTT1 and GSTM1 genes and the response to bortezomib treatment (in low doses) in cell cultures derived from MM patients.
Medical drugs that affect the function of the ubiquitin-proteasome system have improved MM treatment efficacy [16]. Bortezomib, a proteasome inhibitor, leads to the accumulation of intracellular unfolded proteins and increases cellular stress [17]. MM patients exhibit increased systemic oxidative stress [18]. Bortezomib promotes cell death via multiple pathways, including overproduction of ROS, which are recognized as important secondary messengers involved in the regulation of cell signaling [19,20]. The generation of ROS induces the initiation of bortezomib-induced apoptosis [21]. Changes in the concentration and activity of cellular antioxidants are associated with increased susceptibility to bortezomib-induced apoptosis [22]. In our study, bortezomib significantly decreased the number of viable cells and increased the number of apoptotic and necrotic cells, which is consistent with the findings of other researchers [13,16]. To analyze the role of the antioxidant network in MM, cells derived from patients were treated with low doses of bortezomib at concentrations of 1 nM, 2 nM, and 4 nM, as these concentrations ranged from 1 to 100 nM within the first 24 h after in vivo bortezomib treatment [23].
Cancer cells frequently exhibit altered oxidative metabolism, resulting in intracellular oxidative stress [24]. Therefore, redox-directed therapies that inhibit the activity of antioxidant enzymes and decrease the concentration of GSH have been suggested to induce cytotoxicity in cancer cells, including malignant plasma cells [25,26]. Bortezomib-resistant cells exhibit increased GSH concentrations [27]. Nerini-Molteni et al. analyzed the relationships between redox homeostasis and bortezomib treatment in MM cells [4]. They found that decreasing intracellular GSH enhances bortezomib toxicity. A similar effect was observed by Starheim et al. [16]. Antioxidants protect MM cells from bortezomib-mediated cell death [16]. Moreover, depletion of GSH can enhance the effect of bortezomib in MM cells [4]. Cells with higher GSH levels are also more resistant to apoptosis [28]. A decrease in GSH levels impairs the antioxidant system and leads to an increase in ROS production [29]. The accumulation of ROS induces mitochondrial damage and apoptosis [29]. In turn, an increase in the GSH concentration is associated with cancer development [30]. Stimulation of GSH synthesis can inhibit apoptosis [31]. Hentze et al. reported that cancer cells have a greater GSH pool than normal tissue, which induces drug resistance [32]. In our study, we did not observe significant differences in GSH concentrations in samples treated with different bortezomib doses. This drug may increase the number of apoptotic cells, probably through a mechanism not associated with GSH levels. Furthermore, the dose of bortezomib used in the experiment may have been too low to disrupt glutathione homeostasis.
The antioxidant system includes a variety of enzymes, such as GSTs, GR, and GPx.
The GST enzymes play important roles in protecting genomic and cellular structures against ROS [9]. These enzymes eliminate toxic carcinogens [7,9]. In the present study, we observed a decrease in GST activity in cell cultures with increasing bortezomib doses. Moreover, taking into account the GSTT1 and GSTM1 variants, we found that, at some bortezomib doses, GST activity was lower in patients with null genotypes. In genes encoding GSTs, polymorphic changes in the form of deletions were described, with these variants affecting enzyme activity [33]. Deletion of GST alleles results in a lack of enzyme activity. This may increase the level of carcinogens and ROS, affecting the sequence of genes regulating cell cycle progression. In the case of GST present/null genotypes, we did not find an impact on MM risk, in contrast to our previous study on a larger MM patient group [13]. Moreover, in our previous study, individuals with the GSTT1-null or with both the GSTT1-null and GSTM1-null genotypes showed a greater risk for MM development than patients with non-deleted GSTT1/GSTM1 genotypes. These findings are consistent with those obtained for hematological malignancies by other researchers [34,35,36]. Chen et al. found that the GSTM1-null genotype in combination with the CYP1A1 and CYP2D6 heterozygous mutant genotypes was associated with an elevated risk of acute non-lymphoblastic leukemia [11]. Yuille et al., in the study of GSTM1, GSTT1, and GSTP1 variants in chronic lymphocytic leukemia (CLL), observed an association between the GSTM1-null and GSTT1-null genotypes and the risk of CLL [37]. In the present study, we did not find an association between GSTM1/GSTT1 variants and increased MM risk. This may be due to the low number of individuals included in the study.
In neuroblastoma cells, increased GPx activity promoted cytoprotection against proteasome inhibitors [38]. In our study, we observed a decrease in GPx activity at most bortezomib doses, which may prevent bortezomib resistance. GPx is critical for maintaining survival during oxidative stress [39]. Increased GPx activity can aid in maintaining the net redox state within malignant cells as a result of chemotherapy [26]. Bortezomib-resistant MM cells exhibit increased GPx activity [40,41].
A limitation of our study is the relatively small sample size, in part due to the low incidence of MM. We found spontaneous apoptosis and necrosis in cell cultures without bortezomib, which may be due to laboratory conditions, including the culture media used. In our next study, AIM-V media should be used instead of RPMI media supplemented with 10% FCS. RMPI and FCS can induce apoptosis in B cells [42]. Additionally, the present study was carried out on commercially available MM cell lines. Unfortunately, these lines do not contain all the studied GSTT1 and GSTM1 gene variants. Alternatively, we can attempt an antisense strategy to block the expression of GSTT1/GSTM1 variants (similar to null genotypes). In addition, assessment of apoptosis could have been performed using flow cytometry. Unfortunately, this method was not available for us when we performed the experiment. Furthermore, before assessing apoptosis, we had attempted to isolate plasmocytes by magnetic method but the percentage of cells with spontaneous apoptosis was very high (>80%). Therefore, we abandoned this method and evaluated the morphology of plasmocytes using microscopy.

5. Conclusions

In conclusion, our data provide evidence that low-bortezomib doses decrease the activities of GST and GPx. Moreover, lower GST was associated with the null genotypes of GSTT1 and GSTM1 variants but only at some doses of bortezomib. Further analysis of a larger group of MM patients is recommended to confirm or negate the data we obtained.

Author Contributions

S.Z., S.P.-M. and G.S.-K. carried out the experiment and performed the molecular and biochemical analyses. S.C. prepared the cytogenetic data. S.Z., J.C.-M. and G.S.-K. were involved in planning and supervised the work. W.S., S.Z. and A.S.-S. processed the experimental and clinical data and performed the analysis. S.Z., W.S., B.B. and G.S.-K. designed the figures and tables. S.P.-M., S.C., A.S.-S. and J.C.-M. wrote the manuscript with support from S.Z. All authors have read and agreed to the published version of the manuscript.

Funding

This research was funded by grant number SUPB.RN.21.234 (J.C.-M.).

Institutional Review Board Statement

This study obtained positive opinions from the Bioethics Committee at the Medical University of Lublin (No. KE-0254/165/2013, No. KE-0254/337/2016) and the Bioethics Committee at Jan Kochanowski University of Kielce (No. KB-41/2016), in accordance with the ethical standards established by the Helsinki Declaration. All methods were performed in accordance with the relevant guidelines and regulations. All procedures performed in studies involving human participants were in accordance with the ethical standards of the institutional and/or national research committee, and with the 1964 Helsinki declaration and its later amendments or comparable ethical standards.

Informed Consent Statement

Written informed consent was obtained from all subjects involved in the study.

Data Availability Statement

The clinical data used to support the findings of this study are available from the corresponding author upon request.

Acknowledgments

Special thanks to Paul Dudek for proofreading and editing assistance, as well as substantive verification.

Conflicts of Interest

The authors declare no conflicts of interest.

References

  1. Shapiro-Shelef, M.; Calame, K. Plasma Cell Differentiation and Multiple Myeloma. Curr. Opin. Immunol. 2004, 16, 226–234. [Google Scholar] [CrossRef]
  2. Corre, J.; Munshi, N.; Avet-Loiseau, H. Genetics of Multiple Myeloma: Another Heterogeneity Level? Blood 2015, 125, 1870–1876. [Google Scholar] [CrossRef] [PubMed]
  3. Radi, E.; Formichi, P.; Battisti, C.; Federico, A. Apoptosis and Oxidative Stress in Neurodegenerative Diseases. J. Alzheimer’s Dis. 2014, 42, S125–S152. [Google Scholar] [CrossRef] [PubMed]
  4. Nerini-Molteni, S.; Ferrarini, M.; Cozza, S.; Caligaris-Cappio, F.; Sitia, R. Redox Homeostasis Modulates the Sensitivity of Myeloma Cells to Bortezomib. Br. J. Haematol. 2008, 141, 494–503. [Google Scholar] [CrossRef] [PubMed]
  5. Zimmermann, A.K.; Loucks, F.A.; Schroeder, E.K.; Bouchard, R.J.; Tyler, K.L.; Linseman, D.A. Glutathione Binding to the Bcl-2 Homology-3 Domain Groove. J. Biol. Chem. 2007, 282, 29296–29304. [Google Scholar] [CrossRef]
  6. Circu, M.L.; Yee Aw, T. Glutathione and Apoptosis. Free Radic. Res. 2008, 42, 689–706. [Google Scholar] [CrossRef]
  7. Allocati, N.; Masulli, M.; Di Ilio, C.; Federici, L. Glutathione Transferases: Substrates, Inihibitors and pro-Drugs in Cancer and Neurodegenerative Diseases. Oncogenesis 2018, 7, 8. [Google Scholar] [CrossRef]
  8. Su, D.; Wang, X.; Campbell, M.R.; Song, L.; Safi, A.; Crawford, G.E.; Bell, D.A. Interactions of Chromatin Context, Binding Site Sequence Content, and Sequence Evolution in Stress-Induced P53 Occupancy and Transactivation. PLoS Genet. 2015, 11, e1004885. [Google Scholar] [CrossRef]
  9. Singh, M.S.; Michael, M. Role of Xenobiotic Metabolic Enzymes in Cancer Epidemiology. In Cancer Epidemiology; Humana Press: Totowa, NJ, USA, 2009; pp. 243–264. [Google Scholar]
  10. Curtin, N.J. DNA Repair Dysregulation from Cancer Driver to Therapeutic Target. Nat. Rev. Cancer 2012, 12, 801–817. [Google Scholar] [CrossRef]
  11. Chen, H.; Hu, W.; Liu, Q.; Li, W.; Chen, F.; Rao, Z.; Liu, X.; Luo, Y.; Cao, Y. Genetic Polymorphisms of Metabolic Enzymes CYP1A1, CYP2D6, GSTM1 and GSTT1 and Leukemia Susceptibility. Eur. J. Cancer Prev. 2008, 17, 251–258. [Google Scholar] [CrossRef]
  12. Lowry, R.W.; Rosebrough, G.H.; Furr, A.L.; Randall, R.J. Protein Measurement with the Folin Phenol Reagent. J. Biol. Chem. 1951, 193, 265–275. [Google Scholar] [CrossRef]
  13. Zmorzyński, S.; Popek-Marciniec, S.; Szudy-Szczyrek, A.; Wojcierowska-Litwin, M.; Korszeń-Pilecka, I.; Chocholska, S.; Styk, W.; Hus, M.; Filip, A.A. The Association of GSTT1, GSTM1, and TNF-α Polymorphisms with the Risk and Outcome in Multiple Myeloma. Front. Oncol. 2019, 9, 1056. [Google Scholar] [CrossRef] [PubMed]
  14. Abdel-Rahman, S.Z.; El-Zein, R.A.; Anwar, W.A.; Au, W.W. A Multiplex PCR Procedure for Polymorphic Analysis of GSTM1 and GSTT1 Genes in Population Studies. Cancer Lett. 1996, 107, 229–233. [Google Scholar] [CrossRef] [PubMed]
  15. Preacher, K.J. Calculation for the Chi-Square Test: An Interactive Calculation Tool for Chi-Square Tests of Goodness of Fit and Independence. Available online: http://quantpsy.org/ (accessed on 15 December 2023).
  16. Starheim, K.K.; Holien, T.; Misund, K.; Johansson, I.; Baranowska, K.A.; Sponaas, A.-M.; Hella, H.; Buene, G.; Waage, A.; Sundan, A.; et al. Intracellular Glutathione Determines Bortezomib Cytotoxicity in Multiple Myeloma Cells. Blood Cancer J. 2016, 6, e446. [Google Scholar] [CrossRef] [PubMed]
  17. Kane, R.C.; Farrell, A.T.; Sridhara, R.; Pazdur, R. United States Food and Drug Administration Approval Summary: Bortezomib for the Treatment of Progressive Multiple Myeloma after One Prior Therapy. Clin. Cancer Res. 2006, 12, 2955–2960. [Google Scholar] [CrossRef]
  18. Sharma, A.; Tripathi, M.; Satyam, A.; Kumar, L. Study of Antioxidant Levels in Patients with Multiple Myeloma. Leuk. Lymphoma 2009, 50, 809–815. [Google Scholar] [CrossRef] [PubMed]
  19. Obeng, E.A. Proteasome Inhibitors Induce a Terminal Unfolded Protein Response in Multiple Myeloma Cells. Blood 2006, 107, 4907–4916. [Google Scholar] [CrossRef]
  20. Holmström, K.M.; Finkel, T. Cellular Mechanisms and Physiological Consequences of Redox-Dependent Signalling. Nat. Rev. Mol. Cell Biol. 2014, 15, 411–421. [Google Scholar] [CrossRef]
  21. Perez-Galan, P. The Proteasome Inhibitor Bortezomib Induces Apoptosis in Mantle-Cell Lymphoma through Generation of ROS and Noxa Activation Independent of P53 Status. Blood 2006, 107, 257–264. [Google Scholar] [CrossRef]
  22. Cong, H.; Xu, L.; Wu, Y.; Qu, Z.; Bian, T.; Zhang, W.; Xing, C.; Zhuang, C. Inhibitor of Apoptosis Protein (IAP) Antagonists in Anticancer Agent Discovery: Current Status and Perspectives. J. Med. Chem. 2019, 62, 5750–5772. [Google Scholar] [CrossRef]
  23. Reece, D.E.; Sullivan, D.; Lonial, S.; Mohrbacher, A.F.; Chatta, G.; Shustik, C.; Burris, H.; Venkatakrishnan, K.; Neuwirth, R.; Riordan, W.J.; et al. Pharmacokinetic and Pharmacodynamic Study of Two Doses of Bortezomib in Patients with Relapsed Multiple Myeloma. Cancer Chemother. Pharmacol. 2011, 67, 57–67. [Google Scholar] [CrossRef] [PubMed]
  24. Aykin-Burns, N.; Ahmad, I.M.; Zhu, Y.; Oberley, L.W.; Spitz, D.R. Increased Levels of Superoxide and H2O2 Mediate the Differential Susceptibility of Cancer Cells versus Normal Cells to Glucose Deprivation. Biochem. J. 2009, 418, 29–37. [Google Scholar] [CrossRef]
  25. Trachootham, D.; Alexandre, J.; Huang, P. Targeting Cancer Cells by ROS-Mediated Mechanisms: A Radical Therapeutic Approach? Nat. Rev. Drug Discov. 2009, 8, 579–591. [Google Scholar] [CrossRef] [PubMed]
  26. Salem, K.; McCormick, M.L.; Wendlandt, E.; Zhan, F.; Goel, A. Copper–Zinc Superoxide Dismutase-Mediated Redox Regulation of Bortezomib Resistance in Multiple Myeloma. Redox Biol. 2015, 4, 23–33. [Google Scholar] [CrossRef] [PubMed]
  27. Schafer, F.Q.; Buettner, G.R. Redox Environment of the Cell as Viewed through the Redox State of the Glutathione Disulfide/Glutathione Couple. Free Radic. Biol. Med. 2001, 30, 1191–1212. [Google Scholar] [CrossRef]
  28. Akhigbe, R.E.; Oluwole, D.T.; Adegoke, T.E.; Hamed, M.A.; Anyogu, D.C.; Ajayi, A.F. Suppression of Glutathione System and Upregulation of Caspase 3-Dependent Apoptosis Mediate Rohypnol-Induced Gastric Injury. Redox Rep. 2022, 27, 111–118. [Google Scholar] [CrossRef]
  29. Robaczewska, J.; Kedziora-Kornatowska, K.; Kozakiewicz, M.; Zary-Sikorska, E.; Pawluk, H.; Pawliszak, W.; Kedziora, J. Role of Glutathione Metabolism and Glutathione-Related Antioxidant Defense Systems in Hypertension. J. Physiol. Pharmacol. 2016, 67, 331–337. [Google Scholar]
  30. Harris, I.S.; Treloar, A.E.; Inoue, S.; Sasaki, M.; Gorrini, C.; Lee, K.C.; Yung, K.Y.; Brenner, D.; Knobbe-Thomsen, C.B.; Cox, M.A.; et al. Glutathione and Thioredoxin Antioxidant Pathways Synergize to Drive Cancer Initiation and Progression. Cancer Cell 2015, 27, 211–222. [Google Scholar] [CrossRef]
  31. Lv, H.; Zhen, C.; Liu, J.; Yang, P.; Hu, L.; Shang, P. Unraveling the Potential Role of Glutathione in Multiple Forms of Cell Death in Cancer Therapy. Oxid. Med. Cell. Longev. 2019, 2019, 3150145. [Google Scholar] [CrossRef]
  32. Hentze, H.; Schmitz, I.; Latta, M.; Krueger, A.; Krammer, P.H.; Wendel, A. Glutathione Dependence of Caspase-8 Activation at the Death-Inducing Signaling Complex. J. Biol. Chem. 2002, 277, 5588–5595. [Google Scholar] [CrossRef]
  33. Takanashi, M.; Morimoto, A.; Yagi, T.; Kuriyama, K.; Kano, G.; Imamura, T.; Hibi, S.; Todo, S.; Imashuku, S. Impact of Glutathione S-Transferase Gene Deletion on Early Relapse in Childhood B-Precursor Acute Lymphoblastic Leukemia. Haematologica 2003, 88, 1238–1244. [Google Scholar]
  34. Faber, E.W.; Lourenço, G.J.; Ortega, M.M.; Lorand-Metze, I.; De Souza, C.A.; Lima, C.S.P. Polymorphisms of VEGF, GSTM1 and GSTT1 Genes in Multiple Myeloma Risk. Hematol. Oncol. 2012, 30, 105–107. [Google Scholar] [CrossRef]
  35. Zhou, L.; Zhu, Y.-Y.; Zhang, X.-D.; Li, Y.; Liu, Z.-G. Risk Effects of GST Gene Polymorphisms in Patients with Acute Myeloid Leukemia: A Prospective Study. Asian Pac. J. Cancer Prev. 2013, 14, 3861–3864. [Google Scholar] [CrossRef]
  36. Kim, H.N.; Kim, N.Y.; Yu, L.; Tran, H.T.T.; Kim, Y.-K.; Lee, I.-K.; Shin, M.-H.; Park, K.-S.; Choi, J.-S.; Kim, H.-J. Association of GSTT1 Polymorphism with Acute Myeloid Leukemia Risk Is Dependent on Smoking Status. Leuk. Lymphoma 2012, 53, 681–687. [Google Scholar] [CrossRef]
  37. Yuille, M.; Condie, A.; Hudson, C.; Kote-Jarai, Z.; Stone, E.; Eeles, R.; Matutes, E.; Catovsky, D.; Houlston, R. Relationship between Glutathione S-Transferase M1, T1, and P1 Polymorphisms and Chronic Lymphocytic Leukemia. Blood 2002, 99, 4216–4218. [Google Scholar] [CrossRef]
  38. Kalivendi, S.V.; Cunningham, S.; Kotamraju, S.; Joseph, J.; Hillard, C.J.; Kalyanaraman, B. α-Synuclein Up-Regulation and Aggregation during MPP+-Induced Apoptosis in Neuroblastoma Cells. J. Biol. Chem. 2004, 279, 15240–15247. [Google Scholar] [CrossRef]
  39. Michiels, C.; Raes, M.; Toussaint, O.; Remacle, J. Importance of SE-Glutathione Peroxidase, Catalase, and CU/ZN-SOD for Cell Survival against Oxidative Stress. Free Radic. Biol. Med. 1994, 17, 235–248. [Google Scholar] [CrossRef] [PubMed]
  40. Brigelius-Flohé, R.; Maiorino, M. Glutathione Peroxidases. Biochim. Biophys. Acta Gen. Subj. 2013, 1830, 3289–3303. [Google Scholar] [CrossRef] [PubMed]
  41. Brigelius-Flohé, R. Tissue-Specific Functions of Individual Glutathione Peroxidases. Free Radic. Biol. Med. 1999, 27, 951–965. [Google Scholar] [CrossRef] [PubMed]
  42. Sinha, S.; Boysen, J.; Nelson, M.; Secreto, C.; Warner, S.L.; Bearss, D.J.; Lesnick, C.; Shanafelt, T.D.; Kay, N.E.; Ghosh, A.K. Targeted Axl Inhibition Primes Chronic Lymphocytic Leukemia B Cells to Apoptosis and Shows Synergistic/Additive Effects in Combination with BTK Inhibitors. Clin. Cancer Res. 2015, 21, 2115–2126. [Google Scholar] [CrossRef] [PubMed]
Figure 1. Experiment overflow.
Genes 15 00387 g001
Figure 2. In vitro bortezomib treatment (at 4 nM). The apoptotic cells were stained with both AnnCy3 (red) and 6-CF (green). The cell at the top indicates early apoptosis. The cells in the middle and bottom panels indicate late apoptosis. For analysis, plasmocytes with a diameter of 9–12 μm were counted. The total magnification was 1500×. In this case, we observed: (I) 88.7% of viable cells, (II) 50.9% of apoptotic cells and 28% of necrotic cells.
Genes 15 00387 g002
Figure 3. Electropherogram of GSTT1 and GSTM1 variants. Lane 1 contains bands 480 bp (for GSTT1-present), 215 bp (for GSTM1-present), and 325 bp (for the internal control). Lane 2 shows a 480 bp band (GSTT1-present) and an internal control (325 bp). The lack of 215 bp indicates the GSTM1-null genotype. Lane 3 contains only a band for internal control (325 bp), indicating GSTT1-null and GSTM1-null genotypes. Lane 4 shows bands 325 bp for internal control and 215 bp (for GSTM1-present). The lack of 480 bp indicates the GSTT1-null genotype. Lane 5 is a ladder (100 bp).
Genes 15 00387 g003
Figure 4. Effect of bortezomib on cell survival. In most cases, bortezomib significantly (A) decreased the number of viable cells, (B) increased the number of apoptotic cells, and (C) increased the number of necrotic cells at all studied doses (1–4 nM). As a control, samples without bortezomib (0 nM) were used. The graphs with mean values (in %) and with 95% confidence interval (95%CI) were shown.
Genes 15 00387 g004
Figure 5. Differences in (A) GSH; and (B) GPx activities at all studied bortezomib doses (0–4 nM). As a control, samples without bortezomib (0 nM) were used. The graphs with mean values (in %) and with 95% confidence interval (95%CI) are shown.
Genes 15 00387 g005
Figure 6. Differences in GST activity (U·mg−1 protein) at (A) 1 nM (p = 0.02), (B) 2 nM (p = 0.02), and (C) 4 nM (p = 0.08) of bortezomib, according to the type of GSTT1 genotype (null vs. present). The graphs with mean values (in %) and with 95% confidence interval (95%CI) are shown.
Genes 15 00387 g006
Figure 7. Differences in GST activity (U·mg−1 protein) at (A) 1 nM (p = 0.16), (B) 2 nM (p = 0.08), and (C) 4 nM (p = 0.01) of bortezomib, according to the type of GSTM1 gene variant. The graphs with mean values (in %) and with 95% confidence interval (95%CI) are shown.
Genes 15 00387 g007
Figure 8. K-M analysis of PFS in the group of 80 MM patients with GSTM1 genotype (log-rank test p = 0.05).
Genes 15 00387 g008
Table 1. General characteristics of the MM patients.
VariablesMM Patients, n = 80
Sex
Male46
Female34
Age *
Mean age (years)66.95
Type of MM *
IgG44
IgA16
Light chain20
Free light chain ratio473
Stage according to the International Staging System *
I20
II16
III44
Renal failure *
No54
Yes26
Stage of kidney disease *
G118
G218
G3A12
G3B14
G410
G58
Plasma cells *
Percentage of plasma cells in bone marrow,
M ± SD
31.94 ± 21.21
Cytogenetic changes
No68
Yes
-including:
del17(p13.1)
t(4;14)
t(14;16)
12

8
6
2
Clinical values *
Albumins (g/dL),
M ± SD
3.55 ± 0.67
β2-microglobulin (mg/L),
M ± SD
6.93 ± 4.19
Calcium (mM/L),
M ± SD
2.41 ± 0.33
Hemoglobin (g/dL),
M ± SD
9.98 ± 1.96
Creatinine (mg/dL),
M ± SD
2.10 ± 2.26
C-reactive protein (mg/L),
M ± SD
10.03 ± 15.09
Chemotherapy
Cyclophosphamide, Thalidomide, Dexamethasone (CTD)60
Velcade, Cyclophosphamide,
Dexamethasone (VCD)
18
Velcade, Thalidomide,
Dexamethasone (VTD)
2
Survival
Progression free survival (months)
M ± SD
20.35 ± 16.57
Overall survival (months)
M ± SD
30.77 ± 20.48
* at diagnosis.
Table 2. Effect of bortezomib on cell survival.
Doses of BortezomibMean Values (%)SDSE
Viable cells *0 nM89.367.511.19
1 nM78.7512.281.94
2 nM75.7812.642.00
4 nM65.9212.782.02
Apoptotic cells0 nM5.735.230.83
1 nM16.0012.281.94
2 nM16.996.921.09
4 nM25.0311.121.76
Necrotic cells0 nM2.713.640.58
1 nM4.693.040.48
2 nM6.544.490.71
4 nM11.906.781.07
SD—standard deviation; SE—standard error; * assessed with fluorescence microscopy.
Table 3. Differences in the number of viable cells (%) between the control (without bortezomib, 0 nM) and bortezomib treatment groups (1 nM, 2 nM, and 4 nM).
Bortezomib DosesMean Difference (%)Cohen’s dp-Value
0 nM vs. 1 nM10.610.92<0.01
0 nM vs. 2 nM13.581.18<0.01
0 nM vs. 4 nM23.442.04<0.01
1 nM vs. 2 nM2.97-0.68
1 nM vs. 4 nM12.831.11<0.01
2 nM vs. 4 nM9.860.86<0.01
Table 4. Differences in the number of apoptotic cells (%) between the control (without bortezomib, 0 nM) and bortezomib treatment groups (1 nM, 2 nM, and 4 nM).
Bortezomib DosesMean Difference (%)Cohen’s dp-Value
0 nM vs. 1 nM−10.28−1.10<0.01
0 nM vs. 2 nM−11.26−1.20<0.01
0 nM vs. 4 nM−19.31−2.06<0.01
1 nM vs. 2 nM−0.99−0.110.79
1 nM vs. 4 nM−9.03−0.97<0.01
2 nM vs. 4 nM−8.04−0.86<0.01
Table 5. Differences in the number of necrotic cells (%) between the control (without bortezomib, 0 nM) and bortezomib treatment groups (1 nM, 2 nM, and 4 nM).
Bortezomib DosesMean Difference (%)Cohen’s dp-Value
0 nM vs. 1 nM−1.98−0.420.20
0 nM vs. 2 nM−3.83−0.81<0.01
0 nM vs. 4 nM−9.20−1.95<0.01
1 nM vs. 2 nM−1.85−0.390.27
1 nM vs. 4 nM−7.22−1.53<0.01
2 nM vs. 4 nM−5.37−1.14<0.01
Table 6. Differences in GSH concentration (µM/mg protein) between the control (0 nM) and bortezomib treatment groups (1 nM, 2 nM, and 4 nM).
Bortezomib DosesMean Difference (µM/mg Protein)Cohen’s dp-Value
0 nM vs. 1 nM0.04-0.90
0 nM vs. 2 nM0.04-0.91
0 nM vs. 4 nM0.070.530.05
1 nM vs. 2 nM0.01-1.00
1 nM vs. 4 nM0.03-1.00
2 nM vs. 4 nM0.03-1.00
Table 7. Differences in GST activity (U·mg−1 protein) between the control (0 nM) and bortezomib treatment groups (1 nM, 2 nM, and 4 nM).
Bortezomib DosesMean Difference (U·mg−1 Protein)Cohen’s dp-Value
0 nM vs. 1 nM0.010.09<0.01
0 nM vs. 2 nM0.030.24<0.01
0 nM vs. 4 nM0.050.44<0.01
1 nM vs. 2 nM0.020.15<0.01
1 nM vs. 4 nM0.040.35<0.01
2 nM vs. 4 nM0.020.20<0.01
Table 8. Differences in GR activity (U·mg−1 protein) between the control (0 nM) and bortezomib treatment groups (1 nM, 2 nM, and 4 nM).
Bortezomib DosesMean Difference (U·mg−1 Protein)Cohen’s dp-Value
0 nM vs. 1 nM−0.02-1.00
0 nM vs. 2 nM−0.04-1.00
0 nM vs. 4 nM−0.13−0.640.02
1 nM vs. 2 nM−0.02-1.00
1 nM vs. 4 nM−0.11−0.550.06
2 nM vs. 4 nM−0.09-0.26
Table 9. Differences in GPx activity (U·mg−1 protein) between the control (0 nM) and bortezomib treatment groups (1 nM, 2 nM, and 4 nM).
Bortezomib DosesMean Difference (U·mg−1 Protein)Cohen’s dp-Value
0 nM vs.1 nM0.020.160.96
0 nM vs. 2 nM0.050.43<0.01
0 nM vs. 4 nM0.100.83<0.01
1 nM vs. 2 nM0.030.260.15
1 nM vs. 4 nM0.080.67<0.01
2 nM vs. 4 nM0.050.40<0.01
Table 10. Hardy-Weinberg equilibrium for GST polymorphisms in the case and control groups according to expected (E) and observed (O) values.
Null (Homozygotes)Present (Heterozygotes)Present (Homozygotes)TotalHWE p-Value and χ2 *
CONTROLGSTT1
E31.949.218.9100p = 0.97, χ2 = 0.001
O324919100
CASE
E24.239.616.280p = 0.92, χ2 = 0.008
O24401680
CONTROLGSTM1
E39.746.613.7100p = 0.89, χ2 = 0.017
O404614100
CASE
E24.239.616.280p = 0.92, χ2 = 0.008
O24401680
* if χ2 ≤ 3.84 and the corresponding p ≥ 0.05, then the population is in HWE.
Table 11. Comparison of GST polymorphisms impact on the MM risk.
GenotypesMM Patients
n = 80
Controls
n = 100
OR95%CIp-Value
GSTT1
present5668referent--
null24321.010.58–2.080.77
GSTM1
present5660referent--
null24401.550.83–2.090.16
Table 12. The combined effect of GST polymorphisms on the MM risk.
GSTT1GSTM1MM Patients
n
Controls
n
OR95%CIp-Value
presentpresent4246R--
nullpresent14140.910.39–2.140.83
presentnull14221.430.65–3.160.37
nullnull10181.640.68–3.950.26
Disclaimer/Publisher’s Note: The statements, opinions and data contained in all publications are solely those of the individual author(s) and contributor(s) and not of MDPI and/or the editor(s). MDPI and/or the editor(s) disclaim responsibility for any injury to people or property resulting from any ideas, methods, instructions or products referred to in the content.

