Article

Identification, Classification, and Transcriptional Analysis of Rab GTPase Genes from Tomato (Solanum lycopersicum) Reveals Salt Stress Response Genes

by
Flavia Soto
,
Alex San Martín-Davison
,
Josselyn Salinas-Cornejo
,
José Madrid-Espinoza
and
Simón Ruiz-Lara
*
Laboratorio de Genómica Funcional, Instituto de Ciencias Biológicas, Universidad de Talca, Talca 3460000, Chile
*
Author to whom correspondence should be addressed.
Genes 2024, 15(4), 453; https://doi.org/10.3390/genes15040453
Submission received: 1 March 2024 / Revised: 27 March 2024 / Accepted: 30 March 2024 / Published: 3 April 2024
(This article belongs to the Section Plant Genetics and Genomics)

Abstract

:
Salinity in plants generates an osmotic and ionic imbalance inside cells that compromises the viability of the plant. Rab GTPases, the largest family within the small GTPase superfamily, play pivotal roles as regulators of vesicular trafficking in plants, including the economically important and globally cultivated tomato (Solanum lycopersicum). Despite their significance, the specific involvement of these small GTPases in tomato vesicular trafficking and their role under saline stress remains poorly understood. In this work, we identified and classified 54 genes encoding Rab GTPases in cultivated tomato, elucidating their genomic distribution and structural characteristics. We conducted an analysis of duplication events within the S. lycopersicum genome, as well as an examination of gene structure and conserved motifs. In addition, we investigated the transcriptional profiles for these Rab GTPases in various tissues of cultivated and wild tomato species using microarray-based analysis. The results showed predominantly low expression in most of the genes in both leaves and vegetative meristem, contrasting with notably high expression levels observed in seedling roots. Also, a greater increase in gene expression in shoots from salt-tolerant wild tomato species was observed under normal conditions when comparing Solanum habrochaites, Solanum pennellii, and Solanum pimpinellifolium with S. lycopersicum. Furthermore, an expression analysis of Rab GTPases from Solanum chilense in leaves and roots under salt stress treatment were also carried out for their characterization. These findings revealed that specific Rab GTPases from the endocytic pathway and the trans-Golgi network (TGN) showed higher induction in plants exposed to saline stress conditions. Likewise, disparities in gene expression were observed both among members of the same Rab GTPase subfamily and between different subfamilies. Overall, this work emphasizes the high degree of conservation of Rab GTPases, their high functional diversification in higher plants, and the essential role in mediating salt stress tolerance and suggests their potential for further exploration of vesicular trafficking mechanisms in response to abiotic stress conditions.

1. Introduction

Salt stress has a detrimental effect on plants, limiting their development and reproduction. Nearly 4.12 million km2 are affected by excessive salinity, equivalent to 6% of the global arable land, a problem that has been intensified by human activity and climate change [1]. It is estimated that 25% of arable land will be affected in the next 25 years, while by the end of the 21st century, South America, southern Australia, Mexico, south-west United States, and South Africa will be at risk of higher soil salinity caused by climate change [2]. In this context, it is important to find and characterize the determinants of the tolerance capacity of plants that allow the adverse effects of salinity to be avoided, as well as physiological or molecular mechanisms associated with the response and its adaptation to salt stress [3].
The tomato (Solanum lycopersicum) is a main crop, with great economic relevance and the largest global cultivation extent. Native to South America, its fruit is highly prized in world markets for both fresh or processed consumption. Also, it is recognized as a model species in genetics and research associated with different studies, including stress tolerance mechanisms [4]. Its moderately sensitive tolerance capacity to salt stress classifies it as a glycophyte species. At a physiological level, salt stress leads to decreased germination capacity, reduced osmotic potential, and diminished development of roots, leaves, flowers, and fruits due to inhibition of cell division and elongation [5]. At the biochemical level, salt-induced overproduction of reactive oxygen species (ROS) results in damage to key cellular components, such as proteins, lipids, and nucleic acids [5]. To counteract these adverse effects, the production of compatible osmolytes and the activation of the antioxidant system are essential to maintain cellular integrity. Significant progress has been made in understanding more sophisticated subcellular mechanisms of tolerance in tomato plants. Recent research has revealed that cellular damage repair systems and ion compartmentalization, based on vesicle trafficking, play a fundamental role in adaptation to saline conditions [6,7,8]. These emerging mechanisms provide a more comprehensive understanding of how plants respond and adapt to saline environments, opening new perspectives for genetic improvement strategies and agricultural practices that promote stress tolerance in tomato crops.
Intracellular vesicular trafficking is directed by a family of proteins known as Rab GTPases. These constitute the largest family within the superfamily of small GTPases involved in the formation, transport, docking, and fusion of vesicles. Functioning as molecular switches, Rab GTPases cycle between the “active” and “inactive” state, a dynamic process linked to the binding and hydrolysis of GTP. This mechanism involves collaboration with other proteins such as GEF, GAP, and GDI [9,10,11,12].
Under salt stress conditions, response mechanisms are activated that seek to protect and change damaged structures. This requires the removal of damaged molecules in different cellular compartments and their subsequent replacement by new ones. Transport to and from specific compartments for recycling and elimination of macromolecules occurs through an intracellular vesicular trafficking system. While vesicular trafficking has conventionally been viewed as a fundamental process in both animals and plants; primarily involved in the transport and renewal of cellular structures, there is mounting evidence suggesting its pivotal role in stress adaptation [13,14,15,16,17,18]. For instance, research has demonstrated that a mutation in RabF2b of the endocytic pathway enhances salt stress tolerance [14], while RabA1 from the TGN and PM pathway is essential for salinity tolerance in Arabidopsis thaliana [15].
The role of vesicular traffic in maintaining ionic homeostasis includes the following key functions: (1) releasing transporters attached to the tonoplast or plasma membrane, relocating channels, and facilitating ATP-driven pumps directly involved in the ion transport process [19]; (2) transporting of cargo proteins to specific organelles [20]; and (3) recycling stress signals [21] or replacing other membrane components [22] that mediate in osmotic stress responses. Therefore, an increase in the efficiency of protein trafficking technology, such as anchoring, fusion, and recycling, is expected to positively impact plant adaptations to high-salinity environments.
In vivo and in vitro experiments have demonstrated the role of this class of proteins in intracellular membrane trafficking [10,15]. ARA6 modulates the assembly of a SNARE complex distinct from the conventional RAB5 and has a functional role in response to salinity stress in A. thaliana. In plants, there is a unique trafficking pathway mediated by this Rab GTPase [23,24]. ARA6 (AtRabF1) was subsequently shown to be involved in salt stress tolerance and dark-induced senescence [25]. Another gene of this family, Rab5, was studied in mango (Mangifera indica), where it was found that MiRab5 expression increased during the later stages of fruit ripening. In addition, MiRab5 was generally up-regulated in response to various abiotic stresses (cold, salinity, and PEG treatments) [26]. In A. thaliana, members of the RabA (RabA1a-d) subfamily, involved in the Trans Golgi Network (TGN), are required for salt stress tolerance, and their function has been described as redundant [15]. Overexpression of the Rab7 gene from Pennisetum glaucum, a relatively abiotic stress-tolerant species, enhanced NaCl tolerance in transgenic tobacco [27].
Additionally, given the specific distribution of Rab GTPases in the different cell membranes, it was hypothesized that Rab GTPases, along with SNARE proteins, provide specificity for membrane fusion events [10]. Vernoud et al. [28] identified 57 isoforms of Rab GTPases, which they named AtRab GTPases, and grouped them into eight subfamilies (AtRabA–AtRAbH) according to the subfamilies found in other organisms such as humans and yeast [29].
For this work, we identified 54 Rab GTPases from S. lycopersicum, classified them into eight subfamilies, and analyzed their transcriptional profiles in cultivated and wild tomato species. Additionally, we determined the expression profile of 10 representative Rab GTPases genes of each subfamily in the halophyte species Solanum chilense under salt stress conditions. Altogether, this evidence suggests the potential utility of Rab GTPases from S. chilense for future overexpression studies in S. lycopersicum to improve its tolerance to abiotic stress.

2. Materials and Methods

2.1. Identification of Rab GTPases in the S. lycopersicum Genome

A. thaliana Rab GTPase sequences obtained in the TAIR database (http://www.arabidopsis.org/, accessed on 29 February 2024) were used to search the genome of S. lycopersicum using the BLAST program integrated into the SolGenomics website http://solgenomics.net/tools/blast/index.pl (accessed on 10 October 2023). Of the sequences obtained, the duplicates were eliminated and analyzed in search of recognizable domains using the SMART site http://smart.embl-heidelberg.de/ (accessed on 20 October 2023), based on HMMER and the InterPro website https://www.ebi.ac.uk/interpro/ (accessed on 30 October 2023). For each Rab sequence found in the S. lycopersicum genome, the chromosome to which it belongs, the start and end positions in the genome, the strand in which it is found, and the size of the protein were determined. The isoelectric point (pI) and molecular weight (MW) were predicted using the Expasy Compute pI/Mw tool http://web.expasy.org/compute_pi/ (accessed on 10 November 2023). Values of hydropathy (GRAVY value) were calculated using the Expasy ProtParam tool http://expasy.org/tools/protparam.html (accessed on 14 November 2023). In addition, the subcellular locations were determined using CELLO V2.5 http://cello.life.nctu.edu.tw (accessed on 24 November 2023) and Wolf PSORT https://wolfpsort.hgc.jp (accessed on 26 November 2023) tools. For phylogenetic analysis, the sequences obtained were aligned with ClustalO https://www.ebi.ac.uk/jdispatcher/msa/clustalo (accessed on 28 November 2023), and subsequently, the MEGA 7 program https://www.megasoftware.net/ (accessed on 29 November 2023) was used for the construction of the tree using the Neighbor-Joining method and 1000 bootstrap replications.

2.2. Structure of Rab Genes and Conserved Motifs in Rab Proteins

Intron–exon distribution of putative Rab GTPases from S. lycopersicum was illustrated using the Gene Structure Display Server (GSDS) http://gsds.gao-lab.org/ (accessed on 14 October 2023), using the information available for each sequence in SolGenomics. Web LoGo https://weblogo.berkeley.edu/ (accessed on 17 October 2023) was used for the comparison of conserved amino acid sequences. From the result obtained, the presence of the RabF, RabSF, and G motifs, which are characteristic of Rab GTPases, was determined.

2.3. Rab GTPase Expression Profiles in Databases

Expression profiles of different tissues were obtained from the Bio-Analytic Resource Database http://bar.utoronto.ca (accessed on 21 October 2023). For S. lycopersicum and Solanum pennellii, the following tissues were considered: flower, stem, leaf, vegetative meristem, seedling shoot, seedling root, mature fruit, and developing fruit [30]. The expression values obtained were normalized with the control values from the database.
Additionally, expression profiles of Rab GTPases for four tomato species (S. lycopersicum, Solanum pimpinellifolium, Solanum habrochaites, and S. pennellii) were obtained from the “Tomato Expression” database to compare S. lycopersicum with its salt-tolerant wild relatives. Values were normalized to S. lycopersicum [30].

2.4. Plant Material and Growth Conditions

Seeds of S. chilense (Dunal) were collected from plants in Northern Chile at a 2500 m.a.s.l., 18° 26′ S lat. 69° 45′ long (date of collection: March 2019). Clonal plants were obtained by propagation in pots, which contained a mixture of perlite, vermiculite, and peat moss (1:1:1 v/v) and were grown under greenhouse conditions. The conditions used were 23–25 °C and a 16 h/8 h light/dark photoperiod. To fertilize plants, commercial Hoagland’s solution (1/4 strength) every 10 days was used. The salt stress assay was performed as follows: 7-week-old S. chilense plants were grown in 2-litre pots containing a perlite:vermiculite mixture (1:1 v/v) and irrigated with 400 mL of Hoagland’s solution containing 300 mM NaCl. Leaf and root samples were collected at 0, 3, 6, 12, 24, 48 and 72 h after salt treatment and were immediately frozen with liquid nitrogen and stored at −80 °C.

2.5. RNA Extraction and cDNA Synthesis

Total RNA was extracted from 100 mg of S. chilense leaves and roots using the SV Total RNA Isolation System kit (Promega, Madison, WI, USA) following the protocol indicated by the manufacturer. A total of 80 μL of the final volume was obtained from each sample and treated with TURBO DNA-free™ Kit (Invitrogen, Carlsbad, CA, USA) to eliminate genomic DNA contamination. The RNA concentration was quantified at 260/280 nm in an Infinite® 200 PRO NanoQuant (Tecan Group Ltd. Männedorf, Switzerland) spectrophotometer. The samples were stored at −20 °C.
The reverse transcription reaction for the synthesis of the first strand of cDNA was performed using 2 μg of total RNA treated with DNAse, extracted from leaf and root samples. For these reactions, the First Strand cDNA Synthesis Kit (Thermo, Carlsbad, CA, USA) was used, under the general conditions described by the provider. The mix for each reaction contained 4 μL 5X Reaction buffer, 1 μL Ribolock RNAse inhibitor, 2 μL 10 mM dNTP Mix, 2 μL M-MuLV Reverse Transcriptase, 1 μL Oligo(dT), and a mix of 10 μL RNA + H20 according to the concentration to be used, to make a total volume of 20 μL. The synthesis was conducted by incubating the samples at 37 °C for 60 min and a final incubation time at 70 °C for 5 min to stop the reaction. The cDNAs were stored at −20 °C.

2.6. Analysis of Gene Expression

Analysis of the expression of the genes of interest was determined by real-time PCR (qRT-PCR) using an Mx3000P qPCR System thermal cycler (Stratagene, La Jolla, CA, USA). cDNA amplification reactions were conducted using the Maximum SYBR Green/ROX qPCR Master Mix (2X) method (ThermoScientific, MA, USA) in a final volume of 20 μL and according to the manufacturer’s recommendations. Each 20 μL reaction consisted of 2 μL of diluted cDNA (50 ng), 10 μL of 2X Maxima® SYBR Green/ROX qPCR Master Mix reagent, 0.5 μL of each primer at a concentration of 0.25 μM, and nuclease-free water. Three determinations were made for each of the three biological replicates, and a negative control was also included. The temperature settings used were as follows: 95 °C for 10 min, followed by 40 cycles of 95 °C for 15 s, 58–60 °C for 15 s, and 72 °C for 20 s. At the end of each amplification step, the fluorescence was measured and at the end of amplification; a denaturation curve was established by continuously reading the fluorescence during a temperature increase from 55 °C to 95 °C.
Gene expression was normalized based on the relative expression values of the gene that codes for Ubiquitin3 in S. lycopersicum (SlUBI3) [31]. For the candidate genes, specific primers were designed from their UTR-3’ region with the Beacon Designer 4 program. The nucleotide sequence of the primers analyzed by qRT–PCR are described in Table S1. The data obtained at the end of each run were analyzed manually, and the calculations to estimate the relative expression of each gene were determined following the method described by Pfaffl [32].

2.7. Statistical Analysis

Statistics were performed in R (version 1.7). Statistical significance was analyzed by one-way ANOVA followed by the post hoc Tukey HSD test (p < 0.05).

3. Results

3.1. Identification and Phylogenetic Analysis of Rab GTPase Genes in S. lycopersicum

The 57 known sequences of Rab GTPases from A. thaliana [28] were utilized to conduct a search in the S. lycopersicum genome using the BLAST program integrated into the SolGenomics Database. Of the obtained sequences, duplicates were eliminated, and the remaining sequences were analyzed to identify recognizable domains. A total of 54 sequences were found in the S. lycopersicum genome (Table 1).
For the phylogenetic analysis, full-length sequences of 57 A. thaliana and 54 S. lycopersicum Rab GTPases were aligned, facilitating the construction of a comprehensive phylogenetic tree. Notably, all sequences from S. lycopersicum were included in the clades of the eight subfamilies of Rab GTPases (RabA–RabH) (Figure 1). In detail, the S. lycopersicum clade A encompasses 25 members, while A. thaliana hosts 26 members; clade B harbors 5 members in tomato and 3 in A. thaliana; clade C contains 3 members in both species; clade D comprises 5 members in S. lycopersicum and 4 in A. thaliana; clade E exhibits 5 members in S. lycopersicum and 4 in A. thaliana; clade F consists of 4 members in S. lycopersicum and 3 in A. thaliana; clade G encompasses 4 members in S. lycopersicum and 8 in A. thaliana; and finally, clade H comprises 3 members in S. lycopersicum and 5 in A. thaliana.

3.2. Duplication between Rab Genes from S. lycopersicum

The presence of duplication events within the S. lycopersicum genome was assessed. These events are represented in Figure 2 as blue lines, indicating 28 duplication events within the genome. A total of 54 Rab GTPases of S. lycopersicum were distributed across the 12 chromosomes (Figure 1B), with chromosome 8 having the lowest number of Rab GTPases, with only one. Chromosomes 7 and 12 contain three Rab GTPases each. Of the total, six chromosomes have five Rabs each (2, 4, 5, 9, 10, and 11). Chromosome 3 has six Rab GTPases, chromosome 4 has four Rab GTPases, and finally, the chromosome with the highest number is chromosome 1, with seven Rab GTPases.

3.3. Structure of Rab Genes and Conserved Motifs of Rab Proteins in S. lycopersicum

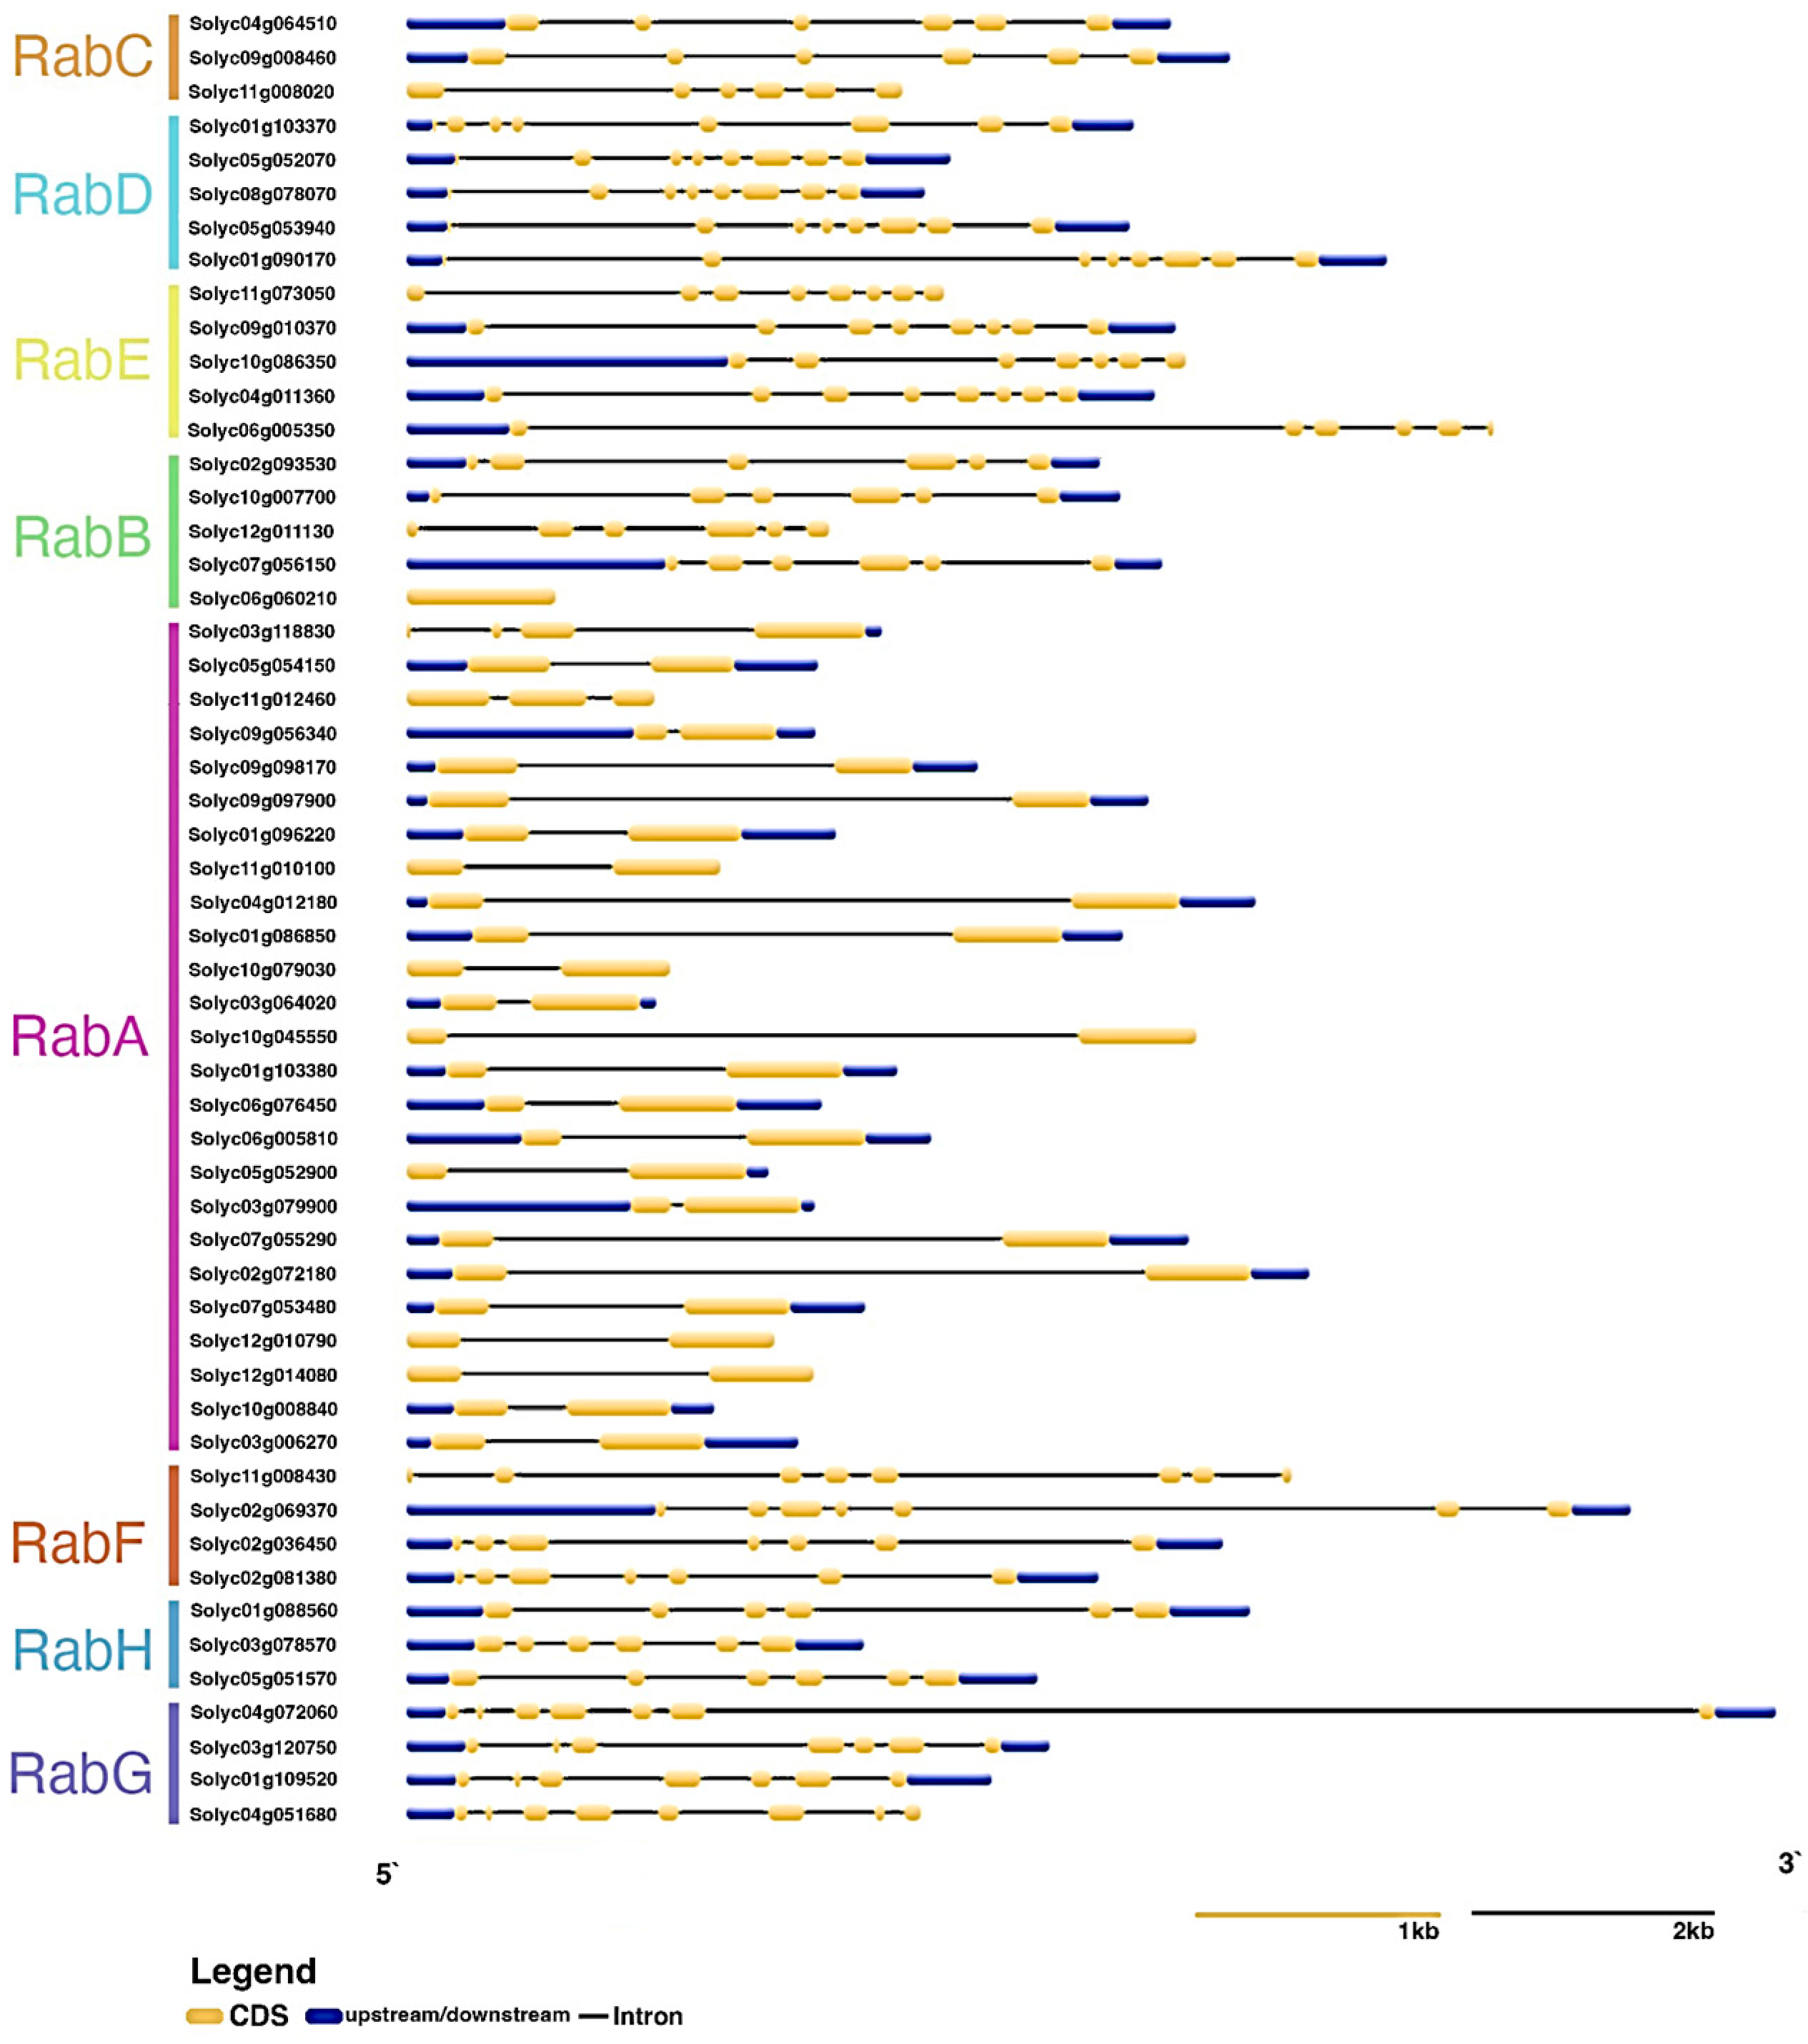
The intron–exon distribution of the Rab GTPase genes of S. lycopersicum was analyzed (Figure 3). Genes were grouped according to their respective subfamilies (RabA–RabH). Members of the RabB, RabC, and RabH subfamilies have six exons; one member of the RabB subfamily lacks introns entirely. Conversely, members of the RabD, RabE, RabF, and RabG subfamilies possess between seven and eight exons. Notably, the RabA subfamily stands out with the fewest introns, predominantly featuring only one intron per gene.
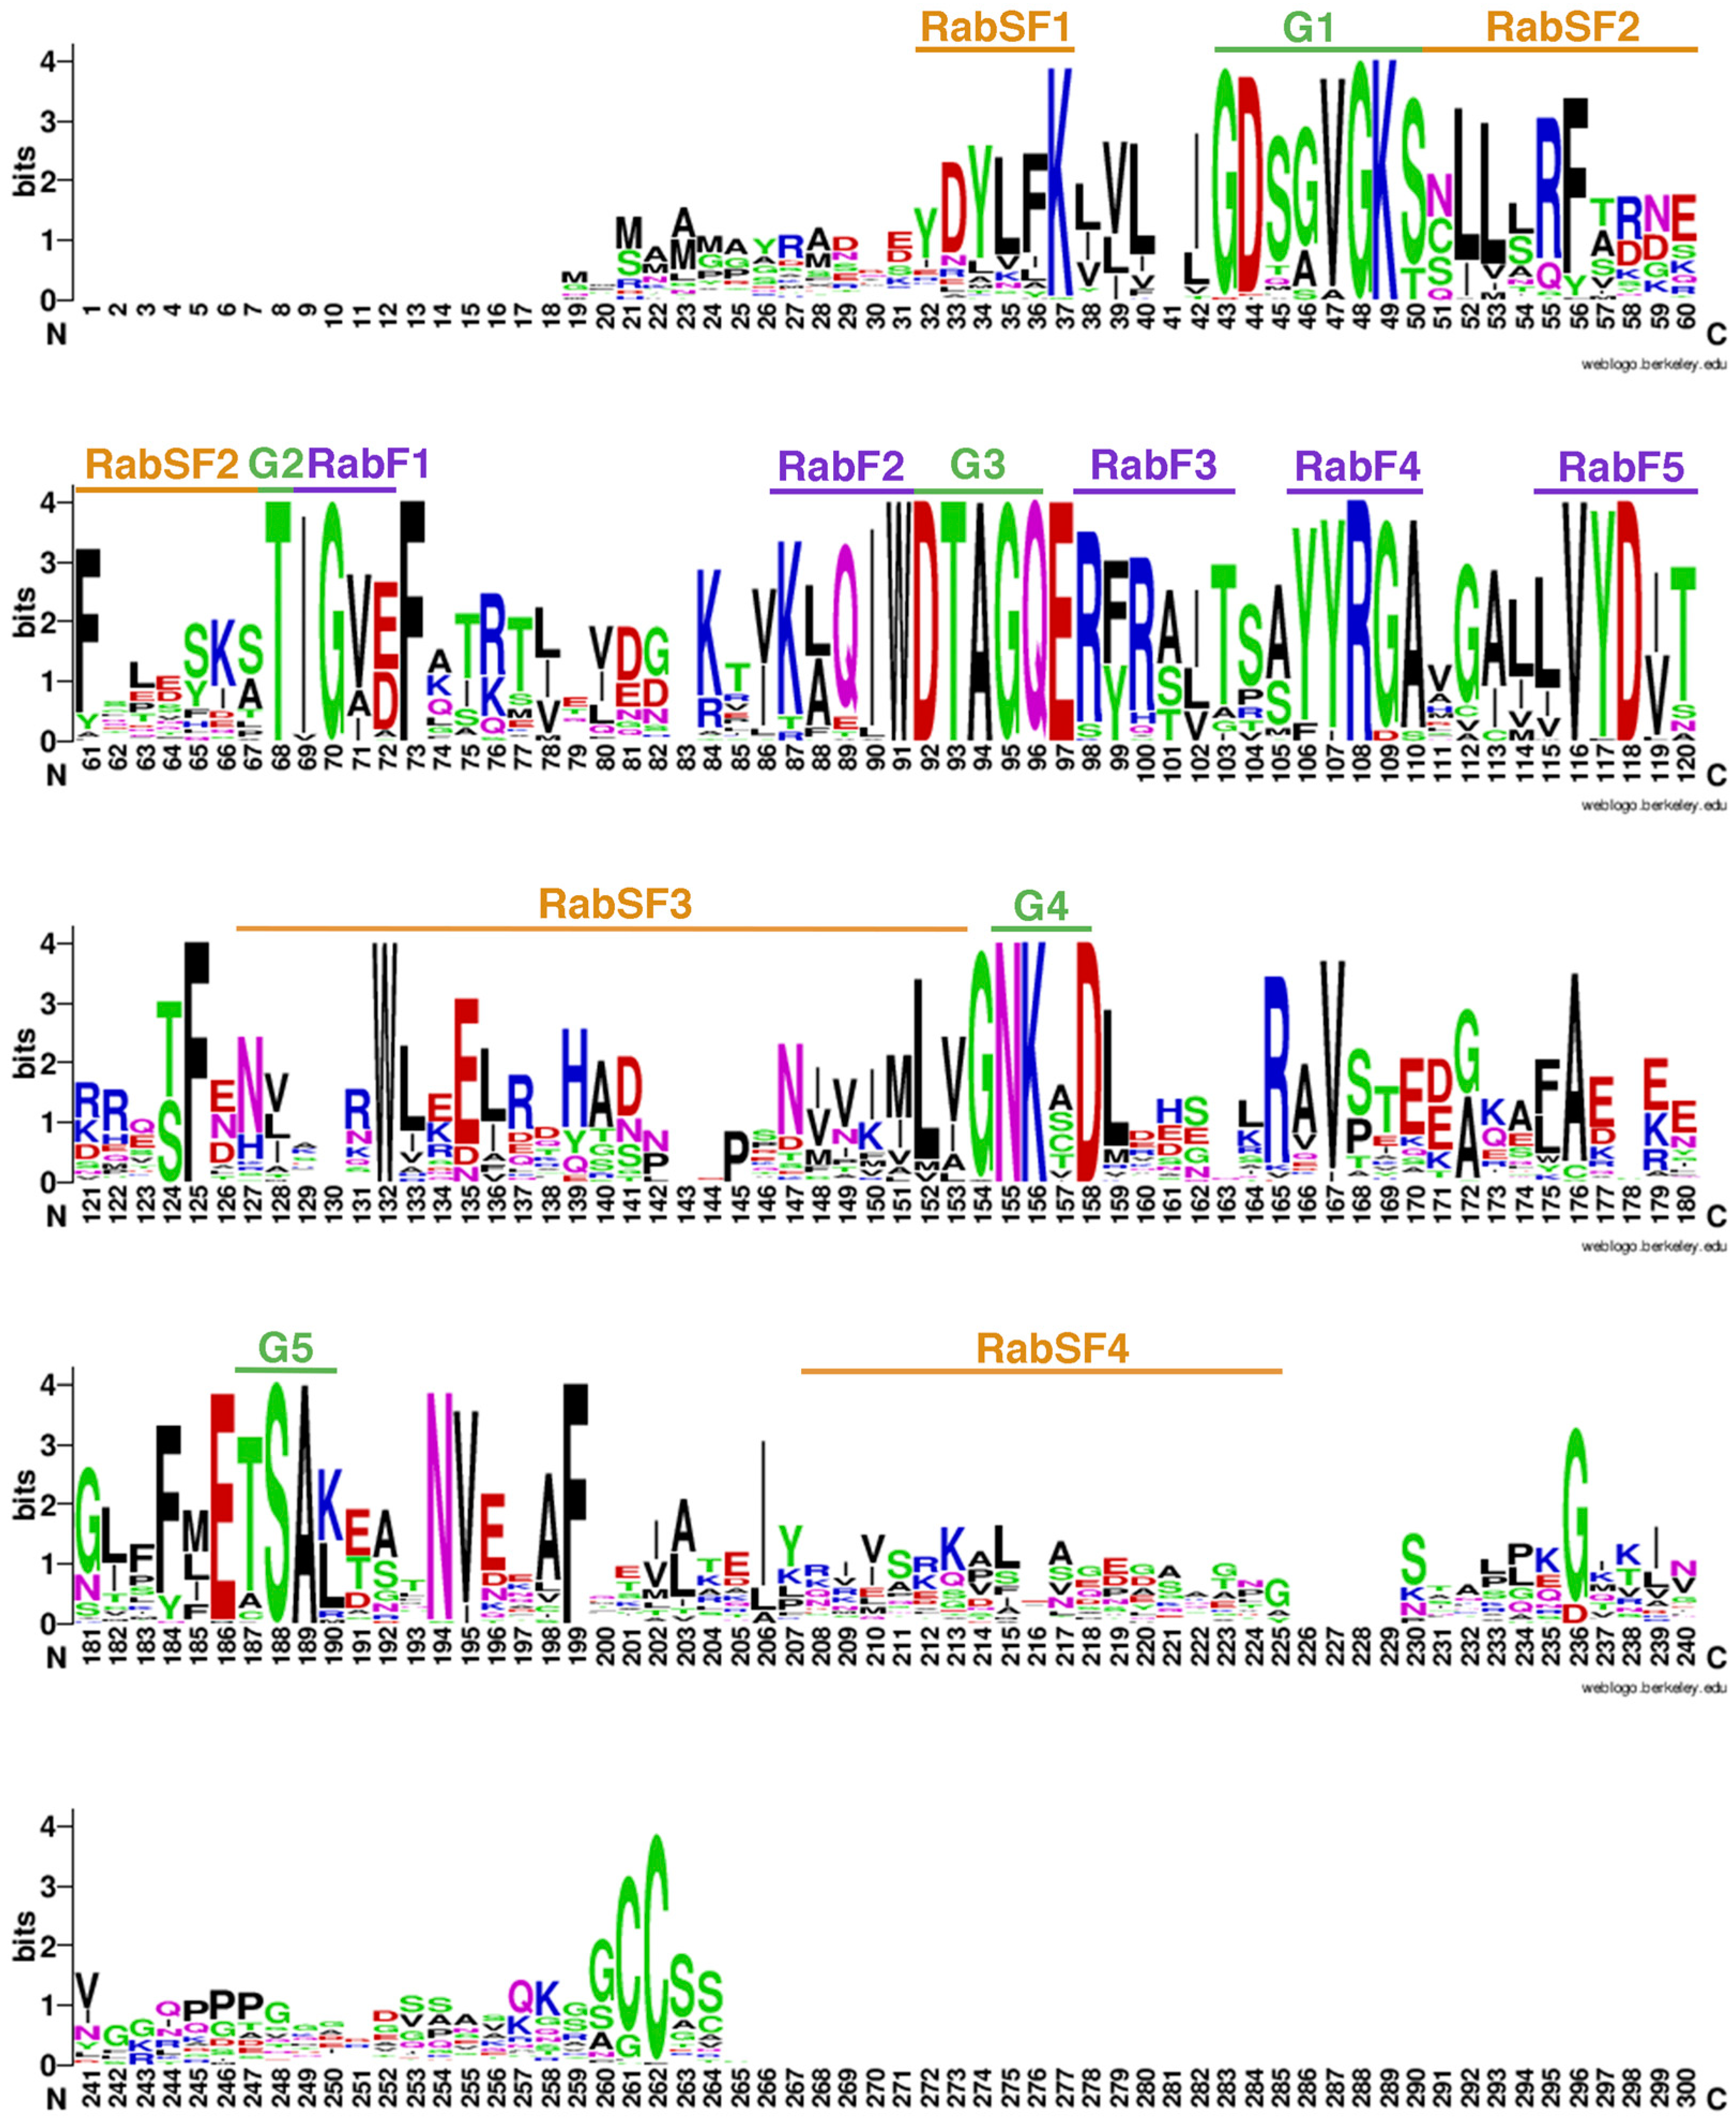
The alignment of 54 putative Rab GTPase protein sequences from S. lycopersicum was conducted to identify conserved motifs (Figure 4). Remarkably, the presence of five RabF motifs (RabF1–RabF5) (Figure 4, marked in purple) stands out; these are hallmark features of Rab GTPases, conferring specificity towards other Rab-interacting proteins like REP and GDI [33]. Additionally, RabSF motifs specific to each Rab GTPase subfamily (RabA–RabH) were identified. These motifs play a crucial role in facilitating binding between Rab and its respective effectors [33]. In addition, residues corresponding to the hydrophobic triad (F, W, and Y) were identified as highly conserved and essential for effector recognition [34,35]. Structures essential for the interaction with GDI and other proteins, including Switch I, Interswitch, and Switch II, were found, emphasizing their importance in the Rab GTPase system [36].

3.4. Expression of Rab GTPases in Different Tissues of Cultivated and Wild Tomato

To determine the expression profile in different tissues, two tomato species were analyzed: S. lycopersicum, a cultivated species, and its wild relative, S. pennellii. The expression patterns in flower, stem, leaf, vegetative meristem, seedling shoot, seedling root, mature fruit, and developing fruit are presented in Figure 5 for both species. Overall, it is observed that expression levels in leaves and vegetative meristem tend to be negative or close to zero, with few exceptions, such as Solyc10g008840 for leaf in S. lycopersicum and Solyc09g097900 in the vegetative meristem. On the other hand, significant positive expression values are detected in seedling roots, although there are instances of slightly negative expression, as seen in Solyc01g096220, corresponding to a Rab GTPase of the subfamily A. Interestingly, there is no discernible pattern in terms of expression associated with a particular species or subfamily; instead, expression varies among individual Rab GTPases.
Furthermore, with the purpose of studying the expression profile of Rab GTPases in salt-tolerant tomato species, analysis was conducted for S. lycopersicum and three wild relatives: S. pimpinellifolium, S. habrochaites, and S. pennellii (Figure 6). Expression values are predominantly positive for most of the Rab GTPases in the wild species compared to S. lycopersicum. In addition, significant differences are observed in the transcriptional response of the genes among the different wild species, suggesting a differential regulation of expression of the same genes in the different species. Examples of this include Solyc06g076450, which exhibits the highest expression value among Rab GTPases in S. pimpinellifolium and has a similar value in both S. lycopersicum and S. pennellii. A similar situation occurs with Solyc03g078570, which shows the lowest expression value in S. pimpinellifolium and positive expression in S. pennellii and S. habrochaites.

3.5. Differential Expression of Rab GTPase Genes from S. chilense in Leaves and Roots under Saline Stress

In order to have a better approximation regarding the transcriptional profile of Rab GTPases under salt stress conditions in wild species, representatives of each family of Rab GTPases were selected from the salinity-tolerant species S. chilense. Due to the large number of genes encoding Rab GTPases found in the genome of S. lycopersicum and considering that many of these genes perform redundant functions, the selection of genes was based on two criteria: the size of the subfamily and the vesicular trafficking pathway in which they are fulfilling their function. Therefore, we selected putative homologous members of the endocytic pathway, such as SlRabF1 and SlRabG3e; members of the secretory pathway, such as SlRabB1b, and the retrograde pathway (Golgi complex–Rough Endoplasmic Reticulum), such as SlRabH1b; and members of the TGN as part of the RabA subfamily. The expression levels of these genes in S. chilense under salt stress conditions were determined using their homologues. The Rab GTPases analyzed are listed in Table 2.
Seven-week-old S. chilense plants were subjected to salt stress through single irrigation with 400 mL of Hoagland’s solution containing 300 mM NaCl, followed by regular watering. Physiological parameters were measured, and a molecular stress marker gene, TSW12, was utilized to confirm the response to salt stress in these plants (Figure S1) [37].
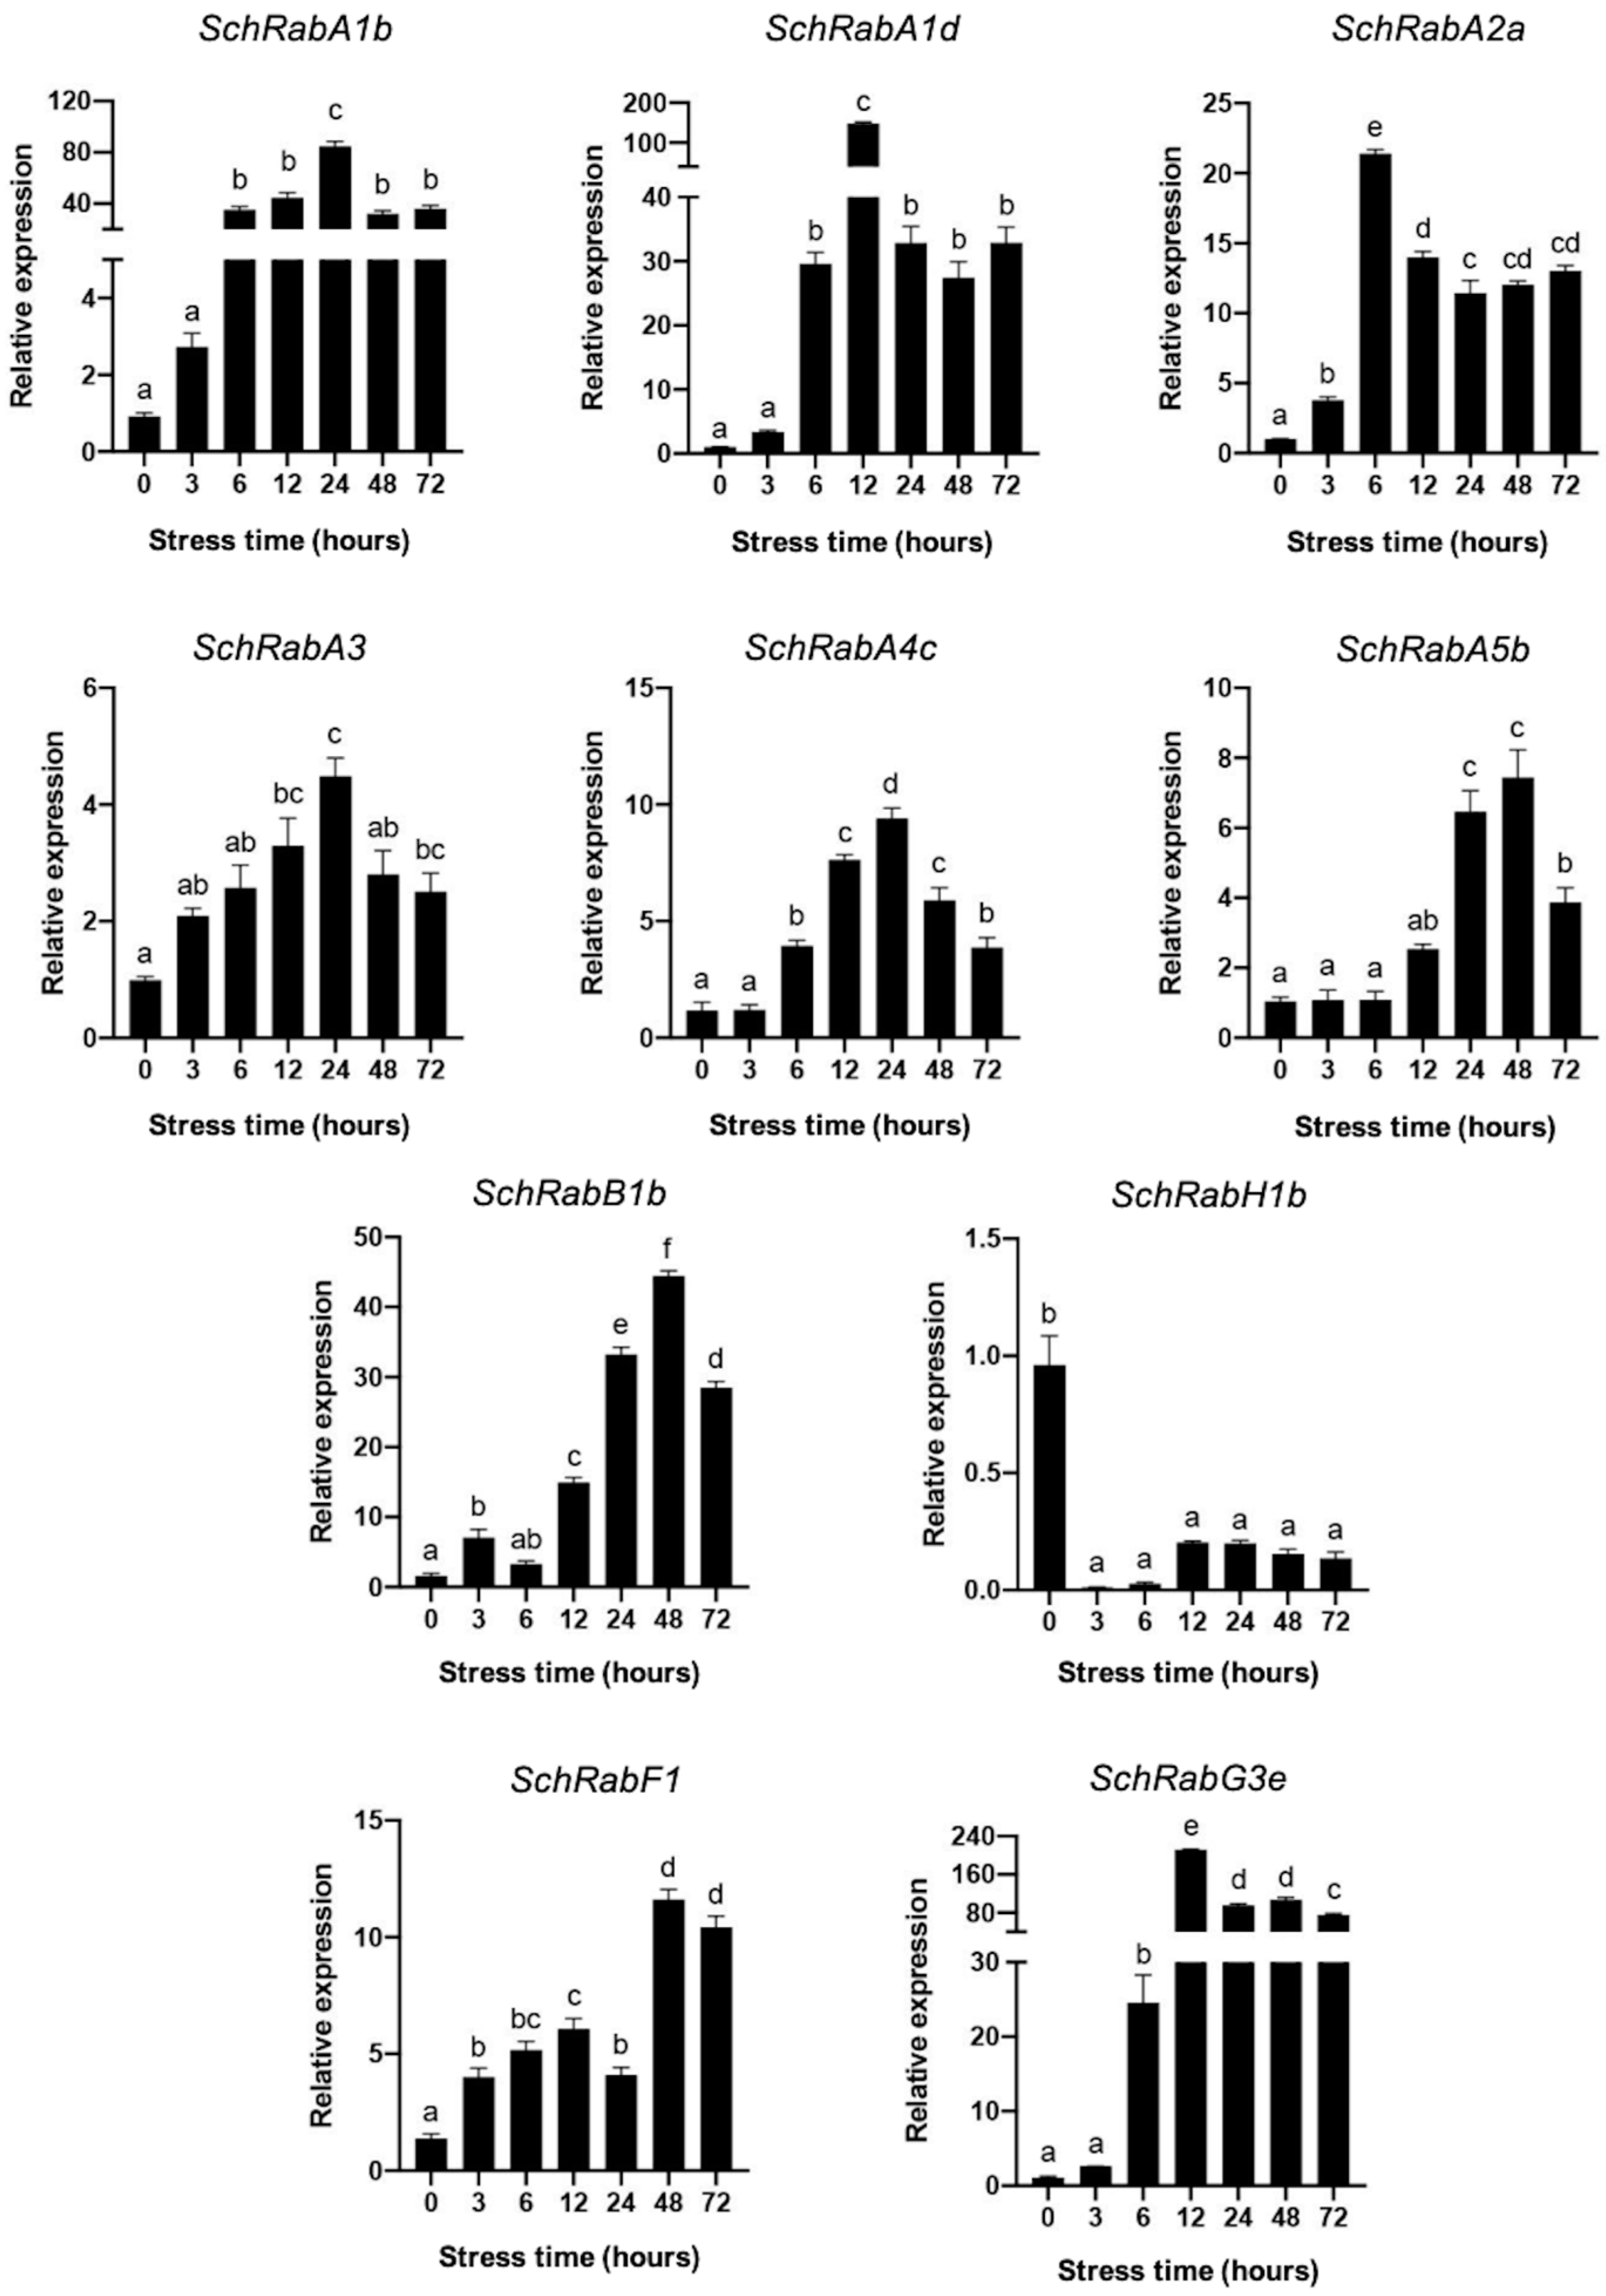
Subsequently, the transcript levels of the different Rab GTPases were evaluated in leaves of the S. chilense plants under salt stress conditions (Figure 7). Of the genes evaluated, all except SchRabH1b exhibited an increase in transcript levels as the experiment progressed. Notably, there are differences in salt-induced expression levels between members of the same subfamily, as observed in representatives of the SchRabA subfamily, as well as between subfamilies. For instance, SchRabA1b, SchRabA1d, and SchRabG3e displayed a significant increase in their relative expression from 3 h onwards. Moreover, differences were also observed in the induction times of each gene. Specifically, SchRabA5b appeared to only induce its expression 12 h after the onset of stress.
The transcript levels of the different Rab GTPases were also evaluated in the roots of S. chilense plants under salt stress conditions (Figure 8). Unlike in leaves, where only specific genes exhibited increased transcript levels, all the genes in roots showed an increase in the transcript levels. However, the different expression levels and variations in induction times persisted among genes within the same subfamily and across different subfamilies. In this sense, SchRabA1b and to a lesser extent SchRabG3e stand out for their significantly high levels of induction. On the other hand, not all genes maintained high levels of expression during the 72 h of salt treatment. Interestingly, and unlike what was observed in leaves, SchRabA3 expression seemed to be repressed after 12 h of treatment.

4. Discussion

Rab GTPases are important proteins in vesicle transport, being involved in the whole process of vesicle generation, docking, binding, and fusion with the target membrane [10,38,39]. The Rab GTPase family is highly conserved in different organisms, such as yeast, mammals, and plants [28,29,40], thus providing the basis for vesicle transport in an organism.

4.1. The Rab GTPase Superfamily Is Represented in S. lycopersicum with 54 Members

In this work, 54 putative non-redundant Rab GTPases were identified in the genome of S. lycopersicum, three members less than in the genome of A. thaliana [28]. The Rab GTPases found in the genome of S. lycopersicum, as in A. thaliana, are divided into eight subfamilies. This fact is consistent with observations in other organisms such as mammals, yeast, mango, rice, maize, and poplar [26,40,41,42,43]. Rab GTPases are phylogenetically grouped according to their subfamily, indicating that their members share functions and locations within the cell [40]. The largest family in S. lycopersicum is RabA, which is consistent with the expansion of this subfamily in plants [28,29]. Rab GTPases, being highly conserved among organisms, maintain a size close to 200 amino acids, with an average weight of 24 kDa (Table 1), coinciding with the average weight described for Rab GTPases [44]. There are only two exceptions. Solyc11g012460, which corresponds to the largest putative Rab GTPase (30 kDa, 277 amino acids), differs from its A. thaliana homolog (AT5G47520, corresponding to AtRabA5a) at the C-terminal end of the nucleotide sequence, which is longer in the putative Rab GTPase from S. lycopersicum. Tomato RabA5a has been evaluated as one of the genes that potentially regulates blossom-end rot (BER) [45]. It can be hypothesized that the additional amino acids, when compared to AtRabA, are involved in a response to this disease; however, this needs to be studied further. The second exception in terms of size is Solyc06g005350.2, with only 145 amino acids in its sequence. This sequence is incomplete (Figure 3), since a tomato RabE described by Fleming et al. [46], named Tm3, has 218 amino acids in its sequence, the same number of residues as those found in its A. thaliana counterpart and similar to the 217 amino acids found in sequences of the same clade (Figure 1). This sequence, as shown in Figure 1, clusters with RabE of A. thaliana, but given its length of the sequence, it cannot be classified specifically with any member of that subfamily but instead is grouped in general with the AtRabE clade.
In the Rab GTPase subfamily B of S. lycopersicum, there are five members, while in A. thaliana there are only three members. The increase in the number of Rab GTPases coincides with some of the gene duplications within the same genome in tomato. The same situation is observed in the case of the RabD subfamily, where the additional Rab can be explained by a duplication event.
Intron/exon distribution is maintained depending on the subfamily to which Rab GTPases belong, thus maintaining a conserved gene structure. It has been reported that within the Rab GTPase families, there is a tendency to maintain this intron–exon distribution related to a specific function within the same family [40,47,48]. An example is observed in the Populus trichocarpa Rab GTPase family, whereas the intron–exon distribution remains conserved within each subfamily (RabA–RabH) [42]. This situation also occurs in other highly sequence-conserved superfamilies, such as the NAC domain transcription factor gene family, where the phylogenetically closest members have a similar intron–exon distribution [49].
The 54 sequences found in the genome of S. lycopersicum correspond to Rab GTPases according to the criteria proposed by Pereira-Leal and Seabra [40], with the first condition being the existence of Rab family domains (RabF). These five domains (RabF1–RabF5) characterize a Rab GTPase. Also crucial is the presence of the so-called hydrophobic triad in the switch region of Rab GTPases, which is key for effector recognition [34,35]. This hydrophobic triad is present in all 54 sequences of putative Rab GTPases (Figure 4). These residues, also known as the aromatic triad, correspond to phenylalanine, tryptophan, and a variable tyrosine/phenylalanine residue [36]. Against this background, it is possible to indicate that the sequences found in the genome of S. lycopersicum correspond to Rab GTPases.

4.2. High Functional Diversity of Rab GTPases in Solanaceae

The transcriptional analysis carried out in different organs and different stages of plant development of S. lycopersicum and S. pennellii (Figure 5) shows that all Rab GTPases are expressed in at least one of the samples analyzed, which suggests that they fulfill specific functions, justifying the high number of genes found in the Solanaceae genome. This observation is common in higher plants, since a similar situation has been described in cotton, soybean, rice, poplar, and even in Arabidopsis [28,29]. On the other hand, some genes show conserved expression patterns within the genus, such as the three RabGs, some RabAs and the three RabHs. This is interesting, since it suggests that the trafficking routes in which they are involved are vital for the development of the plant and consequently must be maintained or conserved. Therefore, it seemed appropriate to analyze the transcriptional profile of other salt-tolerant species related to tomato (Figure 6), in order to know the specific Rab GTPases that could have evolved due to selection pressure induced by unfavorable environmental conditions. Of the three wild species analyzed, S. pennellii has the greatest tolerance, and S. pimpinellifolium has the lowest tolerance (Figure 6). Here, the results show that the transcriptional pattern increases as the species becomes more tolerant. This situation is observed for the genes belonging to the RabB and RabD subfamilies, which suggests that, indeed, the regulation of the expression of these genes is in the process of evolution, which coincides with what was described by Pereira-Leal et al., 2001 [40].

4.3. Differential Expression of Rab GTPases of the Endocytic and TGN Pathway in S. chilense under Stress Conditions

Of the total Rab GTPases found in the genome of S. lycopersicum, ten genes were selected to be evaluated under salt stress conditions in S. chilense plants. This halophyte species can grow in the Atacama Desert in northern Chile, one of the driest areas in the world. It simultaneously tolerates conditions of salinity, drought, and extreme temperatures [50,51]. In salt stress conditions, S. chilense showed a higher accumulation of ROS detoxifying antioxidant enzymes than S. lycopersicum, allowing continual operation of the cellular machinery in normalized conditions under such stress [52].
Expression profiles were obtained in both leaves and roots for each of these ten genes in S. chilense. It is interesting to note the high levels of induction of genes belonging to the RabA1 subfamily (SchRabA1b and SchRabA1d) under salt stress conditions, occurring at both root and leaf levels (Figure 7 and Figure 8). These results are consistent with the observations of Asaoka et al. [15], who determined that RabA1a-d Rab GTPases are required and necessary for salt stress tolerance, regulating the localization of cell surface proteins, such as channels and pumps. Being a highly conserved superfamily between species [28,40,53], it has been reported that the function of each of its members is maintained even in different organisms, so it could be assumed that the function of these two Rab GTPases (SchRabA1b and SchRabA1d) is of great importance under salt stress, explaining the important transcriptional induction of these genes under this type of stress.
SchRabA3 shows a different behavior than other Rab GTPases, increasing its transcript levels at 12 h, where it reaches the peak; however, after this point there is a decrease in transcript levels to even lower levels than those presented at time 0. This Rab was amplified using primers obtained from the sequence of Solyc11g012460.1, which is the sequence with the largest size among the S. lycopersicum Rab GTPases. Since S. lycopersicum and S. chilense are close relatives, the nucleotide sequence could have high similarity and therefore related functions. The Rab of S. lycopersicum Solyc11g012460.1 has a role in biotic stress [45] and has also been reported to contribute to fruit firmness in M. indica [54]. This gene also showed an interesting behavior in seedling roots in S. lycopersicum and S. pennellii, being one of the few genes to exhibit negative expression levels in such an organ (Figure 5).
Regarding SchRabH1b, whose expression in leaves is repressed compared to the control, there are precedents in maize crosses between resistant and tolerant varieties, where repression of this gene is observed when subjected to salt stress conditions. The authors speculated that this protein can be a salt stress-negative regulatory protein [55]. However, in roots of S. chilense, its expression is strongly induced starting 6 h after applying the stress, indicating that it could be fulfilling a different function in leaves than in roots.
Rab GTPases of the endocytic pathway have been shown to play an important role in salt stress tolerance. There is induction of genes representing this pathway when subjected to stress conditions, as is the case of SchRabF1 (Solyc11g008430) and SchRabG3e (Solyc01g109520) in leaves (Figure 7) and roots (Figure 8). There is evidence that members of the RabF subfamily play a role in salt stress tolerance, such as the mutation that increases AtRab ARA7 (AtRabF2b) protein levels, which resulted in increased long-term tolerance to salt stress when compared to WT plants. In addition, an increased mass of roots and leaves, increased K+ content, and decreased Na+ content have been reported under these conditions [14]. Moreover, AtRabF1 of A. thaliana transports endosomal vesicles and plays a role in stress response. Overexpression of this gene both in its activated and inactivated state increases stress tolerance when compared to WT plants, exhibiting longer roots and playing a role in dark-induced senescence [25]. Additionally, SchRabF1 shows higher expression levels in S. pennellii seedling roots when compared to S. lycopersicum (Figure 5). Considering this background, it is possible to infer that SchRabF1 could be relevant in future studies of salt stress tolerance, given its induction in expression levels in both leaves and roots.
The expression in S. chilense of SchRabG3e, a Rab GTPase involved in the endocytic pathway of intracellular vesicular trafficking, is highly transcriptionally induced under salt stress conditions. This gene also shows higher expression levels in roots of S. pennellii seedlings when compared to S. lycopersicum (Figure 5). The role of different Rab GTPases of the RabG subfamily involved in abiotic stress tolerance processes has been described. The role of AtRabG3e in salt stress tolerance was previously demonstrated in A. thaliana [56], where better germination and robust growth were observed in plants overexpressing this gene. Furthermore, overexpression of PgRab7 from P. glaucum or PjRab7 from Prosopis juliflora, which are homologs of RabG3e from A. thaliana, confers salt stress tolerance in transgenic tobacco plants [27]. Similarly, overexpression of OsRab7 in rice increased the tolerance of rice plants to drought and heat [57]. Considering this evidence, it is also possible to infer that SchRabG3e could be used in future studies of salt stress tolerance, given its high expression levels in both leaves and roots of tomato plants.

5. Conclusions

The Rab GTPase family has been characterized in other species previously, but to our knowledge, no systematic study has been performed in S. lycopersicum. We found 54 putative Rab GTPases in the genome, which are distributed in eight subfamilies (RabA–RabH) as described in the literature. Along with this, the sequences show a high degree of conservation, maintaining the size and weight at the amino acid level, the characteristic motifs of this family, and a conserved number of introns within each subfamily.
Once the sequences coding for Rab GTPases in S. lycopersicum were obtained, the expression profiles of some of these were determined in S. chilense, where their expression profiles, together with data obtained from databases, account for the transcriptional activation that occurs in wild species as well as under salt stress conditions. The profiles of SchRabA1b and SchRabG3e under stress conditions are particularly noteworthy, establishing them as candidate genes for future studies.

Supplementary Materials

The following supporting information can be downloaded at: https://www.mdpi.com/article/10.3390/genes15040453/s1, Figure S1: Physiological parameters and relative expression levels of stress marker gene TSW12; Table S1: Nucleotide sequence of the primers.

Author Contributions

Conceptualization, S.R.-L.; formal analysis, F.S., A.S.M.-D., J.S.-C. and J.M.-E.; funding acquisition, S.R.-L.; investigation, F.S. and A.S.M.-D.; supervision, S.R.-L.; writing—original draft, F.S.; writing—review and editing, J.S.-C., J.M.-E. and S.R.-L. All authors have read and agreed to the published version of the manuscript.

Funding

This research was funded by Fondo Nacional de Desarrollo Científico y Tecnológico de Chile (FONDECYT), grants 1170554 and 1211180, and the Universidad de Talca doctoral fellowship (F.S).

Institutional Review Board Statement

Not applicable.

Informed Consent Statement

Not applicable.

Data Availability Statement

Data are contained within the article and Supplementary Materials.

Acknowledgments

Solanum chilense plants were used in this study. Seeds were kindly provided by Simón Ruiz-Lara (University of Talca, Talca, Chile).

Conflicts of Interest

The authors declare no conflicts of interest.

References

  1. Hao, S.; Wang, Y.; Yan, Y.; Liu, Y.; Wang, J.; Chen, S. A Review on Plant Responses to Salt Stress and Their Mechanisms of Salt Resistance. Horticulturae 2021, 7, 132. [Google Scholar] [CrossRef]
  2. Hassani, A.; Azapagic, A.; Shokri, N. Global predictions of primary soil salinization under changing climate in the 21st century. Nat. Commun. 2021, 12, 6663. [Google Scholar] [CrossRef] [PubMed]
  3. Zhou, H.; Shi, H.; Yang, Y.; Feng, X.; Chen, X.; Xiao, F.; Lin, H.; Guo, Y. Insights into plant salt stress signaling and tolerance. J. Genet. Genom. 2023, 51, 16–34. [Google Scholar] [CrossRef] [PubMed]
  4. Guo, M.; Wang, X.S.; Guo, H.D.; Bai, S.Y.; Khan, A.; Wang, X.M.; Gao, Y.M.; Li, J.S. Tomato salt tolerance mechanisms and their potential applications for fighting salinity: A review. Front. Plant Sci. 2022, 13, 949541. [Google Scholar] [CrossRef] [PubMed]
  5. Žižková, E.; Dobrev, P.I.; Muhovski, Y.; Hošek, P.; Hoyerová, K.; Haisel, D.; Procházková, D.; Lutts, S.; Motyka, V.; Hichri, I. Tomato (Solanum lycopersicum L.) SlIPT3 and SlIPT4 isopentenyltransferases mediate salt stress response in tomato. BMC Plant Biol. 2015, 15, 85. [Google Scholar] [CrossRef] [PubMed]
  6. Roșca, M.; Mihalache, G.; Stoleru, V. Tomato responses to salinity stress: From morphological traits to genetic changes. Front. Plant Sci. 2023, 14, 1118383. [Google Scholar] [CrossRef] [PubMed]
  7. Salinas-Cornejo, J.; Madrid-Espinoza, J.; Verdugo, I.; Pérez-Díaz, J.; Martín-Davison, A.S.; Norambuena, L.; Ruiz-Lara, S. The Exocytosis Associated SNAP25-Type Protein, SlSNAP33, Increases Salt Stress Tolerance by Modulating Endocytosis in Tomato. Plants 2021, 10, 1322. [Google Scholar] [CrossRef] [PubMed]
  8. Salinas-Cornejo, J.; Madrid-Espinoza, J.; Verdugo, I.; Norambuena, L.; Ruiz-Lara, S. A SNARE-like protein from Solanum lycopersicum increases salt tolerance by modulating vesicular trafficking in tomato. Front. Plant Sci. 2023, 14, 1212806. [Google Scholar] [CrossRef]
  9. Nielsen, E.; Cheung, A.Y.; Ueda, T. The Regulatory RAB and ARF GTPases for Vesicular Trafficking. Plant Physiol. 2008, 147, 1516–1526. [Google Scholar] [CrossRef]
  10. Zerial, M.; McBride, H. Rab Proteins as Membrane Organizers. Nat. Rev. Mol. Cell Biol. 2001, 2, 107–117. [Google Scholar] [CrossRef]
  11. Hutagalung, A.H.; Novick, P.J. Role of Rab GTPases in membrane traffic and cell physiology. Physiol. Rev. 2011, 91, 119–149. [Google Scholar] [CrossRef]
  12. Stenmark, H. Rab GTPases as Coordinators of Vesicle Traffic. Nat. Rev. Mol. Cell Biol. 2009, 10, 513–525. [Google Scholar] [CrossRef]
  13. Khalilova, L.A.; Sergienko, O.V.; Orlova, Y.V.; Myasoedov, N.A.; Karpichev, I.V.; Balnokin, Y.V. Arabidopsis thaliana Mutant with T-DNA Insertion in the Flot1 (At5g25250) Gene Promotor Possesses Increased Resistance to NaCl. Russ. J. Plant Physiol. 2020, 67, 275–284. [Google Scholar] [CrossRef]
  14. Sergienko, O.; Khalilova, L.A.; Orlova, Y.; Shuvalov, A.; Myasoedov, N.A.; Karpichev, I. Mutation of the ARA7/AtRabF2b Gene, That Increases the Content of the Ara7 Protein Regulating Endocytic Trafficking Pathways, Improves Salt Tolerance of the Arabidopsis thaliana (L.) Heynh Plants. Russ. J. Plant Physiol. 2022, 69, 11. [Google Scholar] [CrossRef]
  15. Asaoka, R.; Uemura, T.; Ito, J.; Fujimoto, M.; Ito, E.; Ueda, T.; Nakano, A. Arabidopsis RABA1 GTPases Are Involved in Transport between the Trans-Golgi Network and the Plasma Membrane, and Are Required for Salinity Stress Tolerance. Plant J. 2013, 73, 240–249. [Google Scholar] [CrossRef]
  16. Bolte, S.; Schiene, K.; Dietz, K.J. Characterization of a Small GTP-Binding Protein of the Rab 5 Family in Mesembryanthemum Crystallinum with Increased Level of Expression during Early Salt Stress. Plant Mol. Biol. 2000, 42, 923–936. [Google Scholar] [CrossRef]
  17. George, S.; Parida, A. Over-Expression of a Rab Family GTPase from Phreatophyte Prosopis Juliflora Confers Tolerance to Salt Stress on Transgenic Tobacco. Mol. Biol. Rep. 2011, 38, 1669–1674. [Google Scholar] [CrossRef] [PubMed]
  18. Jha, Y.; Sablok, G.; Subbarao, N.; Sudhakar, R.; Fazil, M.H.; Subramanian, R.B.; Squartini, A.; Kumar, S. Bacterial-Induced Expression of RAB18 Protein in Oryza Sativa Salinity Stress and Insights into Molecular Interaction with GTP Ligand. J. Mol. Recognit. 2014, 27, 521–527. [Google Scholar] [CrossRef]
  19. Zhu, J.K. Plant Salt Tolerance. Trends Plant Sci. 2001, 6, 66–71. [Google Scholar] [CrossRef]
  20. Slesak, I.; Miszalski, Z.; Karpinska, B.; Niewiadomska, E.; Ratajczak, R.; Karpinski, S. Redox Control of Oxidative Stress Responses in the C3-CAM Intermediate Plant Mesembryanthemum Crystallinum. Plant Physiol. Biochem. 2002, 40, 669–677. [Google Scholar] [CrossRef]
  21. Tuteja, N. Cold, Salinity, and Drought Stress. In Plant Stress Biology: From Genomics to Systems Biology; Hirt, H., Ed.; Wiley-Blackwell: Weinheim, Germany, 2010; Volume 444, pp. 137–159. [Google Scholar] [CrossRef]
  22. Levine, A. Regulation of Stress Responses by Intracellular Vesicle Trafficking? Plant Physiol. Biochem. 2002, 40, 531–535. [Google Scholar] [CrossRef]
  23. Ebine, K.; Fujimoto, M.; Okatani, Y.; Nishiyama, T.; Goh, T.; Ito, E.; Dainobu, T.; Nishitani, A.; Uemura, T.; Sato, M.H.; et al. A Membrane Trafficking Pathway Regulated by the Plant-Specific RAB GTPase ARA6. Nat. Cell Biol. 2011, 13, 853–859. [Google Scholar] [CrossRef] [PubMed]
  24. Ebine, K.; Miyakawa, N.; Fujimoto, M.; Uemura, T.; Nakano, A.; Ueda, T. Endosomal Trafficking Pathway Regulated by ARA6, a RAB5 GTPase Unique to Plants. Small GTPases 2012, 3, 23–27. [Google Scholar] [CrossRef] [PubMed]
  25. Yin, C.; Karim, S.; Zhang, H.; Aronsson, H. Arabidopsis RabF1 (ARA6) Is Involved in Salt Stress and Dark-Induced Senescence (DIS). Int. J. Mol. Sci. 2017, 18, 309. [Google Scholar] [CrossRef] [PubMed]
  26. Liu, Z.; Luo, C.; Dong, L.; Van Toan, C.; Wei, P.; He, X. Molecular characterization and expression analysis of a GTP-binding protein (MiRab5) in Mangifera indica. Gene 2014, 540, 86–91. [Google Scholar] [CrossRef] [PubMed]
  27. Agarwal, P.K.; Agarwal, P.; Jain, P.; Jha, B.; Reddy, M.K.; Sopory, S.K. Constitutive overexpression of a stress-inducible small GTP-binding protein PgRab7 from Pennisetum glaucum enhances abiotic stress tolerance in transgenic tobacco. Plant Cell Rep. 2008, 27, 105–115. [Google Scholar] [CrossRef] [PubMed]
  28. Vernoud, V.; Horton, A.C.; Yang, Z.; Nielsen, E. Analysis of the small GTPase gene superfamily of Arabidopsis. Plant Physiol. 2003, 131, 1191–1208. [Google Scholar] [CrossRef] [PubMed]
  29. Minamino, N.; Ueda, T. RAB GTPases and their effectors in plant endosomal transport. Curr. Opin. Plant Biol. 2019, 52, 61–68. [Google Scholar] [CrossRef]
  30. Koenig, D.; Jiménez-Gómez, J.M.; Kimura, S.; Fulop, D.; Chitwood, D.H.; Headland, L.R.; Kumar, R.; Covington, M.F.; Devisetty, U.K.; Tat, A.V.; et al. Comparative transcriptomics reveals patterns of selection in domesticated and wild tomato. Proc. Natl. Acad. Sci. USA 2013, 110, E2655–E2662. [Google Scholar] [CrossRef]
  31. Hoffman, N.E.; Ko, K.; Milkowski, D.; Pichersky, E. Isolation and characterization of tomato cDNA and genomic clones encoding the ubiquitin gene ubi3. Plant Mol. Biol. 1991, 17, 1189–1201. [Google Scholar] [CrossRef]
  32. Pfaffl, M.W. A new mathematical model for relative quantification in real-time RT-PCR. Nucleic Acids Res. 2001, 29, e45. [Google Scholar] [CrossRef] [PubMed]
  33. Pereira-Leal, J.B.; Seabra, M.C. The mammalian Rab family of small GTPases: Definition of family and subfamily sequence motifs suggests a mechanism for functional specificity in the Ras superfamily. J. Mol. Biol. 2000, 301, 1077–1087. [Google Scholar] [CrossRef] [PubMed]
  34. Merithew, E.; Hatherly, S.; Dumas, J.J.; Lawe, D.C.; Heller-Harrison, R.; Lambright, D.G. Structural plasticity of an invariant hydrophobic triad in the switch regions of Rab GTPases is a determinant of effector recognition. J. Biol. Chem. 2001, 276, 13982–13988. [Google Scholar] [CrossRef]
  35. Pfeffer, S.R. Rab GTPases: Specifying and deciphering organelle identity and function. Trends Cell Biol. 2001, 11, 487–491. [Google Scholar] [CrossRef] [PubMed]
  36. Khan, A.R.; Ménétrey, J. Structural biology of Arf and Rab GTPases’ effector recruitment and specificity. Structure 2013, 21, 1284–1297. [Google Scholar] [CrossRef] [PubMed]
  37. Torres-Schumann, S.; Godoy, J.A.; Pintor-Toro, J.A. A probable lipid transfer protein gene is induced by NaCl in stems of tomato plants. Plant Mol. Biol. 1992, 18, 749–757. [Google Scholar] [CrossRef] [PubMed]
  38. Bonifacino, J.S.; Glick, B.S. The mechanisms of vesicle budding and fusion. Cell 2004, 116, 153–166. [Google Scholar] [CrossRef] [PubMed]
  39. Homma, Y.; Hiragi, S.; Fukuda, M. Rab family of small GTPases: An updated view on their regulation and functions. FEBS J. 2021, 288, 36–55. [Google Scholar] [CrossRef] [PubMed]
  40. Pereira-Leal, J.B.; Seabra, M.C. Evolution of the Rab family of small GTP-binding proteins. J. Mol. Biol. 2001, 313, 889–901. [Google Scholar] [CrossRef]
  41. Zhang, J.; Hill, D.H.; Sylvester, A.W. Diversification of the RAB Guanosine Triphosphatase Family in Dicots and Monocots. J. Integr. Plant Biol. 2007, 49, 1129–1141. [Google Scholar] [CrossRef]
  42. Zhang, J.; Li, Y.; Liu, B.; Wang, L.; Zhang, L.; Hu, J.; Chen, J.; Zheng, H.; Lu, M. Characterization of the Populus Rab family genes and the function of PtRabE1b in salt tolerance. BMC Plant Biol. 2018, 18, 124. [Google Scholar] [CrossRef]
  43. Peng, X.; Ding, X.; Chang, T.; Wang, Z.; Liu, R.; Zeng, X.; Cai, Y.; Zhu, Y. Overexpression of a Vesicle Trafficking Gene, OsRab7, enhances salt tolerance in rice. Sci. World J. 2014, 2014, 483526. [Google Scholar] [CrossRef]
  44. Olkkonen, V.M.; Stenmark, H. Role of Rab GTPases in Membrane Traffic. Physiol. Rev. 1997, 91, 119–149. [Google Scholar] [CrossRef]
  45. de Freitas, S.T.; Martinelli, F.; Feng, B.; Reitz, N.F.; Mitcham, E.J. Transcriptome Approach to Understand the Potential Mechanisms Inhibiting or Triggering Blossom-End Rot Development in Tomato Fruit in Response to Plant Growth Regulators. J. Plant Growth Regul. 2018, 37, 183–198. [Google Scholar] [CrossRef]
  46. Fleming, A.J.; Mandel, T.; Roth, I.; Kuhlemeier, C. The patterns of gene expression in the tomato shoot apical meristem. Plant Cell 1993, 5, 297–309. [Google Scholar] [CrossRef] [PubMed]
  47. Adachi, R.; Nigam, R.; Tuvim, M.J.; Demayo, F.; Dickey, B.F. Genomic organization, chromosomal localization, and expression of the murine RAB3D gene. Biochem. Biophys. Res. Commun. 2000, 273, 877–883. [Google Scholar] [CrossRef]
  48. Tolmachova, T.; Ramalho, J.S.; Anant, J.S.; Schultz, R.A.; Huxley, C.M.; Seabra, M.C. Cloning, mapping and characterization of the human RAB27A gene. Gene 1999, 239, 109–116. [Google Scholar] [CrossRef]
  49. Hu, R.; Qi, G.; Kong, Y.; Kong, D.; Gao, Q.; Zhou, G. Comprehensive analysis of NAC domain transcription factor gene family in Populus trichocarpa. BMC Plant Biol. 2010, 10, 145. [Google Scholar] [CrossRef] [PubMed]
  50. Nosenko, T.; Böndel, K.B.; Kumpfmüller, G.; Stephan, W. Adaptation to low temperatures in the wild tomato species Solanum chilense. Mol. Ecol. 2016, 25, 2853–2869. [Google Scholar] [CrossRef]
  51. Tapia, G.; Méndez, J.; Inostroza, L. Different combinations of morpho-physiological traits are responsible for tolerance to drought in wild tomatoes Solanum chilense and Solanum peruvianum. Plant Biol. 2016, 18, 406–416. [Google Scholar] [CrossRef]
  52. Kashyap, S.P.; Kumari, N.; Mishra, P.; Prasad Moharana, D.; Aamir, M.; Singh, B.; Prasanna, H.C. Transcriptional regulation-mediating ROS homeostasis and physio-biochemical changes in wild tomato (Solanum chilense) and cultivated tomato (Solanum lycopersicum) under high salinity. Saudi J. Biol. Sci. 2020, 27, 1999–2009. [Google Scholar] [CrossRef] [PubMed]
  53. Molendijk, A.J.; Ruperti, B.; Palme, K. Small GTPases in Vesicle Trafficking. Curr. Opin. Plant Biol. 2004, 7, 694–700. [Google Scholar] [CrossRef] [PubMed]
  54. Lawson, T.; Lycett, G.W.; Mayes, S.; Ho, W.K.; Chin, C.F. Transcriptome-wide identification and characterization of the Rab GTPase family in mango. Mol. Biol. Rep. 2020, 47, 4183–4197. [Google Scholar] [CrossRef] [PubMed]
  55. Chen, F.; Fang, P.; Peng, Y.; Zeng, W.; Zhao, X.; Ding, Y.; Zhuang, Z.; Gao, Q.; Ren, B. Comparative Proteomics of Salt-Tolerant and Salt-Sensitive Maize Inbred Lines to Reveal the Molecular Mechanism of Salt Tolerance. Int. J. Mol. Sci. 2019, 20, 4725. [Google Scholar] [CrossRef] [PubMed]
  56. Mazel, A.; Leshem, Y.; Tiwari, B.S.; Levine, A. Induction of salt and osmotic stress tolerance by overexpression of an intracellular vesicle trafficking protein AtRab7 (AtRabG3e). Plant Physiol. 2004, 134, 118–128. [Google Scholar] [CrossRef]
  57. El-Esawi, M.A.; Alayafi, A.A. Overexpression of Rice Rab7 Gene Improves Drought and Heat Tolerance and Increases Grain Yield in Rice (Oryza sativa L.). Genes 2019, 10, 56. [Google Scholar] [CrossRef]
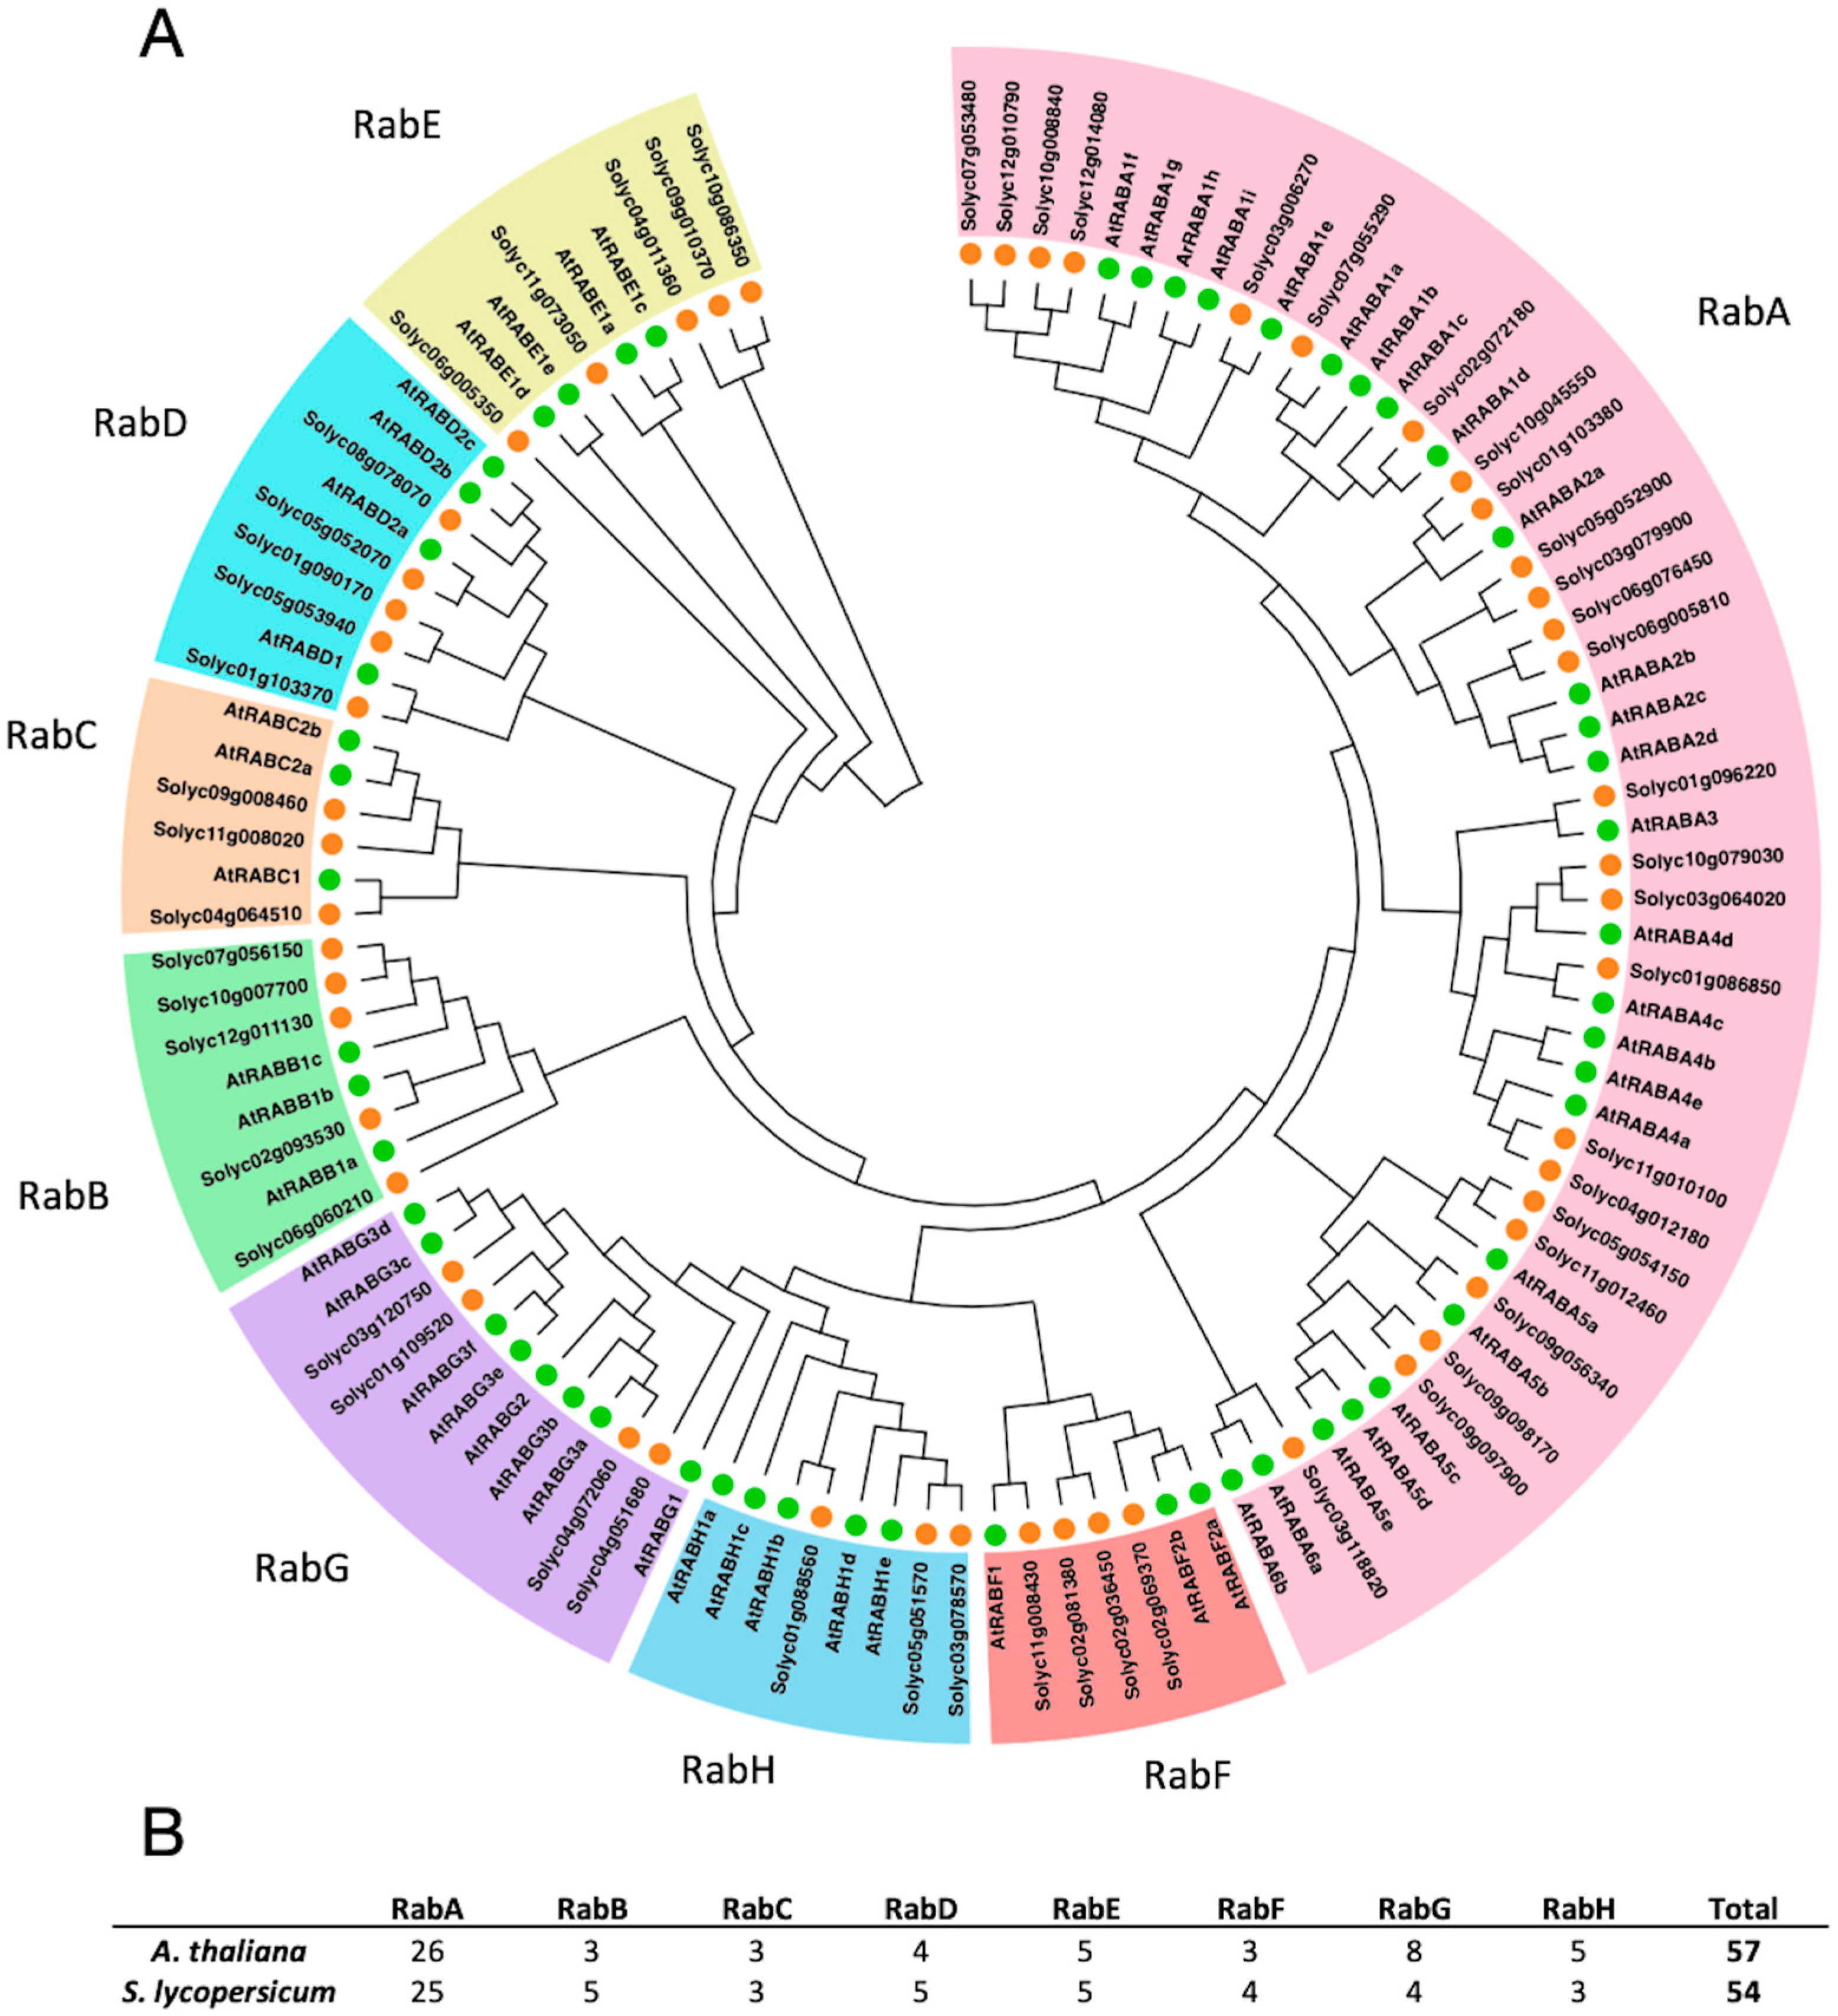
Figure 1. Identification and distribution of Rab GTPases in the genome of Solanum lycopersicum. In order to classify the putative Rab GTPases of S. lycopersicum, a search of the Arabidopsis thaliana Rab GTPase sequences obtained from the TAIR database was performed. (A) Phylogenetic tree constructed using the Neighbor-Joining method with 1000 bootstrap replicates. Rab GTPases from A. thaliana are represented by a green circle, and those from S. lycopersicum by an orange circle. (B) Table showing the number of Rab GTPases in A. thaliana and S. lycopersicum, as well as the number per subfamily in these species.
Genes 15 00453 g001
Figure 2. Genome-wide duplication of Rab GTPases. Chromosome locations and duplication of Solanum lycopersicum Rab GTPases. Chromosomes are displayed in different colors. Duplicated Rab GTPases are labeled and linked with blue lines. Duplication analysis between Rab genes was carried out using the chromosomal locations of Rab GTPases obtained from the PGDD database http://chibba.agtec.uga.edu/duplication/ (accessed on 3 November 2023). The graphic representation was made using the web-based service ClicO FS, freely available at http://clicofs.codoncloud.com (accessed on 15 December 2023).
Genes 15 00453 g002
Figure 3. Gene structure of Rab GTPases from Solanum lycopersicum. Intron–exon distribution according to the RabA–RabH subfamilies. In yellow, CDS; in blue, upstream/downstream regions; in black, introns.
Genes 15 00453 g003
Figure 4. Sequence logo comparison of the 54 Rab GTPase proteins of Solanum lycopersicum. RabSF motifs are indicated in orange, RabF motifs in purple, and G motifs in green.
Genes 15 00453 g004
Figure 5. Expression patterns of Rab GTPase genes in different tissues, organs, and developmental stages of tomato. Positive and negative gene expression values are shown in red and blue, respectively. F: flowers; S: shoots; L: leaves; VM: vegetative meristems; SS: seedling shoots; SR: seedling roots; MF: mature fruit; DF: developing fruit.
Genes 15 00453 g005
Figure 6. Expression profile of Rab GTPase genes in four tomato species under normal conditions. Expression values were obtained from the “Tomato Expression” database (http://malooflab.phytonetworks.org/apps/tomato-expression/ accessed on 21 October 2023). Transcript levels of Rab GTPase genes from wild tomato species relative to S. lycopersicum are represented. Positive and negative gene expression values are shown in red and blue, respectively. Nomenclature: SLY: Solanum lycopersicum; SHA: Solanum habrochaites; SPE: Solanum pennellii; and SPI: Solanum pimpinellifolium.
Genes 15 00453 g006
Figure 7. Relative expression of Rab GTPases under salt stress in Solanum chilense. Relative expression of RabA subfamily members from the TGN trafficking pathway, with SchRabB1b belonging to the secretory pathway, SchRabH1b to the retrograde route, and SchRabF1 and SchRabG3e to the endocytic pathway. Black bars indicate the relative expression of Rab GTPase genes in leaves. Different letters indicate significant differences (p < 0.05) according to a one-way ANOVA test.
Genes 15 00453 g007
Figure 8. Relative expression of Rab GTPases under salt stress in Solanum chilense roots. Relative expression of RabA subfamily members from the TGN trafficking pathway, with SchRabB1b belonging to the secretory pathway, SchRabH1b to the retrograde route, and SchRabF1 and SchRabG3e to the endocytic pathway. Black bars indicate the relative expression of Rab GTPase genes in roots. Different letters indicate significant differences (p < 0.05) according to a one-way ANOVA test.
Genes 15 00453 g008
Table 1. Putative Rab GTPases in the genome of Solanum lycopersicum. Chromosome location, genome coordinates (StartPos–EndPos), strand orientation (“+”: direct orientation, “-”: indirect orientation), protein length in amino acids, isoelectric point (pI) molecular weight (Mw) in kDa, GRAVY (Grand Average of Hydropathicity), and subcellular location are indicated. Subcellular locations are abbreviated as follows: Cyt: Cytoplasmic; Chl: Chloroplast; Nuc: Nuclear; Gol: Golgi complex; Csk: Cytoskeleton; Ex: Extracellular.
GeneNameChrNameChromosome LocationLength (aa)Isoelectric PointMw (kDa)GRAVYSubcellular Location
StartEndStrandWPSCELLO
Solyc01g086850.2181,771,05981,775,731-2266.7624.78−0.192CytCyt
Solyc01g088560.2183,336,02083,341,655-2097.6723.01−0.162ChlChl
Solyc01g090170.2183,802,20283,809,193+2045.122.45−0.254CytGol
Solyc01g096220.2187,314,71687,316,882+244627.1−0.199NucCyt
Solyc01g103370.2191,989,85291,994,839+2035.3322.5−0.277NucCyt
Solyc01g103380.2191,995,15791,998,149-2156.2223.8−0.291ChlChl
Solyc01g109520.2196,449,22196,452,841-2075.123.01−0.397ChlChl
Solyc02g036450.2230,788,59030,794,213-2017.7521.96−0.181ChlChl
Solyc02g069370.2239,281,37539,289,536-2015.8921.66−0.155ChlChl
Solyc02g072180.2241,496,82241,503,133+2185.524.09−0.375NucCyt
Solyc02g081380.2245,368,87445,373,407-2016.1521.82−0.216ChlChl
Solyc02g093530.2254,369,66054,374,256-2127.7223.29−0.293CytCyt
Solyc03g006270.23888,904890,977+2175.6324.01−0.290CytCyt
Solyc03g064020.2337,223,95937,225,122+2256.1224.96−0.204CytCyt
Solyc03g078570.2351,178,67851,181,240-2086.3923.14−0.255ChlCyt
Solyc03g079900.2351,787,67151,789,397+2166.9723.96−0.264CskCyt
Solyc03g118820.2367,626,32267,629,418+2435.3723.16−0.301NucCyt
Solyc03g120750.2369,027,06669,031,274-2065.2122.97−0.338ChlCyt
Solyc04g011360.243,839,2673,844,110-2177.6523.9−0.378NucChl
Solyc04g012180.244,461,5324,467,418-2238.4424.64−0.266CytCyt
Solyc04g051680.2450,982,37250,985,730-2204.9324.71−0.284CytCyt
Solyc04g064510.2455,670,91255,675,897-2105.423.27−0.212ChlChl
Solyc04g072060.2459,116,63359,126,825-2055.4622.93−0.319ChlCyt
Solyc05g051570.2561,938,79461,942,841-2086.423.09−0.169ChlChl
Solyc05g052070.2562,410,36862,413,664-2045.2722.62−0.373CytCyt
Solyc05g052900.2563,076,70263,078,931-2167.6823.99−0.240CytCyt
Solyc05g053940.2563,958,47363,963,310-2045.2622.41−0.264CskGol
Solyc05g054150.2564,106,69264,108,791+2275.8425.05−0.388CytCyt
Solyc06g005350.26362,156370,204-1459.4416.14−0.187CytChl
Solyc06g005810.26839,934842,843-2176.123.83−0.289CytCyt
Solyc06g060210.1638,174,98338,175,594+2048.823.06−0.357ChlCyt
Solyc06g076450.2647,498,29847,500,384-2166.4423.82−0.244CytCyt
Solyc07g053480.2761,927,83461,930,515+2185.6624.09−0.254CytCyt
Solyc07g055290.2763,373,50463,378,793-2195.7324.16−0.316CytCyt
Solyc07g056150.2763,994,88563,999,176-2136.923.19−0.194CytMit
Solyc08g078070.2861,918,5446,1921,746+2045.4822.5−0.302NucGol
Solyc09g008460.291,905,6561,911,197-2175.7323.65−0.274ChlChl
Solyc09g010370.293,753,8933,759,018-2177.6523.95−0.361ChlChl
Solyc09g056340.2948,781,28448,783,613+2114.9723.61−0.353CytCyt
Solyc09g097900.2971,891,30271,896,403-2174.9624.26−0.337CytCyt
Solyc09g098170.2972,044,88972,048,527+2185.1324.29−0.410CytCyt
Solyc10g007700.2101,953,6811,958,548-2126.923.12−0.221CytCyt
Solyc10g008840.2102,900,4382,901,941+2165.5324.29−0.256CytCyt
Solyc10g045550.11034,584,59434,590,416+2168.3423.92−0.287CytChl
Solyc10g079030.11060,670,71360,672,194-2276.3224.94−0.200ChlMit
Solyc10g086350.11065,205,56665,210,133-2178.3723.87−0.349ChlChl
Solyc11g008020.1112,238,2132,241,626+2179.2824.26−0.319ChlEx
Solyc11g008430.1112,614,3242,620,969-2015.9121.57−0.191CytChl
Solyc11g010100.1113,222,4593,224,358+2256.3324.57−0.199CytCyt
Solyc11g012460.1115,297,6085,298,810+2775.3130.85−0.383NucNuc
Solyc11g073050.11156,164,98456,168,738+2178.3723.8−0.313ChlChl
Solyc12g010790.1123,711,2663,713,629-2185.4824.05−0.253CytCyt
Solyc12g011130.1123,971,2273,974,056-2126.923.14−0.212CytCyt
Solyc12g014080.1124,894,0534,896,737-2185.5324.29−0.256CytCyt
Table 2. Rab GTPases homologous of Solanum lycopersicum in Solanum chilense. For the S. chilense Rab GTPase sequences used for differential expression assays under salt stress conditions, the names of those homologous S. lycopersicum Rab GTPases were used. Then, based on the phylogenetic tree and given the high conservation in this superfamily, they were renamed according to the nomenclature used in A. thaliana.
Homologous Sequence in S. lycopersicumName Given to Rab GTPases in S. chilense (Reference to Arabidopsis Rab GTPases)
Solyc07g055290SchRabA1b
Solyc02g072180SchRabA1d
Solyc01g103380SchRabA2a
Solyc01g096220SchRabA3
Solyc01g086850SchRabA4c
Solyc09g056340SchRabA5b
Solyc02g093530SchRabB1b
Solyc01g088560SchRabH1b
Solyc11g008430SchRabF1
Solyc01g109520SchRabG3e
Disclaimer/Publisher’s Note: The statements, opinions and data contained in all publications are solely those of the individual author(s) and contributor(s) and not of MDPI and/or the editor(s). MDPI and/or the editor(s) disclaim responsibility for any injury to people or property resulting from any ideas, methods, instructions or products referred to in the content.