
Neurofilaments in Sporadic and Familial Amyotrophic Lateral Sclerosis: A Systematic Review and Meta-Analysis
 ,
,
Abstract
:1. Introduction
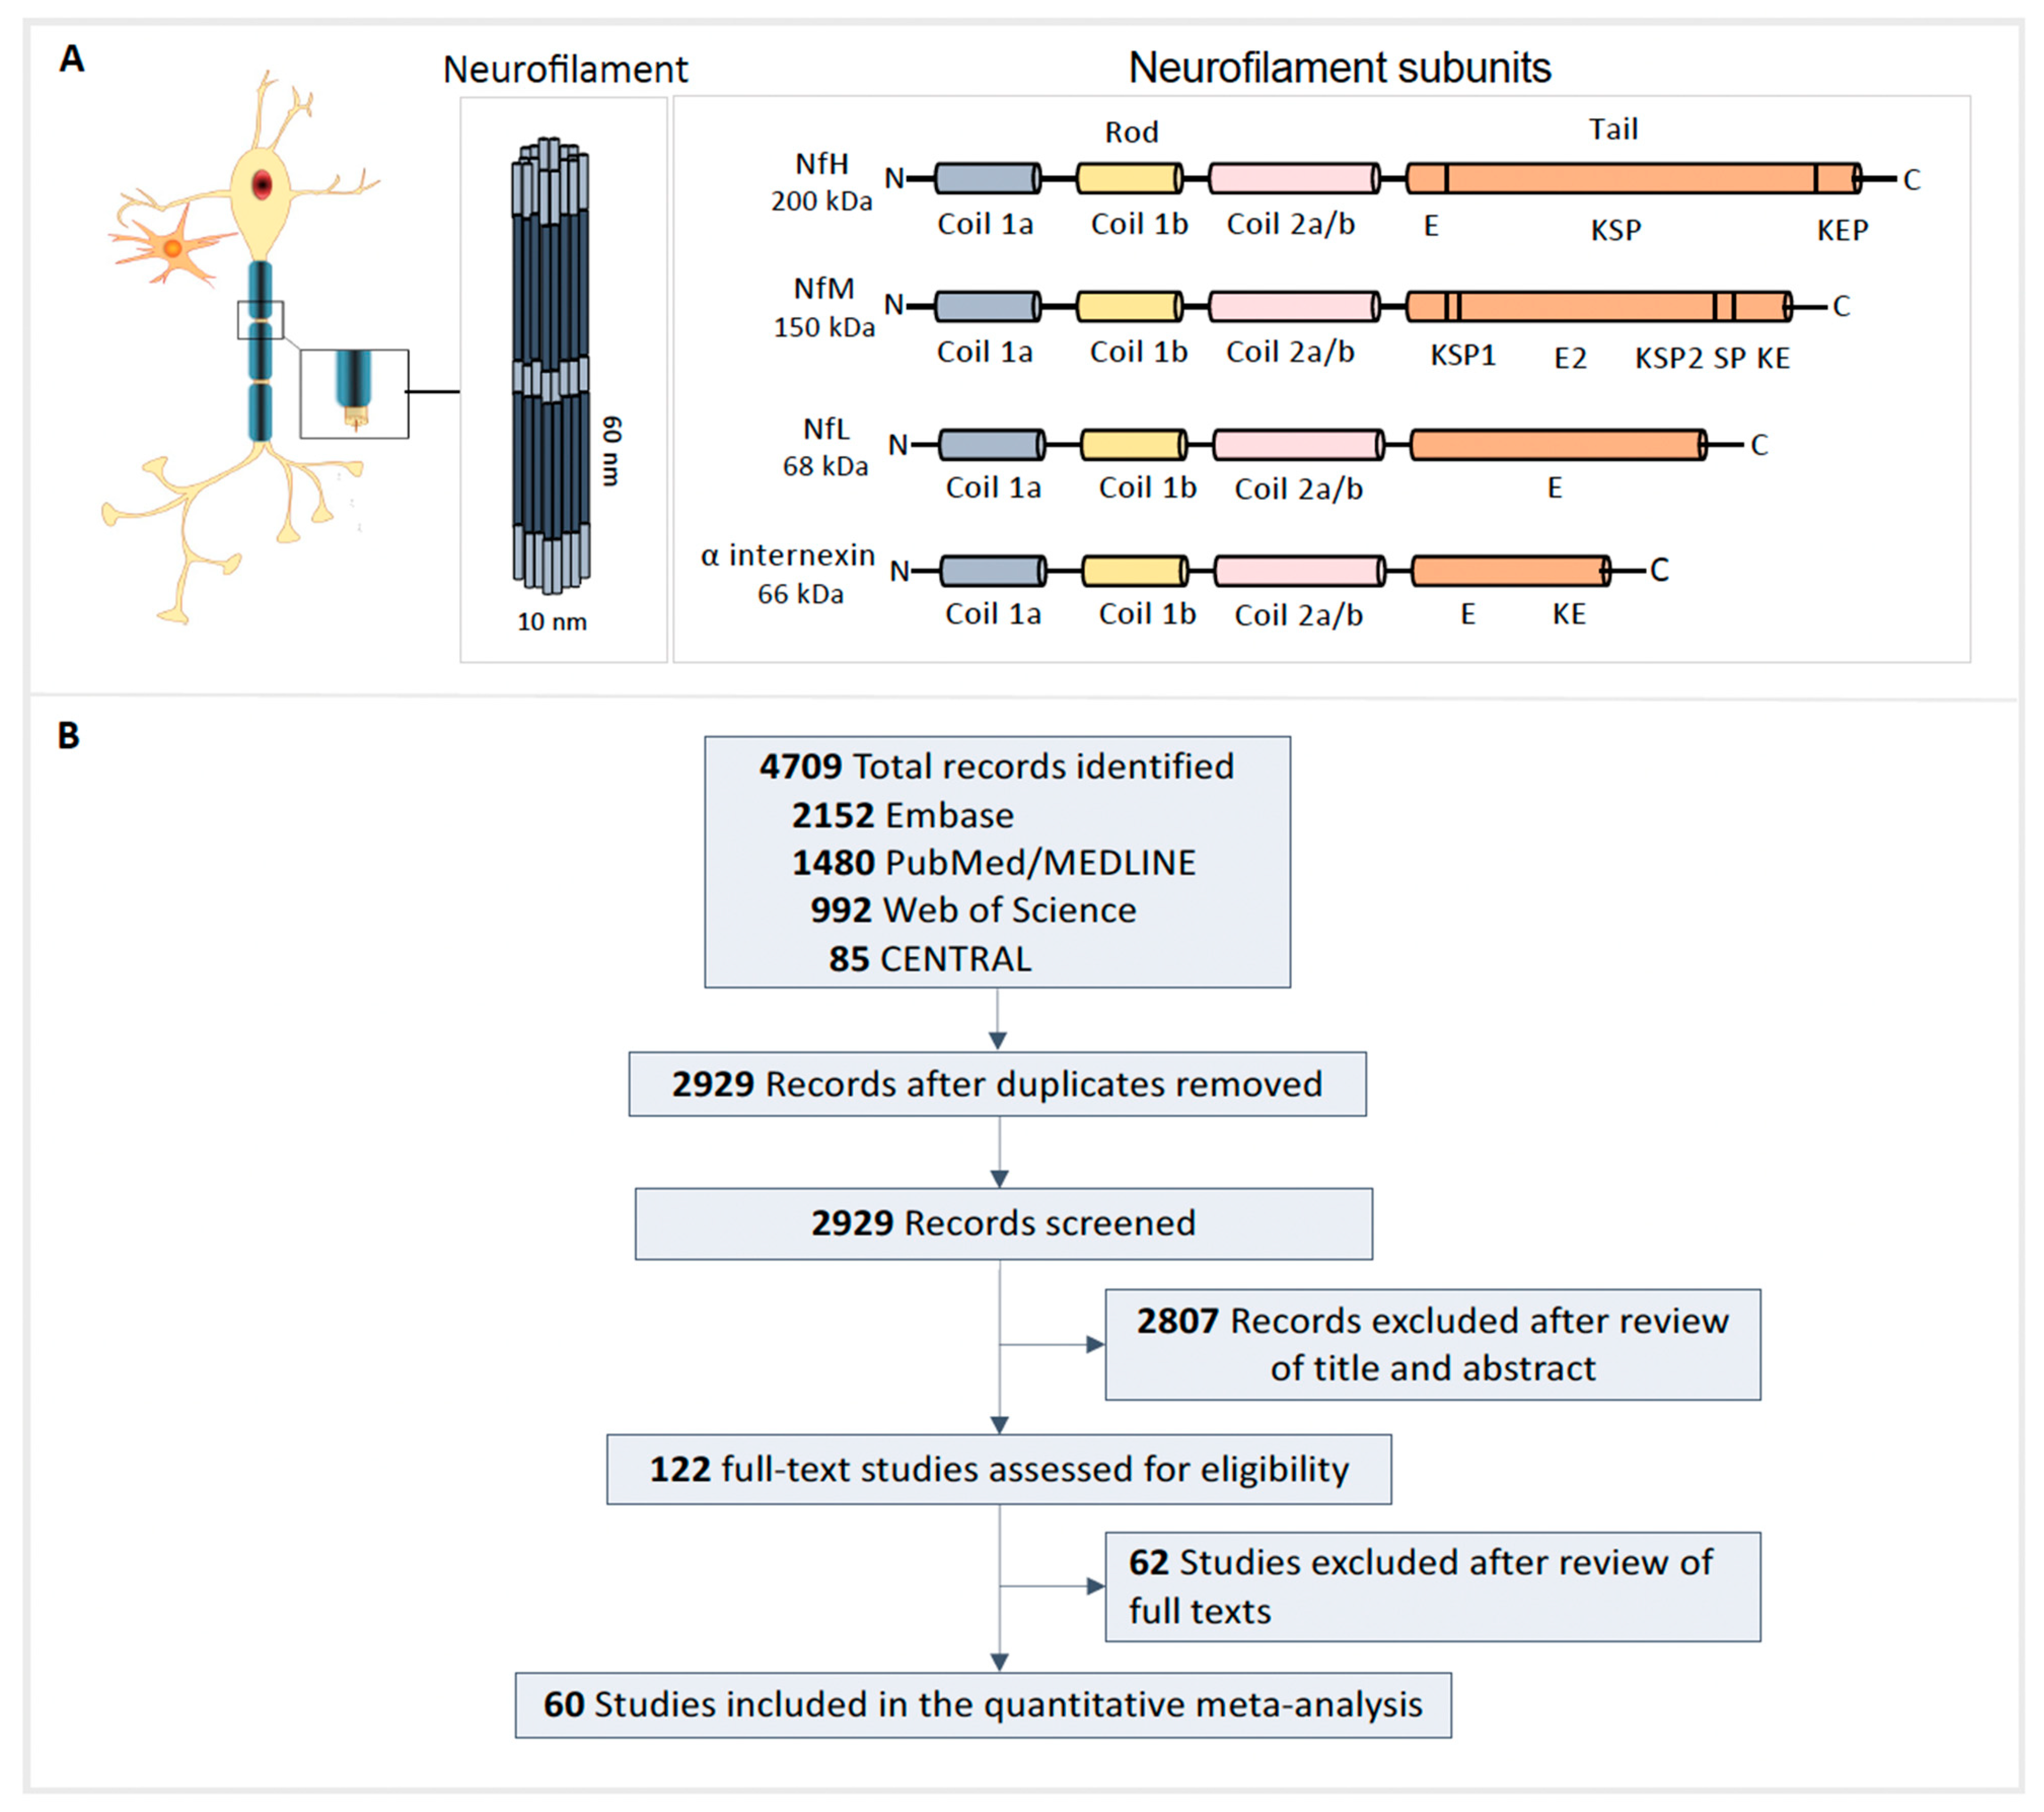
2. Methods
2.1. Inclusion and Exclusion Criteria
2.2. Outcome Assessment
2.3. Quality Assessment
2.4. Quantification of Plasma and Serum NfL
2.5. Statistical Analysis
3. Results
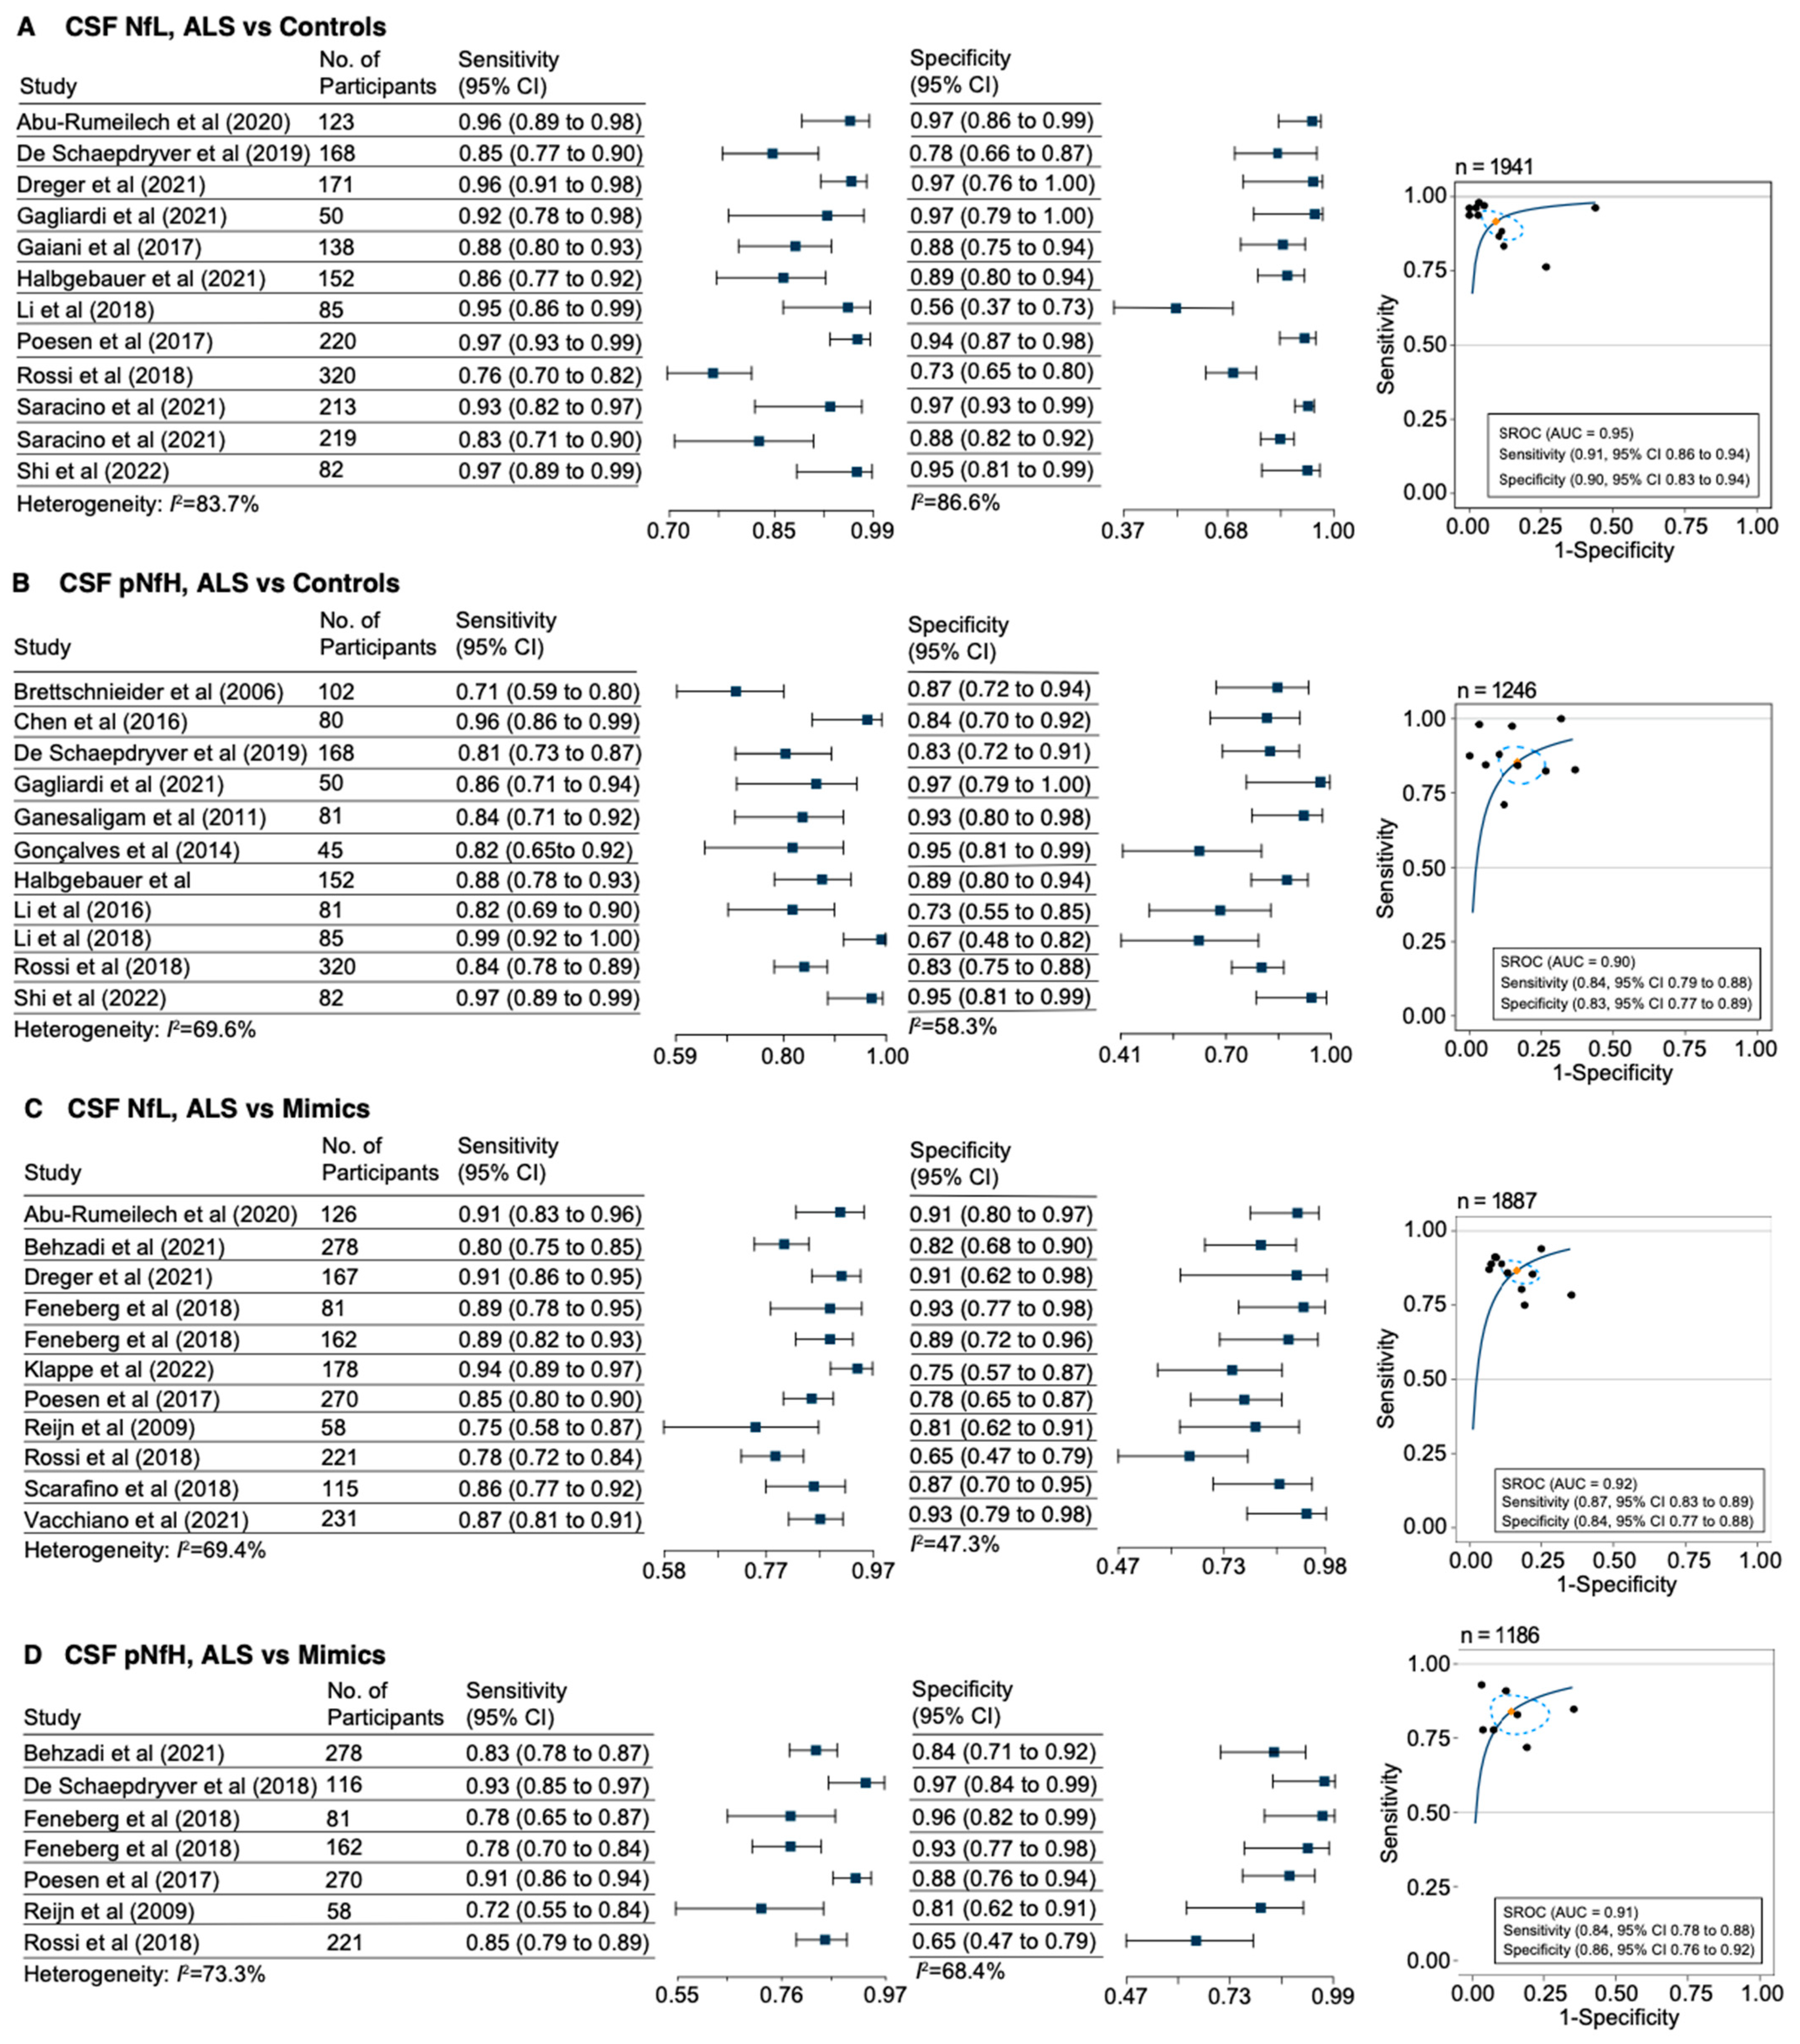
3.1. Diagnostic Accuracy of Neurofilaments
3.2. Correlation of Plasma and Serum NfL
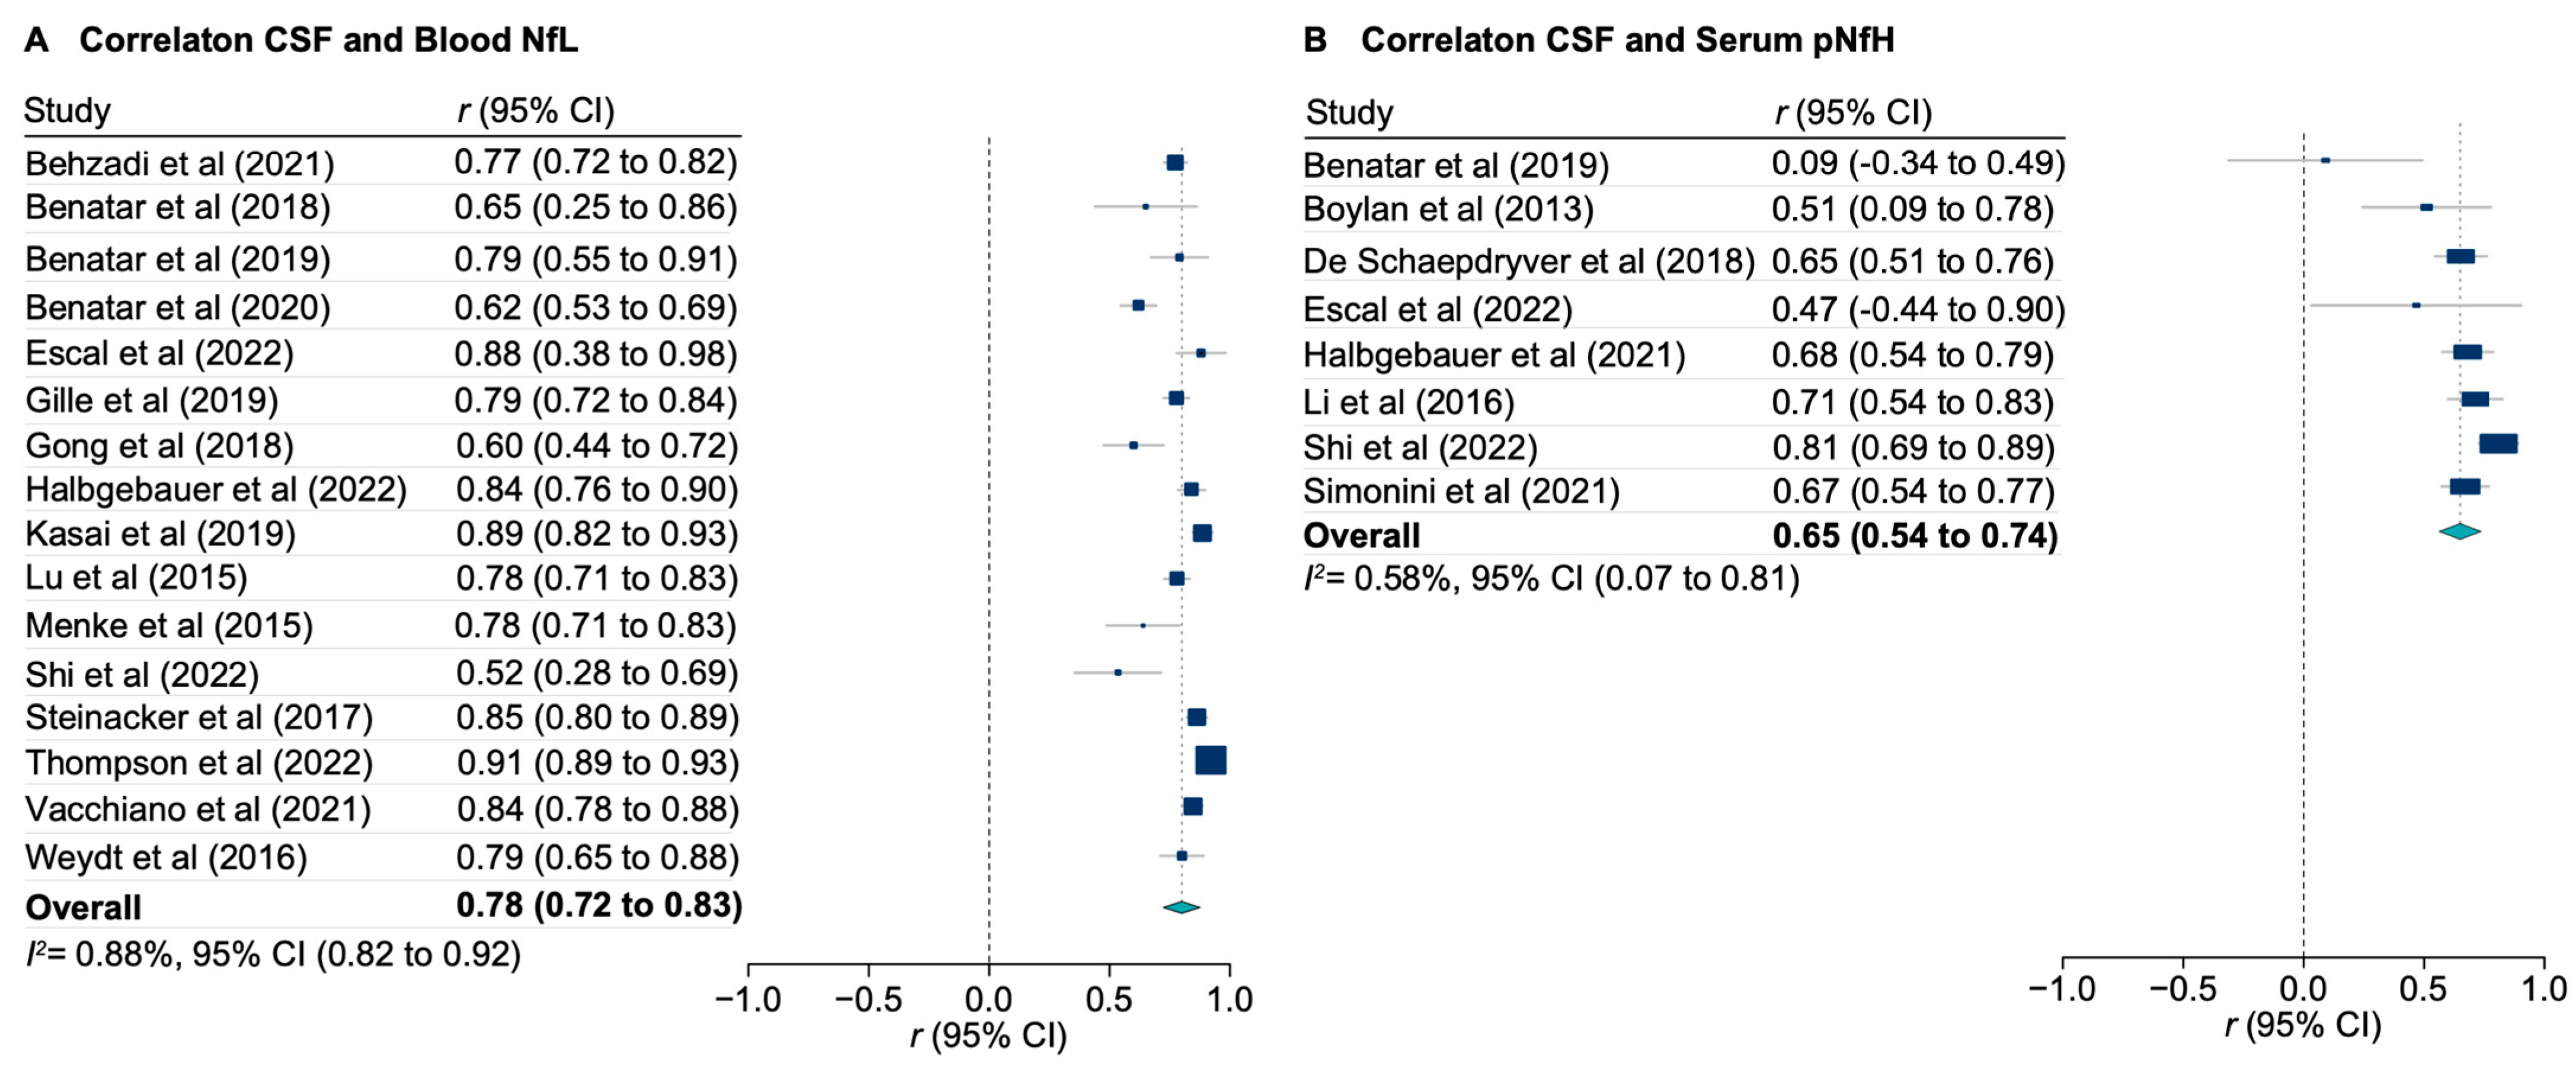
3.3. Correlation of CSF and Blood Neurofilaments
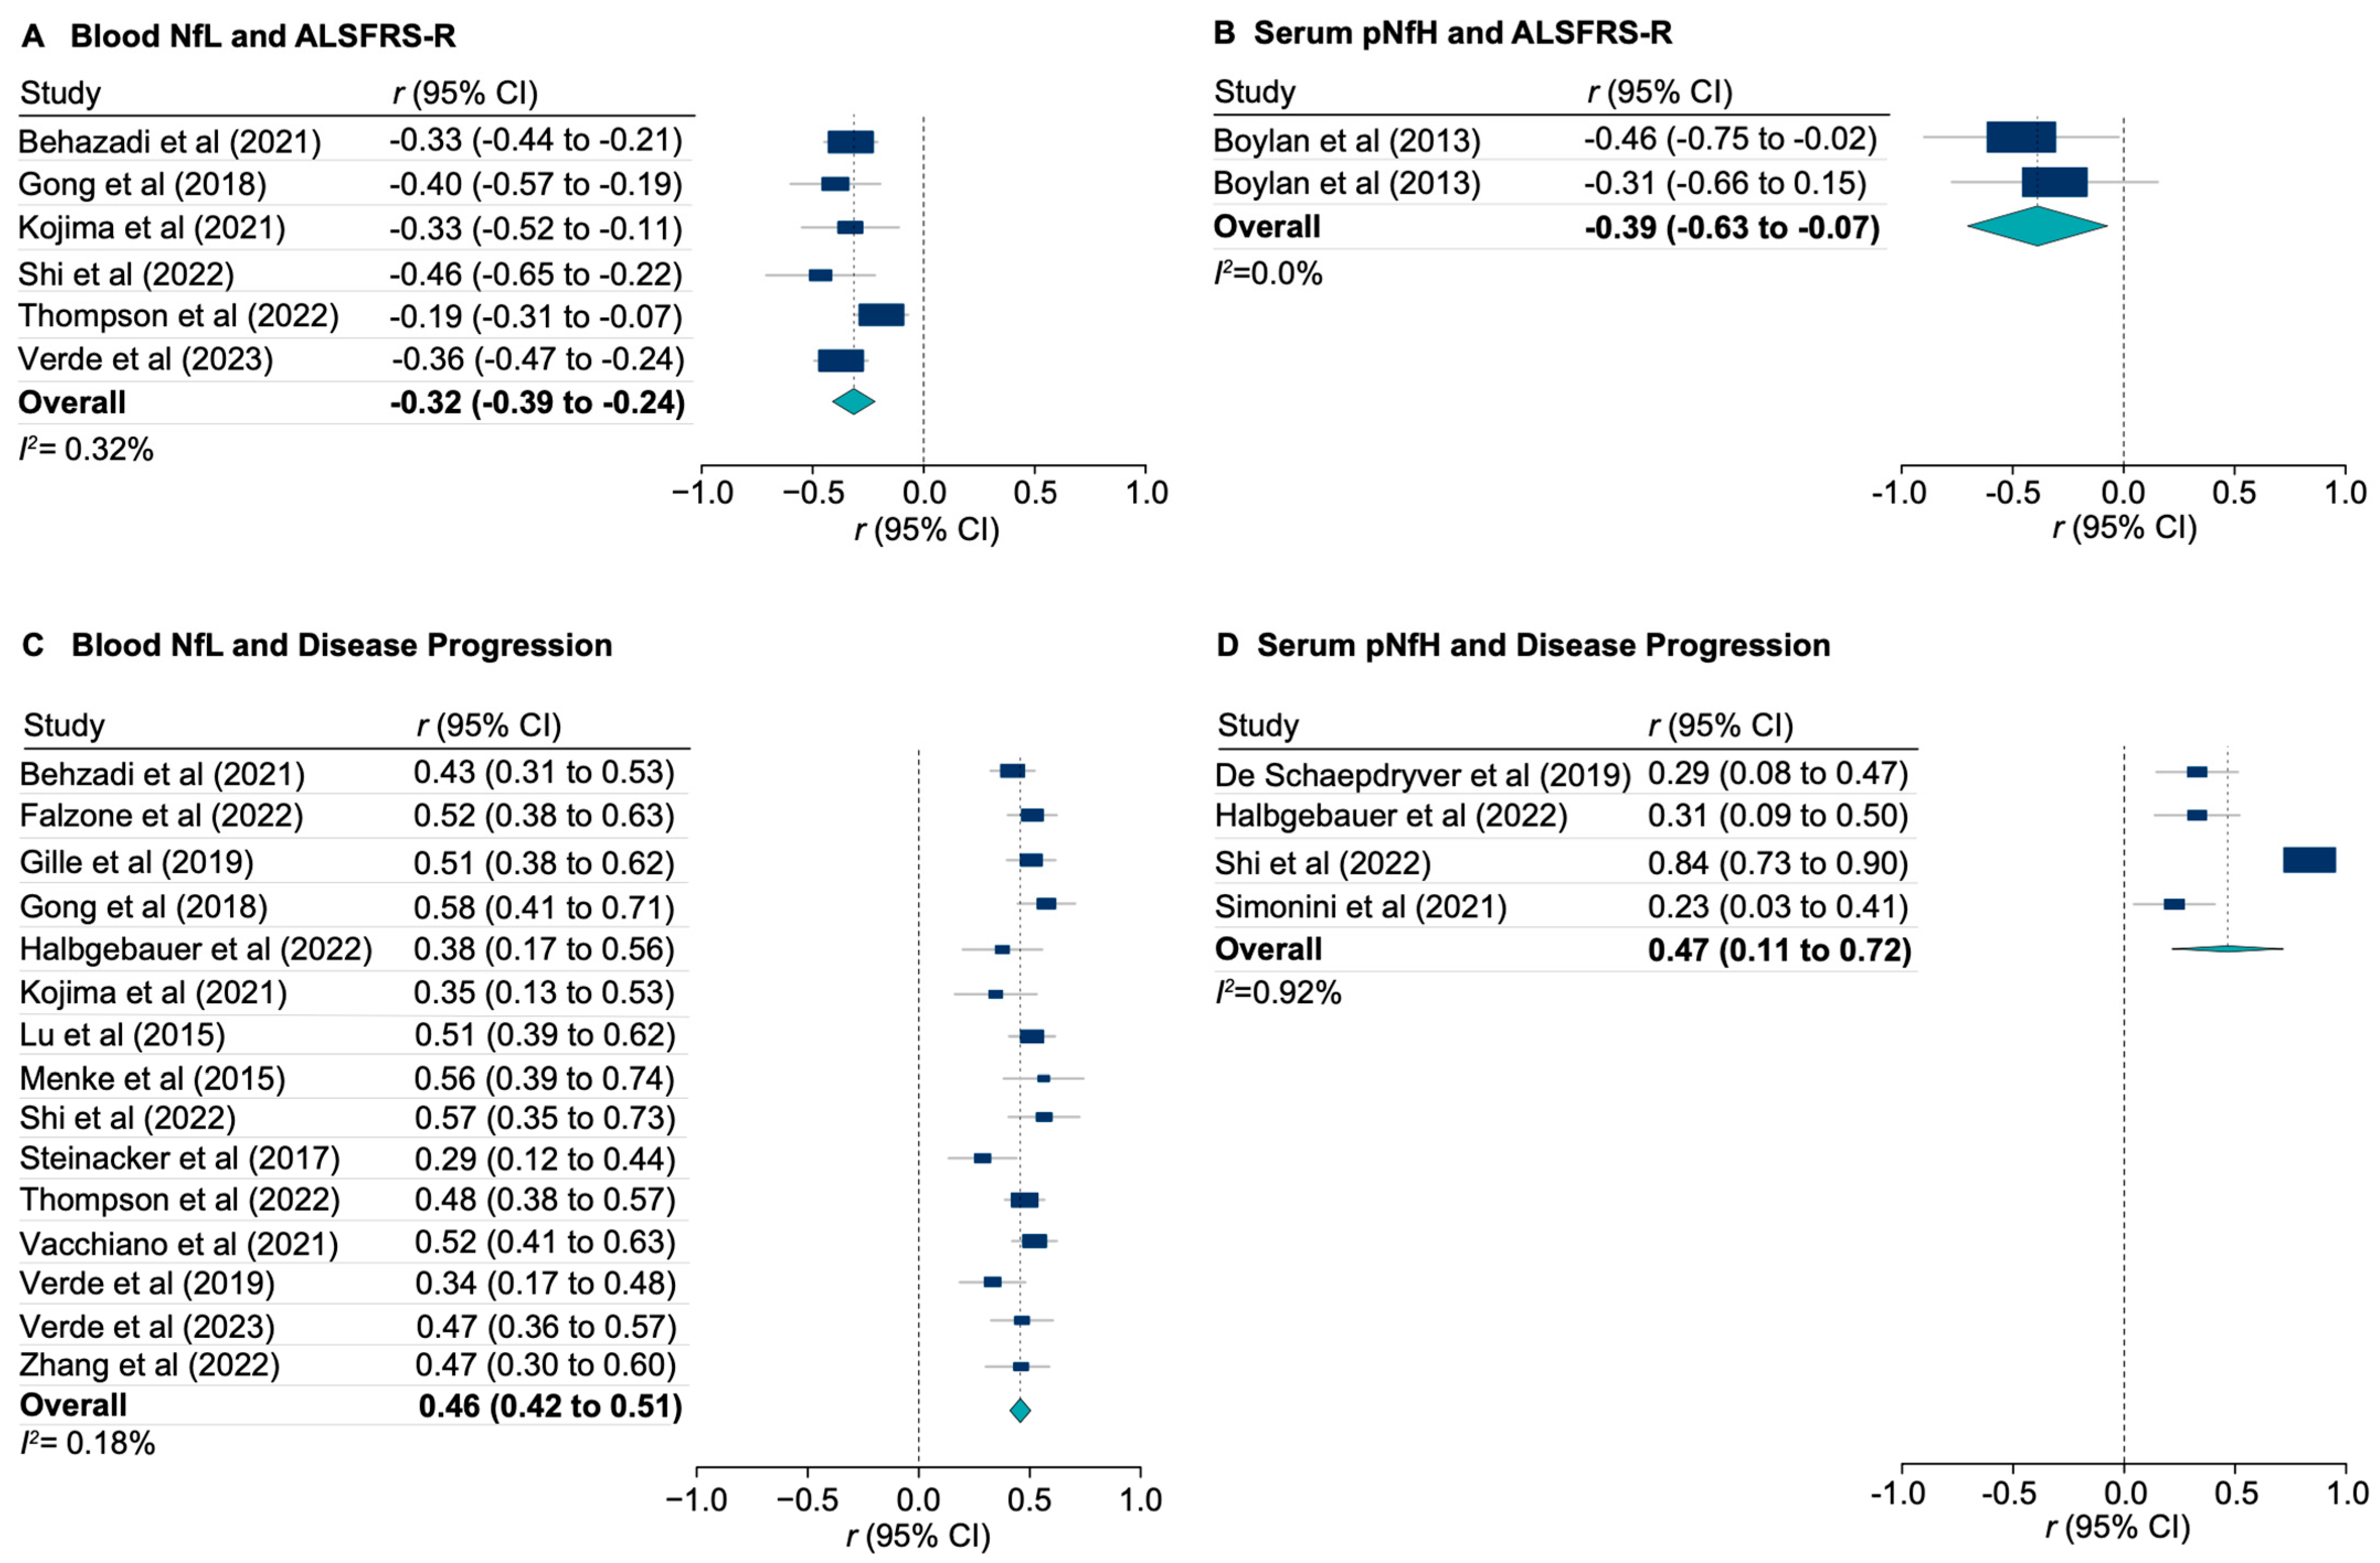
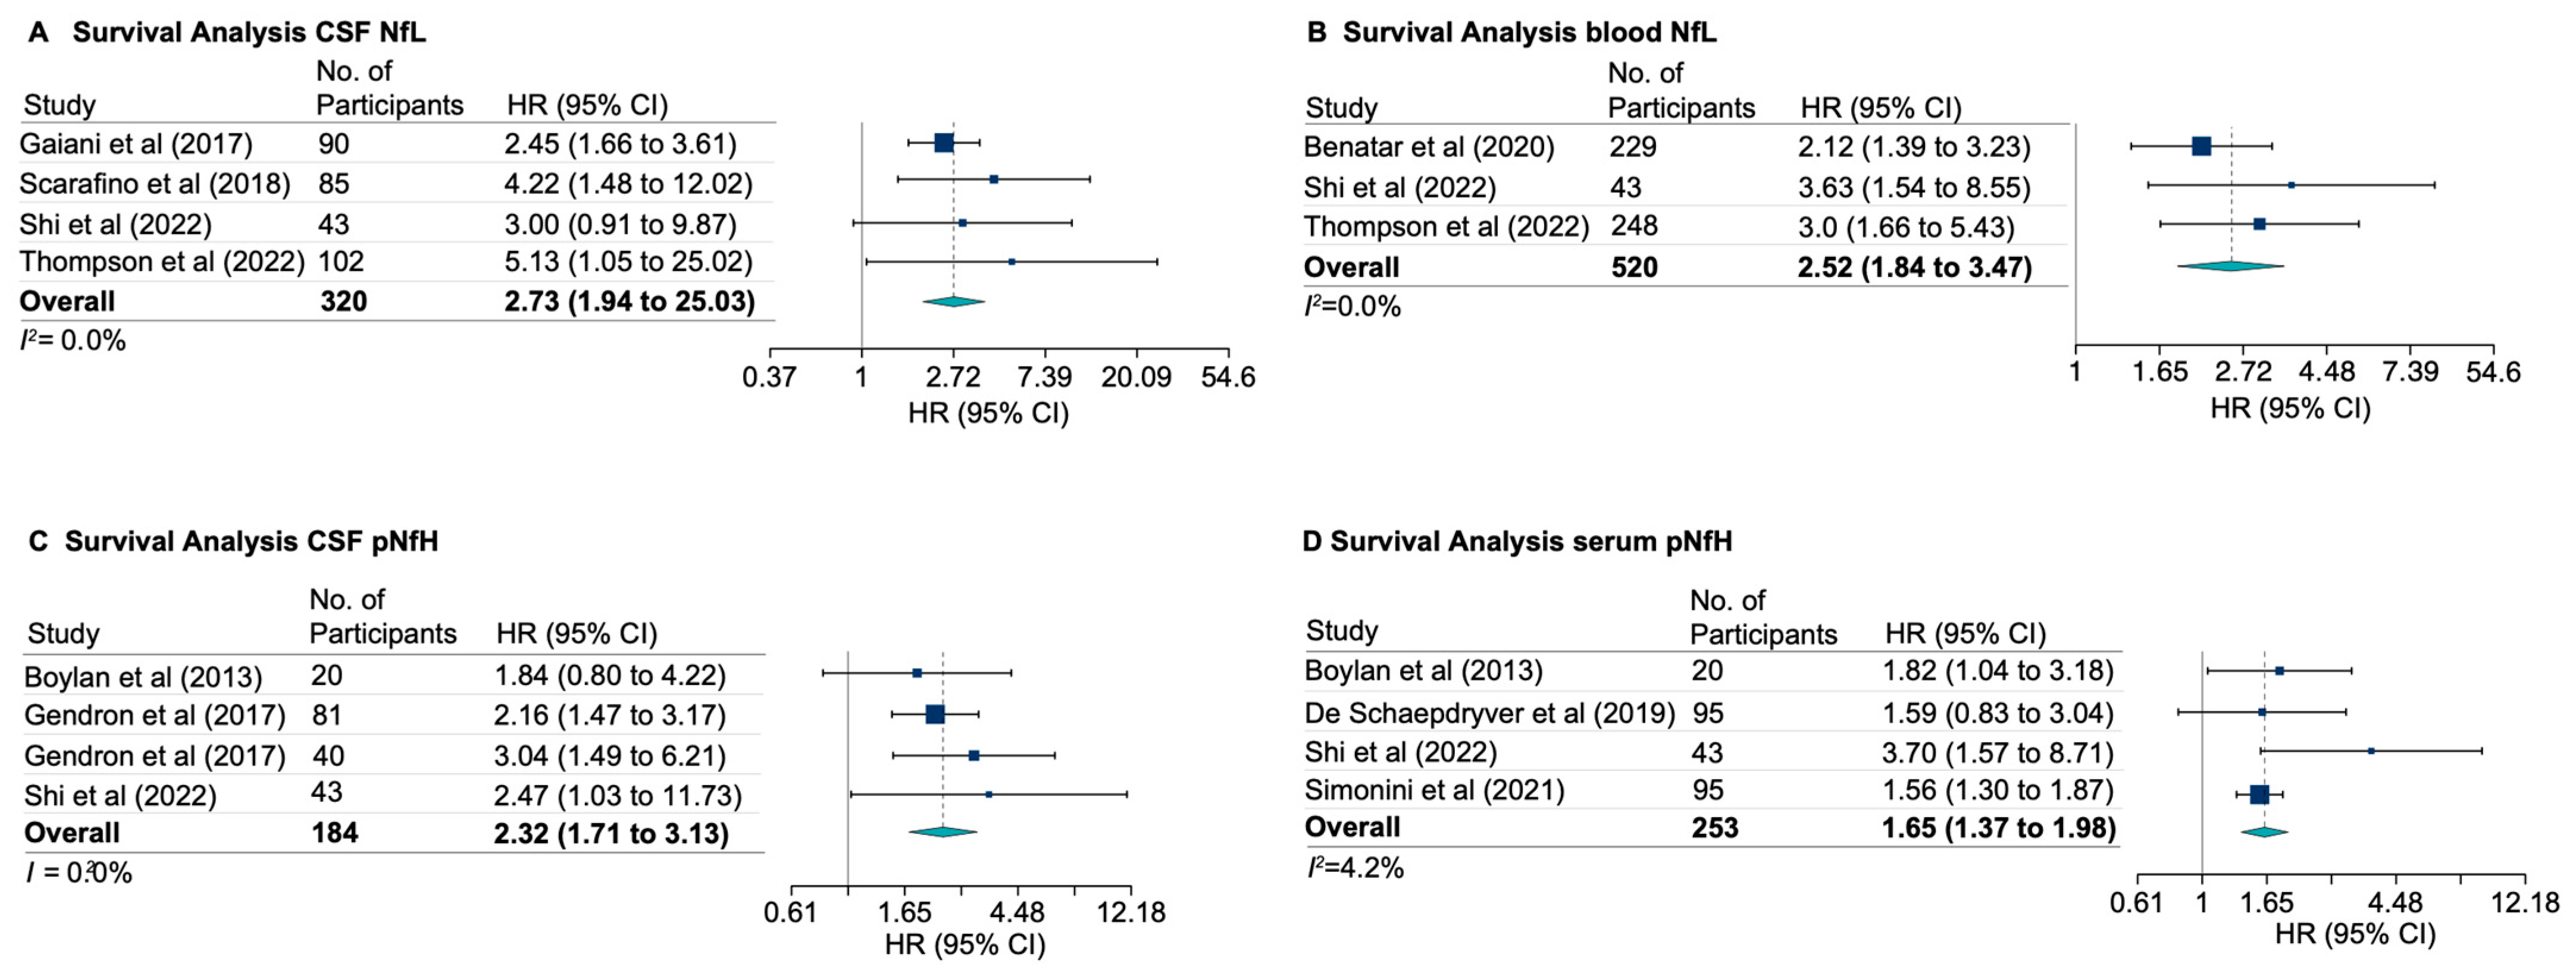
3.4. Neurofilaments and ALS Functional Rating Score, Disease Progression, and Survival
3.5. Neurofilaments in FTD-ALS Spectrum and Genetic Forms of ALS
3.6. Risk of Bias and Concerns for Applicability Assessment
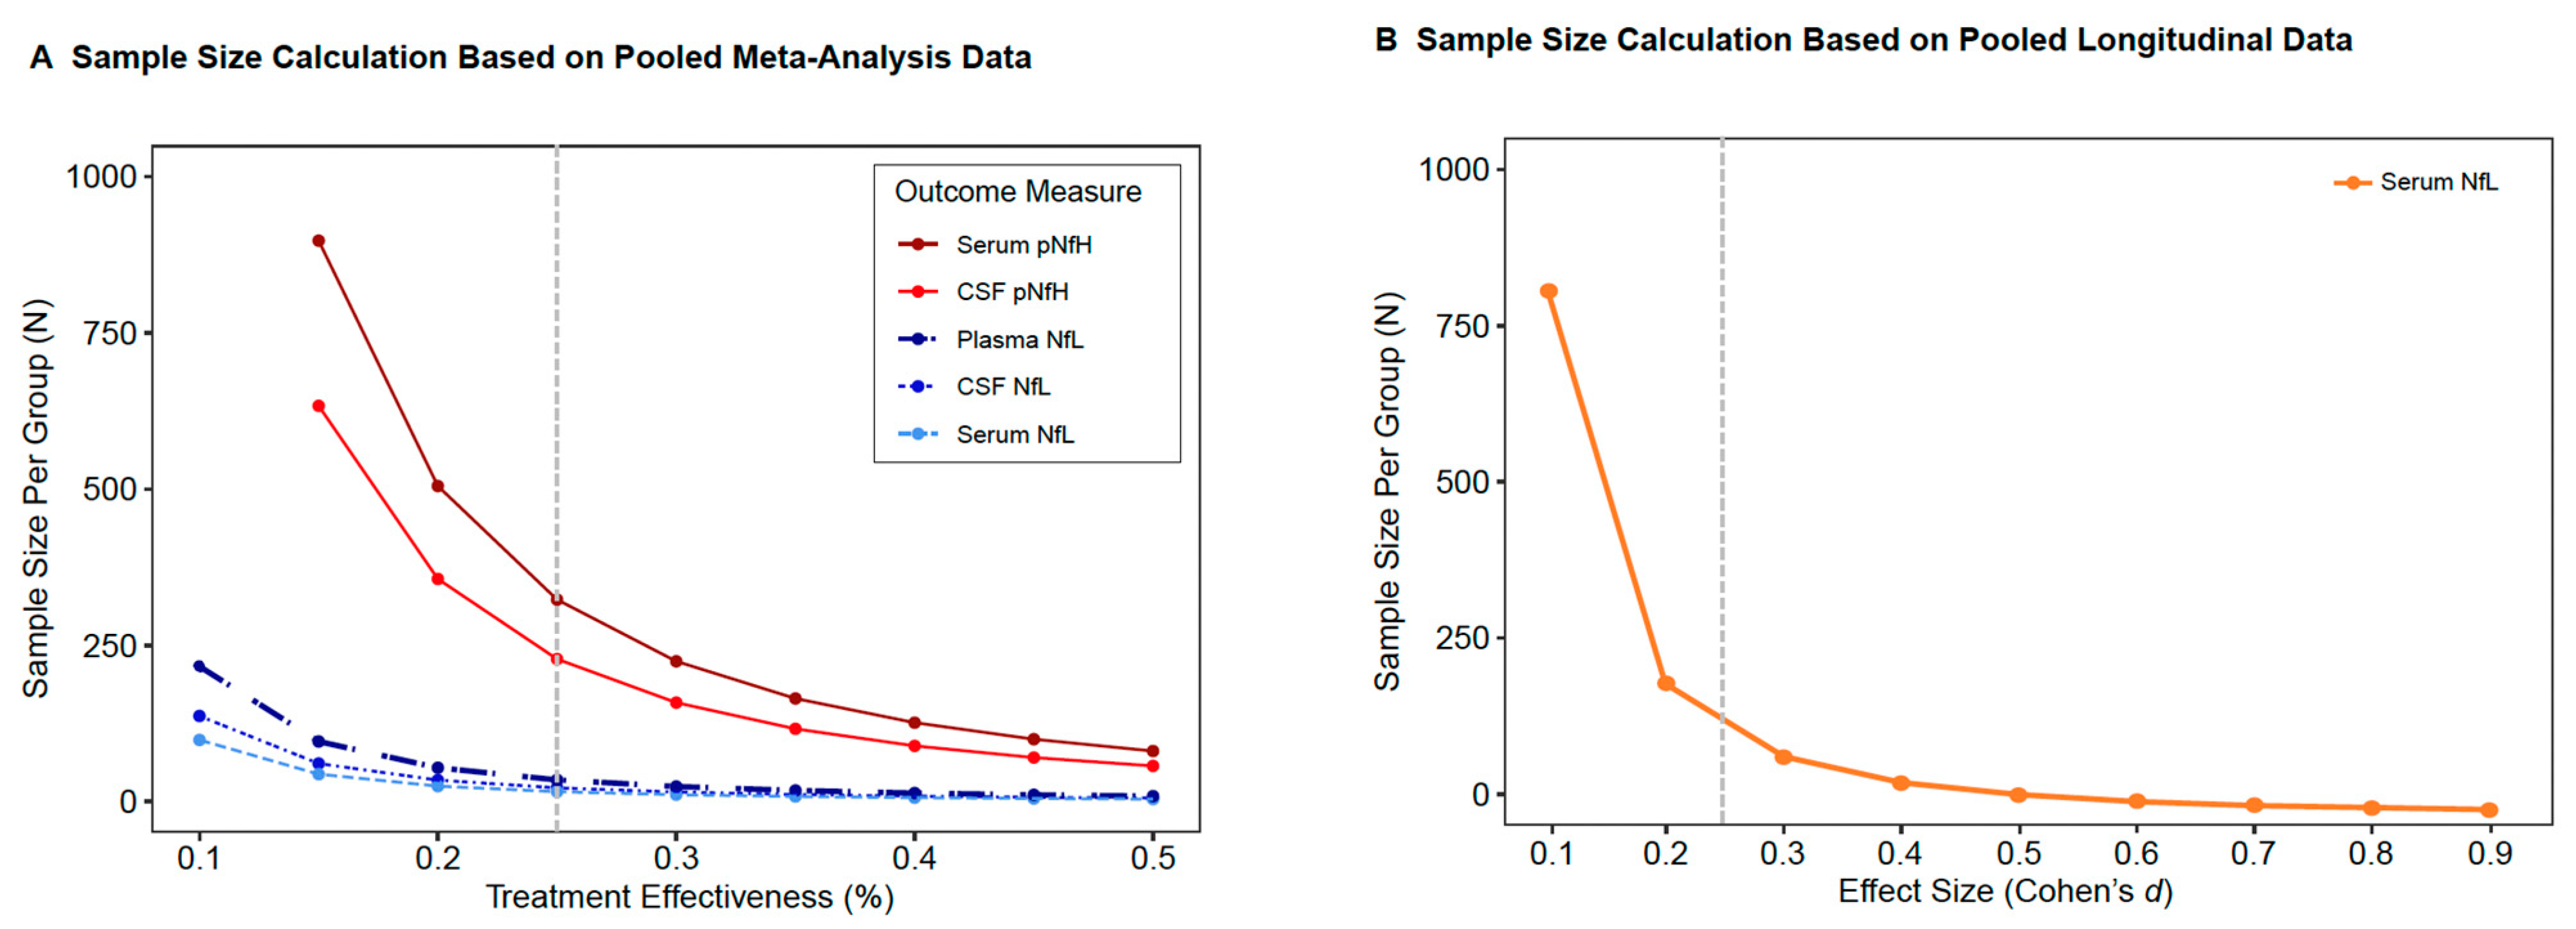
3.7. Neurofilaments as Outcome Measures in Future Clinical Trials
4. Discussion
Supplementary Materials
Author Contributions
Funding
Acknowledgments
Conflicts of Interest
References
- Kiernan, M.C.; Vucic, S.; Cheah, B.C.; Turner, M.R.; Eisen, A.; Hardiman, O.; Burrell, J.R.; Zoing, M.C. Amyotrophic lateral sclerosis. Lancet 2011, 377, 942–955. [Google Scholar] [CrossRef] [PubMed]
- Beghi, E.; Chiò, A.; Couratier, P.; Esteban, J.; Hardiman, O.; Logroscino, G.; Millul, A.; Mitchell, D.; Preux, P.M.; Pupillo, E.; et al. The epidemiology and treatment of ALS: Focus on the heterogeneity of the disease and critical appraisal of therapeutic trials. Amyotroph. Lateral Scler. 2011, 12, 1–10. [Google Scholar] [CrossRef] [PubMed]
- DeJesus-Hernandez, M.; Mackenzie, I.R.; Boeve, B.F.; Boxer, A.L.; Baker, M.; Rutherford, N.J.; Nicholson, A.M.; Finch, N.A.; Flynn, H.; Adamson, J.; et al. Expanded GGGGCC hexanucleotide repeat in noncoding region of C9ORF72 causes chromosome 9p-linked FTD and ALS. Neuron 2011, 72, 245–256. [Google Scholar] [CrossRef] [PubMed]
- Neumann, M.; Sampathu, D.M.; Kwong, L.K.; Truax, A.C.; Micsenyi, M.C.; Chou, T.T.; Bruce, J.; Schuck, T.; Grossman, M.; Clark, C.M.; et al. Ubiquitinated TDP-43 in frontotemporal lobar degeneration and amyotrophic lateral sclerosis. Science 2006, 314, 130–133. [Google Scholar] [CrossRef] [PubMed]
- Rosen, D.R.; Siddique, T.; Patterson, D.; Figlewicz, D.A.; Sapp, P.; Hentati, A.; Donaldson, D.; Goto, J.; O’Regan, J.P.; Deng, H.X.; et al. Mutations in Cu/Zn superoxide dismutase gene are associated with familial amyotrophic lateral sclerosis. Nature 1993, 362, 59–62. [Google Scholar] [CrossRef] [PubMed]
- Kwiatkowski, T.J., Jr.; Bosco, D.A.; Leclerc, A.L.; Tamrazian, E.; Vanderburg, C.R.; Russ, C.; Davis, A.; Gilchrist, J.; Kasarskis, E.J.; Munsat, T.; et al. Mutations in the FUS/TLS gene on chromosome 16 cause familial amyotrophic lateral sclerosis. Science 2009, 323, 1205–1208. [Google Scholar] [CrossRef] [PubMed]
- Gitcho, M.A.; Baloh, R.H.; Chakraverty, S.; Mayo, K.; Norton, J.B.; Levitch, D.; Hatanpaa, K.J.; White, C.L., 3rd; Bigio, E.H.; Caselli, R.; et al. TDP-43 A315T mutation in familial motor neuron disease. Ann. Neurol. 2008, 63, 535–538. [Google Scholar] [CrossRef] [PubMed]
- Troost, D.; Sillevis Smitt, P.A.; de Jong, J.M.; Swaab, D.F. Neurofilament and glial alterations in the cerebral cortex in amyotrophic lateral sclerosis. Acta Neuropathol. 1992, 84, 664–673. [Google Scholar] [CrossRef] [PubMed]
- Hirano, A.; Donnenfeld, H.; Sasaki, S.; Nakano, I. Fine structural observations of neurofilamentous changes in amyotrophic lateral sclerosis. J. Neuropathol. Exp. Neurol. 1984, 43, 461–470. [Google Scholar] [CrossRef]
- Lin, H.; Zhai, J.; Schlaepfer, W.W. RNA-binding protein is involved in aggregation of light neurofilament protein and is implicated in the pathogenesis of motor neuron degeneration. Hum. Mol. Genet. 2005, 14, 3643–3659. [Google Scholar] [CrossRef]
- Williamson, T.L.; Bruijn, L.I.; Zhu, Q.; Anderson, K.L.; Anderson, S.D.; Julien, J.P.; Cleveland, D.W. Absence of neurofilaments reduces the selective vulnerability of motor neurons and slows disease caused by a familial amyotrophic lateral sclerosis-linked superoxide dismutase 1 mutant. Proc. Natl. Acad. Sci. USA 1998, 95, 9631–9636. [Google Scholar] [CrossRef] [PubMed]
- Liu, Q.; Xie, F.; Siedlak, S.L.; Nunomura, A.; Honda, K.; Moreira, P.I.; Zhua, X.; Smith, M.A.; Perry, G. Neurofilament proteins in neurodegenerative diseases. Cell Mol. Life Sci. 2004, 61, 3057–3075. [Google Scholar] [CrossRef] [PubMed]
- Lee, M.K.; Cleveland, D.W. Neuronal intermediate filaments. Annu. Rev. Neurosci. 1996, 19, 187–217. [Google Scholar] [CrossRef] [PubMed]
- Reiber, H. Flow rate of cerebrospinal fluid (CSF)—A concept common to normal blood-CSF barrier function and to dysfunction in neurological diseases. J. Neurol. Sci. 1994, 122, 189–203. [Google Scholar] [CrossRef] [PubMed]
- Rosengren, L.E.; Karlsson, J.E.; Karlsson, J.O.; Persson, L.I.; Wikkelso, C. Patients with amyotrophic lateral sclerosis and other neurodegenerative diseases have increased levels of neurofilament protein in CSF. J. Neurochem. 1996, 67, 2013–2018. [Google Scholar] [CrossRef] [PubMed]
- Poesen, K.; De Schaepdryver, M.; Stubendorff, B.; Gille, B.; Muckova, P.; Wendler, S.; Prell, T.; Ringer, T.M.; Rhode, H.; Stevens, O.; et al. Neurofilament markers for ALS correlate with extent of upper and lower motor neuron disease. Neurology 2017, 88, 2302–2309. [Google Scholar] [CrossRef] [PubMed]
- Feneberg, E.; Oeckl, P.; Steinacker, P.; Verde, F.; Barro, C.; Van Damme, P.; Gray, E.; Grosskreutz, J.; Jardel, C.; Kuhle, J.; et al. Multicenter evaluation of neurofilaments in early symptom onset amyotrophic lateral sclerosis. Neurology 2018, 90, e22–e30. [Google Scholar] [CrossRef] [PubMed]
- Weydt, P.; Oeckl, P.; Huss, A.; Müller, K.; Volk, A.E.; Kuhle, J.; Knehr, A.; Andersen, P.M.; Prudlo, J.; Steinacker, P.; et al. Neurofilament levels as biomarkers in asymptomatic and symptomatic familial amyotrophic lateral sclerosis. Ann. Neurol. 2016, 79, 152–158. [Google Scholar] [CrossRef]
- Boylan, K.B.; Glass, J.D.; Crook, J.E.; Yang, C.; Thomas, C.S.; Desaro, P.; Johnston, A.; Overstreet, K.; Kelly, C.; Polak, M.; et al. Phosphorylated neurofilament heavy subunit (pNF-H) in peripheral blood and CSF as a potential prognostic biomarker in amyotrophic lateral sclerosis. J. Neurol. Neurosurg. Psychiatry 2013, 84, 467–472. [Google Scholar] [CrossRef]
- Rissin, D.M.; Kan, C.W.; Campbell, T.G.; Howes, S.C.; Fournier, D.R.; Song, L.; Piech, T.; Patel, P.P.; Chang, L.; Rivnak, A.J.; et al. Single-molecule enzyme-linked immunosorbent assay detects serum proteins at subfemtomolar concentrations. Nat. Biotechnol. 2010, 28, 595–599. [Google Scholar] [CrossRef]
- Shahim, P.; Gren, M.; Liman, V.; Andreasson, U.; Norgren, N.; Tegner, Y.; Mattsson, N.; Andreasen, N.; Öst, M.; Zetterberg, H.; et al. Serum neurofilament light protein predicts clinical outcome in traumatic brain injury. Sci. Rep. 2016, 6, 36791. [Google Scholar] [CrossRef] [PubMed]
- Shahim, P.; Politis, A.; van der Merwe, A.; Moore, B.; Ekanayake, V.; Lippa, S.M.; Chou, Y.Y.; Pham, D.L.; Butman, J.A.; Diaz-Arrastia, R.; et al. Time course and diagnostic utility of NfL, tau, GFAp, and UCH-L1 in subacute and chronic TBI. Neurology 2020, 95, e623–e636. [Google Scholar] [CrossRef] [PubMed]
- Ashton, N.J.; Janelidze, S.; Al Khleifat, A.; Leuzy, A.; van der Ende, E.L.; Karikari, T.K.; Benedet, A.L.; Pascoal, T.A.; Lleó, A.; Parnetti, L.; et al. A multicentre validation study of the diagnostic value of plasma neurofilament light. Nat. Commun. 2021, 12, 3400. [Google Scholar] [CrossRef] [PubMed]
- Benatar, M.; Zhang, L.; Wang, L.; Granit, V.; Statland, J.; Barohn, R.; Swenson, A.; Ravits, J.; Jackson, C.; Burns, T.M.; et al. Validation of serum neurofilaments as prognostic and potential pharmacodynamic biomarkers for ALS. Neurology 2020, 95, e59–e69. [Google Scholar] [CrossRef] [PubMed]
- Page, M.J.; McKenzie, J.E.; Bossuyt, P.M.; Boutron, I.; Hoffmann, T.C.; Mulrow, C.D.; Shamseer, L.; Tetzlaff, J.M.; Akl, E.A.; Brennan, S.E.; et al. The PRISMA 2020 statement: An updated guideline for reporting systematic reviews. Rev. Esp. Cardiol. 2021, 74, 790–799. [Google Scholar] [CrossRef] [PubMed]
- McInnes, M.D.F.; Moher, D.; Thombs, B.D.; McGrath, T.A.; Bossuyt, P.M.; PRISMA-DTA Group; Clifford, T.; Cohen, J.F.; Deeks, J.J.; Gatsonis, C. Preferred Reporting Items for a Systematic Review and Meta-analysis of Diagnostic Test Accuracy Studies: The PRISMA-DTA Statement. JAMA 2018, 319, 388–396. [Google Scholar] [CrossRef] [PubMed]
- Moseby-Knappe, M.; Mattsson, N.; Nielsen, N.; Zetterberg, H.; Blennow, K.; Dankiewicz, J.; Dragancea, I.; Friberg, H.; Lilja, G.; Insel, P.S.; et al. Serum Neurofilament Light Chain for Prognosis of Outcome After Cardiac Arrest. JAMA Neurol. 2019, 76, 64–71. [Google Scholar] [CrossRef] [PubMed]
- Traynor, B.J.; Codd, M.B.; Corr, B.; Forde, C.; Frost, E.; Hardiman, O. Amyotrophic lateral sclerosis mimic syndromes: A population-based study. Arch. Neurol. 2000, 57, 109–113. [Google Scholar] [CrossRef] [PubMed]
- Cedarbaum, J.M.; Stambler, N.; Malta, E.; Fuller, C.; Hilt, D.; Thurmond, B.; Nakanishi, A. The ALSFRS-R: A revised ALS functional rating scale that incorporates assessments of respiratory function. BDNF ALS Study Group (Phase III). J. Neurol. Sci. 1999, 169, 13–21. [Google Scholar] [CrossRef]
- Kimura, F.; Fujimura, C.; Ishida, S.; Nakajima, H.; Furutama, D.; Uehara, H.; Shinoda, K.; Sugino, M.; Hanafusa, T. Progression rate of ALSFRS-R at time of diagnosis predicts survival time in ALS. Neurology 2006, 66, 265–267. [Google Scholar] [CrossRef]
- Whiting, P.F.; Rutjes, A.W.; Westwood, M.E.; Mallett, S.; Deeks, J.J.; Reitsma, J.B.; Leeflang, M.M.; Sterne, J.A.; Bossuyt, P.M.; QUADAS-2 Group. QUADAS-2: A revised tool for the quality assessment of diagnostic accuracy studies. Ann. Intern. Med. 2011, 155, 529–536. [Google Scholar] [CrossRef] [PubMed]
- Steinacker, P.; Huss, A.; Mayer, B.; Grehl, T.; Grosskreutz, J.; Borck, G.; Kuhle, J.; Lulé, D.; Meyer, T.; Oeckl, P.; et al. Diagnostic and prognostic significance of neurofilament light chain NF-L, but not progranulin and S100B, in the course of amyotrophic lateral sclerosis: Data from the German MND-net. Amyotroph. Lateral Scler. Frontotemporal. Degener. 2017, 18, 112–119. [Google Scholar] [CrossRef] [PubMed]
- Verde, F.; Steinacker, P.; Weishaupt, J.H.; Kassubek, J.; Oeckl, P.; Halbgebauer, S.; Tumani, H.; von Arnim, C.A.F.; Dorst, J.; Feneberg, E.; et al. Neurofilament light chain in serum for the diagnosis of amyotrophic lateral sclerosis. J. Neurol. Neurosurg. Psychiatry 2019, 90, 157–164. [Google Scholar] [CrossRef]
- Hua, X.; Lee, S.; Yanovsky, I.; Leow, A.D.; Chou, Y.Y.; Ho, A.J.; Gutman, B.; Toga, A.W.; Jack, C.R., Jr.; Bernstein, M.A.; et al. Optimizing power to track brain degeneration in Alzheimer’s disease and mild cognitive impairment with tensor-based morphometry: An ADNI study of 515 subjects. Neuroimage 2009, 48, 668–681. [Google Scholar] [CrossRef]
- Saracino, D.; Dorgham, K.; Camuzat, A.; Rinaldi, D.; Rametti-Lacroux, A.; Houot, M.; Clot, F.; Martin-Hardy, P.; Jornea, L.; Azuar, C.; et al. Plasma NfL levels and longitudinal change rates in C9orf72 and GRN-associated diseases: From tailored references to clinical applications. J. Neurol. Neurosurg. Psychiatry 2021, 92, 1278–1288. [Google Scholar] [CrossRef] [PubMed]
- Illán-Gala, I.; Alcolea, D.; Montal, V.; Dols-Icardo, O.; Muñoz, L.; de Luna, N.; Turón-Sans, J.; Cortés-Vicente, E.; Sánchez-Saudinós, M.B.; Subirana, A.; et al. CSF sAPPbeta, YKL-40, and NfL along the ALS-FTD spectrum. Neurology 2018, 91, e1619–e1628. [Google Scholar] [CrossRef]
- Escal, J.; Fourier, A.; Formaglio, M.; Zimmer, L.; Bernard, E.; Mollion, H.; Bost, M.; Herrmann, M.; Ollagnon-Roman, E.; Quadrio, I.; et al. Comparative diagnosis interest of NfL and pNfH in CSF and plasma in a context of FTD-ALS spectrum. J. Neurol. 2022, 269, 1522–1529. [Google Scholar] [CrossRef]
- Gendron, T.F.; C9ORF72 Neurofilament Study Group; Daughrity, L.M.; Heckman, M.G.; Diehl, N.N.; Wuu, J.; Miller, T.M.; Pastor, P.; Trojanowski, J.Q.; Grossman, M.; et al. Phosphorylated neurofilament heavy chain: A biomarker of survival for C9ORF72-associated amyotrophic lateral sclerosis. Ann. Neurol. 2017, 82, 139–146. [Google Scholar] [CrossRef] [PubMed]
- Shahim, P.; Zetterberg, H. Neurochemical Markers of Traumatic Brain Injury: Relevance to Acute Diagnostics, Disease Monitoring, and Neuropsychiatric Outcome Prediction. Biol. Psychiatry 2022, 91, 405–412. [Google Scholar] [CrossRef]
- Bridel, C.; van Wieringen, W.N.; Zetterberg, H.; Tijms, B.M.; Teunissen, C.E.; NFL Group; Alvarez-Cermeño, J.C.; Andreasson, U.; Axelsson, M.; Bäckström, D.C.; et al. Diagnostic Value of Cerebrospinal Fluid Neurofilament Light Protein in Neurology: A Systematic Review and Meta-analysis. JAMA Neurol. 2019, 76, 1035–1048. [Google Scholar] [CrossRef]
- Marszalek, J.R.; Williamson, T.L.; Lee, M.K.; Xu, Z.; Hoffman, P.N.; Becher, M.W.; Crawford, T.O.; Cleveland, D.W. Neurofilament subunit NF-H modulates axonal diameter by selectively slowing neurofilament transport. J. Cell Biol. 1996, 135, 711–724. [Google Scholar] [CrossRef] [PubMed]
- Ganesalingam, J.; An, J.; Shaw, C.E.; Shaw, G.; Lacomis, D.; Bowser, R. Combination of neurofilament heavy chain and complement C3 as CSF biomarkers for ALS. J. Neurochem. 2011, 117, 528–537. [Google Scholar] [CrossRef] [PubMed]
- Ganesalingam, J.; An, J.; Bowser, R.; Andersen, P.M.; Shaw, C.E. pNfH is a promising biomarker for ALS. Amyotroph. Lateral Scler. Frontotemporal Degener. 2013, 14, 146–149. [Google Scholar] [CrossRef] [PubMed]
- Reijn, T.S.; Abdo, W.F.; Schelhaas, H.J.; Verbeek, M.M. CSF neurofilament protein analysis in the differential diagnosis of ALS. J. Neurol. 2009, 256, 615–619. [Google Scholar] [CrossRef]
- Rossi, D.; Volanti, P.; Brambilla, L.; Colletti, T.; Spataro, R.; La Bella, V. CSF neurofilament proteins as diagnostic and prognostic biomarkers for amyotrophic lateral sclerosis. J. Neurol. 2018, 265, 510–521. [Google Scholar] [CrossRef] [PubMed]
- Brettschneider, J.; Petzold, A.; Sussmuth, S.D.; Ludolph, A.C.; Tumani, H. Axonal damage markers in cerebrospinal fluid are increased in ALS. Neurology 2006, 66, 852–856. [Google Scholar] [CrossRef] [PubMed]
- Benatar, M.; Wuu, J.; Lombardi, V.; Jeromin, A.; Bowser, R.; Andersen, P.M.; Malaspina, A. Neurofilaments in pre-symptomatic ALS and the impact of genotype. Amyotroph. Lateral Scler. Frontotemporal Degener. 2019, 20, 538–548. [Google Scholar] [CrossRef] [PubMed]
- De Schaepdryver, M.; Goossens, J.; De Meyer, S.; Jeromin, A.; Masrori, P.; Brix, B.; Claeys, K.G.; Schaeverbeke, J.; Adamczuk, K.; Vandenberghe, R.; et al. Serum neurofilament heavy chains as early marker of motor neuron degeneration. Ann. Clin. Transl. Neurol. 2019, 6, 1971–1979. [Google Scholar] [CrossRef] [PubMed]
- Lu, C.H.; Petzold, A.; Topping, J.; Allen, K.; Macdonald-Wallis, C.; Clarke, J.; Pearce, N.; Kuhle, J.; Giovannoni, G.; Fratta, P.; et al. Plasma neurofilament heavy chain levels and disease progression in amyotrophic lateral sclerosis: Insights from a longitudinal study. J. Neurol. Neurosurg. Psychiatry 2015, 86, 565–573. [Google Scholar] [CrossRef]
- Lu, C.H.; Kalmar, B.; Malaspina, A.; Greensmith, L.; Petzold, A. A method to solubilise protein aggregates for immunoassay quantification which overcomes the neurofilament “hook” effect. J. Neurosci. Methods 2011, 195, 143–150. [Google Scholar] [CrossRef]
- Altmann, P.; Ponleitner, M.; Rommer, P.S.; Haslacher, H.; Mucher, P.; Leutmezer, F.; Petzold, A.; Wotawa, C.; Lanzenberger, R.; Berger, T.; et al. Seven day pre-analytical stability of serum and plasma neurofilament light chain. Sci. Rep. 2021, 11, 11034. [Google Scholar] [CrossRef] [PubMed]
- Shahim, P.; Politis, A.; van der Merwe, A.; Moore, B.; Chou, Y.Y.; Pham, D.L.; Butman, J.A.; Diaz-Arrastia, R.; Gill, J.M.; Brody, D.L.; et al. Neurofilament light as a biomarker in traumatic brain injury. Neurology 2020, 95, e610–e622. [Google Scholar] [CrossRef] [PubMed]
- Adiutori, R.; Aarum, J.; Zubiri, I.; Bremang, M.; Jung, S.; Sheer, D.; Pike, I.; Malaspina, A. The proteome of neurofilament-containing protein aggregates in blood. Biochem. Biophys. Rep. 2018, 14, 168–177. [Google Scholar] [CrossRef] [PubMed]
- Zucchi, E.; Lu, C.H.; Cho, Y.; Chang, R.; Adiutori, R.; Zubiri, I.; Ceroni, M.; Cereda, C.; Pansarasa, O.; Greensmith, L.; et al. A motor neuron strategy to save time and energy in neurodegeneration: Adaptive protein stoichiometry. J. Neurochem. 2018, 146, 631–641. [Google Scholar] [CrossRef] [PubMed]
- Li, S.; Ren, Y.; Zhu, W.; Yang, F.; Zhang, X.; Huang, X. Phosphorylated neurofilament heavy chain levels in paired plasma and CSF of amyotrophic lateral sclerosis. J. Neurol. Sci. 2016, 367, 269–274. [Google Scholar] [CrossRef]
- Gaiottino, J.; Norgren, N.; Dobson, R.; Topping, J.; Nissim, A.; Malaspina, A.; Bestwick, J.P.; Monsch, A.U.; Regeniter, A.; Lindberg, R.L.; et al. Increased neurofilament light chain blood levels in neurodegenerative neurological diseases. PLoS ONE 2013, 8, e75091. [Google Scholar] [CrossRef]
- Benatar, M.; Wuu, J.; Andersen, P.M.; Bucelli, R.C.; Andrews, J.A.; Otto, M.; Farahany, N.A.; Harrington, E.A.; Chen, W.; Mitchell, A.A.; et al. Correction to: Design of a Randomized, Placebo-Controlled, Phase 3 Trial of Tofersen Initiated in Clinically Presymptomatic SOD1 Variant Carriers: The ATLAS Study. Neurotherapeutics 2022, 19, 1686. [Google Scholar] [CrossRef]


| Variable | All Cohorts | ALS | Disease Mimics b | Controls |
|---|---|---|---|---|
| Included studies, no. | 60 | 60 | 16 | 44 |
| Study participants | ||||
| Total no. | 8801 | 6064 | 539 | 2198 |
| Men | 4529 | 3306 | 286 | 950 |
| Women | 3148 | 2106 | 142 | 906 |
| Missing, sex | 330 | 190 | 26 | 56 |
| Age of onset, median (IQR) | – | 61.1 (55.4–68.5) | – | – |
| Age at sampling, median (IQR) | 59.6 (47.6–69.3) | 62.0 (48.5–70.2) | 62.6 (54.2–74.1) | 55.3 (44.5–66.8) |
| Disease duration from onset to sampling, median (IQR), months | – | 16.8 (11.5–31.3) | – | – |
| ALSFRS-R, mean (SD) | – | 37.4 (6.2) | – | – |
| ALSFRS-R, median (IQR) | – | 38.5 (32.1–42.3) | – | – |
Disclaimer/Publisher’s Note: The statements, opinions and data contained in all publications are solely those of the individual author(s) and contributor(s) and not of MDPI and/or the editor(s). MDPI and/or the editor(s) disclaim responsibility for any injury to people or property resulting from any ideas, methods, instructions or products referred to in the content. |
© 2024 by the authors. Licensee MDPI, Basel, Switzerland. This article is an open access article distributed under the terms and conditions of the Creative Commons Attribution (CC BY) license (https://creativecommons.org/licenses/by/4.0/).
Share and Cite
Shahim, P.; Norato, G.; Sinaii, N.; Zetterberg, H.; Blennow, K.; Chan, L.; Grunseich, C. Neurofilaments in Sporadic and Familial Amyotrophic Lateral Sclerosis: A Systematic Review and Meta-Analysis. Genes 2024, 15, 496. https://doi.org/10.3390/genes15040496
Shahim P, Norato G, Sinaii N, Zetterberg H, Blennow K, Chan L, Grunseich C. Neurofilaments in Sporadic and Familial Amyotrophic Lateral Sclerosis: A Systematic Review and Meta-Analysis. Genes. 2024; 15(4):496. https://doi.org/10.3390/genes15040496
Chicago/Turabian StyleShahim, Pashtun, Gina Norato, Ninet Sinaii, Henrik Zetterberg, Kaj Blennow, Leighton Chan, and Christopher Grunseich. 2024. "Neurofilaments in Sporadic and Familial Amyotrophic Lateral Sclerosis: A Systematic Review and Meta-Analysis" Genes 15, no. 4: 496. https://doi.org/10.3390/genes15040496