
Dissecting Selective Signatures and Candidate Genes in Grandparent Lines Subject to High Selection Pressure for Broiler Production and in a Local Russian Chicken Breed of Ushanka

 , , , , , , , ,
  , and
, and 
Abstract
:1. Introduction
2. Materials and Methods
2.1. Experimental Animals, Sample Collection, and DNA Extraction
2.2. Sequencing, SNP Genotyping and Quality Control
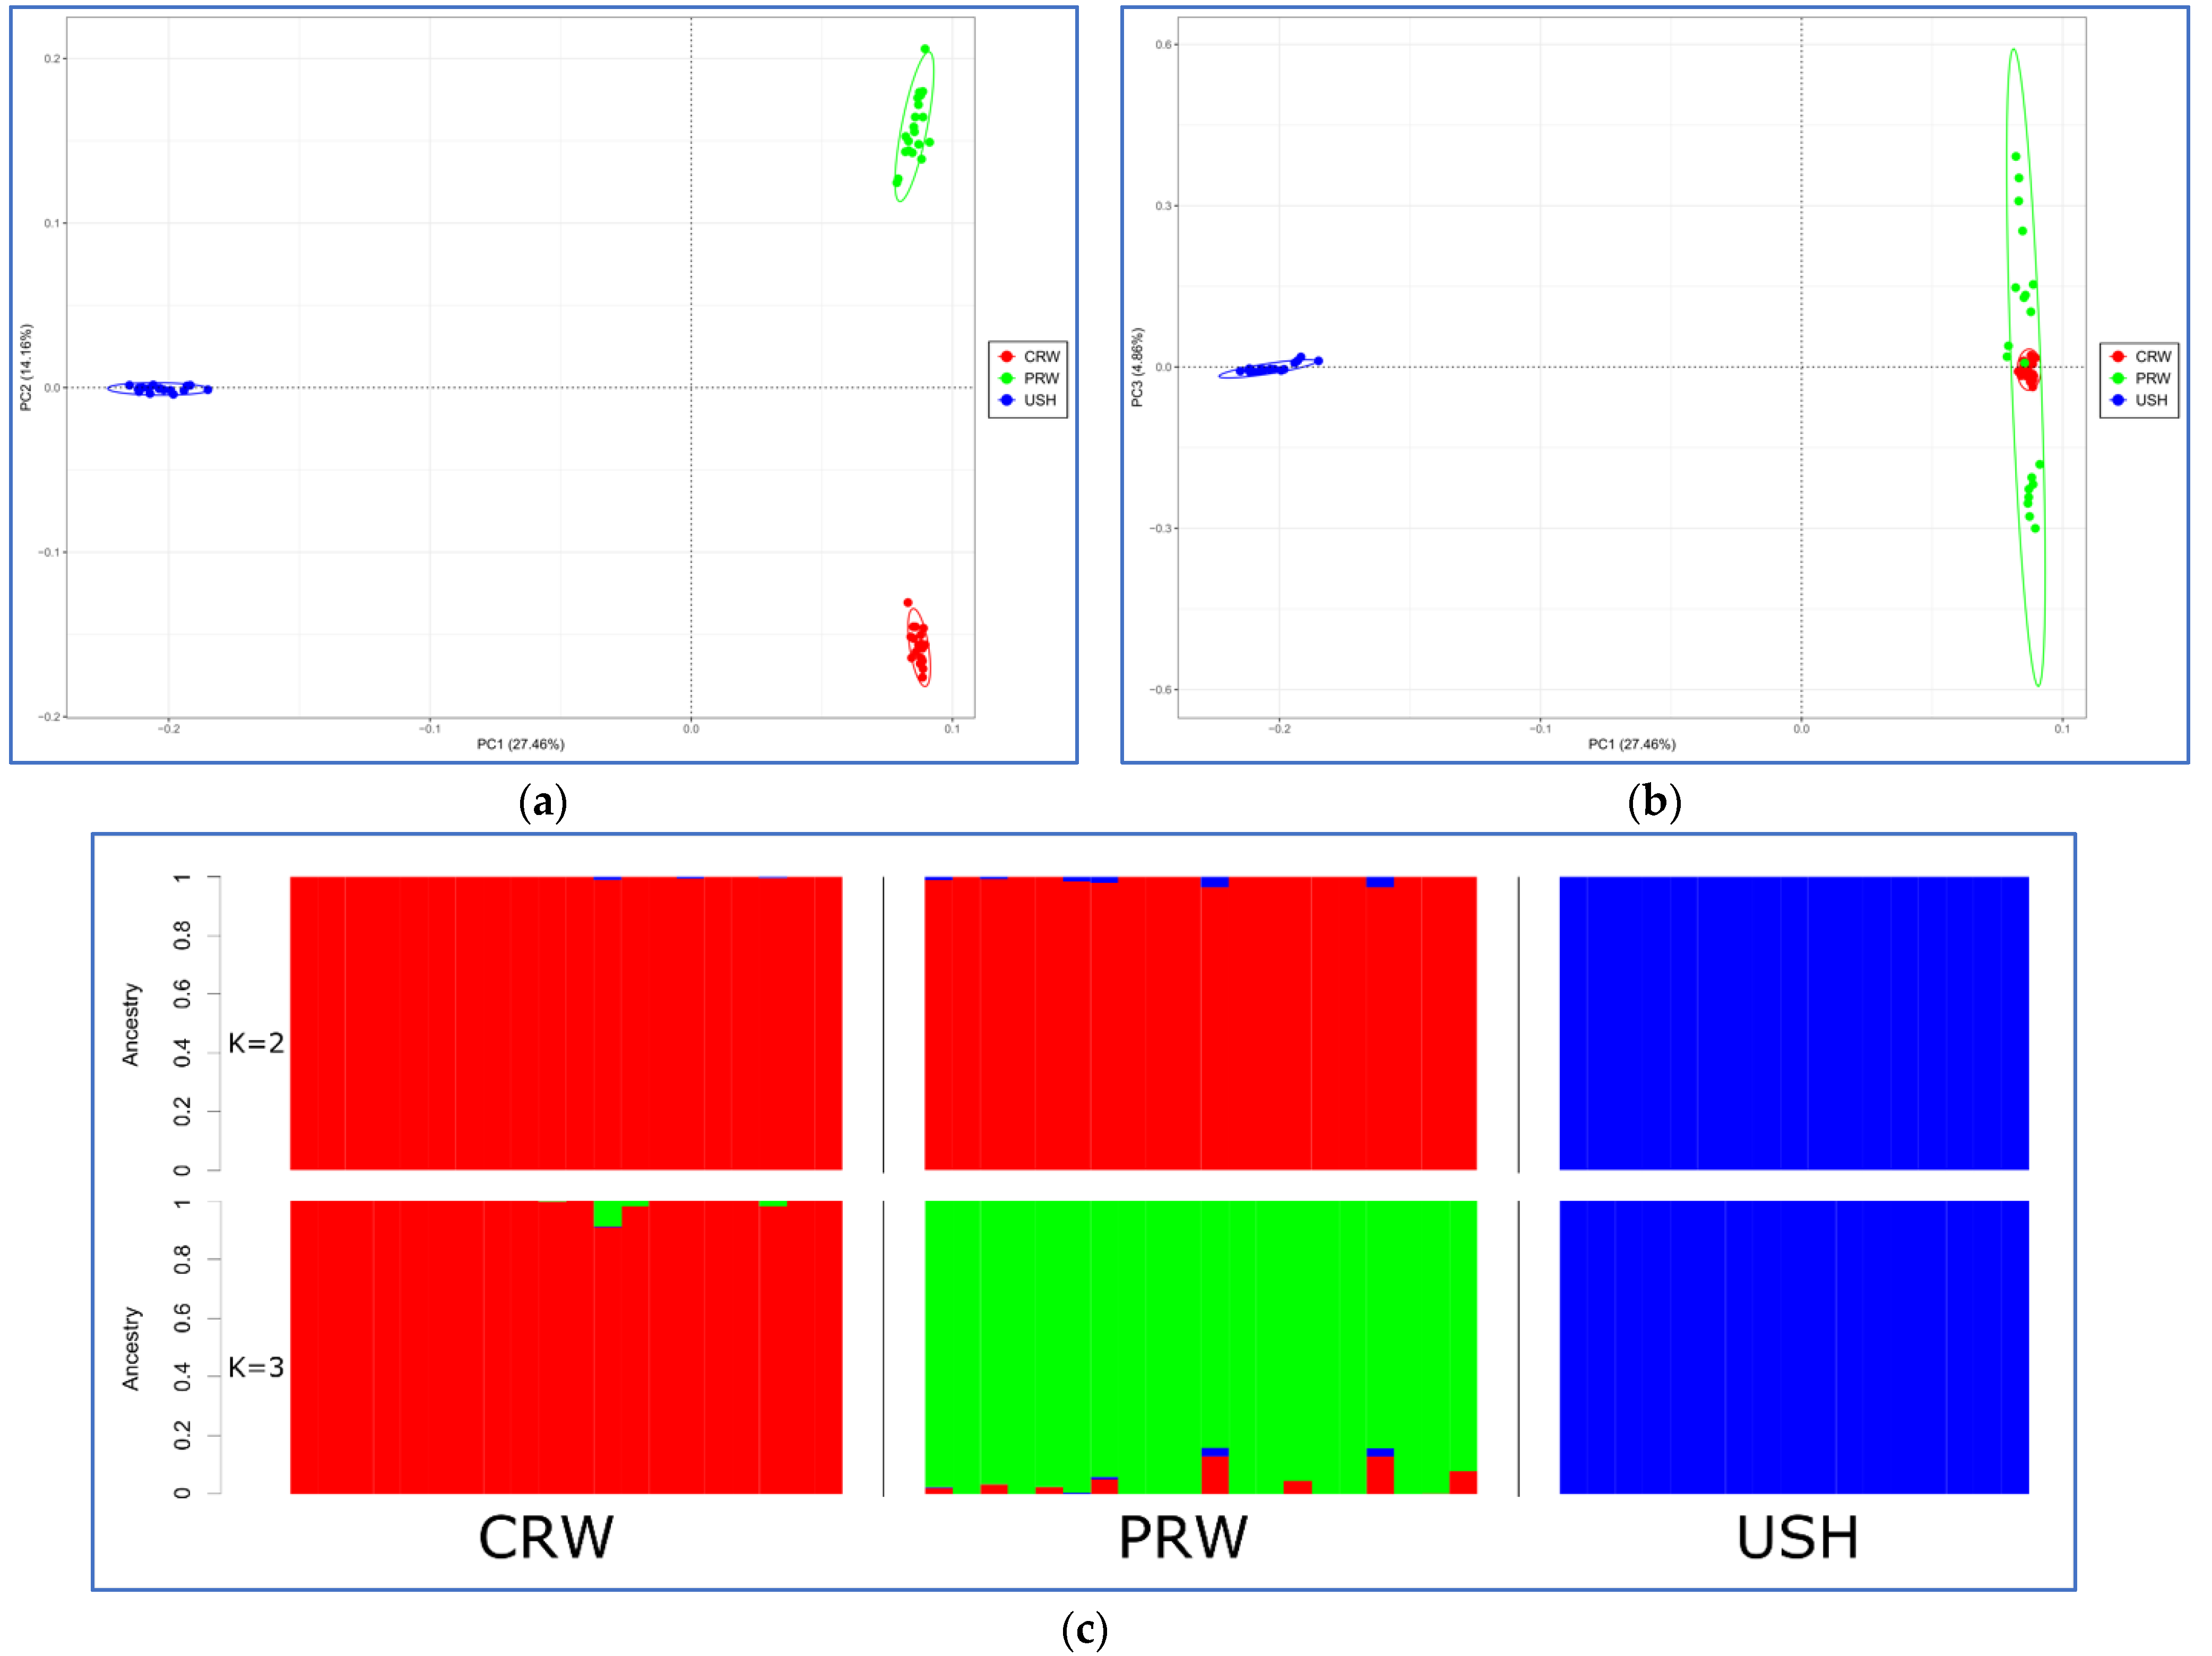
2.3. Genetic Diversity and Population Structure
2.4. Genetic Diversity and Population Structure
2.4.1. ZFST Estimation
2.4.2. HapFLK Procedure
2.4.3. ROH and Inbreeding Estimation
2.5. Detection of Candidate Genes and QTLs in Selective Sweep Regions
3. Results
3.1. Between- and Within-Breed Genetic Diversity
3.2. Signatures of Selection
3.2.1. ZFST Statistic at Pairwise Comparison of Breeds
3.2.2. HapFLK Statistic
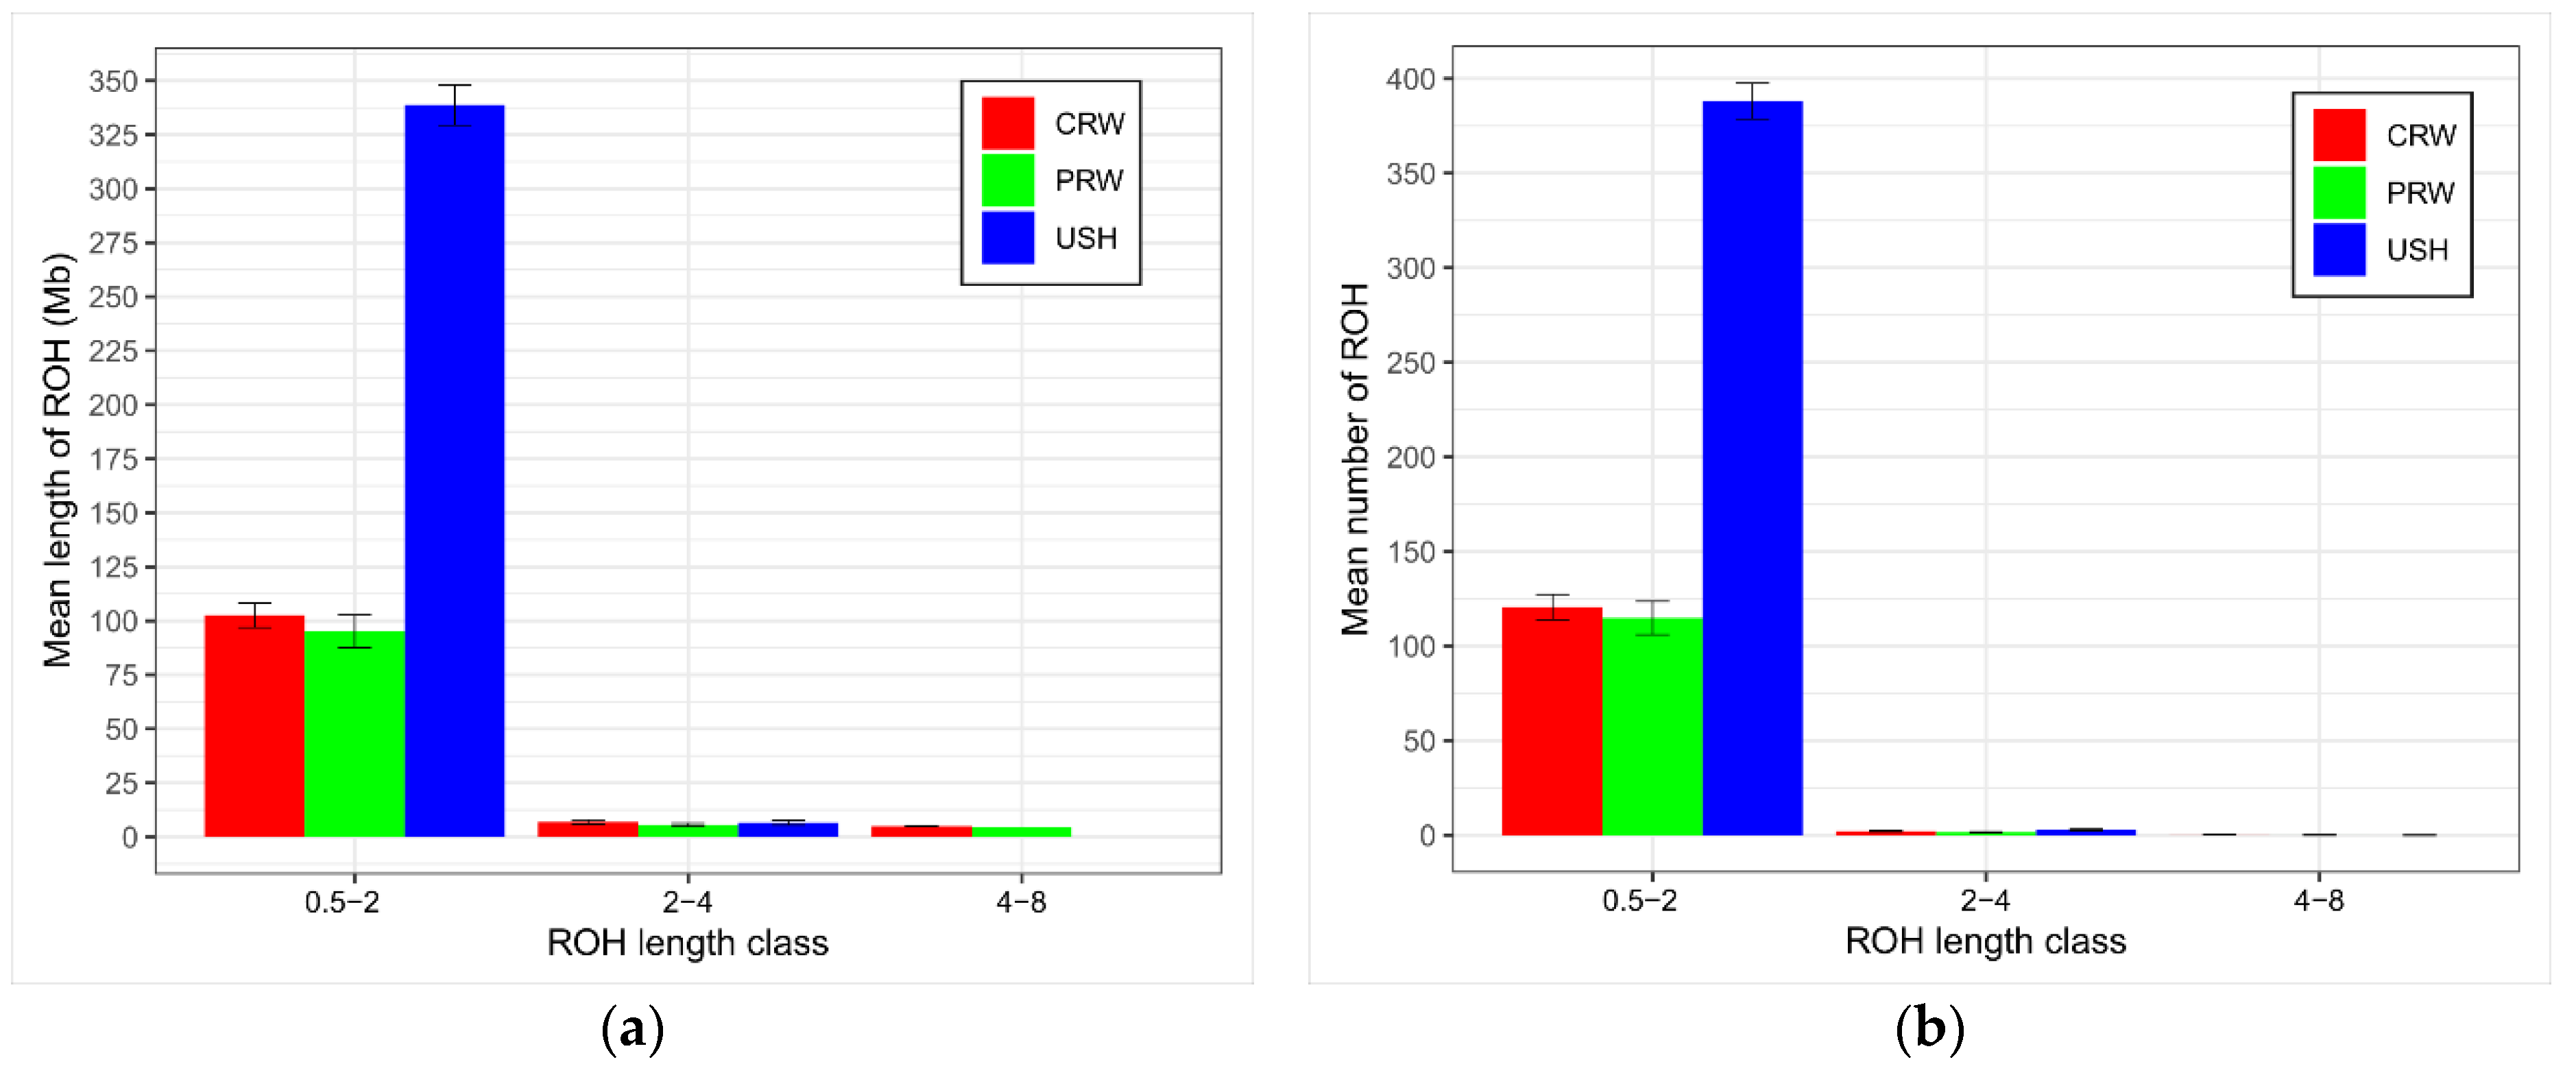
3.2.3. ROH Islands Detection
3.3. Candidate Genes Affected by Selection and QTLs
4. Discussion
4.1. Genetic Diversity among the Breeds Studied
4.2. Inbreeding and ROH Characterization
4.3. Prioritized Candidate Genes within Selective Sweeps
4.3.1. GGA1
4.3.2. GGA2
4.3.3. GGA4
4.3.4. GGA7
4.3.5. GGA10
4.3.6. GGA14
4.3.7. GGA28
5. Conclusions
Supplementary Materials
Author Contributions
Funding
Institutional Review Board Statement
Informed Consent Statement
Data Availability Statement
Acknowledgments
Conflicts of Interest
References
- Arthur, J.A.; Albers, G.A. Industrial perspective on problems and issues associated with poultry breeding. In Poultry Genetics, Breeding and Biotechnology; Muir, W.M., Aggrey, S.E., Eds.; CAB International: Wallingford, UK; Cambridge, UK, 2003; pp. 1–12. [Google Scholar] [CrossRef]
- Santhi, D.; Kalaikannan, A. Enrichment of chicken meat with dietary fibre sources as functional ingredients. Worlds Poult. Sci. J. 2023, 79, 783–806. [Google Scholar] [CrossRef]
- Patreva, L.S.; Kovalenko, V.P.; Tereshchenko, O.V.; Katerynych, O.O. Miasne Ptakhivnytstvo [Poultry Meat Production]; Mykolaivskyi DAU: Mykolaiv, Ukraine, 2010; ISBN 978-966-8205-60-6. (In Ukrainian) [Google Scholar]
- Tereshchenko, A.V.; Artemenko, A.B.; Pudov, V.Y. A hidden source of increasing the production of broiler chickens. Eksklyuziv Agro [Exclus. Agro] 2007, 4, 64–65. (In Russian) [Google Scholar]
- Iqbal, M.A.; Hadlich, F.; Reyer, H.; Oster, M.; Trakooljul, N.; Murani, E.; Perdomo-Sabogal, A.; Wimmers, K.; Ponsuksili, S. RNA-Seq-based discovery of genetic variants and allele-specific expression of two layer lines and broiler chicken. Evol. Appl. 2023, 16, 1135–1153. [Google Scholar] [CrossRef] [PubMed]
- Neeteson, A.M.; Avendaño, S.; Koerhuis, A.; Duggan, B.; Souza, E.; Mason, J.; Ralph, J.; Rohlf, P.; Burnside, T.; Kranis, A.; et al. Evolutions in commercial meat poultry breeding. Animals 2023, 13, 3150. [Google Scholar] [CrossRef] [PubMed]
- Katerinich, O.O.; Tkachik, T.E.; Bondarenko, Y.V. Methodical approaches to the genetic-informational profile of the immunogenetic structure of meat and egg chickens. Sučasne Ptahìvnictvo [Mod. Poult. Farm.] 2014, 3, 12–13, (In Ukrainian with English summary). [Google Scholar]
- Hill, W.G.; Caballero, A. Artificial selection experiments. Annu. Rev. Ecol. Syst. 1992, 23, 287–310. [Google Scholar] [CrossRef]
- Bondarenko, Y.V.; Ivanova, T.V.; Kutnyuk, P.I. Efficiency of Improving of Hens Reproductive Traits by Elimination Method of Lethal Genes. In The Poultry Industry towards the 21st Century, Proceedings and Abstracts of the 10th European Poultry Conference, Jerusalem, Israel, 21–26 June 1998; World’s Poultry Science Association: Jerusalem, Israel, 1998; p. 65. [Google Scholar]
- Seo, D.; Lee, D.H.; Jin, S.; Won, J.I.; Lim, D.; Park, M.; Kim, T.H.; Lee, H.K.; Kim, S.; Choi, I.; et al. Long-term artificial selection of Hanwoo (Korean) cattle left genetic signatures for the breeding traits and has altered the genomic structure. Sci. Rep. 2022, 12, 6438. [Google Scholar] [CrossRef]
- Pettersson, M.E.; Johansson, A.M.; Siegel, P.B.; Carlborg, Ö. Dynamics of adaptive alleles in divergently selected body weight lines of chickens. G3 Genes Genomes Genet. 2013, 3, 2305–2312. [Google Scholar] [CrossRef]
- Altukhov, Y.P.; Zakharov, I.A.; Stolpovskiy, Y.A.; Salmenkova, E.A.; Evsyukov, A.N.; Moiseyeva, I.G. Dynamics of animal population gene pools. In Dinamika Populyatsionnykh Genofondov pri Antropogennykh Vozdeistviyakh [Dynamics of Population Gene Pools under Anthropogenic Pressures]; Altukhov, Y.P., Ed.; Nauka: Moscow, Russia, 2004; Chapter 3; pp. 110–294. Available online: https://search.rsl.ru/en/record/01002561306 (accessed on 26 March 2024). (In Russian)
- Tkachik, T.E.; Kutnyuk, P.I.; Bondarenko, Y.V. Genetic load in land poultry populations. Ptakhivnytstvo [Poultry Farm.] 2005, 57, 94–98, (In Russian with English summary). [Google Scholar]
- Khvostik, V.P.; Bondarenko, Y.V. The level of genetic load in meat and egg chickens of different origin. Vìsn. Sumsʹkogo Nac. Agrar. Univ. Ser. Tvarynnytstvo [Bull. Sumy Natl. Agrar. Univ. Ser. Livest.] 2011, 7, 38–39. (In Ukrainian) [Google Scholar]
- Khvostik, V.P.; Bondarenko, Y.V. Hereditary loads in the chicken population domestic gene pool. Vìsn. Sumsʹkogo Nac. Agrar. Univ. Ser. Tvarynnytstvo [Bull. Sumy Natl. Agrar. Univ. Ser. Livest.] 2016, 7, 112–114, (In Ukrainian with English summary). [Google Scholar]
- Siegel, P.B.; Honaker, C.F.; Andersson, L. Research Note: Phenotypic trends for the multigenerational advanced intercross of the Virginia body weight lines of chickens. Poult. Sci. 2024, 103, 103480. [Google Scholar] [CrossRef] [PubMed]
- Le Rouzic, A.; Siegel, P.B.; Carlborg, Ö. Phenotypic evolution from genetic polymorphisms in a radial network architecture. BMC Biol. 2007, 5, 50. [Google Scholar] [CrossRef] [PubMed]
- Sheng, Z.; Pettersson, M.E.; Honaker, C.F.; Siegel, P.B.; Carlborg, Ö. Standing genetic variation as a major contributor to adaptation in the Virginia chicken lines selection experiment. Genome Biol. 2015, 16, 219. [Google Scholar] [CrossRef] [PubMed]
- Lillie, M.; Honaker, C.F.; Siegel, P.B.; Carlborg, Ö. Bidirectional selection for body weight on standing genetic variation in a chicken model. G3 Genes Genomes Genet. 2019, 9, 1165–1173. [Google Scholar] [CrossRef] [PubMed]
- Rönneburg, T.; Zan, Y.; Honaker, C.F.; Siegel, P.B.; Carlborg, Ö. Low-coverage sequencing in a deep intercross of the Virginia body weight lines provides insight to the polygenic genetic architecture of growth: Novel loci revealed by increased power and improved genome-coverage. Poult. Sci. 2023, 102, 102203. [Google Scholar] [CrossRef] [PubMed]
- Moiseyeva, I.G.; Bannikova, L.V.; Altukhov, Y.P. State of poultry breeding in Russia: Genetic monitoring. Mezhdunarodnyi Sel’skokhozyaystvennyi Zhurnal [Int. Agron. J.] 1993, 5–6, 66–69. (In Russian) [Google Scholar]
- Bondarenko, Y.V.; Kutnyuk, P.I. Some Results of Genetic Monitoring of Embryonic Defects in Poultry Populations. In Proceedings of the Gene Pool of Animal Breeds and Methods of Its Use, Materials of the International Scientific and Practical Conference Dedicated to the 110th Anniversary of the Birth of Academician N.D. Potemkin, Kharkov, Ukraine, 5–6 December 1995; Ministry of Agriculture and Food of Ukraine, Kharkov Zooveterinary Institute, RIO KhZVI: Kharkov, Ukraine, 1995; pp. 63–64. (In Russian). [Google Scholar]
- Bondarenko, Y.V.; Podstreshny, A.P. Genetic Monitoring of Chicken Populations. In Proceedings of the Abstracts of the 2nd International Conference on Molecular Genetic Markers of Animals, Kiev, Ukraine, 15–17 May 1996; Agrarna Nauka: Kiev, Ukraine, 1996; pp. 47–48. (In Russian). [Google Scholar]
- Ryabokon, Y.O.; Mykytyuk, D.M.; Frolov, V.V.; Katerynych, O.O.; Bondarenko, Y.V.; Mosyakina, T.V.; Gadyuchko, O.T.; Kovalenko, G.T.; Bogatyr, V.P.; Lyuty, Y.S. Catalog of Poultry Breeding Resources of Ukraine; Ryabokon, Y.O., Ed.; Poultry Research Institute: Kharkiv, Ukraine, 2005. (In Ukrainian) [Google Scholar]
- Zakharov-Gesekhus, I.A.; Stolpovsky, Y.A.; Ukhanov, S.V.; Moiseyeva, I.G.; Sulimova, G.E. Monitoring the gene pools of animal populations in connection with selection tasks and the study of phylogeny. In Farm Animals; Russian Academy of Sciences: Moscow, Russia, 2007; pp. 122–124. (In Russian) [Google Scholar]
- Khvostyk, V.P.; Bondarenko, Y.V. Information and statistical parameters of live weight the chickens of domestic a gene pool. Vìsn. Sumsʹkogo Nac. Agrar. Univ. Ser. Tvarynnytstvo [Bull. Sumy Natl. Agrar. Univ. Ser. Livest.] 2017, 5/1, 161–165, (In Ukrainian with English summary). [Google Scholar]
- Prituzhalova, A.O.; Volkova, N.A.; Kuzmina, T.I.; Vetokh, A.N.; Dzhagaev, A.Y. Monitoring of indicators of chromatin status in quails ovarian follicles granulosa cells of different directions of productivity. Agrar. Nauka [Agric. Sci.] 2023, 368, 53–57, (In Russian with English summary). [Google Scholar] [CrossRef]
- van Arendonk, J.A.M.; Bovenhuis, H. Designs and methods to detect QTL for production traits based on mapped genetic markers. In Poultry Genetics, Breeding and Biotechnology; Muir, W.M., Aggrey, S.E., Eds.; CAB International: Wallingford, UK; Cambridge, UK, 2003; pp. 439–464. [Google Scholar] [CrossRef]
- Bondarenko, Y.V. Genetic principles for the creation and use of autosexing crosses of chickens. Naučno-Tehničeskij Bûlletenʹ—Ukrainskij Naučno-Issledovatelʹskij Institut Pticevodstva 1982, 12, 8–10. (In Russian) [Google Scholar]
- Khvostyk, V.; Tereshchenko, O.; Zakharchenko, O.; Bondarenko, Y. Influence of «adding blood» of cocks of foreign crosses upon economically beneficial attributes of meat-egg hens of domestic selection. Vìsnik Agrar. Nauki [Bull. Agric. Sci.] 2017, 95, 44–48. [Google Scholar] [CrossRef]
- FAD PreP. Poultry Industry Manual. Foreign Animal Disease Preparedness & Response Plan (FAD PreP). In Center for Food Security and Public Health; Iowa State University of Science and Technology: Ames, IA, USA, 2013; Available online: https://www.cfsph.iastate.edu/pdf/fad-prep-nahems-poultry-industry-manual (accessed on 26 March 2024).
- de Jong, I.C.; van Emous, R.A. Broiler breeding flocks: Management and animal welfare. In Achieving Sustainable Production of Poultry Meat, Volume 3: Health and Welfare; Applegate, T., Ed.; Burleigh Dodds Science Publishing: London, UK, 2017; pp. 1–19. [Google Scholar] [CrossRef]
- Bondarenko, Y.V.; Sergheyeva, V.D.; Kuranova, E.N.; Krasnozhon, S.A.; Romanov, M.N. Autosexing maternal form of meat-type chickens. Ptitsevodstvo [Poultry Farm.] 1987, 40, 6–11. (In Russian) [Google Scholar]
- Romanov, M.N.; Sazanov, A.A.; Moiseyeva, I.G.; Smirnov, A.F. Poultry. In Genome Mapping and Genomics in Animals, Volume 3: Genome Mapping and Genomics in Domestic Animals; Cockett, N.E., Kole, C., Eds.; Springer: Berlin/Heidelberg, Germany, 2009; pp. 75–141. [Google Scholar] [CrossRef]
- Bondarenko, Y.V.; Ostapenko, V.I.; Ali, O.H.; Bulchenko, I.A.; Shubin, P.I. Sexual dimorphism and sex determination of broilers of the Ross 308 cross. Ptakhivnytstvo [Poultry Farm.] 2013, 69, 51–54, (In Ukrainian with English summary). [Google Scholar]
- Khvostyk, V.P.; Bondarenko, Y.V. Genetic features of meat and egg chickens of the improved population. Vìsn. Sumsʹkogo Nac. Agrar. Univ. Ser. Tvarynnytstvo [Bull. Sumy Natl. Agrar. Univ. Ser. Livest.] 2013, 7, 200–203, (In Ukrainian with English summary). [Google Scholar]
- Katerynych, O.O.; Bondarenko, Y.V.; Pankova, S.M.; Ruda, S.V.; Khvostyk, V.P.; Zakharchenko, O.P. Production line G2 of meat and egg chickens of the breed of Plymutrok white. Ahrarna Nauka—Vyrobnytstvu [Agrar. Sci. Prod.] 2016, 4, 32, (In Ukrainian with English summary). [Google Scholar]
- Khvostik, V.P.; Bondarenko, Y.V. Growth intensity of the meat and egg chickens of different genetic origin. Vìsn. Sumsʹkogo Nac. Agrar. Univ. Ser. Tvarynnytstvo [Bull. Sumy Natl. Agrar. Univ. Ser. Livest.] 2021, 3, 91–94, (In Ukrainian with English summary). [Google Scholar]
- Romanov, M.N.; Miao, Y.W.; Wilson, P.W.; Morris, A.; Sharp, P.J.; Dunn, I.C. Detection and Assay of Polymorphism in Reproductive Gene Loci in a Commercial Broiler Breeder Population for Use in Association Studies. In Proceedings of the Conference “From Jay Lush to Genomics: Visions for Animal Breeding and Genetics”, Ames, IA, USA, 16–18 May 1999; Dekkers, J.C.M., Lamont, S.J., Rothschild, M.F., Eds.; Iowa State University, Department of Animal Science: Ames, IA, USA, 1999; p. 155. Available online: https://web.archive.org/web/20050314091227/http://www.agbiotechnet.com/proceedings/jaylush.asp#15 (accessed on 14 March 2005).
- Dunn, I.C.; Miao, Y.-W.; Morris, A.; Romanov, M.; Wilson, P.W.; Sharp, P.J. The Detection and Assay of Polymorphism in Candidate Reproductive Gene Loci in a Commercial Broiler Breeder Population for Association Studies. In Proceedings of the Poultry Genetics Symposium, Mariensee, Germany, 6–8 October 1999; Preisinger, R., Ed.; Working Group 3 of WPSA, Lohmann Tierzucht: Cuxhaven, Germany, 1999; p. 113. [Google Scholar]
- Dunn, I.C.; Miao, Y.-W.; Morris, A.; Romanov, M.N.; Wilson, P.W.; Waddington, D.; Sharp, P.J. Candidate genes and reproductive traits in a commercial broiler breeder population, an association study . J. Anim. Sci. 2001, 79 (Suppl. S1), 43. Available online: http://www.jtmtg.org/JAM/2001/jointabs/iaafsc18.pdf (accessed on 26 March 2024).
- Dunn, I.C.; Miao, Y.-W.; Morris, A.; Romanov, M.N.; Waddington, D.W.; Wilson, P.W.; Sharp, P.J. Association between candidate genes and reproductive traits in a commercial broiler breeder population. Br. Poult. Sci. 2001, 42 (Suppl. S1), S113–S114. [Google Scholar] [CrossRef]
- Zhang, H.; Hunt, H.D.; Cheng, H.H.; Dodgson, J.B.; Romanov, M.N.; Bacon, L.D. Identification and Evaluation of SNPs at the 3’ End of the Tva Gene Segregating Among ALSV Resistance and Susceptible Lines of Chickens. In Proceedings of the International Plant and Animal Genome XIII Conference, San Diego, CA, USA, 15–19 January 2005; Scherago International: San Diego, CA, USA, 2005; p. 123. Available online: https://www.ars.usda.gov/research/publications/publication/?seqNo115=170524 (accessed on 26 March 2024).
- Yang, X.; Sun, J.; Zhao, G.; Li, W.; Tan, X.; Zheng, M.; Feng, F.; Liu, D.; Wen, J.; Liu, R. Identification of major loci and candidate genes for meat production-related traits in broilers. Front. Genet. 2021, 12, 645107. [Google Scholar] [CrossRef] [PubMed]
- Fang, X.; Ye, H.; Zhang, S.; Guo, L.; Xu, Y.; Zhang, D.; Nie, Q. Investigation of potential genetic factors for growth traits in yellow-feather broilers using weighted single-step genome-wide association study. Poult. Sci. 2023, 102, 103034. [Google Scholar] [CrossRef]
- Kim, M.; Munyaneza, J.P.; Cho, E.; Jang, A.; Jo, C.; Nam, K.C.; Choo, H.J.; Lee, J.H. Genome-wide association study on the content of nucleotide-related compounds in Korean native chicken breast meat. Animals 2023, 13, 2966. [Google Scholar] [CrossRef]
- Plemyashov, K.V.; Smaragdov, M.G.; Romanov, M.N. Genomic Assessment of Breeding Bulls. In Proceedings of the Molecular Genetic Technologies for Analysis of Gene Expression Related to Animal Productivity and Disease Resistance, Materials of the 3rd International Scientific and Practical Conference, Moscow, Russia, 30 September 2021; Pozyabin, S.V., Kochish, I.I., Romanov, M.N., Eds.; Ministry of Agriculture of the Russian Federation; Federal State Budgetary Educational Institution of Higher Education “Moscow State Academy of Veterinary Medicine and Biotechnology—MVA Named after K.I. Scriabin”; Sel’skokhozyaistvennye Tekhnologii: Moscow, Russia, 2021; pp. 363–367, (In Russian with English summary). [Google Scholar] [CrossRef]
- Plemyashov, K.V.; Smaragdov, M.G.; Romanov, M.N. Molecular Genetic Polymorphism in Animal Populations and Its Application in Intensive Breeding of Dairy Cattle—A Review. In Proceedings of the Molecular Genetic Technologies for Analysis of Gene Expression Related to Animal Productivity and Disease Resistance, Materials of the 3rd International Scientific and Practical Conference, Moscow, Russia, 30 September 2021; Pozyabin, S.V., Kochish, I.I., Romanov, M.N., Eds.; Ministry of Agriculture of the Russian Federation; Federal State Budgetary Educational Institution of Higher Education “Moscow State Academy of Veterinary Medicine and Biotechnology—MVA Named after K.I. Scriabin”; Sel’skokhozyaistvennye Tekhnologii: Moscow, Russia, 2021; pp. 368–378, (In Russian with English summary). [Google Scholar] [CrossRef]
- Dou, D.; Shen, L.; Zhou, J.; Cao, Z.; Luan, P.; Li, Y.; Xiao, F.; Guo, H.; Li, H.; Zhang, H. Genome-wide association studies for growth traits in broilers. BMC Genom. Data 2022, 23, 1. [Google Scholar] [CrossRef] [PubMed]
- Dementeva, N.V.; Romanov, M.N.; Kudinov, A.A.; Mitrofanova, O.V.; Stanishevskaya, O.I.; Terletsky, V.P.; Fedorova, E.S.; Nikitkina, E.V.; Plemyashov, K.V. Studying the structure of a gene pool population of the Russian White chicken breed by genome-wide SNP scan. Sel’skokhozyaistvennaya Biol. [Agric. Biol.] 2017, 52, 1166–1174. [Google Scholar] [CrossRef]
- Dementeva, N.V.; Kudinov, A.A.; Mitrofanova, O.V.; Stanishevskaya, O.I.; Fedorova, E.S.; Romanov, M.N. Genome-wide association study of reproductive traits in a gene pool breed of the Russian White chickens. Reprod. Domest. Anim. 2018, 53 (Suppl. S2), 123–124. [Google Scholar] [CrossRef]
- Dementieva, N.V.; Mitrofanova, O.V.; Kudinov, A.A.; Smaragdov, M.G.; Yakovlev, A.F.; Romanov, M.N. Opportunities of SNP-genotyping for Studying the Features of the Genetic Architecture of Chicken Populations with Different Histories. In World and Russian Trends in Development of Poultry Industry: Realities and Challenges of Future, Proceedings of the 19th International Conference, Sergiyev Posad, Russia, 15–17 May 2018; Fisinin, V.I., Ed.; World’s Poultry Science Association, Russian Branch; All-Russian Research and Technological Poultry Institute: Sergiyev Posad, Russia, 2018; pp. 80–81. Available online: https://www.researchgate.net/publication/371280603_Opportunities_of_SNP-genotyping_for_studying_the_features_of_the_genetic_architecture_of_chicken_populations_with_different_histories_Vozmoznosti_SNP-genotipirovania_dla_izucenia_osobennostej_genetice (accessed on 26 March 2024). (In Russian).
- Dementieva, N.V.; Kudinov, A.A.; Larkina, T.A.; Mitrofanova, O.V.; Dysin, A.P.; Terletsky, V.P.; Tyshchenko, V.I.; Griffin, D.K.; Romanov, M.N. Genetic variability in local and imported germplasm chicken populations as revealed by analyzing runs of homozygosity. Animals 2020, 10, 1887. [Google Scholar] [CrossRef] [PubMed]
- Dementieva, N.V.; Mitrofanova, O.V.; Dysin, A.P.; Kudinov, A.A.; Stanishevskaya, O.I.; Larkina, T.A.; Plemyashov, K.V.; Griffin, D.K.; Romanov, M.N.; Smaragdov, M.G. Assessing the effects of rare alleles and linkage disequilibrium on estimates of genetic diversity in the chicken populations. Animal 2021, 15, 100171. [Google Scholar] [CrossRef] [PubMed]
- Dementieva, N.V.; Shcherbakov, Y.S.; Tyshchenko, V.I.; Terletsky, V.P.; Vakhrameev, A.B.; Nikolaeva, O.A.; Ryabova, A.E.; Azovtseva, A.I.; Mitrofanova, O.V.; Peglivanyan, G.K.; et al. Comparative analysis of molecular RFLP and SNP markers in assessing and understanding the genetic diversity of various chicken breeds. Genes 2022, 13, 1876. [Google Scholar] [CrossRef] [PubMed]
- Dementieva, N.V.; Shcherbakov, Y.S.; Stanishevskaya, O.I.; Vakhrameev, A.B.; Larkina, T.A.; Dysin, A.P.; Nikolaeva, O.A.; Ryabova, A.E.; Azovtseva, A.I.; Mitrofanova, O.V.; et al. Large-scale genome-wide SNP analysis reveals the rugged (and ragged) landscape of global ancestry, phylogeny and demographic history in chicken breeds. J. Zhejiang Univ. Sci. B 2024, 25, 324–340. [Google Scholar] [CrossRef] [PubMed]
- Kudinov, A.A.; Dementieva, N.V.; Mitrofanova, O.V.; Stanishevskaya, O.I.; Fedorova, E.S.; Larkina, T.A.; Mishina, A.I.; Plemyashov, K.V.; Griffin, D.K.; Romanov, M.N. Genome-wide association studies targeting the yield of extraembryonic fluid and production traits in Russian White chickens. BMC Genom. 2019, 20, 270. [Google Scholar] [CrossRef] [PubMed]
- Abdelmanova, A.S.; Dotsev, A.V.; Romanov, M.N.; Stanishevskaya, O.I.; Gladyr, E.A.; Rodionov, A.N.; Vetokh, A.N.; Volkova, N.A.; Fedorova, E.S.; Gusev, I.V.; et al. Unveiling comparative genomic trajectories of selection and key candidate genes in egg-type Russian White and meat-type White Cornish chickens. Biology 2021, 10, 876. [Google Scholar] [CrossRef] [PubMed]
- Larkina, T.A.; Barkova, O.Y.; Peglivanyan, G.K.; Mitrofanova, O.V.; Dementieva, N.V.; Stanishevskaya, O.I.; Vakhrameev, A.B.; Makarova, A.V.; Shcherbakov, Y.S.; Pozovnikova, M.V.; et al. Evolutionary subdivision of domestic chickens: Implications for local breeds as assessed by phenotype and genotype in comparison to commercial and fancy breeds. Agriculture 2021, 11, 914. [Google Scholar] [CrossRef]
- Larkina, T.A.; Romanov, M.N.; Barkova, O.Y.; Peglivanyan, G.K.; Mitrofanova, O.V.; Dementieva, N.V.; Stanishevskaya, O.I.; Vakhrameev, A.B.; Makarova, A.V.; Shcherbakov, Y.S.; et al. Genetic Variation of the NCAPG-LCORL Locus in Chickens of Local Breeds Based on SNP Genotyping Data. In Proceedings of the Molecular Genetic Technologies for Analysis of Gene Expression Related to Animal Productivity and Disease Resistance, Materials of the 3rd International Scientific and Practical Conference, Moscow, Russia, 30 September 2021; Pozyabin, S.V., Kochish, I.I., Romanov, M.N., Eds.; Ministry of Agriculture of the Russian Federation; Federal State Budgetary Educational Institution of Higher Education “Moscow State Academy of Veterinary Medicine and Biotechnology—MVA Named after K.I. Scriabin”; Sel’skokhozyaistvennye tekhnologii: Moscow, Russia, 2021; pp. 133–146, (In Russian with English summary). [Google Scholar] [CrossRef]
- Romanov, M.N.; Dementyeva, N.V.; Terletsky, V.P.; Plemyashov, K.V.; Stanishevskaya, O.I.; Kudinov, A.A.; Perinek, O.Y.; Fedorova, E.S.; Larkina, T.A.; Pleshanov, N.V. Applying SNP Array Technology to Assess Genetic Diversity in Russian Gene Pool of Chickens. In Proceedings of the International Plant and Animal Genome XXV Conference, San Diego, CA, USA, 14–18 January 2017; Scherago International: San Diego, CA, USA, 2017. Abstract P0115. Available online: https://pag.confex.com/pag/xxv/webprogram/Paper23948.html (accessed on 26 March 2024).
- Romanov, M.N.; Abdelmanova, A.S.; Fisinin, V.I.; Gladyr, E.A.; Volkova, N.A.; Koshkina, O.A.; Rodionov, A.N.; Vetokh, A.N.; Gusev, I.V.; Anshakov, D.V.; et al. Selective footprints and genes relevant to cold adaptation and other phenotypic traits are unscrambled in the genomes of divergently selected chicken breeds. J. Anim. Sci. Biotechnol. 2023, 14, 35. [Google Scholar] [CrossRef] [PubMed]
- Romanov, M.N.; Abdelmanova, A.S.; Fisinin, V.I.; Gladyr, E.A.; Volkova, N.A.; Anshakov, D.V.; Stanishevskaya, O.I.; Vakhrameev, A.B.; Dotsev, A.V.; Griffin, D.K.; et al. Whole genome screening procures a holistic hold of the Russian chicken gene pool heritage and demographic history. Biology 2023, 12, 979. [Google Scholar] [CrossRef] [PubMed]
- Khalkhali-Evrigh, R.; Hedayat, N.; Ming, L.; Jirimutu. Identification of selection signatures in Iranian dromedary and Bactrian camels using whole genome sequencing data. Sci. Rep. 2022, 12, 9653. [Google Scholar] [CrossRef] [PubMed]
- Yang, K.; Zhang, J.; Zhao, Y.; Shao, Y.; Zhai, M.; Liu, H.; Zhang, L. Whole genome resequencing revealed the genetic relationship and selected regions among Baicheng-You, Beijing-You, and European-origin broilers. Biology 2023, 12, 1397. [Google Scholar] [CrossRef] [PubMed]
- Vodyanov, A.D. Poultry Farming; SGC Smena—Branch of the Federal Research Centre “All-Russian Research and Technological Poultry Institute” of the Russian Academy of Sciences: Bereznyaki, Moscow Oblast, Russia, 2022; Available online: https://spsmena.ru/ptitsievodstvo (accessed on 26 March 2024). (In Russian)
- Kochish, I.I.; Titov, V.Y.; Nikonov, I.N.; Brazhnik, E.A.; Vorobyov, N.I.; Korenyuga, M.V.; Myasnikova, O.V.; Dolgorukova, A.M.; Griffin, D.K.; Romanov, M.N. Unraveling signatures of chicken genetic diversity and divergent selection in breed specific patterns of early myogenesis, nitric oxide metabolism and post-hatch growth. Front. Genet. 2023, 13, 1092242. [Google Scholar] [CrossRef] [PubMed]
- Bratyshko, N.I.; Prytulenko, O.V.; Lemesheva, M.M.; Tereshchenko, O.V. Recommendations on Rationing of Feeding of Agricultural Poultry, 3rd ed.; Tereshchenko, O.V., Ed.; Poultry Research Institute, NAAS, NTMT: Birky, Ukraine, 2010. (In Ukrainian) [Google Scholar]
- Katerynych, O.O.; Pankova, S.M.; Tereshchenko, O.V.; Ruda, S.V.; Havilei, O.V.; Riabinina, O.V.; Muzyka, N.M.; Ionov, I.A. Rearing, Maintenance and Feeding of Egg and Meat-Egg Hens: Scientific and Practical Guide; Poultry Research Institute, DDSP NAAS: Birky, Ukraine, 2017. (In Ukrainian) [Google Scholar]
- Chen, S.; Zhou, Y.; Chen, Y.; Gu, J. fastp: An ultra-fast all-in-one FASTQ preprocessor. Bioinformatics 2018, 34, i884–i890. [Google Scholar] [CrossRef]
- Andrews, S. FastQC: A Quality Control Tool for High throughput Sequence Data, Version 0.10.1; Bioinformatics Group, Babraham Institute: Cambridge, UK, 2012; Available online: http://www.bioinformatics.babraham.ac.uk/projects/fastqc (accessed on 26 March 2024).
- Vasimuddin, M.; Misra, S.; Li, H.; Aluru, S. Efficient Architecture-Aware Acceleration of BWA-MEM for Multicore Systems. In Proceedings of the 2019 IEEE International Parallel and Distributed Processing Symposium (IPDPS), Rio de Janeiro, Brazil, 20–24 May 2019; IEEE: Rio de Janeiro, Brazil, 2019; pp. 314–324. [Google Scholar] [CrossRef]
- Li, H. Aligning sequence reads, clone sequences and assembly contigs with BWA-MEM. arXiv 2013, arXiv:1303.3997v2 [q-bio.GN]. [Google Scholar] [CrossRef]
- GRCg7b. Genome Assembly bGalGal1.mat.broiler.GRCg7b (Reference); National Library of Medicine, National Center for Biotechnology Information: Bethesda, MD, USA, 2021. Available online: https://www.ncbi.nlm.nih.gov/datasets/genome/GCF_016699485.2/ (accessed on 26 March 2024).
- Huang, Z.; Xu, Z.; Bai, H.; Huang, Y.; Kang, N.; Ding, X.; Liu, J.; Luo, H.; Yang, C.; Chen, W.; et al. Evolutionary analysis of a complete chicken genome. Proc. Natl. Acad. Sci. USA 2023, 120, e2216641120. [Google Scholar] [CrossRef]
- Li, H.; Handsaker, B.; Wysoker, A.; Fennell, T.; Ruan, J.; Homer, N.; Marth, G.; Abecasis, G.; Durbin, R.; 1000 Genome Project Data Processing Subgroup. The sequence alignment/map format and SAMtools. Bioinformatics 2009, 25, 2078–2079. [Google Scholar] [CrossRef] [PubMed]
- Danecek, P.; Bonfield, J.K.; Liddle, J.; Marshall, J.; Ohan, V.; Pollard, M.O.; Whitwham, A.; Keane, T.; McCarthy, S.A.; Davies, R.M.; et al. Twelve years of SAMtools and BCFtools. GigaScience 2021, 10, giab008. [Google Scholar] [CrossRef]
- Li, H. Tabix: Fast retrieval of sequence features from generic TAB-delimited files. Bioinformatics 2011, 27, 718–719. [Google Scholar] [CrossRef] [PubMed]
- Tange, O. GNU Parallel 20210822 (‘Kabul’); Zenodo, CERN (European Organization for Nuclear Research), IT Department, Digital Repositories Section: Genève, Switzerland, 2021. [Google Scholar] [CrossRef]
- Purcell, S.; Neale, B.; Todd-Brown, K.; Thomas, L.; Ferreira, M.A.R.; Bender, D.; Maller, J.; Sklar, P.; de Bakker, P.I.W.; Daly, M.J.; et al. PLINK: A tool set for whole-genome association and population-based linkage analyses. Am. J. Hum. Genet. 2007, 81, 559–575. [Google Scholar] [CrossRef] [PubMed]
- Chang, C.C.; Chow, C.C.; Tellier, L.C.; Vattikuti, S.; Purcell, S.M.; Lee, J.J. Second-generation PLINK: Rising to the challenge of larger and richer datasets. Gigascience 2015, 4, 7. [Google Scholar] [CrossRef] [PubMed]
- Wickham, H. ggplot2: Elegant Graphics for Data Analysis; Springer: New York, NY, USA, 2009; ISBN 978-0-387-98141-3. [Google Scholar] [CrossRef]
- Keenan, K.; McGinnity, P.; Cross, T.F.; Crozier, W.W.; Prodohl, P.A. diveRsity: An R package for the estimation and exploration of population genetics parameters and their associated errors. Methods Ecol. Evol. 2013, 4, 782–788. [Google Scholar] [CrossRef]
- Nei, M. Estimation of average heterozygosity and genetic distance from a small number of individuals. Genetics 1978, 89, 583–590. [Google Scholar] [CrossRef] [PubMed]
- Kalinowski, S.T. Counting alleles with rarefaction: Private alleles and hierarchical sampling designs. Conserv. Genet. 2004, 5, 539–543. [Google Scholar] [CrossRef]
- Alexander, D.H.; Novembre, J.; Lange, K. Fast model-based estimation of ancestry in unrelated individuals. Genome Res. 2009, 19, 1655–1664. [Google Scholar] [CrossRef]
- Alexander, D.H.; Lange, K. Enhancements to the ADMIXTURE algorithm for individual ancestry estimation. BMC Bioinform. 2011, 12, 246. [Google Scholar] [CrossRef] [PubMed]
- Milanesi, M.; Capomaccio, S.; Vajana, E.; Bomba, L.; Garcia, J.F.; Ajmone-Marsan, P.; Colli, L. BITE: An R package for biodiversity analyses. bioRxiv 2017, 181610. [Google Scholar] [CrossRef]
- Weir, B.S.; Cockerham, C.C. Estimating F-statistics for the analysis of population structure. Evolution 1984, 38, 1358–1370. [Google Scholar] [CrossRef]
- Ravinet, M.; Meier, J. Calculating LD decay. In Speciation & Population Genomics: A How-to-Guide; Wellcome Sanger Institute, University of Cambridge, University of Nottingham: Nottingham, UK, 2024; Available online: https://speciationgenomics.github.io/ld_decay/ (accessed on 26 March 2024).
- Yin, X.; Martinez, A.S.; Sepúlveda, M.S.; Christie, M.R. Rapid genetic adaptation to recently colonized environments is driven by genes underlying life history traits. BMC Genom. 2021, 22, 269. [Google Scholar] [CrossRef]
- Fariello, M.I.; Boitard, S.; Naya, H.; SanCristobal, M.; Servin, B. Detecting signatures of selection through haplotype differentiation among hierarchically structured populations. Genetics 2013, 193, 929–941. [Google Scholar] [CrossRef]
- Bonhomme, M.; Chevalet, C.; Servin, B.; Boitard, S.; Abdallah, J.; Blott, S.; Sancristobal, M. Detecting selection in population trees: The Lewontin and Krakauer test extended. Genetics 2010, 186, 241–262. [Google Scholar] [CrossRef] [PubMed]
- Scheet, P.; Stephens, M. A fast and flexible statistical model for large-scale population genotype data: Applications to inferring missing genotypes and haplotypic phase. Am. J. Hum. Genet. 2006, 78, 629–644. [Google Scholar] [CrossRef]
- Pei, Y.F.; Li, J.; Zhang, L.; Papasian, C.J.; Deng, H.W. Analyses and comparison of accuracy of different genotype imputation methods. PLoS ONE 2008, 3, e3551. [Google Scholar] [CrossRef] [PubMed]
- Johnson, N. Genotype Prediction with SVMs. CS 229 Machine Learning Final Projects, Autumn 2008; Stanford University: Stanford, CA, USA, 2008; Available online: http://cs229.stanford.edu/proj2008/Johnson-GenotypePredictionWithSVMs.pdf (accessed on 26 March 2024).
- Moser, G.; Khatkar, M.S.; Raadsma, H.W. Imputation of Missing Genotypes in High Density SNP Data. In Proceedings of the 18th Conference of the Association for the Advancement of Animal Breeding and Genetics, Brossa Valley, Australia, 28 September –1 October 2009; Association for the Advancement of Animal Breeding and Genetics: Brossa Valley, Australia, 2009; pp. 612–615. [Google Scholar]
- Yu, X.; Li, X.; Guo, T.; Zhu, C.; Wu, Y.; Mitchell, S.E.; Roozeboom, K.L.; Wang, D.; Wang, M.L.; Pederson, G.A.; et al. Genomic prediction contributing to a promising global strategy to turbocharge gene banks. Nat. Plants 2016, 2, 16150. [Google Scholar] [CrossRef]
- Marras, G.; Gaspa, G.; Sorbolini, S.; Dimauro, C.; Ajmone-Marsan, P.; Valentini, A.; Williams, J.L.; Macciotta, N.P.P. Analysis of runs of homozygosity and their relationship with inbreeding in five cattle breeds farmed in Italy. Anim. Genet. 2014, 46, 110–121. [Google Scholar] [CrossRef] [PubMed]
- Dixit, S.P.; Singh, S.; Ganguly, I.; Bhatia, A.K.; Sharma, A.; Kumar, N.A.; Dang, A.K.; Jayakumar, S. Genome-wide runs of homozygosity revealed selection signatures in Bos indicus. Front. Genet. 2020, 11, 92. [Google Scholar] [CrossRef]
- Cesarani, A.; Gaspa, G.; Pauciullo, A.; Degano, L.; Vicario, D.; Macciotta, N.P.P. Genome-wide analysis of homozygosity regions in european simmental bulls. J. Anim. Breed. Genet. 2021, 138, 69–79. [Google Scholar] [CrossRef]
- Li, D.; Huang, M.; Zhuang, Z.; Ding, R.; Gu, T.; Hong, L.; Zheng, E.; Li, Z.; Cai, G.; Wu, Z.; et al. Genomic analyses revealed the genetic difference and potential selection genes of growth traits in two Duroc lines. Front. Vet. Sci. 2021, 8, 725367. [Google Scholar] [CrossRef]
- Biscarini, F.; Paolo Cozzi, P.; Gaspa, G.; Marras, G. detectRUNS: Detect Runs of Homozygosity and Runs of Heterozygosity in Diploid Genomes. R Package Version 0.9.6. The Comprehensive R Archive Network (CRAN); Institute for Statistics and Mathematics, Vienna University of Economics and Business: Vienna, Austria, 2019; Available online: https://cran.r-project.org/web/packages/detectRUNS/index.html (accessed on 26 March 2024).
- Dzomba, E.F.; Chimonyo, M.; Pierneef, R.; Muchadeyi, F.C. Runs of homozygosity analysis of South African sheep breeds from various production systems investigated using OvineSNP50k data. BMC Genom. 2021, 22, 7. [Google Scholar] [CrossRef] [PubMed]
- Fedorova, E.S.; Dementieva, N.V.; Shcherbakov, Y.S.; Stanishevskaya, O.I. Identification of key candidate genes in runs of homozygosity of the genome of two chicken breeds, associated with cold adaptation. Biology 2022, 11, 547. [Google Scholar] [CrossRef]
- Howrigan, D.P.; Simonson, M.A.; Keller, M.C. Detecting autozygosity through runs of homozygosity: A comparison of three autozygosity detection algorithms. BMC Genom. 2011, 12, 460. [Google Scholar] [CrossRef]
- Ferenčaković, M.; Hamzić, E.; Gredler, B.; Solberg, T.R.; Klemetsdal, G.; Curik, I.; Sölkner, J. Estimates of autozygosity derived from runs of homozygosity: Empirical evidence from selected cattle populations. J. Anim. Breed. Genet. 2013, 130, 286–293. [Google Scholar] [CrossRef] [PubMed]
- Bizarria dos Santos, W.; Pimenta Schettini, G.; Fonseca, M.G.; Pereira, G.L.; Loyola Chardulo, L.A.; Rodrigues Machado Neto, O.; Baldassini, W.A.; Nunes de Oliveira, H.; Abdallah Curi, R. Fine-scale estimation of inbreeding rates, runs of homozygosity and genome-wide heterozygosity levels in the Mangalarga Marchador horse breed. J. Anim. Breed. Genet. 2021, 138, 161–173. [Google Scholar] [CrossRef]
- Abdoli, R.; Mirhoseini, S.Z.; Ghavi Hossein-Zadeh, N.; Zamani, P.; Moradi, M.H.; Ferdosi, M.H.; Sargolzaei, M.; Gondro, C. Runs of homozygosity and cross-generational inbreeding of Iranian fat-tailed sheep. Heredity 2023, 130, 358–367. [Google Scholar] [CrossRef]
- Chessari, G.; Criscione, A.; Marletta, D.; Crepaldi, P.; Portolano, B.; Manunza, A.; Cesarani, A.; Biscarini, F.; Mastrangelo, S. Characterization of heterozygosity-rich regions in Italian and worldwide goat breeds. Sci. Rep. 2024, 14, 3. [Google Scholar] [CrossRef] [PubMed]
- Lencz, T.; Lambert, C.; DeRosse, P.; Burdick, K.E.; Morgan, T.V.; Kane, J.M.; Kucherlapati, R.; Malhotra, A.K. Runs of homozygosity reveal highly penetrant recessive loci in schizophrenia. Proc. Natl. Acad. Sci. USA 2007, 104, 19942–19947. [Google Scholar] [CrossRef] [PubMed]
- Purfield, D.C.; Berry, D.P.; McParland, S.; Bradley, D.G. Runs of homozygosity and population history in cattle. BMC Genet. 2012, 13, 70. [Google Scholar] [CrossRef]
- Keller, M.C.; Visscher, P.M.; Goddard, M.E. Quantification of inbreeding due to distant ancestors and its detection using dense single nucleotide polymorphism data. Genetics 2011, 189, 237–249. [Google Scholar] [CrossRef]
- Bjelland, D.W.; Weigel, K.A.; Vukasinovic, N.; Nkrumah, J.D. Evaluation of inbreeding depression in Holstein cattle using whole-genome SNP markers and alternative measures of genomic inbreeding. J. Dairy Sci. 2013, 96, 4697–4706. [Google Scholar] [CrossRef] [PubMed]
- Toro-Ospina, A.M.; Herrera Rios, A.C.; Pimenta Schettini, G.; Vallejo Aristizabal, V.H.; Bizarria dos Santos, W.; Zapata, C.A.; Ortiz Morea, E.G. Identification of runs of homozygosity islands and genomic estimated inbreeding values in Caqueteño Creole Cattle (Colombia). Genes 2022, 13, 1232. [Google Scholar] [CrossRef]
- Kinsella, R.J.; Kähäri, A.; Haider, S.; Zamora, J.; Proctor, G.; Spudich, G.; Almeida-King, J.; Staines, D.; Derwent, P.; Kerhornou, A.; et al. Ensembl BioMarts: A hub for data retrieval across taxonomic space. Database 2011, 2011, bar030. [Google Scholar] [CrossRef] [PubMed]
- Vitt, U.; Gietzen, D.; Stevens, K.; Wingrove, J.; Becha, S.; Bulloch, S.; Burrill, J.; Chawla, N.; Chien, J.; Crawford, M.; et al. Identification of candidate disease genes by EST alignments, synteny, and expression and verification of Ensembl genes on rat chromosome 1q43-54. Genome Res. 2004, 14, 640–650. [Google Scholar] [CrossRef] [PubMed]
- Martin, F.J.; Amode, M.R.; Aneja, A.; Austine-Orimoloye, O.; Azov, A.G.; Barnes, I.; Becker, A.; Bennett, R.; Berry, A.; Bhai, J.; et al. Ensembl 2023. Nucleic Acids Res. 2023, 51, D933–D941. [Google Scholar] [CrossRef] [PubMed]
- Harrison, P.W.; Amode, M.R.; Austine-Orimoloye, O.; Azov, A.G.; Barba, M.; Barnes, I.; Becker, A.; Bennett, R.; Berry, A.; Bhai, J.; et al. Ensembl 2024. Nucleic Acids Res. 2024, 52, D891–D899. [Google Scholar] [CrossRef] [PubMed]
- Hu, Z.L.; Park, C.A.; Reecy, J.M. Bringing the Animal QTLdb and CorrDB into the future: Meeting new challenges and providing updated services. Nucleic Acids Res. 2022, 50, D956–D961. [Google Scholar] [CrossRef]
- Hu, Z.L.; Reecy, J.M. Animal QTLdb: Beyond a repository. A public platform for QTL comparisons and integration with diverse types of structural genomic information. Mamm. Genome 2007, 18, 1–4. [Google Scholar] [CrossRef] [PubMed]
- Hu, Z.L.; Fritz, E.R.; Reecy, J.M. AnimalQTLdb: A livestock QTL database tool set for positional QTL information mining and beyond. Nucleic Acids Res. 2007, 35, D604–D609. [Google Scholar] [CrossRef]
- Hu, Z.L.; Park, C.A.; Wu, X.L.; Reecy, J.M. Animal QTLdb: An improved database tool for livestock animal QTL/association data dissemination in the post-genome era. Nucleic Acids Res. 2013, 41, D871–D879. [Google Scholar] [CrossRef]
- Romanov, M.N.; Weigend, S.; Bondarenko, Y.V.; Podstreshny, A.P.; Kutnyuk, P.I.; Sakhatsky, N.I. Studies on Poultry Germplasm Diversity and Conservation in Ukraine. In Proceedings of the Poultry Genetics Symposium, Mariensee, Germany, 6–8 October 1999; Preisinger, R., Ed.; Working Group 3 of WPSA, Lohmann Tierzucht: Cuxhaven, Germany, 1999; p. 140. [Google Scholar]
- Weigend, S.; Romanov, M.N.; Rath, D. Methodologies to Identify, Evaluate and Conserve Poultry Genetic Resources. In Proceedings of the XXII World’s Poultry Congress & Exhibition: Participant List & Full Text CD + Book of Abstracts, Istanbul, Turkey, 8–13 June 2004; WPSA—Turkish Branch: Istanbul, Turkey, 2004; p. 84. Available online: https://www.researchgate.net/profile/Michael-Romanov-4/publication/250917228_Methodologies_to_identify_evaluate_and_conserve_poultry_genetic_resources/links/02e7e51edb9d4a883e000000/Methodologies-to-identify-evaluate-and-conserve-poultry-genetic-resources.pdf (accessed on 26 March 2024).
- Moiseyeva, I.G. The state of poultry genetic resources in Russia. Anim. Genet. Resour. 1996, 17, 73–86. [Google Scholar] [CrossRef]
- Sulimova, G.E.; Stolpovsky, Y.A.; Kashtanov, S.N.; Moiseeva, I.G.; Zakharov, I.A. Methods of managing the genetic resources of domesticated animals. In Fundamentals of Biological Resource Management: Collection of Scientific Articles; Rysin, L.P., Ed.; Partnership of Scientific Publications KMK LLC: Moscow, Russia, 2005; pp. 331–342. ISBN 5-87317-254-4. Available online: https://elibrary.ru/item.asp?id=50435256 (accessed on 26 March 2024). (In Russian)
- Moiseyeva, I.G.; Romanov, M.N.; Kovalenko, A.T.; Mosyakina, T.V.; Bondarenko, Y.V.; Kutnyuk, P.I.; Podstreshny, A.P.; Nikiforov, A.A. The Poltava chicken breed of Ukraine: Its history, characterization and conservation. Anim. Genet. Resour. Inf. 2007, 40, 71–78. [Google Scholar] [CrossRef]
- Tereshchenko, O.V.; Pankova, S.M.; Katerynych, O.O. Napriamy rozvytku haluzi ptakhivnytstva [Directions of development of poultry industry]. Vìsnik agrar. Nauki [Bull. Agric. Sci.] 2015, 93, 27–30. Available online: https://agrovisnyk.com/index.php/agrovisnyk/article/view/75 (accessed on 26 March 2024). [CrossRef]
- Moiseyeva, I.G.; Romanov, M.N.; Nikiforov, A.A.; Sevastyanova, A.A.; Semyenova, S.K. Evolutionary relationships of Red Jungle Fowl and chicken breeds. Genet. Sel. Evol. 2003, 35, 403–423. [Google Scholar] [CrossRef] [PubMed]
- Harrison, S.J.; Siegel, P.B.; Honaker, C.F.; Lewis, R.M. Population dynamics of a long-term selection experiment in White Plymouth Rock chickens selected for low or high body weight. Poult. Sci. 2023, 102, 102575. [Google Scholar] [CrossRef] [PubMed]
- Moiseyeva, I.G. Native breeds of domestic fowl. In Geneticheskie nesursy sel’skokhozyajstvennykh zhivothykh: Redkie i ischezayushchie otechestvennye porody [Farm Animal Genetic Resources: Rare and Endangered Native Breeds]; Moiseyeva, I.G., Zakharov, I.A., Mitichashvili, R.S., Eds.; Nauka: Moscow, Russia, 1992; pp. 11–112. Available online: https://agris.fao.org/search/en/providers/122621/records/647396783ed73003714cc15a (accessed on 26 March 2024). (In Russian)
- Moiseyeva, I.; Romanov, M.; Ovsyannikova, H.; Alimov, A. Orloff chicken breed [De Orloff]. Avicult. Eur. 2013, 9, 3. Available online: http://www.aviculture-europe.nl/nummers/13E04A03.pdf (accessed on 26 March 2024).
- Moiseyeva, I.G.; Sevastyanova, A.A.; Aleksandrov, A.V.; Vakhrameev, A.B.; Romanov, M.N.; Dmitriev, Y.I.; Semenova, S.K.; Sulimova, G.E. Orloff chicken breed: History, current status and studies. Izv. Timiryazev. S-Kh. Akad. [Izv. Timiryazev Agric. Acad.]. 2016, 1, pp. 78–96. Available online: https://www.elibrary.ru/item.asp?id=25664565 (accessed on 26 March 2024). (In Russian with English summary).
- Oyun, N.Y.; Moiseyeva, I.G.; Sevastianova, A.A.; Vakhrameev, A.B.; Alexandrov, A.V.; Kuzevanova, A.Y.; Alimov, A.A.; Sulimova, G.E. Mitochondrial DNA polymorphism in different populations of Spangled Orloff chickens. Genetika 2015, 51, 1057–1065, (In Russian with English summary). [Google Scholar] [CrossRef] [PubMed]
- Oyun, N.Y.; Moiseyeva, I.G.; Sevastianova, A.A.; Vakhrameev, A.B.; Alexandrov, A.V.; Kuzevanova, A.Y.; Alimov, A.A.; Sulimova, G.E. Mitochondrial DNA polymorphism in different populations of Orloff Spangled chicken breed. Russ. J. Genet. 2015, 51, 908–915. [Google Scholar] [CrossRef]
- Moiseeva, I.G. Variability and heritability of some features of egg quality in Russkaya Belaya chickens. Tr. Akad. Nauk SSSR Inst. Genet. 1964, 31, 302–308. (In Russian) [Google Scholar]
- Moiseeva, I.G. Soderzhanie lipidov i kholesterina v iatsakh kur russkoĭ beloĭ porody v sviazi s produktivnost’iu [The lipid and cholesterin contents of hen’s eggs of the Russian white breed in relation to productiveness]. Tr. Akad. Nauk SSSR Inst. Genet. 1965, 33, 119–128. Available online: https://www.cabidigitallibrary.org/doi/full/10.5555/19660103382 (accessed on 26 March 2024). (In Russian). [PubMed]
- Moiseeva, I.G. Content of lipids and cholesterol in eggs of Russian White chickens. Collect. Works Young Sci. All-Union Res. Tech. Poult. Inst. 1966, 8, 225–235. (In Russian) [Google Scholar]
- Dementieva, N.V.; Fedorova, E.S.; Krutikova, A.A.; Mitrofanova, O.V.; Stanishevskaya, O.I.; Pleshanov, N.V.; Smaragdov, M.G.; Kudinov, A.A.; Terletsky, V.P.; Romanov, M.N. Genetic variability of indels in the prolactin and dopamine receptor D2 genes and their association with the yield of allanto-amniotic fluid in Russian White laying hens. Tarım Bilim. Derg. [J. Agric. Sci.] 2020, 26, 373–379. [Google Scholar] [CrossRef]
- Tixier-Boichard, M.; Coquerelle, G.; Vilela-Lamego, C.; Weigend, S.; Barre-Dirrie, A.; Groenen, M.; Crooijmans, R.; Vignal, A.; Hillel, J.; Freidlin, P.; et al. Contribution of Data on History, Management and Phenotype to the Description of the Diversity between Chicken Populations Sampled within the AVIANDIV Project. In Proceedings of the Poultry Genetics Symposium, Mariensee, Germany, 6–8 October 1999; Preisinger, R., Ed.; Working Group 3 of WPSA, Lohmann Tierzucht: Cuxhaven, Germany, 1999; pp. 15–21. Available online: https://jukuri.luke.fi/handle/10024/446389 (accessed on 26 March 2024).
- Moiseeva, I. Fowl genetic resources in Russia. Ptitsevodstvo [Poultry Farm.] 1995, 5, 12–15. Available online: https://www.cabidigitallibrary.org/doi/full/10.5555/19950110592 (accessed on 26 March 2024). (In Russian).
- Nikiforov, A.A.; Moiseyeva, I.G.; Zakharov, I.A. Position of Russian chicken breeds in the diversity of Eurasian fowl. Russ. J. Genet. 1998, 34, 702–703. [Google Scholar]
- Moiseeva, I.G. The effect of inbreeding on the quality of fowl eggs. Genetika 1970, 6, 99–107. Available online: https://www.cabidigitallibrary.org/doi/full/10.5555/19700104311 (accessed on 26 March 2024). (In Russian).
- Doekes, H.P.; Bijma, P.; Windig, J.J. How depressing is inbreeding? A meta-analysis of 30 years of research on the effects of inbreeding in livestock. Genes 2021, 12, 926. [Google Scholar] [CrossRef]
- Wang, Q.; Zhang, J.; Wang, H.; Wang, Z.; Li, Q.; Zhao, G.; Zheng, M.; Wen, J. Estimates of genomic inbreeding and identification of candidate regions in Beijing-You chicken populations. Anim. Genet. 2023, 54, 155–165. [Google Scholar] [CrossRef]
- Wang, H.; Wang, Q.; Tan, X.; Wang, J.; Zhang, J.; Zheng, M.; Zhao, G.; Wen, J. Estimation of genetic variability and identification of regions under selection based on runs of homozygosity in Beijing-You Chickens. Poult. Sci. 2023, 102, 102342. [Google Scholar] [CrossRef] [PubMed]
- Yang, L.; Du, X.; Wei, S.; Gu, L.; Li, N.; Gong, Y.; Li, S. Genome-wide association analysis identifies potential regulatory genes for eumelanin pigmentation in chicken plumage. Anim. Genet. 2017, 48, 611–614. [Google Scholar] [CrossRef]
- Fagerberg, L.; Hallström, B.M.; Oksvold, P.; Kampf, C.; Djureinovic, D.; Odeberg, J.; Habuka, M.; Tahmasebpoor, S.; Danielsson, A.; Edlund, K.; et al. Analysis of the human tissue-specific expression by genome-wide integration of transcriptomics and antibody-based proteomics. Mol. Cell. Proteom. 2014, 13, 397–406. [Google Scholar] [CrossRef] [PubMed]
- Morotomi-Yano, K.; Yano, K.I.; Saito, H.; Sun, Z.; Iwama, A.; Miki, Y. Human regulatory factor X 4 (RFX4) is a testis-specific dimeric DNA-binding protein that cooperates with other human RFX members. J. Biol. Chem. 2002, 277, 836–842. [Google Scholar] [CrossRef]
- Huang, T.; Pu, Y.; Song, C.; Sheng, Z.; Hu, X. A quantitative trait locus on chromosome 2 was identified that accounts for a substantial proportion of phenotypic variance of the yellow plumage color in chicken. Poult. Sci. 2020, 99, 2902–2910. [Google Scholar] [CrossRef] [PubMed]
- Dadousis, C.; Somavilla, A.; Ilska, J.J.; Johnsson, M.; Batista, L.; Mellanby, R.J.; Headon, D.; Gottardo, P.; Whalen, A.; Wilson, D.; et al. A genome-wide association analysis for body weight at 35 days measured on 137,343 broiler chickens. Genet. Sel. Evol. 2021, 53, 70. [Google Scholar] [CrossRef]
- Wang, W.J.; Guo, Y.Q.; Xie, K.J.; Li, Y.D.; Li, Z.W.; Wang, N.; Xiao, F.; Guo, H.S.; Li, H.; Wang, S.Z. A functional variant in the promoter region of IGF1 gene is associated with chicken abdominal fat deposition. Domest. Anim. Endocrinol. 2021, 75, 106584. [Google Scholar] [CrossRef] [PubMed]
- Qanbari, S.; Strom, T.M.; Haberer, G.; Weigend, S.; Gheyas, A.A.; Turner, F.; Burt, D.W.; Preisinger, R.; Gianola, D.; Simianer, H. A high resolution genome-wide scan for significant selective sweeps: An application to pooled sequence data in laying chickens. PLoS ONE 2012, 7, e49525. [Google Scholar] [CrossRef]
- Qanbari, S.; Rubin, C.J.; Maqbool, K.; Weigend, S.; Weigend, A.; Geibel, J.; Kerje, S.; Wurmser, C.; Peterson, A.T.; Brisbin, I.L., Jr.; et al. Genetics of adaptation in modern chicken. PLoS Genet. 2019, 15, e1007989. [Google Scholar] [CrossRef]
- Kulibaba, R.A.; Tereshchenko, A.V. Transforming growth factor β1, pituitary-specific transcriptional factor 1 and insulin-like growth factor I gene polymorphisms in the population of the Poltava clay chicken breed: Association with productive traits. Agric. Sci. Pract. 2015, 2, 67–72. [Google Scholar] [CrossRef]
- Stark, K.; Straub, R.H.; Rovenský, J.; Blažičková, S.; Eiselt, G.; Schmidt, M. CYB5A polymorphism increases androgens and reduces risk of rheumatoid arthritis in women. Arthritis Res. Ther. 2015, 17, 56. [Google Scholar] [CrossRef]
- Moreira, G.C.M.; Salvian, M.; Boschiero, C.; Cesar, A.S.M.; Reecy, J.M.; Godoy, T.F.; Ledur, M.C.; Garrick, D.; Mourão, G.B.; Coutinho, L.L. Genome-wide association scan for QTL and their positional candidate genes associated with internal organ traits in chickens. BMC Genom. 2019, 20, 669. [Google Scholar] [CrossRef] [PubMed]
- Lin, J.; Wang, C.; Redies, C. Expression of multiple delta-protocadherins during feather bud formation. Gene Expr. Patterns 2013, 13, 57–65. [Google Scholar] [CrossRef]
- Liu, J.; Zhou, J.; Li, J.; Bao, H. Identification of candidate genes associated with slaughter traits in F2 chicken population using genome-wide association study. Anim. Genet. 2021, 52, 532–535. [Google Scholar] [CrossRef]
- Liu, R.; Sun, Y.; Zhao, G.; Wang, F.; Wu, D.; Zheng, M.; Chen, J.; Zhang, L.; Hu, Y.; Wen, J. Genome-wide association study identifies Loci and candidate genes for body composition and meat quality traits in Beijing-You chickens. PLoS ONE 2013, 8, e61172. [Google Scholar] [CrossRef] [PubMed]
- Pozovnikova, M.V.; Larkina, T.A.; Vakhrameev, A.B.; Fedorova, Z.L.; Reynbakh, N.R.; Ryabovan, A.E.; Dement’eva, N.V. Analysis of the biophysical qualities of eggs in the Pushkinsk and Tzarskosel’skaya hens with various allelic variants of the LCORL gene. Izv. Timiryazev. S-Kh. Akad. [Izv. Timiryazev Agric. Acad.] 2023, 2, 135–143, (In Russian with English summary). [Google Scholar] [CrossRef]
- Ma, X.; Ying, F.; Li, Z.; Bai, L.; Wang, M.; Zhu, D.; Liu, D.; Wen, J.; Zhao, G.; Liu, R. New insights into the genetic loci related to egg weight and age at first egg traits in broiler breeder. Poult. Sci. 2024, 103, 103613. [Google Scholar] [CrossRef]
- Li, Y.D.; Liu, X.; Li, Z.W.; Wang, W.J.; Li, Y.M.; Cao, Z.P.; Luan, P.; Xiao, F.; Gao, H.H.; Guo, H.S.; et al. A combination of genome-wide association study and selection signature analysis dissects the genetic architecture underlying bone traits in chickens. Animal 2021, 15, 100322. [Google Scholar] [CrossRef] [PubMed]
- Qu, L.; Shen, M.; Guo, J.; Wang, X.; Dou, T.; Hu, Y.; Li, Y.; Ma, M.; Wang, K.; Liu, H. Identification of potential genomic regions and candidate genes for egg albumen quality by a genome-wide association study. Arch. Anim. Breed. 2019, 62, 113–123. [Google Scholar] [CrossRef] [PubMed]
- Guo, J.; Qu, L.; Dou, T.C.; Shen, M.M.; Hu, Y.P.; Ma, M.; Wang, K.H. Genome-wide association study provides insights into the genetic architecture of bone size and mass in chickens. Genome 2020, 63, 133–143. [Google Scholar] [CrossRef] [PubMed]
- Jang, H.M.; Erf, G.F.; Rowland, K.C.; Kong, B.W. Genome resequencing and bioinformatic analysis of SNP containing candidate genes in the autoimmune vitiligo Smyth line chicken model. BMC Genom. 2014, 15, 707. [Google Scholar] [CrossRef] [PubMed]
- Yang, L.; Li, S.; Mo, C.; Zhou, B.; Fan, S.; Shi, F.; Wei, X.; Zhao, Q.; Yang, G.; Li, S.; et al. Transcriptome analysis and identification of age-associated fertility decreased genes in hen uterovaginal junction. Poult. Sci. 2021, 100, 100892. [Google Scholar] [CrossRef] [PubMed]
- van Dijk, F.S.; Semler, O.; Etich, J.; Köhler, A.; Jimenez-Estrada, J.A.; Bravenboer, N.; Claeys, L.; Riesebos, E.; Gegic, S.; Piersma, S.R.; et al. Interaction between KDELR2 and HSP47 as a key determinant in osteogenesis imperfecta caused by bi-allelic variants in KDELR2. Am. J. Hum. Genet. 2020, 107, 989–999. [Google Scholar] [CrossRef]
- Chen, L.; Ni, Z.; Hua, J.; Ye, W.; Liu, K.; Yun, T.; Zhu, Y.; Zhang, C. Proteomic analysis of host cellular proteins co-immunoprecipitated with duck enteritis virus gC. J. Proteom. 2021, 245, 104281. [Google Scholar] [CrossRef]
- Zhang, H.; Shen, L.; Li, Y.; Xu, Z.; Zhang, X.; Yu, J.; Cao, Z.; Luan, P. Genome-wide association study for plasma very low-density lipoprotein concentration in chicken. J. Anim. Breed. Genet. 2019, 136, 351–361. [Google Scholar] [CrossRef] [PubMed]
- Peng, M.; Li, S.; He, Q.; Zhao, J.; Li, L.; Ma, H. Proteomics reveals changes in hepatic proteins during chicken embryonic development: An alternative model to study human obesity. BMC Genom. 2018, 19, 29. [Google Scholar] [CrossRef]
- Jahejo, A.R.; Zhang, D.; Niu, S.; Mangi, R.A.; Khan, A.; Qadir, M.F.; Khan, A.; Chen, H.C.; Tian, W.X. Transcriptome-based screening of intracellular pathways and angiogenesis related genes at different stages of thiram induced tibial lesions in broiler chickens. BMC Genom. 2020, 21, 50. [Google Scholar] [CrossRef]
- Orgeur, M.; Martens, M.; Leonte, G.; Nassari, S.; Bonnin, M.A.; Börno, S.T.; Timmermann, B.; Hecht, J.; Duprez, D.; Stricker, S. Genome-wide strategies identify downstream target genes of chick connective tissue-associated transcription factors. Development 2018, 145, dev161208. [Google Scholar] [CrossRef]
- Zhang, Z.W.; Rong, E.G.; Shi, M.X.; Wu, C.Y.; Sun, B.; Wang, Y.X.; Wang, N.; Li, H. Expression and functional analysis of Krüppel-like factor 2 in chicken adipose tissue. J. Anim. Sci. 2014, 92, 4797–4805. [Google Scholar] [CrossRef]
- Zhang, C.; Lin, D.; Wang, Y.; Peng, D.; Li, H.; Fei, J.; Chen, K.; Yang, N.; Hu, X.; Zhao, Y.; et al. Widespread introgression in Chinese indigenous chicken breeds from commercial broiler. Evol. Appl. 2019, 12, 610–621. [Google Scholar] [CrossRef] [PubMed]
- Dunnington, E.A.; Siegel, P.B. Comparison of sex-linked dwarf genes in chickens from two sources when introgressed into unrelated genetic backgrounds. Br. Poult. Sci. 1998, 39, 216–220. [Google Scholar] [CrossRef]
- Baydevlyatova, O.N.; Ogurtsova, N.S.; Shomina, N.V.; Tereshchenko, A.V. Morphological indicators of egg quality in a new chicken subpopulation of the meat-egg type of productivity. Ptakhivnytstvo [Poultry Farm.] 2009, 64, 109–115, (In Russian with English summary). [Google Scholar]
- Katerynych, O.O.; Pankova, S.M.; Bondarenko, Y.V. Adaptability of domestically bred poultry of different directions of productivity. Ptakhivnytstvo [Poultry Farm.] 2012, 68, 210–216. (In Ukrainian) [Google Scholar]
- Bondarenko, Y.V.; Khvostik, V.P. Pokrashhennya produktyvnosti m’yaso-yayechnyh kurej vitchyznyanoyi selekciyi [Improving the productivity of meat and egg chickens of domestic selection]. Vìsn. Sumsʹkogo Nac. Agrar. Univ. Ser. Tvarynnytstvo [Bull. Sumy Natl. Agrar. Univ. Ser. Livest.] 2020, 2, 29–32, (In Ukrainian with English summary). [Google Scholar] [CrossRef]


| Breed 2 | n | HO (M ± SE) | UHE (M ± SE) | AR (M ± SE) | UFIS [CI 95%] |
|---|---|---|---|---|---|
| CRW | 20 | 0.2958 ± 0.0001 | 0.3034 ± 0.0001 | 1.9101 ± 0.0002 a | 0.0363 [0.0358; 0.0368] |
| PRW | 20 | 0.2958 ± 0.0001 | 0.3022 ± 0.0001 | 1.9187 ± 0.0002 b | 0.0321 [0.0316; 0.0326] |
| USH | 17 | 0.2103 ± 0.0002 c | 0.2068 ± 0.0001 c | 1.6218 ± 0.0004 c | 0.0082 [0.0075; 0.0089] |
| Chromosome | Bin Start 2 | Bin End 3 | N 4 | ZFST | Breed Pairs | Genes |
|---|---|---|---|---|---|---|
| GGA1 | 54,420,001 | 54,470,000 | 729 | 0.404483 | CRW/PRW | CHST11 |
| GGA1 | 54,530,001 | 54,580,000 | 1040 | 0.602406 | CRW/USH | CHST11 |
| GGA1 | 55,310,001 | 55,360,000 | 190 | 0.884104 | CRW/USH | IGF1 |
| GGA1 | 55,310,001 | 55,360,000 | 291 | 0.597753 | PRW/USH | IGF1 |
| GGA1 | 55,320,001 | 55,370,000 | 196 | 0.752325 | CRW/USH | IGF1 |
| GGA1 | 55,320,001 | 55,370,000 | 276 | 0.568095 | PRW/USH | IGF1 |
| GGA1 | 75,490,001 | 75,540,000 | 148 | 0.622485 | CRW/USH | TEAD4 |
| GGA1 | 75,490,001 | 75,540,000 | 157 | 0.565816 | PRW/USH | TEAD4 |
| GGA1 | 75,500,001 | 75,550,000 | 132 | 0.663862 | CRW/USH | TEAD4 |
| GGA1 | 75,500,001 | 75,550,000 | 149 | 0.563412 | PRW/USH | TEAD4 |
| GGA1 | 75,510,001 | 75,560,000 | 67 | 0.386978 | CRW/PRW | TEAD4 |
| GGA1 | 75,510,001 | 75,560,000 | 125 | 0.714440 | CRW/USH | TEAD4 |
| GGA1 | 75,510,001 | 75,560,000 | 138 | 0.579394 | PRW/USH | TEAD4 |
| GGA1 | 75,520,001 | 75,570,000 | 77 | 0.372578 | CRW/PRW | TEAD4 |
| GGA1 | 75,520,001 | 75,570,000 | 130 | 0.637783 | CRW/USH | TEAD4 |
| GGA1 | 188,000,001 | 188,050,000 | 477 | 0.775700 | PRW/USH | GRM5 |
| GGA1 | 188,010,001 | 188,060,000 | 872 | 0.366252 | CRW/PRW | GRM5 |
| GGA1 | 188,010,001 | 188,060,000 | 548 | 0.697367 | PRW/USH | GRM5 |
| GGA1 | 188,020,001 | 188,070,000 | 865 | 0.371221 | CRW/PRW | GRM5 |
| GGA1 | 188,020,001 | 188,070,000 | 596 | 0.649595 | PRW/USH | GRM5 |
| GGA1 | 188,030,001 | 188,080,000 | 866 | 0.35713 | CRW/PRW | GRM5 |
| GGA1 | 188,030,001 | 188,080,000 | 649 | 0.592529 | PRW/USH | GRM5 |
| GGA2 | 93,720,001 | 93,770,000 | 344 | 0.619266 | CRW/USH | CCDC102B |
| GGA2 | 93,720,001 | 93,770,000 | 360 | 0.599763 | PRW/USH | CCDC102B |
| GGA11 | 140,001 | 190,000 | 362 | 0.432514 | CRW/PRW | SMPD3 |
| GGA11 | 140,001 | 190,000 | 358 | 0.603890 | CRW/USH | SMPD3 |
| Chromosome | Breed | Position | Length, Mb | No. of SNPs | Most Significant SNP | Genes | |
|---|---|---|---|---|---|---|---|
| Start | End | ||||||
| GGA1 | CRW | 53,119,864 | 53,212,505 | 0.093 | 82 | rs15269046 | SYN3, TIMP3 |
| PRW | 53,637,245 | 54,504,503 | 0.867 | 569 | rs314634881 | NUAK1, C12orf75, MTERF2, TMEM263, RIC8B, RFX4, POLR3B, CRY1, APPL2, WASHC4, ALDH1L2, SLC41A2, CHST11, TCP11 × 2, CKAP4, gga-mir-12210 | |
| GGA6 | USH | 8,693,825 | 8,814,126 | 0.120 | 108 | rs315872719 | KROX20, ADO |
| GGA16 | USH | 2,090,051 | 2,170,380 | 0.080 | 190 | rs737045576 | IL4I1, TRIM7.1, SLURP1, TRIM39.2, TRIM27.2, TRIM39.1, TRIM27.1, TRIM41, RACK1, BG1 |
| USH | 2,230,563 | 2,248,418 | 0.018 | 95 | rs740720869 | CENPA, CYP21A1 | |
| GGA31 | PRW | 626,104 | 665,706 | 0.040 | 421 | 31:6,534,09 | – |
| Breed 2 | n | ROH Length, Mb | ROH No. | FROH | ||||||
|---|---|---|---|---|---|---|---|---|---|---|
| M ± SE | Min | Max | M ± SE | Min | Max | M ± SE | Min | Max | ||
| CRW | 20 | 102.59 ± 5.71 | 52.06 | 147.61 | 123 ± 6.75 | 62 | 164 | 0.108 ± 0.006 | 0.06 | 0.16 |
| PRW | 20 | 95.25 ± 7.54 | 36.81 | 155.47 | 116.45 ± 8.91 | 50 | 190 | 0.101 ± 0.008 | 0.04 | 0.16 |
| USH | 17 | 338.75 ± 9.31 | 262.60 | 394.09 | 390.94 ± 9.47 | 306 | 435 | 0.358 ± 0.010 | 0.28 | 0.42 |
| Chromosome | Position | Length, Mb | Breed 1 | Genes | |
|---|---|---|---|---|---|
| Start | End | ||||
| GGA4 | 70,462,265 | 70,739,807 | 0.278 | CRW | ENSGALG00010011849, ENSGALG00010011854 |
| 70,701,554 | 70,970,711 | 0.269 | USH | ENSGALG00010011854, ENSGALG00010011667, ENSGALG00010011863, ENSGALG00010011687 | |
| 70,740,151 | 71,008,491 | 0.268 | CRW | ENSGALG00010011667, ENSGALG00010011863, ENSGALG00010011687 | |
| 70,740,151 | 70,753,263 | 0.013 | PRW | ENSGALG00010011667 | |
| GGA33 | 245,471 | 1,033,316 | 0.788 | PRW | – |
| 245,535 | 1,033,647 | 0.788 | CRW | – | |
| 245,535 | 1,033,347 | 0.788 | USH | – | |
| Chromosome | Sequential Region No. | Position | Length, Mb | Breeds 1 | Method | Genes | ||
|---|---|---|---|---|---|---|---|---|
| Start | End | This Study | Previous Studies [58,62] | |||||
| GGA1 | 1 | 53,637,245 | 54,504,503 | 0.867 | PRW | CRW, USH | hapFLK | NUAK1, C12orf75, MTERF2, TMEM263, RIC8B, RFX4, POLR3B, CRY1, APPL2, WASHC4, ALDH1L2, SLC41A2, CHST11, TCP11X2, CKAP4, gga-mir-12210 |
| 53,740,001 | 53,790,000 | 0.050 | CRW, PRW | ZFST | RFX4 | |||
| 2 | 55,266,291 | 55,354,497 | 0.088 | PRW | CRW, USH | ROH | IGF1 | |
| 55,280,001 | 55,330,000 | 0.050 | CRW, USH | ZFST | IGF1 | |||
| GGA2 | 3 | 91,027,506 | 92,075,494 | 1.048 | USH | – | ROH | FAM69C, C18orf63, CYB5A, TIMM21, ZNF407, CNDP1, CNDP2U1, FBXO15 |
| 91,520,001 | 91,570,000 | 0.050 | CRW, USH | ZFST | C18orf63, CYB5A | |||
| 4 | 92,075,780 | 93,852,482 | 1.777 | USH | – | ROH | RTTNDOK6, TMX3, SOCS6, CCDC102B, NETO1, CBLN2, gga-mir-1803, gga-mir-1681, gga-mir-6584 | |
| 93,720,001 | 93,770,000 | 0.050 | CRW, USH | ZFST | CCDC102B | |||
| GGA4 | 5 | 70,754,254 | 71,145,478 | 0.391 | PRW | RUW, CRW | ROH | PCDH7 |
| 70,971,231 | 71,354,713 | 0.383 | USH | ROH | PCDH7 | |||
| 71,140,001 | 71,190,000 | 0.050 | PRW, USH | ZFST | PCDH7 | |||
| 6 | 74,938,839 | 75,922,825 | 0.984 | USH | USH, RUW, CRW | ROH | LCORL, NCAPG, MED28, LAP3, CLRN2, QDPR, LDB2 | |
| 75,380,001 | 75,430,000 | 0.050 | PRW, USH | ZFST | LCORL, NCAPG | |||
| GGA5 | 7 | 30,830,001 | 30,880,000 | 0.050 | CRW, PRW | CRW, USH, RUW, OMF | ZFST | MEIS2 |
| 30,830,467 | 31,703,025 | 0.873 | CRW | ROH | CDIN1, DPH6, ZNF770, AQR, gga-mir-1718 | |||
| GGA7 | 8 | 9,270,001 | 9,320,000 | 0.050 | CRW, USH | CRW | ZFST | DNAH7 |
| 9,281,277 | 10,029,387 | 0.748 | USH | ROH | SF3B1, STK17B, HECW2, GTF3C3, C7H2ORF66, PGAP1, ANKRD44, COQ10B, HSPD1, HSPE1, MOB4, RFTN2, BOLL, PLCL1 | |||
| 9,670,001 | 9,720,000 | 0.050 | CRW, USH | ZFST | ANKRD44 | |||
| GGA10 | 9 | 5,355,392 | 6,359,502 | 1.004 | USH | USH, OMF | ROH | LRRC49, THSD4, BNIP2, GTF2A2, GCNT3, OTUD7A, KLF13, TRPM1, MTMR10, FAN1, MPHOSPH10, MCEE, APBA2, FAM189A1, TJP1, TARSL2, TM2D3, ADAL, LARP6, gga-mir-204-2, gga-mir-1574 |
| 5,920,001 | 5,970,000 | 0.050 | CRW, PRW | ZFST | FAM189A1 | |||
| GGA14 | 10 | 8,062,881 | 8,813,937 | 0.751 | USH | – | ROH | C14H16ORF52, VWA3A, SDR42E2, EEF2K, POLR3E, CDR2, METTL9, IGSF6, OTOA, KDELR2, RPS15A, ARL6IP1, SMG1, CLEC19A, SYT17, COQ7, TMC7, TMC5, GDE1, CCP110, ITPRIPL2, gga-mir-1644 |
| 8,790,001 | 8,840,000 | 0.050 | PRW, USH | ZFST | KDELR2, DAGLB, RAC1 | |||
| 11 | 9,118,484 | 10,172,206 | 1.054 | USH | – | ROH | CARHSP1, PMM2, TMEM186, ABAT, METTL22, TMEM114, C16orf72, USP7, NUBP1, TEKT5, EMP2, GRIN2A | |
| 9,120,001 | 9,170,000 | 0.050 | PRW, USH | ZFST | NUBP1, TEKT5 | |||
| GGA28 | 12 | 4,740,302 | 5,396,354 | 0.656 | USH | RUW, CRW | ROH | CHERP, C19orf44, CALR3, PTPRS, KDM4B, KLF2, AP1M1, FAM32A, CIB3, RAB8A, TPM4, TINCR, DPP9, TNFAIP8L1, MED26, SLC35E1, UHRF1, TICAM1, FEM1A, PLIN3, gga-mir-7-3, gga-mir-6666, MYDGF |
| 4,760,001 | 4,810,000 | 0.050 | CRW, USH | ZFST | CHERP, C19orf44, CALR3 | |||
| Traits | Breeds 1 | Total | |||||
|---|---|---|---|---|---|---|---|
| CRW | CRW/PRW | CRW/USH | PRW | PRW/USH | USH | ||
| Exterior | 2 | 4 | 1 | 6 | 4 | 6 | 23 |
| Aggressive behavior | 2 | 3 | 5 | ||||
| Feather density | 4 | 2 | 6 | ||||
| Feather pecking | 2 | 1 | 1 | 2 | 6 | ||
| Feather pigmentation | 2 | 2 | 4 | ||||
| Receiving feather pecking | 2 | 2 | |||||
| Health | 2 | 2 | |||||
| Campylobacter intestinal colonization | 2 | 2 | |||||
| Physiology | 11 | 4 | 15 | ||||
| Blood carbon dioxide level | 1 | 1 | |||||
| CO2 partial pressure | 3 | 1 | 4 | ||||
| VLDL cholesterol level | 8 | 2 | 10 | ||||
| Production | 1 | 3 | 9 | 2 | 265 | 368 | 648 |
| Abdominal fat percentage | 2 | 2 | |||||
| Abdominal fat weight | 2 | 2 | 1 | 5 | |||
| Albumen height | 6 | 2 | 8 | ||||
| Average daily gain | 16 | 69 | 85 | ||||
| Body slope length | 1 | 1 | |||||
| Body weight | 1 | 1 | 27 | 107 | 136 | ||
| Body weight gain | 1 | 1 | |||||
| Bursa of Fabricius weight | 3 | 3 | |||||
| Carcass fat content | 3 | 1 | 4 | ||||
| Carcass weight | 12 | 12 | |||||
| Chest width | 4 | 1 | 5 | ||||
| Claw percentage | 2 | 2 | |||||
| Claw weight | 8 | 8 | |||||
| Drumstick and thigh muscle percentage | 1 | 1 | |||||
| Drumstick and thigh muscle weight | 1 | 1 | |||||
| Drumstick and thigh percentage | 1 | 1 | |||||
| Drumstick and thigh weight | 1 | 1 | |||||
| Egg number | 1 | 2 | 3 | ||||
| Egg production rate | 3 | 1 | 4 | ||||
| Egg weight | 128 | 63 | 191 | ||||
| Eggshell weight | 1 | 1 | |||||
| Feed conversion ratio | 2 | 12 | 46 | 60 | |||
| Feed intake | 3 | 3 | |||||
| Feet weight | 5 | 5 | |||||
| Femur area | 3 | 1 | 4 | ||||
| Femur length | 3 | 1 | 4 | ||||
| Gizzard weight | 12 | 5 | 17 | ||||
| Head weight | 1 | 1 | |||||
| Heart weight | 12 | 5 | 17 | ||||
| Liver weight | 12 | 5 | 17 | ||||
| Muscle dry matter content | 1 | 1 | |||||
| Proventriculus weight | 12 | 5 | 17 | ||||
| Shank diameter | 1 | 1 | |||||
| Shank length | 3 | 3 | 6 | ||||
| Spleen weight | 1 | 1 | |||||
| Tibia length | 3 | 2 | 5 | ||||
| Tibia weight | 3 | 2 | 5 | ||||
| Wing weight | 1 | 1 | |||||
| Yolk weight | 6 | 2 | 8 | ||||
| Reproduction | 28 | 13 | 41 | ||||
| Oviduct length | 12 | 5 | 17 | ||||
| Oviduct weight | 16 | 8 | 24 | ||||
| Total | 3 | 7 | 21 | 8 | 297 | 393 | 729 |
Disclaimer/Publisher’s Note: The statements, opinions and data contained in all publications are solely those of the individual author(s) and contributor(s) and not of MDPI and/or the editor(s). MDPI and/or the editor(s) disclaim responsibility for any injury to people or property resulting from any ideas, methods, instructions or products referred to in the content. |
© 2024 by the authors. Licensee MDPI, Basel, Switzerland. This article is an open access article distributed under the terms and conditions of the Creative Commons Attribution (CC BY) license (https://creativecommons.org/licenses/by/4.0/).
Share and Cite
Romanov, M.N.; Shakhin, A.V.; Abdelmanova, A.S.; Volkova, N.A.; Efimov, D.N.; Fisinin, V.I.; Korshunova, L.G.; Anshakov, D.V.; Dotsev, A.V.; Griffin, D.K.; et al. Dissecting Selective Signatures and Candidate Genes in Grandparent Lines Subject to High Selection Pressure for Broiler Production and in a Local Russian Chicken Breed of Ushanka. Genes 2024, 15, 524. https://doi.org/10.3390/genes15040524
Romanov MN, Shakhin AV, Abdelmanova AS, Volkova NA, Efimov DN, Fisinin VI, Korshunova LG, Anshakov DV, Dotsev AV, Griffin DK, et al. Dissecting Selective Signatures and Candidate Genes in Grandparent Lines Subject to High Selection Pressure for Broiler Production and in a Local Russian Chicken Breed of Ushanka. Genes. 2024; 15(4):524. https://doi.org/10.3390/genes15040524
Chicago/Turabian StyleRomanov, Michael N., Alexey V. Shakhin, Alexandra S. Abdelmanova, Natalia A. Volkova, Dmitry N. Efimov, Vladimir I. Fisinin, Liudmila G. Korshunova, Dmitry V. Anshakov, Arsen V. Dotsev, Darren K. Griffin, and et al. 2024. "Dissecting Selective Signatures and Candidate Genes in Grandparent Lines Subject to High Selection Pressure for Broiler Production and in a Local Russian Chicken Breed of Ushanka" Genes 15, no. 4: 524. https://doi.org/10.3390/genes15040524