Article

UBE2C Is a Transcriptional Target of the Cell Cycle Regulator FOXM1

by
Pedro Nicolau-Neto
1,
Antonio Palumbo
2,
Marco De Martino
3,
Francesco Esposito
3,
Tatiana De Almeida Simão
4,
Alfredo Fusco
3,
Luiz Eurico Nasciutti
2,
Nathalia Meireles Da Costa
1 and
Luis Felipe Ribeiro Pinto
1,4,*
1
Programa de Carcinogênese Molecular, Instituto Nacional de Câncer—INCA, Rua Andre Cavalcanti 37, Rio de Janeiro 20231-050, RJ, Brazil
2
Laboratório de Interações Celulares, Instituto de Ciências Biomédicas, Universidade Federal do Rio de Janeiro, Prédio de Ciências da Saúde—Ilha do Fundão, A. Carlos Chagas, Rio de Janeiro 21941-902, RJ, Brazil
3
Istituto di Endocrinologia e Oncologia Sperimentale—CNR c/o Dipartimento di Medicina Molecolare e Biotecnologie Mediche, Università degli Studi di Napoli “Federico II”, 80131 Naples, Italy
4
Departamento de Bioquímica, Instituto de Biologia Roberto Alcantara Gomes, Universidade do Estado do Rio de Janeiro, Av. 28 de Setembro 87, Fundos, Pavilhão Américo Piquet Carneiro—4° Andar, Rio de Janeiro 20551-030, RJ, Brazil
*
Author to whom correspondence should be addressed.
Genes 2018, 9(4), 188; https://doi.org/10.3390/genes9040188
Submission received: 8 January 2018 / Revised: 21 March 2018 / Accepted: 27 March 2018 / Published: 29 March 2018
(This article belongs to the Section Human Genomics and Genetic Diseases)

Abstract

:
FOXM1 (forkhead box protein M1) is a transcription factor that participates in all stages of tumor development, mainly through the control of cell cycle and proliferation, regulating the expression of genes involved in G1/S and G2/M transition and M phase progression. The ubiquitin conjugating enzyme E2 (UBE2C) is a member of the anaphase promoting complex/cyclosome, promoting the degradation of several target proteins along cell cycle progression, during metaphase/anaphase transition. FOXM1 and UBE2C have been found overexpressed in a wide range of different solid tumors. Therefore, the aim of this study was to investigate whether UBE2C is a transcriptional target of FOXM1, using esophageal squamous cell carcinoma (ESCC) as a model, in addition to several cancer-deposited data. Our results show that FOXM1 and UBE2C expression present a positive correlation in normal tissues and in 25 distinct tumor types, including ESCC, where these genes are overexpressed. Moreover, FOXM1 binds to UBE2C promoter region in ESCC cell line and transcriptionally activates it, leading to UBE2C upregulation. In conclusion, this study provides evidences that FOXM1 transcriptionally regulates UBE2C expression in ESCC and their deregulation may be a general phenomenon in human neoplasias.

1. Introduction

Forkhead box protein M1 (FOXM1) is one of the most studied members of the FOX transcriptional regulators family [1], characterized by an evolutionary conserved ‘forkhead’ or ‘winged-helix’ DNA-binding domain (DBD) [2]. FOXM1 is overexpressed in a wide range of different solid tumors [3,4], including esophageal squamous cell carcinomas (ESCC) [5,6]. FOXM1 functions as an oncogene, contributing, among other processes, to the loss of control of cell cycle progression and cell proliferation, since this protein is a key regulator for G1/S and G2/M transition and M phase progression. The main mechanism by which FOXM1 controls these cellular features is through the transcriptional regulation of key genes involved in cell cycle control [7].
As a member of the anaphase promoting complex/cyclosome (APC/C), ubiquitin conjugating enzyme E2 (UBE2C) promotes the degradation of several target proteins along cell cycle progression, particularly mitotic cyclins, during metaphase/anaphase transition [8,9]. We have recently shown that UBE2C is upregulated in ESCC samples, and its abrogation altered the proliferation and cell cycle profile of ESCC cell lines, by directly modulating cyclin B1 expression levels, demonstrating the participation of UBE2C in critical steps of ESCC genesis [10]. Recently, a positive correlation between UBE2C and FOXM1 gene expression in esophageal adenocarcinoma (EAC) samples and in vitro EAC-derived cells was reported [11].
In this way, the aim of this study was to investigate whether UBE2C is a transcriptional target of FOXM1, using ESCC as a model. This study shows that FOXM1 and UBE2C are overexpressed and positively correlated in ESCC as well as in a wide range of distinct tumor types. In silico analysis showed that FOXM1 binds to UBE2C promoter in different tumors. Finally, FOXM1 binds to its response elements within UBE2C promoter, transcriptionally activates it and leads to increased levels of UBE2C protein in ESCC cell line, demonstrating that UBE2C is a FOXM1 transcriptional target.

2. Materials and Methods

2.1. Patients and Samples

Gene expression analysis comprised 52 paired ESCC and non-malignant histologically normal surrounding mucosa (collected at least 4 cm far from the tumor border) biopsy samples from patients who were submitted to endoscopy, from 2006 to 2013 at the Brazilian National Cancer Institute (INCA). None of the patients comprised in this study had undergone any type of chemotherapy and/or radiotherapy. At the moment of the endoscopy, clinicopathological data were obtained, by using a standardized questionnaire. The clinicopathological characteristics of the ESCC patients enrolled in this study are described in Supplementary Materials Table S1.

2.2. Ethics

Written informed consent was obtained from all the study participants. The project was approved by the Ethics Committee of the Brazilian National Cancer Institute (number of the project: 116/11). All methods were performed in accordance with the relevant guidelines and regulations.

2.3. RNA Extraction, Reverse Transcription and qRT-PCR

Total RNA was extracted from tissue samples using RNEasy mini kit (Qiagen, Hilden, Alemanha), following the manufacturer’s protocol. RNA samples yields were measured using NanoDrop (Thermo, Waltham, MA, USA) and 500 ng of total RNA was reverse transcribed using SuperScript II (Invitrogen, Carlsbad, CA, USA), according to the manufacturer’s protocol. FOXM1 and UBE2C expression levels were assessed by real-time PCR, using a rotor-gene platform (Qiagen). Specific oligonucleotides were used in the expression levels analyses, as follows: FOXM1 Forward: 5′ AACCTTTCCCTGCACGACAT 3′, FOXM1 Reverse: 5′ GGTCCAGTGGCTTAAACACC 3′, UBE2C Forward: 5′ TGGTCTGCCCTGTATGATGT 3′, UBE2C Reverse: 5′ AAAAGCTGTGGGGTTTTTCC 3′; GAPDH Forward: 5′ CAACAGCCTCAAGATCATCAGCAA 3′, GAPDH Reverse: 5′ AGTGATGGCATGGACTGTGGTCAT 3′. Each reaction consisted of 5.0 μL of Quantifast SYBR Green PCR Master Mix (Qiagen), 10 pmols of primers and 1 μL of cDNA. The amplification reaction was performed as follows: 5 min for DNA pre-denaturation at 95 °C, followed by 40 cycles of hybridization and complementary chain synthesis for 5 s at 95 °C and 10 s at 60 °C.

2.4. Cell Line and Transfections

The ESCC-derived cell line, TE-1, was kindly donated by Dr. Pierre Hainaut (University of Grenoble, France). TE-1 cells were cultured in RPMI medium (Invitrogen) supplemented with 10% fetal bovine serum (Thermo) and 1% of the cocktail penicillin/glutamine/streptomycin (Invitrogen) and maintained at 37 °C under 10% CO2. TE-1 cells had FOXM1 expression levels induced by transfecting different amounts of an expression vector (pcDNA3-FOXM1) [12] or the empty backbone vector (pcDNA3, Invitrogen), used as an experimental control, using Lipofectamine 2000 (Invitrogen), following the manufacturer’s protocol. Cells were authenticated using Powerplex 16 STR System (Promega, Madison, WI, USA) and were routinely tested for mycoplasma using a Mycosensor (Agilent, Santa Clara, CA, USA).

2.5. Chromatin Immunoprecipitation (ChIP) Assay

TE-1 cells (2 × 10⁶ cells/plate/10 mL) were plated in 10 mm plates, transfected with a FOXM1 expression vector (total of 5 µg of pcDNA3-FOXM1 or empty pcDNA3/plate/10 mL) and, 24 h later, 1% formaldehyde was added to the culture medium for 10 min at room temperature to cross-link proteins to DNA and then neutralized by the addition of 125 mM glycine pH 2.5. Cells lysis, immunoprecipitation and DNA extraction were performed using the SimpleChIP® Enzymatic Chromation IP Kit (Magnetic Beads), according to the manufacturer’s protocol (Cell Signaling, Danvers, MA, USA). Lysates were sonicated, according the following: 12× (5 s on: 5 s off) at 21% amplitude, using the sonicator Vibra cell 75041. FOXM1 immunoprecipitation was performed using 9 μg of FOXM1 antibody (FOXM1 (C-20): sc-502, Santa Cruz, Dallas, TX, USA). Immunopreciptated DNA was amplified by qPCR, using primers for FOXM1-binding sites (forkhead domain—FKHD) region, following the amplification protocol described by SimpleChIP® Enzymatic Chromation IP manufacturer’s Kit. PLK1 amplification was performed as a positive control for FOXM1 binding. The sequences of the oligonucleotides used were UBE2C forward: 5′ CATTGGCTGGATCAAACCCA 3′, UBE2C Reverse: 5′ GGAGAACACGACTGCAACTG 3′; PLK1 forward: 5′ GGGCGGGTTTGGATTTTA 3′, PLK1 reverse: 5′ AGTCACTGCAGCACTCATGC 3′.

2.6. UBE2C Promoter Cloning and Dual-Luciferase Assay

The sequence 5′ of UBE2C coding regions was analyzed to search for potential FOXM1 consensus regions (FKHD) using JASPAR2016 web-based software [13] and four FKHD were identified. Two of the four FKDH comprised within UBE2C promoter were cloned into the promoter-less luciferase plasmid pGL3-Basic (Promega) KpnI–XhoI cloning site, generating a UBE2C-luciferase reporter system (pGL3-UBE2C). The sequences of the primers used to amplify UBE2C promoter are: Forward: 5′ AATTGGTACCTGTTCCCACGCGGAGTAAG 3′, Reverse: 5′-AATTCTCGAGGGGGGTGGTCCTAGAAATC 3′. Briefly, TE-1 cells (2 × 10⁵ cells/plate/2 mL) were co-transfected in 6-well plates with different amounts of FOXM1 expression vector (pcDNA3-FOXM1) and a constant amount of pGL3-UBE2C promoter luciferase reporter vector, together with the Renilla luciferase plasmid, using siPORT neoFX Transfection Agent (Thermo). The pRL-TK control vector expressing Renilla luciferase (Promega) was used for normalization of cell number and transfection efficiency. Luciferase activity was measured 48 h after transfection using the dual-luciferase reporter assay system (Promega) with a Lumat LB 9507 apparatus (Berthold Technologies, Bad Wildbad, Germany).

2.7. Protein Extraction and Western Blot

Cell protein extraction was performed by washing them twice in ice-cold PBS and subsequently lysing them by using RIPA-like buffer (250 mM NaCl, 50 mM TRIS-HCl, pH 7.4, 0.1% SDS, 2 mM DTT and 0.5% NP-40, (Sigma, St. Louis, MO, USA)) containing protease inhibitors (Roche, Belmonte, CA, USA). Protein concentration was determined by the Bradford assay (Bio-Rad, Hercules, CA, USA) and using bovine serum albumin was employed as standard. An amount of 50 µg of total protein extract was resolved onto a 8.0% SDS PAGE, transferred a nitrocellulose-membrane (Roche) and probed with the appropriate antibodies for 1 h. Antibodies anti-FOXM-1 (Santa Cruz), anti-UBE2C (Boston Biochem, Cambridge, MA, USA) and anti-tubulin (Sigma, St. Louis, MO, USA) were used at 1:250, 1:500 and 1:1000 dilutions, respectively. Next, membranes were incubated with the horseradish peroxidase-conjugated secondary antibody (1:10,000) for 1 h and detection was performed with enhanced chemiluminescence ECL Kit (Amersham, Piscataway, NJ, USA).

2.8. In Silico Analysis

In order to analyze FOXM1 and UBE2C gene expression pattern in human healthy tissues, data from sequence read archive (SRA) bioproject PRJEB4337 were downloaded. To investigate FOXM1 and UBE2C expression in a larger set of samples and from distinct tumor types, we accessed and re-analyzed data deposited in the repository The cBioPortal for Cancer Genomics, which responds as an open-access downloaded bio-database, providing visualization and analyzing tools for large-scale cancer genomics datasets. This portal collected records from 147 individual cancer studies, comprising 31 distinct cancer types and over 21,000 tumor samples [14,15]. FOXM1 and UBE2C gene expression data re-analyzed were downloaded from The Cancer Genome Atlas (TCGA) provisional data of 25 different tumor types listed in Table 1. FOXM1 protein levels used in the re-analysis were obtained from the same database. For chromatin immunopreciptation (ChIP)-seq analysis, data of chromatin immunopreciptation followed by high-throughput sequencing were obtained from Encyclopedia of DNA Elements—ENCODE [16], which uses hg19 as the reference genome. Sequences derived from FOXM1 Chip-seq in three human cancer-derived cell lines, MCF-7 (breast cancer), ECC1 (endometrial adenocarcinoma) and SKSH (neuroblastoma) were downloaded and evaluated. The accession numbers of the above cited sequences are wgEncodeEH003288, wgEncodeEH003279 and wgEncodeEH003243 for ECC1, MCF-7 and SKSH cell lines, respectively. For this propose, MACS peak calling [17] was applied aiming to identify the enriched regions of high read density relative to total input chromatin control reads. PLK1 and KRT1 loci were analyzed as positive and negative control for FOXM1 binding, respectively.

2.9. Statistical Analyses

To evaluate differences in gene expression between ESCC tissue and their paired nonmalignant surrounding mucosa, a paired t test was used when data showed Gaussian distribution and Wilcoxon matched pair test when data did not show Gaussian distribution. To assess the association between gene expression levels, Spearman’s rank for non-Gaussian distribution was employed. All analyses were performed in GraphPad Prism 5 software version 5.02.

3. Results

3.1. FOXM1 and UBE2C Are Co-Expressed in Healthy Tissues

FOXM1 and UBE2C gene expression profiles were analyzed in samples from 27 different healthy tissues, using SRA data, bioproject PRJEB4337, and a very similar expression pattern was observed for these two genes (Figure 1A). In addition, a significant positive correlation (r = 0.97; p < 0.0001) between FOXM1 and UBE2C median expression values in the different tissues investigated was observed (Figure 1B).

3.2. FOXM1 and UBE2C Co-Overexpression Is a Common Event in Cancer, Including ESCC

Next, we re-analyzed FOXM1 and UBE2C expression data from over 7400 samples from 25 different tumor types deposited in the TCGA database and detected a positive correlation between the expressions of the two genes in all tumor types analyzed (Table 1). Furthermore, we also found a statistically significant positive correlation between FOXM1 protein expression levels and UBE2C gene expression in some selected tumors: 77 ESCC (r = 0.32, p = 0.004), 48 esophageal adenocarcinomas (r = 0.37, p = 0.008), 887 breast cancer samples (r = 0.58, p < 0.0001), 340 bladder urothelial carcinomas (r = 0.36, p < 0.0001), 360 lung adenocarcinomas (r = 0.36, p < 0.0001), and 336 stomach adenocarcinomas (r = 0.34, p < 0.0001) (Figure 2A–F), suggesting a potential regulation of UBE2C by the transcriptional factor FOXM1.
Further, FOXM1 and UBE2C expression profiles were also assessed in 52 paired ESCC and non-malignant adjacent mucosa specimens, showing that both genes were overexpressed (4.5- and 2.2-fold higher, respectively) in tumors, in respect to their non-malignant adjacent mucosa (Figure 3A), and that their expression was positively correlated (r = 0.39, p = 0.0043) (Figure 3B). This finding was confirmed by the reanalysis of FOXM1 and UBE2C expression data from 95 ESCC samples available in TCGA database (Figure 3C). Moreover, in the same set of samples, the mRNA expression of FOXO3, a well-known FOXM1 antagonist [18,19], was not correlated to that of FOXM1 (p = 0.35) (Figure 3D) and inversely correlated to UBE2C expression (r = −0.33 and p < 0.0001) (Figure 3E).

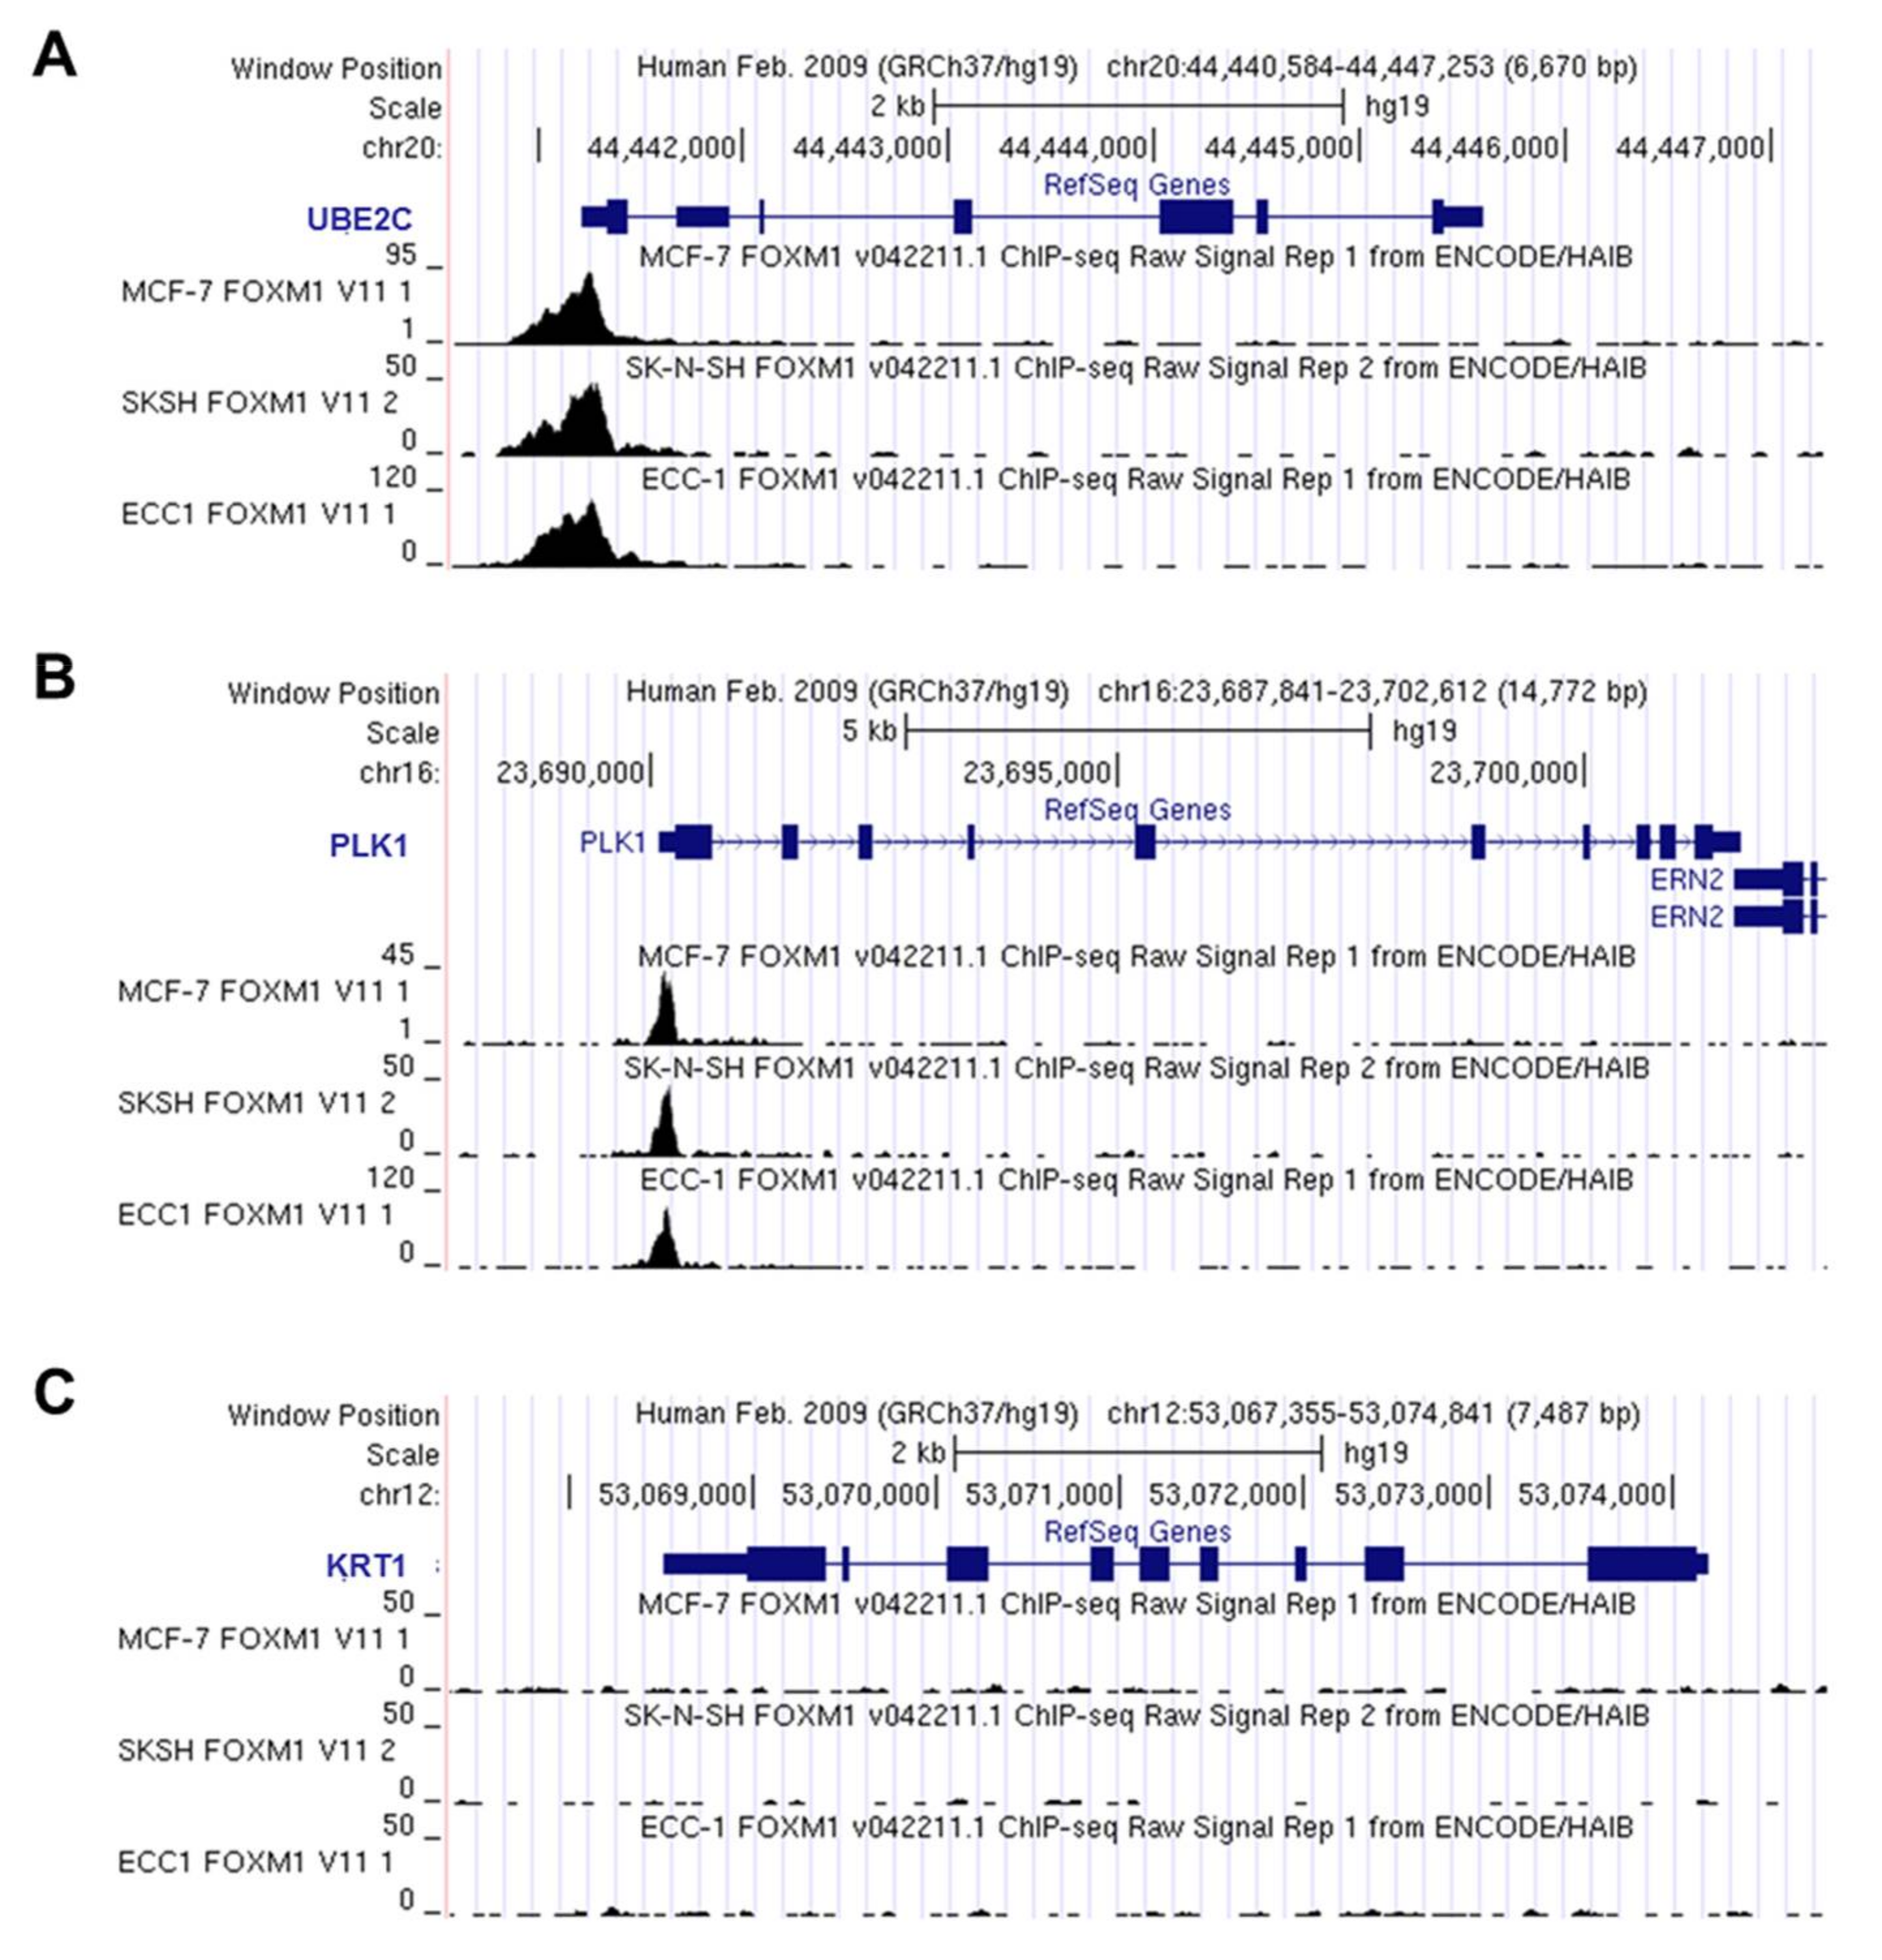
3.3. UBE2C Figures as a Potential FOXM1 Transcriptional Target

Additionally, reanalysis of FOXM1 ChIP-seq data revealed DNA peaks corresponding to UBE2C promoter region in three human cell lines: MCF-7 (breast cancer derived), ECC1 (endometrial adenocarcinoma derived) and SKSH (neuroblastoma derived) (Figure 4A), from ENCODE database [16] (accession numbers wgEncodeEH003288, wgEncodeEH003279 and wgEncodeEH003243, respectively). The presence of DNA peaks was also detected in PLK1 (positive control, Figure 4B), but not in KRT1 (negative control, Figure 4C) promoter regions, upon FOXM1 immunoprecipitation. These results strongly suggest that UBE2C may be a transcriptional target of FOXM1.

3.4. FOXM1 Binds onto UBE2C Promoter and Transcriptionally Activates It in an ESCC-Derived Cell Line

In order to confirm whether FOXM1 is capable of regulating UBE2C transcription, we searched for potential FOXM1 binding sites within UBE2C promoter region. Three different regions containing four potential consensus forkhead domain (FKHD) sites (FOXM1 binding sites), at base positions −31, −290, −557 and −558 from the UBE2C transcriptional start site (Figure 5A), were found. Next, we performed a ChIP assay in the ESCC derived cell line, TE-1, after transfection with both FOXM1 induction expression vector (pcDNA3-FOXM1) and empty control vector (pcDNA3), and it was observed that FOXM1 binds to a described FKHD site (−31 bp) within UBE2C promoter in both conditions. In addition, the binding of FOXM1 onto FKHD site (−31) was 2.2-fold higher in TE-1 transfected with pcDNA3-FOXM1 (Figure 2B,C). As a positive of FOXM1 binding to DNA, the amplification of PLK1 promoter, a well-known FOXM1 transcriptional target [20], was performed (Figure 5D). Further, we derived one fragment containing 2 FKHD (−31 pb and −290 pb) sites from UBE2C promoter and cloned it into luciferase report vector. This vector was transfected together with either increasing amounts of FOXM1 expression, or control (empty) vector in TE-1 cells. Figure 5E shows a significant increase (up to 2.5-fold, when compared to the control) in luciferase expression in TE-1 cells transfected with both the UBE2C-luciferase report and FOXM1 expression vectors. Finally, TE-1 cells transfected with FOXM1 expression vector resulted in a higher UBE2C protein expression when compared to those transfected with an empty vector (control cells), as shown in Figure 5F.

4. Discussion

This study demonstrates that FOXM1 transcriptionally regulates UBE2C expression by directly binding onto its promoter region, and that this may be a common event in healthy tissues and human carcinogenesis.
FOXM1 is a master regulator of cell cycle progression and its deregulation perturbs the timely and coordinated translation through the cell cycle, leading to a loss of checkpoint control in G1/S and G2/M, by disrupting its transcriptional activity of key genes. Specifically, FOXM1 overexpression results in an increase of mitotic cell population and induces expression of a large set of G2/M genes [20]. UBE2C acts in the G2/M checkpoint control, possessing a fundamental role in the maintenance of genetic stability by regulating the degradation of securin, a protein that impairs the segregation of the genetic material by binding to and inhibiting the enzyme separase [21]. Its upregulation has been reported in several distinct tumor types, being associated with a highly malignant phenotype and poor survival, suggesting its role in cancer progression [22,23,24,25,26].
The overexpression of either FOXM1 or UBE2C has been reported in a wide range of tumors [3,4,21,24]. In this study, we not only confirmed the overexpression of both genes but showed that their expression levels are highly correlated in 25 different tumor types analyzed, including ESCC. Applying the Bonferroni correction method to identify false positive results, the significance of FOXM1 and UBE2C expression correlation is maintained in all tumors analysed, except for lymphoid neoplasm diffuse large B-cell lymphoma. Strengthening this finding, we observed a very similar expression pattern for FOXM1 and UBE2C gene expression in a range of distinct non-cancerous tissues, as well as a positive correlation between them. Moreover, we detected an inverse correlation between FOXO3 and UBE2C expression in ESCC samples. FOXO3 is a well-characterized antagonist of FOXM1 [18,19], being capable of repressing FOXM1 expression and also its transcriptional factor activity by preventing the binding of FOXM1 to the DNA [27]. Although there is no correlation between FOXM1 and FOXO3 expression, there was a significant inverse correlation between the expression levels of FOXO3 and UBE2C, suggesting that FOXM1 and FOXO3 may be disputing for the binding to the FKHD responsive elements within UBE2C promoter region in ESCC.
Re-analysis of data from different cell lines demonstrated that FOXM1 binds to UBE2C promoter region, since DNA peaks corresponding to this region were detected. Subsequently, in vitro assays conducted in an ESCC-derived cell line clearly showed that FOXM1 binds onto UBE2C promoter region and that FOXM1 induced expression resulted in both increased luciferase activity driven by UBE2C-promoter and increased levels of UBE2C protein. Together, these results demonstrate that FOXM1 transcriptionally regulates UBE2C expression. Corroborating our results, a very recent study reported that FOXM1 binds onto UBE2C promoter and triggers its transcription in glioma cells and, therefore, protects them from autophagic cell death [28]. It is worth mentioning that, in our TCGA gene expression data re-analysis, the highest correlation coefficient observed between FOXM1 and UBE2C gene expression was in low grade gliomas, and the above cited study [28] supports our hypothesis that the co-overexpression of both genes and the transcriptional regulation of UBE2C by FOXM1 may a general phenomenon in tumors.
Although we have observed promoter activation and a consequent increase in UBE2C gene and protein levels upon FOXM1 overexpression in TE-1 cells, its silencing was not capable of diminishing UBE2C expression levels. The same was observed for PLK1 gene [20]. Similarly, re-analysis of gene expression microarray data deposited in Gene Expression Omnibus Database (GEO-NCBI) from three independent studies using breast cancer cell lines (MCF7—accession number GSE55204, MDA-MB-231—accession number GSE25741 and BT-20—accession number GSE2222) revealed that FOXM1 silencing was not capable of altering both UBE2C and PLK1 gene expression (Supplementary Materials Figure S1). Taken together, these results suggest that other transcriptional factors and/or mechanisms may play a role in UBE2C transcriptional regulation. In this sense, analyses conducted using The Encyclopedia of DNA Elements Consortium [16] data indicated that 54 different transcription factors were detected bound to UBE2C promoter in a wide range of different cell lines, supporting the hypothesis that several proteins may participate in UBE2C expression control, both in solid and liquid tumors. Thus, for instance, FOXA1 (Forkhead box protein A1), another member of the forkhead box protein family, was found bound in the exon 3 region of UBE2C gene and, in association with MED1 (mediator complex subunit 1), was capable of altering UBE2C expression levels in prostate cancer cells [29]. Furthermore, E2F4 (E2F transcription factor 4) overexpression resulted in lower levels of UBE2C expression and in a decrease of its promoter activity in HCT116 cells [30]. In addition, in a leukemia model in which myelodysplastic syndrome mice were used, MYBL2 (MYB proto-oncogene like 2) knockdown also resulted in decreased UBE2C expression [31]. Thus, although in our study we have demonstrated that FOXM1 transcriptionally regulates UBE2C, our new data, as well as data from the literature suggest that it might not be the only mechanism by which UBE2C expression is controlled. In this way, the impact of FOXM1 silencing on UBE2C expression could be offset by other transcription factors and other proteins associated to its gene expression control.
Further, other molecular mechanisms have already been accounted for regarding UBE2C overexpression. For instance, amplification of the 20q13.1 locus has been reported as one of the main mechanisms related with UBE2C aberrant expression, being observed in several malignant tissues, including colon, thyroid, prostate, nasopharynx and esophagus [26,27,28,29,30,31,32,33,34,35]. Of note, these tumors also show FOXM1 overexpression [36,37,38,39] and exhibited FOXM1 and UBE2C expression correlation in the analyses herein presented, indicating that FOXM1 may play a role in UBE2C expression regulation together with 20q13.1 locus amplification. Moreover, the expression of both FOXM1 and UBE2C in breast cancer has already been associated with ErbB2 pathway. HER2 signaling cascade increases FOXM1 expression [40] whereas ErbB2 silencing leads to decreased levels of UBE2C [41]. Interestingly, once more it is possible to observe the involvement of FOXM1 in another described regulatory mechanism of UBE2C expression. Additionally, it is worth mentioning that our data pointed out a positive correlation between the expression of both genes, as well as of FOXM1 protein and UBE2C gene expression, and also demonstrated that FOXM1 binds onto UBE2C promoter in a breast cancer cell line. In this way, it is feasible to state that FOXM1 is a crucial regulator of UBE2C expression and may play a role even in the presence of other regulatory mechanisms.
It has been reported that wild-type p53 mediates the repression of UBE2C and FOXM1 expressions, while its mutant form acts in the opposite way [30,42]. TP53 mutations that result in loss of function of p53 are the most frequent and homogenously detected molecular alterations in ESCC [43,44], occurring in early stages of ESCC carcinogenesis [45]. Consequently, lack of p53 activity may lead to an increase of FOXM1 protein expression and, consequently, of its targets, such as UBE2C, contributing to the loss of proper cell cycle control, a phenomenon highly present in ESCC [44]. In fact, we have previously shown that UBE2C silencing in two ESCC-derived cell lines leads to a decrease in cell proliferation rates and alters cell cycle profile, by interfering with cyclin B1 levels [10].

5. Conclusions

In this study, we demonstrate that UBE2C is a transcriptional target of FOXM1 in ESCC, and likely present in several human neoplasias, thus further contributing to the loss of G2/M checkpoint control as a consequence of FOXM1 deregulation.

Supplementary Materials

The following are available online at https://www.mdpi.com/2073-4425/9/4/188/s1, Table S1: Clinicopathological characteristics of the 52 esophageal squamous cell carcinoma (ESCC) patients comprised in this study; Figure S1: The impact of FOXM1 silencing on gene expression levels of known transcriptional targets; Supplementary ChIP and luciferase assays data.

Author Contributions

Conception and design: P.N.N., T.A.S., N.M.D.C., L.F.R.P. Acquisition of data: P.N.N., A.P.J., N.M.D.C., M.D.M., F.E. Analysis and interpretation of data: P.N.N., A.P.J., T.A.S., N.M.D.C. Material Support: L.E.N., A.F., L.F.R.P. Drafting of the manuscript: P.N.N., A.P.J., T.A.S., A.F., N.M.D.C., L.F.P.R. All authors reviewed the manuscript.

Conflicts of Interest

The authors declare no conflict of interest.

References

  1. Calnan, D.R.; Brunet, A. The FoxO code. Oncogene 2008, 27, 2276–2288. [Google Scholar] [CrossRef] [PubMed]
  2. Myatt, S.S.; Lam, E.W. Targeting FOXM1. Nat. Rev. Cancer 2008, 8, 242. [Google Scholar] [CrossRef] [PubMed]
  3. Pilarsky, C.; Wenzig, M.; Specht, T.; Saeger, H.D.; Grützmann, R. Identification and validation of commonly overexpressed genes in solid tumors by comparison of microarray data. Neoplasia 2004, 6, 744–750. [Google Scholar] [CrossRef] [PubMed]
  4. Uddin, S.; Ahmed, M.; Hussain, A.; Abubaker, J.; Al-Sanea, N.; AbdulJabbar, A.; Ashari, L.H.; Alhomoud, S.; Al-Dayel, F.; Jehan, Z.; et al. Genome-wide expression analysis of middle eastern colorectal cancer reveals FOXM1 as a novel target for cancer therapy. Am. J. Pathol. 2011, 178, 537–547. [Google Scholar] [CrossRef] [PubMed]
  5. Hui, M.K.; Chan, K.W.; Luk, J.M.; Lee, N.P.; Chung, Y.; Cheung, L.C.; Srivastava, G.; Tsao, S.W.; Tang, J.C.; Law, S. Cytoplasmic forkhead box M1 (FOXM1) in esophageal squamous cell carcinoma significantly correlates with pathological disease stage. World J. Surg. 2012, 36, 90–97. [Google Scholar] [CrossRef] [PubMed] [Green Version]
  6. Takata, A.; Takiguchi, S.; Okada, K.; Takahashi, T.; Kurokawa, Y.; Yamasaki, M.; Miyata, H.; Nakajima, K.; Mori, M.; Doki, Y. Clinicopathological and prognostic significance of FOXM1 expression in esophageal squamous cell carcinoma. Anticancer Res. 2014, 34, 2427–2432. [Google Scholar] [PubMed]
  7. Koo, C.Y.; Muir, K.W.; Lam, E.W. Foxm1: From cancer initiation to progression and treatment. Biochim. Biophys. Acta 2012, 1819, 28–37. [Google Scholar] [CrossRef] [PubMed]
  8. Townsley, F.M.; Aristarkhov, A.; Beck, S.; Hershko, A.; Ruderman, J.V. Dominant-negative cyclin-selective ubiquitin carrier protein E2-C/UbcH10 blocks cells in metaphase. Proc. Natl. Acad. Sci. USA 1997, 94, 2362–2367. [Google Scholar] [CrossRef] [PubMed]
  9. Stegmeier, F.; Rape, M.; Draviam, V.M.; Nalepa, G.; Sowa, M.E.; Ang, X.L.; McDonald, E.R.; Li, M.Z.; Hannon, G.J.; Sorger, P.K.; et al. Anaphase initiation is regulated by antagonistic ubiquitination and deubiquitination activities. Nature 2007, 446, 876–881. [Google Scholar] [CrossRef] [PubMed]
  10. Palumbo, A.; Da Costa, N.M.; De Martino, M.; Sepe, R.; Pellecchia, S.; de Sousa, V.P.; Nicolau Neto, P.; Kruel, C.D.; Bergman, A.; Nasciutti, L.E.; et al. UBE2C is overexpressed in ESCC tissues and its abrogation attenuates the malignant phenotype of ESCC cell lines. Oncotarget 2016, 7, 65876–65887. [Google Scholar] [CrossRef] [PubMed]
  11. Wiseman, E.F.; Chen, X.; Han, N.; Webber, A.; Ji, Z.; Sharrocks, A.D.; Ang, Y.S. Deregulation of the FOXM1 target gene network and its coregulatory partners in oesophageal adenocarcinoma. Mol. Cancer 2015, 14, 69. [Google Scholar] [CrossRef] [PubMed]
  12. Nestal de Moraes, G.; Delbue, D.; Silva, K.L.; Robaina, M.C.; Khongkow, P.; Gomes, A.R.; Zona, S.; Crocamo, S.; Mencalha, A.L.; Magalhães, L.M.; et al. FOXM1 targets XIAP and Survivin to modulate breast cancer survival and chemoresistance. Cell. Signal. 2015, 27, 2496–2505. [Google Scholar] [CrossRef] [PubMed]
  13. Mathelier, A.; Fornes, O.; Arenillas, D.J.; Chen, CY.; Denay, G.; Lee, J.; Shi, W.; Shyr, C.; Tan, G.; Worsley-Hunt, R.; et al. JASPAR 2016: A major expansion and update of the open-access database of transcription factor binding profiles. Nucleic Acids Res. 2016, 4, D110–D115. [Google Scholar] [CrossRef] [PubMed]
  14. Gao, J.; Aksoy, B.A.; Dogrusoz, U.; Dresdner, G.; Gross, B.; Sumer, S.O.; Sun, Y.; Jacobsen, A.; Sinha, R.; Larsson, E.; et al. Integrative analysis of complex cancer genomics and clinical profiles using the cBioPortal. Sci. Signal. 2013, 6, pl1. [Google Scholar] [CrossRef] [PubMed] [Green Version]
  15. Cerami, E.; Gao, J.; Dogrusoz, U.; Gross, B.E.; Sumer, S.O.; Aksoy, B.A.; Jacobsen, A.; Byrne, C.J.; Heuer, M.L.; Larsson, E.; et al. The cBio cancer genomics portal: An open platform for exploring multidimensional cancer genomics data. Cancer Discov. 2012, 2, 401–404. [Google Scholar] [CrossRef] [PubMed] [Green Version]
  16. ENCODE Project Consortium. An integrated encyclopedia of DNA elements in the human genome. Nature 2012, 6, 57–74. [Google Scholar] [CrossRef]
  17. Zhang, Y.; Liu, T.; Meyer, C.A.; Eeckhoute, J.; Johnson, D.S.; Bernstein, B.E.; Nusbaum, C.; Myers, R.M.; Brown, M.; Li, W.; et al. Model-based analysis of ChIP-Seq (MACS). Genome Biol. 2008, 9, R137. [Google Scholar] [CrossRef] [PubMed]
  18. Sengupta, A.; Kalinichenko, V.V.; Yutzey, K.E. FoxO1 and FOXM1 transcription factors have antagonistic functions in neonatal cardiomyocyte cell-cycle withdrawal and IGF1 gene regulation. Circ. Res. 2013, 112, 267–277. [Google Scholar] [CrossRef] [PubMed]
  19. Zhao, F.; Lam, E.W. Role of the forkhead transcription factor FoxO-FOXM1 axis in cancer and drug resistance. Front. Med. 2012, 6, 376–380. [Google Scholar] [CrossRef] [PubMed]
  20. Lam, E.W.; Brosens, J.J.; Gomes, A.R.; Koo, C.Y. Forkhead box proteins: Tuning forks for transcriptional harmony. Nat. Rev. Cancer 2013, 13, 482–495. [Google Scholar] [CrossRef] [PubMed]
  21. Hao, Z.; Zhang, H.; Cowell, J. Ubiquitin-conjugating enzyme UBE2C: Molecular biology, role in tumorigenesis, and potential as a biomarker. Tumour. Biol. 2012, 33, 723–730. [Google Scholar] [CrossRef] [PubMed]
  22. Wang, H.; Zhang, C.; Rorick, A.; Wu, D.; Chiu, M.; Thomas-Ahner, J.; Chen, Z.; Chen, H.; Clinton, S.K.; Chan, K.K.; et al. CCI-779 inhibits cell-cycle G2-M progression and invasion of castration-resistant prostate cancer via attenuation of UBE2C transcription and mRNA stability. Cancer Res. 2011, 71, 4866–4876. [Google Scholar] [CrossRef] [PubMed]
  23. Cunha, I.W.; Carvalho, K.C.; Martins, W.K.; Marques, S.M.; Muto, N.H.; Falzoni, R.; Rocha, R.M.; Aguiar, S.; Simoes, A.C.; Fahham, L.; et al. Identification of genes associated with local aggressiveness and metastatic behavior in soft tissue tumors. Transl. Oncol. 2010, 3, 23–32. [Google Scholar] [CrossRef] [PubMed]
  24. Shen, Z.; Jiang, X.; Zeng, C.; Zheng, S.; Luo, B.; Zeng, Y.; Ding, R.; Jiang, H.; He, Q.; Guo, J.; et al. High expression of ubiquitin-conjugating enzyme 2c (UBE2C) correlates with nasopharyngeal carcinoma progression. BMC Cancer 2013, 13, 192. [Google Scholar] [CrossRef] [PubMed]
  25. Lu, J.; Wen, M.; Huang, Y.; He, X.; Wang, Y.; Wu, Q.; Li, Z.; Castellanos-Martin, A.; Abad, M.; Cruz-Hernandez, J.J.; et al. C2ORF40 suppresses breast cancer cell proliferation and invasion through modulating expression of M phase cell cycle genes. Epigenetics 2013, 8, 571–583. [Google Scholar] [CrossRef] [PubMed]
  26. Fujita, T.; Ikeda, H.; Taira, N.; Hatoh, S.; Naito, M.; Doihara, H. Overexpression of UbcH10 alternates the cell cycle profile and accelerate the tumor proliferation in colon cancer. BMC Cancer 2009, 9, 87. [Google Scholar] [CrossRef] [PubMed]
  27. Delpuech, O.; Griffiths, B.; East, P.; Essafi, A.; Lam, E.W.; Burgering, B.; Downward, J.; Schulze, A. Induction of Mxi1-SRα by FoxO3a contributes to repression of Myc-dependent gene expression. Mol. Cell. Biol. 2007, 27, 4917–4930. [Google Scholar] [CrossRef] [PubMed]
  28. Guo, L.; Ding, Z.; Huang, N.; Huang, Z.; Zhang, N.; Xia, Z. Forkhead box m1 positively regulates UBE2C and protects glioma cells from autophagic death. Cell Cycle 2017, 16, 1705–1718. [Google Scholar] [CrossRef] [PubMed]
  29. Clarke, M.; Dumon, S.; Ward, C.; Jäger, R.; Freeman, S.; Dawood, B.; Sheriff, L.; Lorvellec, M.; Kralovics, R.; Frampton, J.; et al. MYBL2 haploinsufficiency increases susceptibility to age-related haematopoietic neoplasia. Leukemia 2013, 27, 661–670. [Google Scholar] [CrossRef] [PubMed]
  30. Bajaj, S.; Alam, S.K.; Roy, K.S.; Datta, A.; Nath, S.; Roychoudhury, S. E2 ubiquitin-conjugating enzyme, UBE2C gene, is reciprocally regulated by wild-type and gain-of-function mutant p53. J. Biol. Chem. 2016, 291, 14231–14247. [Google Scholar] [CrossRef] [PubMed]
  31. Liu, G.; Sprenger, C.; Wu, P.J.; Sun, S.; Uo, T.; Haugk, K.; Epilepsia, K.S.; Plymate, S. MED1 mediates androgen receptor splice variant induced gene expression in the absence of ligand. Oncotarget 2015, 6, 288–304. [Google Scholar] [CrossRef] [PubMed]
  32. Takahashi, Y.; Ishii, Y.; Nishida, Y.; Ikarashi, M.; Nagata, T.; Nakamura, T.; Yamamori, S.; Asai, S. Detection of aberrations of ubiquitin-conjugating enzyme E2C gene (UBE2C) in advanced colon cancer with liver metastases by DNA microarray and two-color fish. Cancer Genet. Cytogenet. 2006, 168, 30–35. [Google Scholar] [CrossRef] [PubMed]
  33. Lee, J.J.; Au, A.Y.; Foukakis, T.; Barbaro, M.; Kiss, N.; Clifton-Bligh, R.; Staaf, J.; Borg, A.; Delbridge, L.; Robinson, B.G.; et al. Array-CGH identifies cyclin D1 and UBCH10 amplicons in anaplastic thyroid carcinoma. Endocr. Relat. Cancer 2008, 15, 801–815. [Google Scholar] [CrossRef] [PubMed]
  34. Tzelepi, V.; Zhang, J.; Lu, J.F.; Kleb, B.; Wu, G.; Wan, X.; Hoang, A.; Efstathiou, E.; Sircar, K.; Navone, N.M.; et al. Modeling a lethal prostate cancer variant with small-cell carcinoma features. Clin. Cancer Res. 2012, 18, 666–677. [Google Scholar] [CrossRef] [PubMed]
  35. Sakai, N.; Kajiyama, Y.; Iwanuma, Y.; Tomita, N.; Amano, T.; Isayama, F.; Ouchi, K.; Tsurumaru, M. Study of abnormal chromosome regions in esophageal squamous cell carcinoma by comparative genomic hybridization: Relationship of lymph node metastasis and distant metastasis to selected abnormal regions. Dis. Esophagus 2010, 23, 415–421. [Google Scholar] [CrossRef] [PubMed]
  36. Chu, X.Y.; Zhu, Z.M.; Chen, L.B.; Wang, J.H.; Su, Q.S.; Yang, J.R.; Lin, Y.; Xue, L.J.; Liu, X.B.; Mo, X.B. FOXM1 expression correlates with tumor invasion and a poor prognosis of colorectal cancer. Acta Histochem. 2012, 114, 755–762. [Google Scholar] [CrossRef] [PubMed]
  37. Bellelli, R.; Castellone, M.D.; Garcia-Rostan, G.; Ugolini, C.; Nucera, C.; Sadow, P.M.; Nappi, T.C.; Salerno, P.; Cantisani, M.C.; Basolo, F.; et al. FOXM1 is a molecular determinant of the mitogenic and invasive phenotype of anaplastic thyroid carcinoma. Endocr. Relat. Cancer 2012, 19, 695–710. [Google Scholar] [CrossRef] [PubMed]
  38. Cai, Y.; Balli, D.; Ustiyan, V.; Fulford, L.; Hiller, A.; Misetic, V.; Zhang, Y.; Paluch, A.M.; Waltz, S.E.; Kasper, S.; et al. FOXM1 expression in prostate epithelial cells is essential for prostate carcinogenesis. J. Biol. Chem. 2013, 288, 22527–22541. [Google Scholar] [CrossRef] [PubMed]
  39. Jiang, L.; Wang, P.; Chen, H. Overexpression of FOXM1 is associated with metastases of nasopharyngeal carcinoma. Ups. J. Med. Sci. 2014, 119, 324–332. [Google Scholar] [CrossRef] [PubMed]
  40. Francis, R.E.; Myatt, S.S.; Krol, J.; Hartman, J.; Peck, B.; McGovern, U.B.; Wang, J.; Guest, S.K.; Filipovic, A.; Gojis, O.; et al. FOXM1 is a downstream target and marker of HER2 overexpression in breast cancer. Int. J. Oncol. 2009, 35, 57–68. [Google Scholar] [PubMed]
  41. Berlingieri, M.T.; Pallante, P.; Guida, M.; Nappi, C.; Masciullo, V.; Scambia, G.; Ferraro, A.; Leone, V.; Sboner, A.; Barbareschi, M.; et al. UbcH10 expression may be a useful tool in the prognosis of ovarian carcinomas. Oncogene 2007, 26, 2136–2140. [Google Scholar] [CrossRef] [PubMed]
  42. Millour, J.; de Olano, N.; Horimoto, Y.; Monteiro, L.J.; Langer, J.K.; Aligue, R.; Hajji, N.; Lam, E.W. ATM and p53 regulate FOXM1 expression via E2F in breast cancer epirubicin treatment and resistance. Mol. Cancer Ther. 2011, 10, 1046–1058. [Google Scholar] [CrossRef] [PubMed]
  43. Olivier, M.; Eeles, R.; Hollstein, M.; Khan, M.A.; Harris, C.C.; Hainaut, P. The IARC TP53 database: New online mutation analysis and recommendations to users. Hum. Mutat. 2002, 19, 607–614. [Google Scholar] [CrossRef] [PubMed]
  44. Cancer Genome Atlas Research Network; Analysis Working Group: Asan University; BC Cancer Agency; Brigham and Women’s Hospital; Broad Institute; Brown University; Case Western Reserve University; Dana-Farber Cancer Institute; Duke University; Greater Poland Cancer Centre; et al. Integrated genomic characterization of oesophageal carcinoma. Nature 2017, 541, 169–175. [Google Scholar] [CrossRef]
  45. Mandard, A.M.; Hainaut, P.; Hollstein, M. Genetic steps in the development of squamous cell carcinoma of the esophagus. Mutat. Res. 2000, 462, 335–342. [Google Scholar] [CrossRef]
Figure 1. FOXM1 and UBE2C gene expressions are correlated in human healthy tissues: (A) FOXM1 and UBE2C show a similar expression profile in several distinct human healthy tissues; (B) Correlation analysis between FOXM1 and UBE2C expressions was performed using gene expression data of samples from 27 human healthy tissues using SRA data, bioproject PRJEB4337. Only testis showed a discrepant expression profile. p value < 0.05; r: Spearman’s rank correlation coefficient; p: Spearman’s rank correlation p value; CI: confidence interval.
Genes 09 00188 g001
Figure 2. FOXM1 and UBE2C expressions are co-upregulated in cancer. Correlation analysis of FOXM1 protein and UBE2C gene expression from TCGA deposited data of different tumor types. A significant positive correlation between FOXM1 and UBE2C was observed in 77 ESCC (A); 48 esophageal adenocarcinomas (EAC) (B); 887 breast cancer samples (C); 340 bladder urothelial carcinomas (D); 360 lung adenocarcinomas (E); and 336 stomach adenocarcinomas (F). r: Spearman’s rank correlation coefficient; p: Spearman’s rank correlation p value; CI: confidence interval; RPPA: Reverse phase protein array units; RSEM: RNA-Seq by Expectation Maximization unit.
Genes 09 00188 g002
Figure 3. FOXM1 and UBE2C expressions are upregulated in ESCC. (A) FOXM1 and UBE2C expression profile in 52 paired ESCC samples, assessed by RT-qPCR; (B) Positive correlation observed between the expression of these two genes in the tumor samples analyzed; (CE) Correlation analysis of FOXM1, UBE2C and FOXO3 (a functional antagonist of FOXM1) expressions was performed using gene expression data of 95 esophageal squamous cell carcinoma (ESCC) samples deposited into TCGA provisional database; (C) Positive correlation between FOXM1 and UBE2C expressions; (D) Lack of correlation between FOXM1 and FOXO3 expressions; (E) Inverse correlation between UBE2C and FOXO3 expressions. * p value < 0.05; r: Spearman’s rank correlation coefficient; p: Spearman’s rank correlation p value; CI: confidence interval.
Genes 09 00188 g003
Figure 4. FOXM1 binds to UBE2C promoter region. Re-analysis of FOXM1 ChIP-seq data available in ENCODE-USCC platform. FOXM1 chromatin immunoprecipitation was performed in three different human cancer-derived cell lines: MCF-7 (breast cancer derived), ECC1 (endometrial adenocarcinoma derived) and SKSH (neuroblastoma derived), and the presence of DNA peaks were evaluated in UBE2C (A); PLK1 (B) and KRT1 (C) promoter regions; (A) DNA peaks were detected in the region corresponding to UBE2C promoter, following FOXM1 immunoprecipitation, in the three cell lines investigated; (B) DNA peaks were also detected in the region corresponding to PLK1 promoter, evaluated as a positive control for FOXM1 binding; (C) Absence of DNA peaks in the region comprising KRT1 promoter, evaluated as a negative control for FOXM1 binding.
Genes 09 00188 g004
Figure 5. FOXM1 transcriptionally activates UBE2C in the ESCC cell line TE-1. (A) Schematic representation of the FOXM1 putative response elements position in the 5′ regulatory region of UBE2C. Black arrow represents the transcriptional start site (TSS) of UBE2C. The putative response elements described are located about −31, −290 and −590 bases upstream of the transcription initiation site and the red frame shows the region encompassed by the primers used to amplify UBE2C promoter following FOXM1 immunoprecipitation in TE-1 cell line; (B) ChIP assay in the ESCC cell line TE-1 transfect both with FOXM1 induction expression vector (pcDNA3-FOXM1) and empty vector (pcDNA3). Cross-linked chromatin was immunoprecipitated with anti-FOXM1 antibody (IP:FOXM1) or with anti-histone H3 antibody (IP:Histone H3), used as a positive control, or with anti-normal rabbit IgG antibody (IP:IgG), used as a negative control. Following FOXM1 immunoprecipitation, purified DNA was analyzed by qPCR, using specific primers for −31 to −153 bases of UBE2C promoter region encompassing FOXM1 putative response element (FKHD-1). The amount of immunoprecipitated DNA in each sample is represented as a signal relative to the total amount of input DNA. Values are shown as triplicate of the qPCR experiment ± SD; (C) In addition, a representative gel image of ChIP results is presented. Ctrl-: PCR negative control; MW—molecular weight (lower marker 100 bases pairs); Black arrow indicates the expected amplified fragment (112 base pairs); (D) FOXM1 binding onto PLK1 promoter was used as positive binding control. The amount of immunoprecipitated DNA in each sample is represented as a signal relative to the total amount of input DNA. Values are shown as triplicate of the qPCR experiment ± SD (E) TE-1 cells were co-transfected with UBE2C-luciferase reporter (comprising FKHD1 and FKHD2) and increasing amounts of either FOXM1 expression vector (pcDNA3—FOXM1) or the control (empty) vector pcDNA3 (Ø) and the luciferase assay was performed; (F) The ESCC cell line TE-1 was transfected with 1.0 μg of DNA of a FOXM1 expression vector (pcDNA3—FOXM1) or with an empty vector (pCDNA3-empty), used as control (Ø) and, then, FOXM1 and UBE2C protein levels were analyzed by Western blotting, using tubulin as loading control. The dotted lines delineated the bands selected from the western blotting analysis, according to the molecular weight of the protein investigated. * p value < 0.05.
Genes 09 00188 g005
Table 1. Correlation between forkhead box protein M1(FOXM1) and ubiquitin conjugating enzyme E2 (UBE2C) gene expression in several different human tumors.
TumorNumber of SamplesSpearman rp Value
Acute myeloid Leukemia1970.7<0.0001
Adrenocortical carcinoma920.87<0.0001
Bladder urothelial carcinoma4130.63<0.0001
Brain low grade glioma5300.94<0.0001
Breast cancer invasive11000.85<0.0001
Cholangiocarcinoma350.79<0.0001
Colorectal adenocarcinoma3820.47<0.0001
Glioblastoma multiforme1660.71<0.0001
Hepatocellular carcinoma3730.82<0.0001
Head and Neck Squamous cell carcinoma5220.46<0.0001
Kidney renal clear cell carcinoma5340.84<0.0001
Lung adenocarcinoma5170.78<0.0001
Lung squamous cell carcinoma1770.38<0.0001
Lymphoid neoplasm diffuse large B-cell lymphoma280.29 *0.0389 *
Mesothelioma860.83<0.0001
Ovarian serous cystadenocarcinoma3070.58<0.0001
Pancreatic adenocarcinoma1790.81<0.0001
Pheochromocytoma and paraganglioma1840.8<0.0001
Sarcoma2620.77<0.0001
Skin cutaneous melanoma4710.74<0.0001
Stomach adenocarcinoma4150.6<0.0001
Testicular germ cell cancer1560.62<0.0001
Thymoma1200.77<0.0001
Thyroid carcinoma5090.79<0.0001
Uterine corpus endometrial carcinoma1770.52<0.0001
Uveal melanoma800.9<0.0001
Results generated by analyzing expression data deposited into TCGA database. r—Correlation coefficient; * Pearson correlation analysis.

