Human Age Prediction Based on DNA Methylation Using a Gradient Boosting Regressor


1
Department of Information and Computer Science, University of Science and Technology Beijing, Beijing 100083, China
2
Beijing Key Laboratory for Magneto-photoelectrical Composites and Interface Science, University of Science and Technology Beijing, Beijing 100083, China
*
Author to whom correspondence should be addressed.
Genes 2018, 9(9), 424; https://doi.org/10.3390/genes9090424
Submission received: 26 June 2018
/
Revised: 15 August 2018
/
Accepted: 16 August 2018
/
Published: 21 August 2018
(This article belongs to the Section Technologies and Resources for Genetics)
Abstract
:All tissues of organisms will become old as time goes on. In recent years, epigenetic investigations have found that there is a close correlation between DNA methylation and aging. With the development of DNA methylation research, a quantitative statistical relationship between DNA methylation and different ages was established based on the change rule of methylation with age, it is then possible to predict the age of individuals. All the data in this work were retrieved from the Illumina HumanMethylation BeadChip platform (27K or 450K). We analyzed 16 sets of healthy samples and 9 sets of diseased samples. The healthy samples included a total of 1899 publicly available blood samples (0–103 years old) and the diseased samples included 2395 blood samples. Six age-related CpG sites were selected through calculating Pearson correlation coefficients between age and DNA methylation values. We built a gradient boosting regressor model for these age-related CpG sites. 70% of the data was randomly selected as training data and the other 30% as independent data in each dataset for 25 runs in total. In the training dataset, the healthy samples showed that the correlation between predicted age and DNA methylation was 0.97, and the mean absolute deviation (MAD) was 2.72 years. In the independent dataset, the MAD was 4.06 years. The proposed model was further tested using the diseased samples. The MAD was 5.44 years for the training dataset and 7.08 years for the independent dataset. Furthermore, our model worked well when it was applied to saliva samples. These results illustrated that the age prediction based on six DNA methylation markers is very effective using the gradient boosting regressor.
1. Introduction
Aging is an irreversible natural process in human life which is influenced by many factors, such as genetic factors, living environment and diseases [1,2]. Aging can be modified and regulated by various mechanisms at a molecular level, such as oxidative damage of DNA, chemical modification on DNA, and shortened and dysfunctional telomeres [3]. Although many methods have been used to estimate individual age, the problems of low sensitivity and prediction accuracy still to be improved [4,5,6,7]. Recent studies have shown that human aging is related to the alteration of DNA methylation in genome specific locations, and these epigenetic modifications can be used to estimate the individual age [8,9].
DNA methylation (DNAm) refers to the chemical modification process which transfers the active methyl to the specific base on the DNA chain under the catalysis of DNA methyltransferase (DNMT) [10]. DNA methylation can occur at the N-6 position of adenine, N-7 position of guanine, C-5 position of cytosine and so on. However, in the mammalian genome, DNA methylation often occurs on C (cytosine) of 5’-CpG-3’ to generate 5-methyldeoxycytidine (5mC). Due to the close relationship between DNA methylation and human development, tumor diseases, especially the transcriptional inactivation of tumor suppressor genes induced by CpG island methylation, DNA methylation has become an important research topic in epigenetics and epigenomics. DNA methylation is actually an epigenetic modification that plays an important modulation role in individual growth, development, gene expression patterns and the stability of the genome without changing DNA sequences [11]. In addition, this modification can be steadily transmitted in the process of development and cell proliferation [12]. Some studies have shown that the level of DNA methylation is closely related to age. With age, the DNA methylation level of the global genome is decreasing [13,14,15]. It has been reported that 5mC is increased with age in some specific CpG sites, whereas at other CpG sites, the level of 5mC decreases with age [16,17]. For some CpG sites, the degree of DNA methylation is closely related to aging, therefore it can be used for age prediction [8,18,19,20,21,22].
In the past, an individual’s age could be predicted by measuring and analyzing skeletal markers such as bones and teeth [23,24]. This method is limited to the existence of the skeleton. In molecular biology, DNA damage, mitochondrial mutations, and the length of leukocyte telomere are related to aging, and can also be used to predict age [25,26]. However, these methods are less accurate or are technically difficult. Furthermore, in most crime scenes, the perpetrators have fled after the crime, with only piecemeal remains such as blood, saliva or semen to be found. Therefore, it is imperative to find other feasible methods for the prediction of individual age. It has long been known that the aging process can cause changes in the molecular level of tissues and organs. It has not been found until recently that changes in DNA methylation can be used to predict age. Some reports have translated age-related DNA methylation into an age prediction model to reveal individual age [8,18,20,27,28,29]. For example, Yi et al. reported a multiple linear regression to predict age in blood samples in 2014 [30]. The model showed that the average difference between predicted age and actual age was around 4 years. Zbiec-Piekarska et al. analyzed the CpG sites in blood and built a multiple linear regression model in 2015 [31]. Based on a combination of five DNA methylation markers, the mean absolute deviation (MAD) of prediction age was 3.9 years. Huang et al. selected five age-related CpG sites from 38 candidate markers by pyrosequencing and established a linear regression model to predict age in 2015 [32]. The accuracy of their model was slightly lower, and the MAD was 7.986 years. Park et al. selected three CpG sites and used DNA methylation markers in blood from the Asian population to predict age in 2016 [33]. They identified a root mean square error (RMSE) of 6.320 years and an MAD of 3.156 years. In addition, Hannum et al. established a quantitative model with 71 highly age-related markers in 2013 [19]. The correlation coefficient between the true age and the predicted age was 0.96, and the average error was 3.9 years. However, most of these studies were based on biological experiments to identify sites. They are time-consuming and complicated to operate. Therefore, it is necessary to develop a computational method to select the candidate CpG sites. Existing models primarily use linear regression models to interpret the complex relationship between DNA methylation and age [8,30,32]. For a limited number of CpG sites, it is necessary to find a reliable age prediction model to improve the accuracy. In this study, we adopted a gradient boosting regressor to predict age, and its results were better than the existing methods.
2. Materials and Methods
2.1. Data Collection and Processing
In this study, we obtained dozens of blood datasets from the National Center for Biotechnology Information (NCBI) Gene Expression Omnibus (GEO) (https://www.ncbi.nlm.nih.gov/geo/query/acc.cgi). All of these DNA methylation data were retrieved from two platforms, HumanMethylation27 BeadChip and HumanMethylation450 BeadChip. Some of the GEO datasets contained ethnicity information: GSE36064 (Caucasian, Chinese, and African American), GSE40279 (Caucasian, European), GSE65638 (Chinese), GSE51032 (Italycohort), GSE41169 (Dutch population), GSE27317 (African-American, Caucasian and other), GSE34257 (Gambian), GSE37008 (European, Caucasian or other ethnicity), GSE41037 (Dutch population). The datasets that did not provide the age of individuals were excluded. Finally, 25 complete datasets were obtained, of which 16 were healthy and 9 were disease datasets. The diseases which affect the DNA methylation will lead to bias in age prediction. So we divided the datasets into two categories. One was the healthy datasets (Table 1) and the other was the disease datasets (Table 2). To illustrate the performance of our model, we randomly divided each dataset into training and independent in a ratio of 7:3. The training dataset for each divided data is combined into one piece, and so is the independent dataset. A total of 1899 healthy individuals from different race backgrounds with ages between 0 and 103 years were divided into 1322 training samples and 577 independent samples. The 9 disease datasets were divided into 1673 training samples and 722 independent samples.
2.2. Methylation Quality Control
To explain the common experimental biases and perform quality control analysis on DNA methylation datasets, we used principal component analysis (PCA) to identify and remove abnormal samples. To do this we used MATLAB R2014b software (v8.4.0.150421 win64) for processing. First of all, we standardized each dataset, then performed principal component analysis and extracted the first two principal components, and finally made a cluster diagram. Samples outside the circle with a radius of five were defined at outliers and removed, this filtering procedure was iteratively executed until no samples were determined to be outliers. A total of 22 healthy samples were removed and 23 disease samples were removed.
2.3. Selection of Age-Related CpG Sites
For each CpG site, the value indicates the percentage of methylation. The value of the site is equal to one if it is fully methylated, and zero if it is completely unmethylated. There are batch effects between different data platforms. This batch effect can be partially overcome by Z-score conversion, so we used Z-score to normalize the methylation levels between different datasets to avoid obvious batch effects and used the normalized methylation values for age prediction analysis (This used the IBM SPSS v.22 software processing.) Therefore, all the DNA methylation values used the normalized values. To identify age-related DNA methylation markers, we calculated Pearson correlations between age and DNA methylation value of each CpG site for every dataset from 1 to 103 years old (because Pearson correlation cannot be calculated for the datasets where objects have the same age). According to the Pearson correlation analysis, we chose the highly age-related r values (including positive and negative correlations) in each dataset and calculated the overlapping sites selected in each dataset. Finally, seven sites with high repetition frequency were selected. These sites were cg22736354, cg06493994, cg02228185, cg09809672, cg19761273, cg01820374 and cg19283806. Some datasets did not contain cg19283806, so it was rejected. To select the appropriate number of these sites for age prediction, we used stepwise forward to select variables and got the sequential results about the importance of markers (cg09809672, cg02228185, cg01820374, cg22736354, cg06493994, cg19761273). For this type of analysis, the markers were added to the age prediction model one by one [3]. It has been shown that the combination of these six markers had the highest accuracy. Finally, six age-related hypomethylated or hypermethylated CpG sites were determined (Table 3). Among them, cg22736354 and cg06493994 were positively correlated with age. However, cg02228185, cg09809672, cg19761273 and cg01820374 were negatively correlated with age. This is consistent with the results of Horvath’s research report [20]. To analyze the robustness of the six CpG sites, we split the data for 450K and 27K, and obtained the same sites in the 27K data. Similar results were not obtained at 450K, which may be due to 450K have relatively less data (only 5 datasets), but the selected six CpG sites had good prediction ability in subsequent prediction.
2.4. Algorithm
In recent years, age prediction models in blood based on a small number of CpG sites have been studied [9,27,34]. Other tissues, such as saliva [18,35], semen [36] and teeth [37] have been investigated, too. Most of these models are linear regression models. However, it is impossible to clarify the complex relationship between DNA methylation and age using a simple linear model. To minimize the prediction error and improve the accuracy of the model, the gradient boosting regressor (GBR) model has been utilized [38]. GBR is an integrated model with higher performance and better stability. Friedman proposed the GBR algorithm that extends the boosting algorithm in order to solve the regression problem. The algorithm uses the negative gradients of the loss function to solve the minimum value. GBR has been widely used in biological research, which can handle unclean and noisy data well, support different loss function, and has strong predictive ability for nonlinear data [38]. The gradient boosting regressor algorithm was executed with the sklearn package (October 2017. scikit-learn 0.19.1). It avoids the overfitting problem in decision tree learning by stopping tree growth as early as possible. The parameters of GBR are loss = ‘lad’, learning_rate = 0.03, n_estimators = 300, subsample = 0.6, λ = 0.6, min_samples_spli = 2, max_depth = 4, verbose = 1, warm_start = True. The parameters of Support Vector Regression (SVR) are kernel = ‘rbf’, degree = 3, coef = 0.0, tol = 0.001, C = 1.0, ε = 0.1. The parameters of BayesianRidge are n_iter = 300, tol = 0.001, .
2.5. Statistical Measurements
In the age prediction model, we used 1899 samples from different races and evaluated the age prediction model by calculating the MAD. The MAD is the mean absolute deviation between the predicted age and the actual age. The degree of correlation between predicted age and true age is measured by calculating . All statistical analyses were done using Python 3.6 programming. They are defined as below:
where m denotes the number of target values is the prediction value, and represents the regression function for feature vector The MAD denotes mean absolute deviation, MSE (mean square error), and RMSE (root mean square error).
3. Results
3.1. Healthy Blood Data Results
To verify the accuracy of the GBR model, three other models—BayesianRidge, Multiple Linear Regression (MLR) and SVR—were also executed. The results showed that the correlation between age and DNA methylation was 0.97 for the gradient boosting regressor, with RMSE and MAD being 4.55 and 2.72 years, respectively (Figure 1a). The RMSE and MAD were 12.58 and 10.26 years for BayesianRidge (Figure 1b), 7.75 and 5.13 years for Support Vector Regression (Figure 1c), 12.58 and 10.24 years for multiple linear regression (Figure 1d). For the independent datasets of 583 samples, the MAD was 4.06 years for gradient boosting regressor (Figure 2a), 10.56 years for BayesianRidge (Figure 2b), 5.93 years for Support Vector Regression (Figure 2c), and 10.55 years for multiple linear regression (Figure 2d). The detailed results are shown in Table 4. All the values were identified on the same CpG sites. The results showed that the prediction accuracy of the gradient boosting regressor was better than those of other linear regression models.
3.2. Disease Blood Data Results
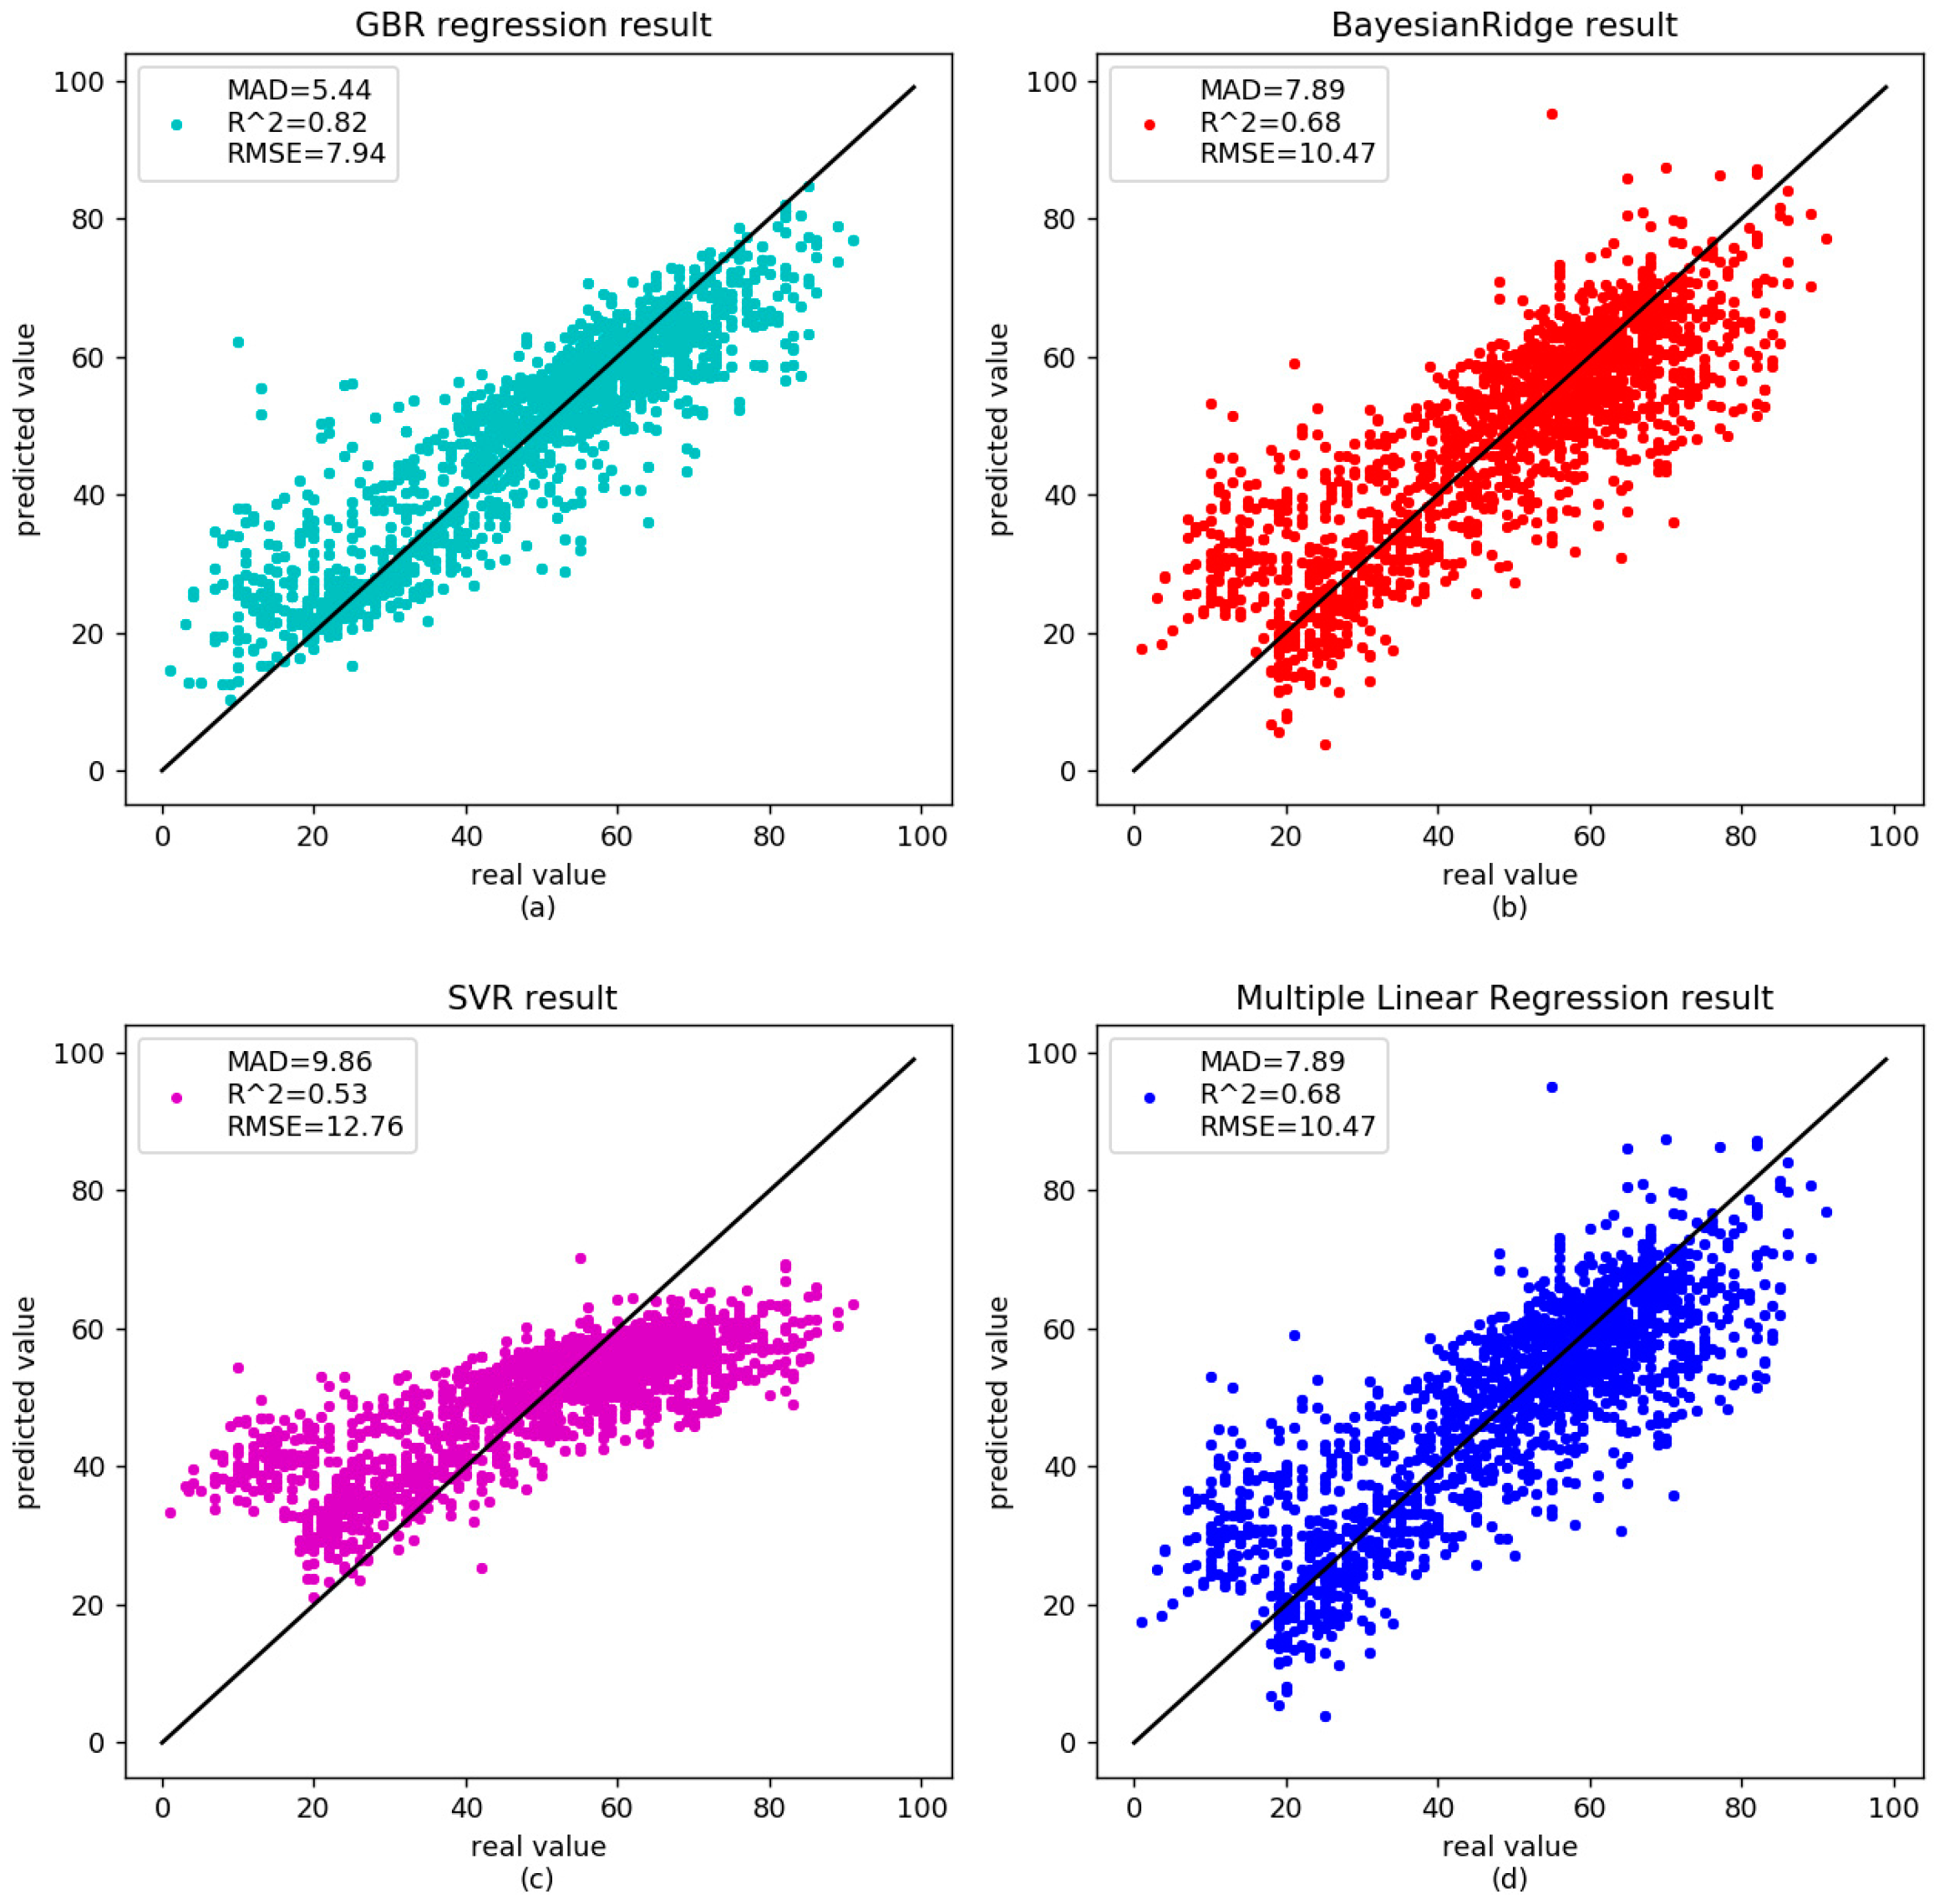
There was no significant correlation between age-related methylation and sex or race [3]; however, some genes were associated with age-related diseases, such as cancer, Alzheimer’s, and so on. DNA methylation will be disordered in these diseases. Horvath et al. reported that the predicted age in cancer was poorly correlated with patient ages [20]. Park et al. found the correlation between age and methylation of three CpG sites in patients with acute myeloid leukemia (AML) disappeared [33]. Alzheimer’s disease is also known as senile dementia. The degree of methylation in the promotor region of amyloid preprotein gene declined with age in the patients [39,40]. We analyzed nine diseased samples in Table 2 to further validate the proposed GBR. The correlation between age and DNA methylation was 0.83 in our GBR. The RMSE and MAD were 7.81 and 5.91 years, respectively (Figure 3a). For the independent set, the MAD was 6.99 years (Figure 4a). The results of other models are shown in Table 5. As shown in the Table 5, the diseases affect the age prediction based on DNA methylation. However, GBR still performed well in these disease samples.
We predicted the age per disease group to see whether there would be a systematic difference between predicted age and chronological age. For this purpose, we analyzed each diseased sample. The obtained MAD for each disease was as follows: ovarian cancer was 5.91 years; type 1 diabetes mellitus (DM) was 5.33 years; Crohn’s disease or ulcerative colitis was 5.15 years; head and neck squamous cell carcinoma (HNSCC) was 7.04 years; schizophrenia was 4.54 years; rheumatoid arthritis was 4.45 years; breast cancer, colorectal cancer and other primary cancers was 6.51 years; and neurodegenerative tauopathy was 3.95 years. Neurodegenerative tauopathy and schizophrenia showed the lowest age prediction error, while HNSCC demonstrated the lowest correlation with age. All these suggest that age-related DNA methylation is accelerated in these diseases, so there would not be a systematic difference between predicted age and true age.
3.3. Application of the Technique to Saliva
Some studies have shown that the pattern of DNA methylation is tissue-specific [41]. Koch et al. pointed out that it was difficult to define common markers that displayed general accuracy of prediction in a variety of tissues [42]. However, methylation of certain CpG sites is not always associated with tissue specificity [43]. To test the robustness of our selected age-related CpG sites when applied to the body fluids other than the blood, we studied the methylation data of 278 saliva samples (see the Supplementary S1). The methylation values of the selected 6 CpG sites were collected from a total of 278 individuals with aged between 21 to 55 years, and 196 samples were used to train the GBR model and 82 samples were used in the independent group. The results showed that the correlation coefficient between predicted age and real age was 0.85, and the MAD was 2.1 years (training) and 5.3 years (independent). The other model results are shown in the Table 6.
To assess the performance of the GBR model, we also compared it to other studies. Bocklandt et al. identified 88 CpG sites in 80 genes [18]. Using a multiple linear regression model, the correlation coefficient between age and DNA methylation was 0.73, and the average error was 5.2 years. Using the same data (GSE28746), which included 84 individuals, the selected six sites in this work were used. The correlation coefficient between age and DNA methylation is 0.58, and the average error is 3.76 years, which is more accurate than Bocklandt’s multiple linear regression (Table 7). These results highlight the robustness of GBR model on non-blood tissue.
3.4. Analysis of the Selected Six CpG Sites
In the existing studies, the ranking of age-related CpG sites is quite different. This is probably due to the difference in age range, methods and statistical techniques (the age range is shown in Figure 5). Furthermore, there is almost no overlap in calculating DNAm-based age prediction factors for different tissues. The six CpG loci extracted from the blood data can be applied to predict saliva data without any adjustment, and the prediction results are better than other predictive factors. Therefore, it is a complex task to select the CpG sites to establish the prediction age model. In this work, we selected six age-related CpG sites (AR-CpGs). These six sites are from six specific genes, including edaradd, nhlrc1, aspa, lag3, scgn and csnk1d, respectively. These special genes play important roles in regulation of developmental processes. We annotated these CpGs to their associated genes. The detailed locations of these CpGs were also included in Table 3. Two CpGs were located at the promoter region of genes (e.g., TSS1500), three were located at the first exon region and one in gene body. Meanwhile, two CpGs were located within CpG island regions, three were located at the CpG island shores, and one was far from the CpG island regulatory regions. For example, the CpG cg19761273 is located at the TSS1500 regions of the gene edaradd and overlapping with south shore of the CpG island, see Figure 6.
4. Discussion
Many bioinformatical studies have established linear regression models to study the relationship between DNA methylation and age. The reason for this is that the linear model is fast, interpretable and easy to use. However, Alisch and her colleagues et al. used non-linear models to do that in children (3–17 years old). In addition, they found that the DNA methylation did not change at a constant rate with age in life [44]. Bekaert et al. also noted that the relationship between DNA methylation and age in elovl2 was not a straight line [37], illustrating that the linear model does not always predict age very well, and that non-linear models can sometimes be a good fit. In this study, we selected six CpG sites by calculating the Pearson correlation between age and DNA methylation values. Gradient boosting regressor was adopted, which is an integrated model. It was found that the correlation between predicted age and true age was strong (). In addition, the MAD was 2.72 years. In the combined independent datasets, the MAD of age prediction was 4.06 years. The MAD value was lower than those of the other three models. This indicates that the GBR is a more suitable model for age prediction.
Studies have shown that the level of DNA methylation is closely related to age, where most CpGs from CpG islands were highly hypermethylated during aging [13,45]. Here we observed that two of the CpG island sites were hyper-methylated, while the remaining ones showed hypo-methylation with aging, with none of them being present at CpG islands. Previous studies have shown there was no strong evidence showing DNA methylation was strongly associated with known aging-related mechanisms, but the aging-associated CpGs may represent a set of biomarkers for predicting the cellular chronological clock [3,8,46]. Specifically, we noted that majority of the genes were not presented in the previously reported genes whose expression changes with aging [46,47], but all 6 of these genes were involved in age-related processes. All CpG sites showing close correlation with age belong to genes involved in age-related processes. Here are a few examples. edaradd was identified by its association with ectodermal dysplasia, and specifically with hypohidrotic ectodermal dysplasia, a genetic disorder characterized by defective development of hair, teeth, and eccrine sweat glands [48]. The nhlrc1 gene provides instructions for making a protein called malin. Although this protein is active in cells throughout the body, it appears to play a critical role in the survival of nerve cells (neurons) in the brain. The aspa gene provides instructions for making an enzyme called aspartoacylase. In the brain, this enzyme breaks down a compound called N-acetyl-L-aspartic acid (NAA) into aspartic acid (an amino acid which is a building block for many proteins) and another molecule called acetic acid. LAG3’s main ligand is MHC class II, to which it binds with higher affinity than CD4 [49]. The protein negatively regulates cellular proliferation, activation, and homeostasis of T cells, in a similar fashion to CTLA-4 and PD-1 [50,51] and has been reported to play a role in Treg suppressive function [52]. LAG3 also helps maintain CD8+ T cells in a tolerogenic state [53] and, working with PD-1, helps maintain CD8 exhaustion during chronic viral infection [54]. LAG3 is known to be involved in the maturation and activation of dendritic cells [55]. SCGN is a secreted calcium-binding protein which is found in the cytoplasm. It is related to calbindin D-28K and calretinin. This protein is thought to be involved in potassium chloride-stimulated calcium flux and cell proliferation [56]. The csnk1d gene encodes the casein kinase I isoform delta enzyme in humans [57]. This gene is a member of the casein kinase I (CKI) gene family whose members have been implicated in the control of cytoplasmic and nuclear processes, including DNA replication and repair. Interestingly, gene expressions of the selected hypo-methylated genes aspa and csnk1d were reported to be positively associated with aging [58,59], which implied potentially inverse correlations between the methylation level and the expression level to those usually occurring in promoter regions. Taken together, these genes have an important influence on the development, and their methylation could play vital roles in the regulation of aging.
Of course, our research also has some limitations. Firstly, we did not consider the impact of gender on age prediction. Some researchers have reported that age-related methylation may be different in gender [1]. However, in Bram’s study, there was no significant difference in age-related methylation level between males and females [37]. Secondly, because data on other tissues is limited, we only studied blood tissue. Each tissue has a different methylation pattern, and there is a specific methylation change during aging [60]. If more age-related methylation sites can be found in different tissues, the available methylation indicators for age prediction will be enormous. Undoubtedly, the combination of multiple age-related methylated markers will contribute to accurately estimating age.
5. Conclusions
Age prediction based on DNA methylation is a rapidly evolving field of epigenetics, and it has great potential to provide accurate results. In this study, we selected six highly age-related CpG sites through calculating person correlation between age and DNA methylation value of each CpG site. By comparing the prediction effects of GBR with other linear methods, the results showed that GBR has a better prediction accuracy for blood samples. In healthy datasets, the MAD was 2.72 years for the training set and 4.06 years for the independent set. Furthermore, the age-related DNA methylation was associated with the specifically age-related diseases. The MAD clearly increased on the disease data, which was 5.44 years in the training set and 7.08 years in the independent set. GBR also achieved good results in saliva.
Supplementary Materials
The following are available online at https://www.mdpi.com/2073-4425/9/9/424/s1, Supplementary S1: The 278 saliva samples.
Author Contributions
Y.X. designed and supervised experiments. X.L. performed the data analysis. Y.X., W.L. and X.L. wrote the manuscript.
Funding
This research was funded by the National Natural Science Foundation grant number No.11671032, No. 61370131 and the Fundamental Research Funds for the Central Universities (No. FRF-TP-17-024A2).
Conflicts of Interest
The authors declare no competing conflict of interests. This research does not involve Human Participants or Animals.
References
- Zaghlool, S.B.; Al-Shafai, M.; Al Muftah, W.A.; Kumar, P.; Falchi, M.; Suhre, K. Association of DNA methylation with age, gender, and smoking in an Arab population. Clin. Epigenetics 2015, 7, 1–12. [Google Scholar] [CrossRef] [PubMed] [Green Version]
- Din, S.D.; Godfrey, A.; Galna, B.; Lord, S.; Rochester, L. Free-living gait characteristics in ageing and Parkinson’s disease: impact of environment and ambulatory bout length. J. Neuroeng. Rehabil. 2016, 13, 46. [Google Scholar] [CrossRef] [PubMed]
- Vidaki, A.; Ballard, D.; Aliferi, A.; Miller, T.H.; Barron, L.P.; Court, S.D. DNA methylation-based forensic age prediction using artificial neural networks and next generation sequencing. Forensic. Sci. Int. Genet. 2017, 28, 225–236. [Google Scholar] [CrossRef] [PubMed]
- Blasco, M.A. Telomeres and human disease: Ageing, cancer and beyond. Nat. Rev. Genet. 2005, 6, 611–622. [Google Scholar] [CrossRef] [PubMed]
- Harley, C.B.; Futcher, A.B.; Greider, C.W. Telomeres shorten during ageing of human fibroblasts. Nature 1990, 345, 458–460. [Google Scholar] [CrossRef] [PubMed]
- Fraser, H.B.; Khaitovih, P.; Plotkin, J.B.; Pääbo, S.; Eisen, M.B. Aging and Gene Expression in the Primate Brain. PLoS Biol. 2005, 3, e274. [Google Scholar] [CrossRef] [PubMed] [Green Version]
- Zahn, J.M.; Poosala, S.; Owen, A.B.; Ingram, D.K.; Lustig, A.; Carter, A.; Weeraratna, A.T.; Taub, D.D.; Gorospe, M.; Mazan-Mamczarz, K.; et al. AGEMAP: A Gene Expression Database for Aging in Mice. PLoS Genet. 2007, 3, e201. [Google Scholar] [CrossRef] [PubMed]
- Weidner, C.I.; Lin, Q.; Koch, C.M.; Eisele, L.; Beier, F.; Ziegler, P.; Bauerschlag, D.O.; Jöckel, K.-H.; Erbel, R.; Mühleisen, T.W.; et al. Aging of blood can be tracked by DNA methylation changes at just three CpG sites. Genome Biol. 2014, 15, R24. [Google Scholar] [CrossRef] [PubMed] [Green Version]
- Yi, S.H.; Jia, Y.S.; Mei, K.; Yang, R.Z.; Huang, D.X. Age-related DNA methylation changes for forensic age-prediction. Int. J. Legal Med. 2015, 129, 237–244. [Google Scholar] [CrossRef] [PubMed]
- Moore, L.D.; Le, T.; Fan, G. DNA Methylation and Its Basic Function. Neuropsychopharmacol. Off. Publ. Am. Coll. Neuropsychopharmacol. 2013, 38, 23–38. [Google Scholar] [CrossRef] [PubMed]
- Wagner, J.R.; Busche, S.; Ge, B.; Kwan, T.; Pastinen, T.; Blanchette, M. The relationship between DNA methylation, genetic and expression inter-individual variation in untransformed human fibroblasts. Genome Biol. 2014, 15, R37. [Google Scholar] [CrossRef] [PubMed]
- Maegawa, S.; Lu, Y.; Tahara, T.; Lee, J.T.; Madzo, J.; Liang, S.; Jelinek, J.; Colman, R.J.; Issa, J.J. Caloric restriction delays age-related methylation drift. Nat. Commun. 2017, 8, 539. [Google Scholar] [CrossRef] [PubMed] [Green Version]
- Gentilini, D.; Mari, D.; Castaldi, D.; Remondini, D.; Ogliari, G.; Ostan, R.; Bucci, L.; Sirchia, S.M.; Tabano, S.; Cavagnini, F. Role of epigenetics in human aging and longevity: genome-wide DNA methylation profile in centenarians and centenarians’ offspring. Age 2013, 35, 1961–1973. [Google Scholar] [CrossRef] [PubMed]
- Peng, S.Y.; Jie, Z.; Tian, M.P.; Wang, Z.L.; Shen, H.Q. Determination of Global DNA Methylation in Biological Samples by Liquid Chromatography-Tandem Mass Spectrometry. Chin. J. Anal. Chem. 2012, 40, 1201–1206. [Google Scholar] [CrossRef]
- Wilson, V.L.; Smith, R.A.; Ma, S.; Cutler, R.G. Genomic 5-methyldeoxycytidine decreases with age. J. Biol. Chem. 1987, 262, 9948–9951. [Google Scholar] [PubMed]
- Beerman, I.; Bock, C.; Garrison, B.S.; Smith, Z.D.; Gu, H.; Meissner, A.; Rossi, D.J. Proliferation-Dependent Alterations of the DNA Methylation Landscape Underlie Hematopoietic Stem Cell Aging. Cell Stem Cell 2013, 12, 413–425. [Google Scholar] [CrossRef] [PubMed] [Green Version]
- Samuel, C.E. Adenosine Deaminases Acting on RNA (ADARs) and A-to-I Editing. Curr. Top. Microbiol. Immunol. 2012, 353, 35–60. [Google Scholar]
- Bocklandt, S.; Lin, W.; Sehl, M.E.; Sánchez, F.J.; Sinsheimer, J.S.; Horvath, S.; Vilain, E. Epigenetic Predictor of Age. PLoS ONE 2011, 6, e14821. [Google Scholar] [CrossRef] [PubMed]
- Hannum, G.; Guinney, J.; Zhao, L.; Zhang, L.; Hughes, G.; Sadda, S.; Klotzle, B.; Bibikova, M.; Fan, J.B.; Gao, Y. Genome-wide methylation profiles reveal quantitative views of human aging rates. Mol. Cell 2013, 49, 359–367. [Google Scholar] [CrossRef] [PubMed]
- Horvath, S. DNA methylation age of human tissues and cell types. Genome Biol. 2013, 14, R115. [Google Scholar] [CrossRef] [PubMed] [Green Version]
- Naue, J.; Hoefsloot, H.C.J.; Mook, O.R.F.; Rijlaarsdam-Hoekstra, L.; van der Zwalm, M.C.H.; Henneman, P.; Kloosterman, A.D.; Verschure, P.J. Chronological age prediction based on DNA methylation: Massive parallel sequencing and random forest regression. Forensic Sci. Int. Genet. 2017, 31, 19–28. [Google Scholar] [CrossRef] [PubMed]
- Zubakov, D.; Liu, F.; Kokmeijer, I.; Choi, Y.; van Meurs, J.B.; van IJcken, W.F.; Uitterlinden, A.G.; Hofman, A.; Broer, L.; van Duijn, C.M. Human age estimation from blood using mRNA, DNA methylation, DNA rearrangement, and telomere length. Forensic Sci. Int. Genet. 2016, 24, 33–43. [Google Scholar] [CrossRef] [PubMed]
- Olze, A.; Reisinger, W.; Geserick, G.; Schmeling, A. Age estimation of unaccompanied minors. Part II. Dental aspects. Forensic Sci. Int. 2006, 159, S65–S67. [Google Scholar] [CrossRef] [PubMed]
- Thevissen, P.W.; Kaur, J.; Willems, G. Human age estimation combining third molar and skeletal development. Int. J. Legal Med. 2012, 126, 285–292. [Google Scholar] [CrossRef] [PubMed]
- Meissner, C.; Ritz-Timme, S. Molecular pathology and age estimation. Forensic Sci. Int. 2010, 203, 34–43. [Google Scholar] [CrossRef] [PubMed]
- Williams, S.L.; Mash, D.C.; Zuchner, S.; Moraes, C.T. Somatic mtDNA mutation spectra in the aging human putamen. PLoS Genet. 2013, 9, e1003990. [Google Scholar] [CrossRef]
- Xu, C.; Qu, H.; Wang, G.; Xie, B.; Shi, Y.; Yang, Y.; Zhao, Z.; Hu, L.; Fang, X.; Yan, J. A novel strategy for forensic age prediction by DNA methylation and support vector regression model. Sci. Rep. 2015, 5, 17788. [Google Scholar] [CrossRef] [PubMed] [Green Version]
- Bell, J.T.; Tsai, P.C.; Yang, T.P.; Pidsley, R.; Nisbet, J.; Glass, D.; Mangino, M.; Zhai, G.; Zhang, F.; Valdes, A. Epigenome-Wide Scans Identify Differentially Methylated Regions for Age and Age-Related Phenotypes in a Healthy Ageing Population. PLoS Genet. 2012, 8, e1002629. [Google Scholar] [CrossRef] [PubMed] [Green Version]
- Florath, I.; Butterbach, K.; Müller, H.; Bewerunge-Hudler, M.; Brenner, H. Cross-sectional and longitudinal changes in DNA methylation with age: an epigenome-wide analysis revealing over 60 novel age-associated CpG sites. Hum. Mol. Genet. 2014, 23, 1186–1201. [Google Scholar] [CrossRef] [PubMed]
- Yi, S.H.; Xu, L.C.; Mei, K.; Yang, R.Z.; Huang, D.X. Isolation and identification of age-related DNA methylation markers for forensic age-prediction. Forensic Sci. Int. Genet. 2014, 11, 117–125. [Google Scholar] [CrossRef] [PubMed]
- Zbieć-Piekarska, R.; Spólnicka, M.; Kupiec, T.; Parys-Proszek, A.; Makowska, Ż.; Pałeczka, A.; Kucharczyk, K.; Płoski, R.; Branicki, W. Development of a forensically useful age prediction method based on DNA methylation analysis. Forensic Sci. Int. Genet. 2015, 17, 173–179. [Google Scholar] [CrossRef] [PubMed]
- Huang, Y.; Yan, J.; Hou, J.; Fu, X.; Li, L.; Hou, Y. Developing a DNA methylation assay for human age prediction in blood and bloodstain. Forensic Sci. Int. Genet. 2015, 17, 129–136. [Google Scholar] [CrossRef] [PubMed]
- Park, J.L.; Kim, J.H.; Seo, E.; Bae, D.H.; Kim, S.Y.; Lee, H.C.; Woo, K.M.; Kim, Y.S. Identification and evaluation of age-correlated DNA methylation markers for forensic use. Forensic Sci. Int. Genet. 2016, 23, 64–70. [Google Scholar] [CrossRef] [PubMed]
- Zbieć-Piekarska, R.; Spólnicka, M.; Kupiec, T.; Makowska, Ż.; Spas, A.; Parys-Proszek, A.; Kucharczyk, K.; Płoski, R.; Branicki, W. Examination of DNA methylation status of the ELOVL2 marker may be useful for human age prediction in forensic science. Forensic Sci. Int. Genet. 2015, 14, 161–167. [Google Scholar] [CrossRef] [PubMed]
- Deborah, S.B.S.S.; Antunes, J.; Balamurugan, K.; Duncan, G.; Sampaio Alho, C.; Mccord, B. Evaluation of DNA methylation markers and their potential to predict human aging. Electrophoresis 2015, 36, 1775. [Google Scholar]
- Lee, H.Y.; Jung, S.E.; Oh, Y.N.; Choi, A.; Yang, W.I.; Shin, K.J. Epigenetic age signatures in the forensically relevant body fluid of semen: a preliminary study. Forensic Sci. Int. Genet. 2015, 19, 28–34. [Google Scholar] [CrossRef] [PubMed]
- Bekaert, B.; Kamalandua, A.; Zapico, S.C.; Van de Voorde, W.; Decorte, R. Improved age determination of blood and teeth samples using a selected set of DNA methylation markers. Epigenetics 2015, 10, 922–930. [Google Scholar] [CrossRef] [PubMed] [Green Version]
- Hong, W. Wavelet Gradient Boosting Regression Method Study in Short-Term Load Forecasting. Smart Grid 2015, 5, 189–196. [Google Scholar]
- Tohgi, H.; Utsugisawa, K.; Nagane, Y.; Yoshimura, M.; Genda, Y.; Ukitsu, M. Reduction with age in methylcytosine in the promoter region −224~−101 of the amyloid precursor protein gene in autopsy human cortex. Mol. Brain Res. 1999, 70, 288–292. [Google Scholar] [CrossRef]
- Podtelezhnikov, A.A.; Tanis, K.Q.; Nebozhyn, M.; Ray, W.J.; Stone, D.J.; Loboda, A.P. Molecular insights into the pathogenesis of Alzheimer’s disease and its relationship to normal aging. PLoS ONE 2011, 6, e29610. [Google Scholar] [CrossRef] [PubMed]
- Christensen, B.C.; Houseman, E.A.; Marsit, C.J.; Zheng, S.; Wrensch, M.R.; Wiemels, J.L.; Nelson, H.H.; Karagas, M.R.; Padbury, J.F.; Bueno, R. Aging and Environmental Exposures Alter Tissue-Specific DNA Methylation Dependent upon CpG Island Context. PLoS Genet. 2009, 5, e1000602. [Google Scholar] [CrossRef] [PubMed] [Green Version]
- Koch, C.M.; Wolfgang, W. Epigenetic-aging-signature to determine age in different tissues. Aging 2011, 3, 1018–1027. [Google Scholar] [CrossRef] [PubMed] [Green Version]
- Kundaje, A.; Meuleman, W.; Ernst, J.; Bilenky, M.; Yen, A.; Heravi Moussavi, A.; Kheradpour, P.; Zhang, Z.; Wang, J. Integrative analysis of 111 reference human epigenomes. Nature 2015, 518, 317–330. [Google Scholar] [CrossRef] [PubMed] [Green Version]
- Alisch, R.S.; Barwick, B.G.; Chopra, P.; Myrick, L.K.; Satten, G.A.; Conneely, K.N.; Warren, S.T. Age-associated DNA methylation in pediatric populations. Genome Res. 2012, 22, 623–632. [Google Scholar] [CrossRef] [PubMed] [Green Version]
- Lee, H.S.; Kim, B.H.; Cho, N.Y.; Yoo, E.J.; Choi, M.; Shin, S.H.; Jang, J.J.; Suh, K.S.; Kim, Y.S.; Kang, G.H. Prognostic implications of and relationship between CpG island hypermethylation and repetitive DNA hypomethylation in hepatocellular carcinoma. Clin. Cancer Res. 2009, 15, 812–820. [Google Scholar] [CrossRef] [PubMed]
- Marttila, S.; Kananen, L.; Hayrynen, S.; Jylhava, J.; Nevalainen, T.; Hervonen, A.; Jylha, M.; Nykter, M.; Hurme, M. Ageing-associated changes in the human DNA methylome: genomic locations and effects on gene expression. BMC Genom. 2015, 16, 179. [Google Scholar] [CrossRef] [PubMed]
- Marttila, S.; Jylhava, J.; Nevalainen, T.; Nykter, M.; Jylha, M.; Hervonen, A.; Tserel, L.; Peterson, P.; Hurme, M. Transcriptional analysis reveals gender-specific changes in the aging of the human immune system. PLoS ONE 2013, 8, e66229. [Google Scholar] [CrossRef] [PubMed]
- Michele, R.; Tennant, M.; Jennifer, A.; Lyon, M.S. Entrez Gene. J. Elec. Res. Medic. Libra. 2007, 4, 53–78. [Google Scholar]
- Huard, B.; Prigent, P.; Tournier, M.; Bruniquel, D.; Triebel, F. CD4/major histocompatibility complex class II interaction analyzed with CD4- and lymphocyte activation gene-3 (LAG-3)-Ig fusion proteins. Eur. J. Immunol. 2010, 25, 2718–2721. [Google Scholar] [CrossRef] [PubMed]
- Workman, C.J.; Vignali, D.A. The CD4-related molecule, LAG-3 (CD223), regulates the expansion of activated T cells. Eur. J. Immunol. 2010, 33, 970–979. [Google Scholar] [CrossRef] [PubMed]
- Workman, C.J.; Cauley, L.S.; Kim, I.J.; Blackman, M.A.; Woodland, D.L.; Vignali, D.A. Lymphocyte activation gene-3 (CD223) regulates the size of the expanding T cell population following antigen activation in vivo. J. Immunol. 2004, 172, 5450–5455. [Google Scholar] [CrossRef] [PubMed]
- Huang, C.T.; Workman, C.J.; Flies, D.; Pan, X.; Marson, A.L.; Zhou, G.; Hipkiss, E.L.; Ravi, S.; Kowalski, J.; Levitsky, H.I. Role of LAG-3 in regulatory T cells. Immunity 2004, 21, 503–513. [Google Scholar] [CrossRef] [PubMed]
- Grosso, J.F.; Kelleher, C.C.; Harris, T.J.; Maris, C.H.; Hipkiss, E.L.; De, M.A.; Anders, R.; Netto, G.; Getnet, D.; Bruno, T.C. LAG-3 regulates CD8+ T cell accumulation and effector function in murine self- and tumor-tolerance systems. J. Clin. Investig. 2007, 117, 3383–3392. [Google Scholar] [CrossRef] [PubMed]
- Blackburn, S.D.; Shin, H.; Haining, W.N.; Zou, T.; Workman, C.J.; Polley, A.; Betts, M.R.; Freeman, G.J.; Vignali, D.A.; Wherry, E.J. Coregulation of CD8+ T cell exhaustion by multiple inhibitory receptors during chronic viral infection. Nat. Immunol. 2009, 10, 29–37. [Google Scholar] [CrossRef] [PubMed]
- Andreae, S.; Piras, F.; Burdin, N.; Triebel, F. Maturation and activation of dendritic cells induced by lymphocyte activation gene-3 (CD223). J. Immunol. 2002, 168, 3874–3880. [Google Scholar] [CrossRef] [PubMed]
- Kashevarova, A.A.; Nazarenko, L.P.; Skryabin, N.A.; Salyukova, O.A.; Chechetkina, N.N.; Tolmacheva, E.N.; Sazhenova, E.A.; Magini, P.; Graziano, C.; Romeo, G.; et al. Array CGH analysis of a cohort of Russian patients with intellectual disability. Gene 2014, 536, 145–150. [Google Scholar] [CrossRef] [PubMed]
- Fish, K.J.; Cegielska, A.; Getman, M.E.; Landes, G.M.; Virshup, D.M. Isolation and characterization of human casein kinase I epsilon (CKI), a novel member of the CKI gene family. J. Biol. Chem. 1995, 270, 14875–14883. [Google Scholar] [CrossRef] [PubMed]
- Khoo, M.L.; Carlin, S.M.; Lutherborrow, M.A.; Jayaswal, V.; Ma, D.D.; Moore, J.J. Gene profiling reveals association between altered Wnt signaling and loss of T-cell potential with age in human hematopoietic stem cells. Aging Cell 2014, 13, 744–754. [Google Scholar] [CrossRef] [PubMed]
- Glass, D.; Vinuela, A.; Davies, M.N.; Ramasamy, A.; Parts, L.; Knowles, D.; Brown, A.A.; Hedman, A.K.; Small, K.S.; Buil, A.; et al. Gene expression changes with age in skin, adipose tissue, blood and brain. Genome Biol. 2013, 14, R75. [Google Scholar] [CrossRef] [PubMed]
- Song, F.; Mahmood, S.; Ghosh, S.; Liang, P.; Smiraglia, D.J.; Nagase, H.; Held, W.A. Tissue specific differentially methylated regions (TDMR): Changes in DNA methylation during development. Genomics 2009, 93, 130–139. [Google Scholar] [CrossRef] [PubMed] [Green Version]
Figure 1.
Comparison between the real age and the age predicted by the four models in the training dataset of health data. GBR: gradient boosting regresion; MAD: mean absolute deviation; RMSE: root mean square error; SVR: support vector regression.
Figure 1.
Comparison between the real age and the age predicted by the four models in the training dataset of health data. GBR: gradient boosting regresion; MAD: mean absolute deviation; RMSE: root mean square error; SVR: support vector regression.

Figure 2.
Comparison between the real age and the age predicted by the four models in the validation dataset of healthy data.
Figure 2.
Comparison between the real age and the age predicted by the four models in the validation dataset of healthy data.

Figure 3.
Comparison between the real age and the age predicted by the four models in the training dataset of disease data.
Figure 3.
Comparison between the real age and the age predicted by the four models in the training dataset of disease data.

Figure 4.
Comparison between the real age and the age predicted by the four models in the validation dataset of disease data.
Figure 4.
Comparison between the real age and the age predicted by the four models in the validation dataset of disease data.

Figure 5.
(a) A histogram of the age distribution for healthy individuals; (b) A histogram of the age distribution for disease individuals.
Figure 5.
(a) A histogram of the age distribution for healthy individuals; (b) A histogram of the age distribution for disease individuals.

Figure 6.
UCSC genome browser view of the genomic location of the CpG cg19761273.


Table 1.
Sixteen healthy DNA-methylation datasets.
| DNA Origin | Platform | No. | Age Range | Author and Publication Year | Availability |
|---|---|---|---|---|---|
| Whole Blood | 27K | 93 | (49, 74) | Rakyan (2010) | GSE20236 |
| Blood CD4+CD14 | 27K | 50 | (16, 69) | Rakyan (2010) | GSE20242 |
| Blood PBMC 1 | 27K | 398 | (3.6, 18) | Alisch (2012) | GSE27097 |
| Blood Cord | 27K | 168 | (0, 0) | Adkins (2011) | GSE27317 |
| Blood PBMC | 450K | 40 | (0, 103) | Heyn (2012) | GSE30870 |
| Blood PBMC | 450K | 71 | (3.5, 76) | Harretal (2012) | GSE32149 |
| Blood Cord | 27K | 84 | (0, 0) | Khulan (2012) | GSE34257 |
| Blood Cord | 27K | 24 | (0, 0) | Mallon (2012) | GSE34869 |
| Blood PBMC | 450K | 78 | (1, 16) | Alisch (2012) | GSE36064 |
| Blood Cord | 27K | 123 | (0, 0) | Gordon (2012) | GSE36642 |
| Blood Cord | 27K | 48 | (0, 0) | Turan (2012) | GSE36812 |
| Blood PBMC | 27K | 91 | (24, 45) | Lam (2012) | GSE37008 |
| Whole Blood | 450K | 500 | (26, 101) | Hannum (2012) | GSE40279 |
| Whole Blood | 450K | 95 | (18, 65) | Horvath (2012) | GSE41169 |
| Whole blood | 450K | 43 | (47, 59) | Bell (2013) | GSE53128 |
| Blood | 450K | 16 | (21, 32) | Xu (2015) | GSE65638 |
1 Peripheral blood mononuclear cell.
Table 2.
Nine disease DNA-methylation datasets.
| DNA Origin | Platform | No. | Age Range | Author and Publication Year | Availability |
|---|---|---|---|---|---|
| Whole Blood | 27K | 203 | (50, 85) | Song (2010) | GSE19711 |
| Whole Blood | 27K | 194 | (1, 32) | Teschendorff (2010) | GSE20067 |
| Peripheral Blood | 450K | 46 | (3.5, 76) | Harris (2011) | GSE32148 |
| Blood | 450K | 24 | (52, 88) | Athanasios (2012) | GSE40005 |
| Whole Blood | 27K | 498 | (16, 86) | Horvath (2012) | GSE41037 |
| Whole Blood | 450K | 500 | (18, 70) | Liu (2013) | GSE42861 |
| Blood | 27K | 71 | (23, 85) | Day (2013) | GSE49904 |
| Blood | 450K | 499 | (34, 72) | Polidoro (2013) | GSE51032 |
| Peripheral Blood | 450K | 383 | (34, 93) | Lwe (2013) | GSE53740 |
Table 3.
Information of 6 selected age-related CpG sites.
| CpG ID | Gene ID | Chromosome Location 1 | Gene Region 2 | Relation to GpG Island 3 | Correlation Status | Reference |
|---|---|---|---|---|---|---|
| cg09809672 | EDARADD | 1:236557682 | TSS1500 | N_Shore | Negative | [1,17,33] |
| cg22736354 | NHLRC1 | 6:18122719 | 1stExon | Island | Positive | [2,7,18,19] |
| cg02228185 | ASPA | 17:3379567 | 1stExon | -- | Negative | [7,26,33] |
| cg01820374 | LAG3 | 12:6882083 | Body | N_Shore | Negative | [1] |
| cg06493994 | SCGN | 6:25652602 | 1stExon | Island | Positive | [2,7,18,19] |
| cg19761273 | CSNK1D | 17:80232096 | TSS1500 | S_Shore | Negative | [2] |
1 Chromosome location is referred to the Human genome reference GRCh37 version. 2 TSS: transcription start site. TSS1500: 1500 bp flanking region from the TSS. 3 CpGs island table were downloaded from University of California Santa Cruz (UCSC) browser. Distance of 2kb to CpG islands were defined as CpG island shores (N_Shore: downstream of CpG island and S_Shore: up-stream of the CpG island).
Table 4.
Comparison of gradient booster regressor (GBR) with the other three methods on healthy datasets.
Table 4.
Comparison of gradient booster regressor (GBR) with the other three methods on healthy datasets.
| R2 | MAD | MSE | RMSE | |
|---|---|---|---|---|
| Training | ||||
| Gradient Boosting Regressor | 0.9747 | 2.7171 | 20.7243 | 4.5524 |
| BayesianRidge | 0.8055 | 10.2561 | 158.3044 | 12.5819 |
| Support Vector Regression | 0.9267 | 5.1338 | 60.0420 | 7.7487 |
| Multiple Linear Regression | 0.8055 | 10.2448 | 158.2800 | 12.5809 |
| Testing | ||||
| Gradient Boosting Regressor | 0.9523 | 4.0593 | 39.8269 | 6.3109 |
| BayesianRidge | 0.8101 | 10.5654 | 157.8721 | 12.5647 |
| Support Vector Regression | 0.9151 | 5.9267 | 71.2060 | 8.4384 |
| Multiple Linear Regression | 0.8104 | 10.5510 | 157.6726 | 12.5568 |
MAD: mean absolute deviation; MSE: mean square error; RMSE: root mean square error.
Table 5.
Results comparison of GBR with the other three methods on disease datasets.
| MAD | MSE | RMSE | ||
|---|---|---|---|---|
| Training | ||||
| Gradient Boosting Regressor | 0.8186 | 5.4401 | 63.0648 | 7.9413 |
| BayesianRidge | 0.6844 | 7.8944 | 109.6227 | 10.4701 |
| Support Vector Regression | 0.5333 | 9.8583 | 162.6949 | 12.7552 |
| Multiple Linear Regression | 0.6844 | 7.8946 | 109.6222 | 10.4701 |
| Testing | ||||
| Gradient Boosting Regressor | 0.7374 | 7.0832 | 91.7887 | 9.5806 |
| BayesianRidge | 0.6812 | 8.0786 | 111.2896 | 10.5494 |
| Support Vector Regression | 0.5303 | 9.9573 | 164.6747 | 12.8326 |
| Multiple Linear Regression | 0.6812 | 8.0795 | 111.3016 | 10.5500 |
Table 6.
Results comparison of GBR with the other three methods on saliva datasets.
| R2 | MAD | MSE | RMSE | |
|---|---|---|---|---|
| Training | ||||
| Gradient Boosting Regressor | 0.8539 | 2.1040 | 13.7795 | 3.7121 |
| BayesianRidge | 0.4310 | 5.7483 | 52.5169 | 7.2469 |
| Support Vector Regression | 0.0227 | 7.9369 | 99.5273 | 9.9763 |
| Multiple Linear Regression | 0.4333 | 5.6775 | 52.3045 | 7.2322 |
| Testing | ||||
| Gradient Boosting Regressor | 0.4298 | 5.3478 | 56.1291 | 7.4919 |
| BayesianRidge | 0.5423 | 5.5389 | 43.8468 | 6.6217 |
| Support Vector Regression | 0.0308 | 8.4729 | 104.4403 | 10.2196 |
| Multiple Linear Regression | 0.5479 | 5.4662 | 43.3933 | 6.5874 |
Table 7.
Results of GBR and Multiple Linear Regression on saliva samples.
| No. of CpG Sites | MAD | ||
|---|---|---|---|
| Multiple Linear Regression | 88 | 0.73 | 5.2 |
| Gradient Boosting Regressor | 6 | 0.58 | 3.76 |
© 2018 by the authors. Licensee MDPI, Basel, Switzerland. This article is an open access article distributed under the terms and conditions of the Creative Commons Attribution (CC BY) license (http://creativecommons.org/licenses/by/4.0/).
Share and Cite
MDPI and ACS Style
Li, X.; Li, W.; Xu, Y. Human Age Prediction Based on DNA Methylation Using a Gradient Boosting Regressor. Genes 2018, 9, 424. https://doi.org/10.3390/genes9090424
AMA Style
Li X, Li W, Xu Y. Human Age Prediction Based on DNA Methylation Using a Gradient Boosting Regressor. Genes. 2018; 9(9):424. https://doi.org/10.3390/genes9090424
Chicago/Turabian StyleLi, Xingyan, Weidong Li, and Yan Xu. 2018. "Human Age Prediction Based on DNA Methylation Using a Gradient Boosting Regressor" Genes 9, no. 9: 424. https://doi.org/10.3390/genes9090424
Note that from the first issue of 2016, this journal uses article numbers instead of page numbers. See further details here.