Changes in Extreme Low Temperature Events over Northern China under 1.5 °C and 2.0 °C Warmer Future Scenarios

Key Laboratory of Meteorological Disaster of Ministry of Education (KLME), Collaborative Innovation Center on Forecast and Evaluation of Meteorological Disasters (CIC-FEMD), Nanjing University of Information Science and Technology, Nanjing 210044, China
*
Author to whom correspondence should be addressed.
Atmosphere 2019, 10(1), 1; https://doi.org/10.3390/atmos10010001
Submission received: 3 December 2018
/
Revised: 18 December 2018
/
Accepted: 19 December 2018
/
Published: 21 December 2018
(This article belongs to the Special Issue Weather and Climate Extremes: Current Developments)
Abstract
:Recently, NCAR (the National Center for Atmospheric Research) released the Community Earth System Model’s low-warming simulations, which provided long-term climate data for stabilization pathways at 1.5 °C and 2.0 °C above pre-industrial levels. Based on these data, six extreme low temperature indices—TXn (coldest day), TNn (coldest night), TX10p (cool days), TN10p (cool nights), CSDI (cold spell duration indicator), and DTR (diurnal temperature range)—were calculated to assess the changes in extreme low temperature over Northern China under 1.5 °C and 2.0 °C warmer future. The results indicate that compared to the preindustrial level, the whole of China will experience 0.32–0.46 °C higher minimum surface air temperature (SAT) warming than the global average, and the winter temperature increase in Northern China will be the most pronounced over the country. In almost all the regions of Northern China, especially Northeast and Northwest China, extreme low temperature events will occur with lower intensity, frequency, and duration. Compared with the present day, the intensity of low temperature events will decrease most in Northeast China, with TXn increasing by 1.9 °C/2.0 °C and TNn increasing by 2.0 °C/2.5 °C under 1.5 °C/2.0 °C global warming, respectively. The frequency of low temperature events will decrease relatively more in North China, with TX10p decreasing by 8 days/11 days and TN10p decreasing by 7 days/9 days under 1.5 °C/2.0 °C warming. CSDI will decrease most in Northwest China, with decreases of 7 days/10 days with 1.5 °C/2.0 °C warming. DTR will decrease in the Northwest and Northeast but increase in North China, with −0.9 °C/−2.0 °C in the Northwest, −0.4 °C/−1.5 °C in the Northeast, and 1.7 °C/2.0 °C in North China in the 1.5 °C/2.0 °C warming scenarios. For temperatures lower than the 5th percentile, the PRs (probability ratios) will be 0.68 and 0.55 of that of the present day under 1.5 °C and 2.0 °C warmer futures, respectively. Global warming of 2.0 °C instead of 1.5 °C will lead to extreme low temperature events decreasing by 6–56% in regard to intensity, frequency, and duration over Northern China, and the maximal values of decrease (24–56%) will be seen in Northeast China.
1. Introduction
During the past century, the global surface air temperature (SAT) has increased robustly, and anthropogenic forcing is the main cause of this increase [1]. However, previous studies have shown that the temperature rise in China has been significantly larger than the global average [2], and China is thus one of the regions in the world most affected by climate change [3]. In recent years, climate change has become one of the hottest issues to discuss, especially extreme climate change and its causes under global warming.
In order to reduce the effects and risks of climate change, the United Nations Framework Convention on Climate Change (UNFCCC) passed the Paris Agreement in 2015 and set a long-term goal to “hold the increase in the global average temperature to well below 2.0 °C above pre-industrial levels and strive to control the global temperature increase to 1.5 °C above pre-industrial levels” [4]. The Intergovernmental Panel on Climate Change (IPCC) accepted the invitation to provide a Special Report in 2018 on the impacts of a global warming of 1.5 °C above pre-industrial levels and related global greenhouse emission pathways from UNFCC, because there is a higher demand and increasing urgency for further analyses [2,5,6,7,8,9]. In October 2018, the IPCC published this Special Report.
It is well-known that extreme temperature change has a very close relationship with global warming. A large number of studies have consistently shown that changes in extreme low temperatures would be more drastic than those in extreme high temperatures, and extreme low temperatures are more sensitive to change in the global average temperature than extreme high temperatures [10,11,12,13]. Great progress has been achieved in research on extreme low temperature events under global warming in recent decades. Chen et al. [14] pointed out that in future scenarios with different temperature thresholds, TN10p and TX10p show a certain decrease. That is to say, the frequency of occurrence of cold nights and cold days will be reduced, and the decrease will be greater with the increase of the threshold. There was no significant change trend in the DTR (diurnal temperature range) under different temperature thresholds, and the difference in variation of the CSDI (cold spell duration indicator) under different temperature thresholds was relatively small. Yao et al. [15] also estimated that at the end of 21st century, the cold wave duration would decrease by 71%. The frequency of extreme low temperature events in Northwest China showed a significant negative response to regional warming, and the response was stronger in Northern Xinjiang, Central and Southeastern Xinjiang, and most areas of Qinghai province [16]. In the scenario of IPCC SRES (Special Report On Emissions Scenarios) B2, it was estimated that in the future (2071–2100), the overall cold duration index will show a decreasing trend, and the reduction range for Northeast China, North China, Northwest China, Inner Mongolia, and most areas of the Qinghai–Tibet Plateau will be over 90% [17].
Though many above studies have investigated the change of extreme low temperature in Northern China under global warming [18], few of these focused on its change at a specific degree of warming, especially at 1.5 °C/2.0 °C above pre-industrial levels. In addition, most of the studies are based on multi-model simulations from Coupled Model Intercomparison Project 3 (CMIP3) or CMIP5, which generally investigate a transient state and not a stable state if given a specific warming threshold. Thus, it is very necessary to explore the change of extreme low temperature in Northern China under a stable state of 1.5 °C/2.0 °C warming. The NCAR (National Center for Atmospheric Research) released the first set of coupled model simulations that were able to produce stabilized global mean temperatures 1.5 °C and 2.0 °C warmer than pre-industrial levels, such experimental results are of great research value [19,20]. In this research, we used NCAR Community Earth System Model (CESM) low-warming datasets to investigate the change of extreme low temperatures in Northern China under 1.5 °C and 2.0 °C warming. The data and the methods used are given in the second part of this paper. The changes in extreme low temperature events under 1.5 and 2.0 °C warming over Northern China are discussed in the third section, and conclusions and discussions are provided in the last part of this paper.
2. Data and Methods
2.1. Data
2.1.1. Historical Data
The NCAR CESM large-ensemble (CESM-LE) simulations were used to represent the historical model data with horizon resolution at 192 (latitude) × 288 (longitude) grids [21,22]. Forty-two ensemble members were used in CESM-LE historical run simulations: 1 member from 1850 to 2005 and the other 41 members from 1920 to 2005. CESM-LE contains 40-member simulations under different initial disturbance values and the same radiation force [historical up to 2005 and RCP (Representative Concentration Pathway) 8.5 thereafter] for the period 1920–2100. The period of 1976–2005 represents the present day [23], and 1850–1919 is the preindustrial period. Please refer to Kay et al. [21] for more experimental design details. The gridded observed daily surface air temperature (SAT) was taken from the CN05 dataset (A gridded temperature daily data set over China) for the interval of 1961–2012 and horizontal resolution of 0.5°, providing a comparison of the extreme indices between simulated and observed results [24,25].
2.1.2. Model Projection Data
For the first time, a simple minimum complexity Earth simulator (MiCES) model was used to generate a set of greenhouse gas emission pathways to achieve long-term global warming of 1.5 °C and 2.0 °C above pre-industrial levels. The MiCES-generated emission pathways were then applied to the first 11 ensemble members of CESM between 2006 and 2100. All other anthropogenic forcing, including land use, aerosol emissions, and ozone, followed the RCP8.5 scenario in 1.5 °C and 2.0 °C emission scenarios. The global mean temperature was set up for stable at 1.5 °C and 2.0 °C higher than pre-industrial levels at the end of the 21st century for the first time by the coupled model. The period of 2071–2100 represents the stable equilibrium period for 1.5 °C and 2.0 °C global warming above the preindustrial levels. For more details about the design of the experiment, please refer to Sanderson et al. [19].
2.2. Methods
2.2.1. Extreme Low Temperature Indices
For better understanding of the impacts of global warming on the risk of low temperature in Northern China, six extreme indices [26] describing the data for 1976 to 2005 and 2071 to 2100 were calculated in this study. They were coldest day (TXn), coldest night (TNn), days of values below the 10th percentile of baseline daily maximum temperature (TX10p), days of values below the 10th percentile of baseline daily minimum temperature (TN10p), cold spell duration indicator (CSDI), and diurnal temperature range (DTR), and the range of winter daily data was from December to February. Details of the six low temperature indices are shown in Table 1.
2.2.2. Subregions of Northern China
Tao Shiyan (1959) [27] studied the cold air sources and paths that affect the Chinese mainland and gave three main paths of cold wave invasion into China according to their prediction: First, cold air invades the European part of the former Soviet Union in the Barents Sea west of New Novaya Zemlya, and then invades China through Siberia and Mongolia to the east. Second, cold air from the east of the island (the Kara Sea) invades Siberia to the south, then follows a path near 55° N and southeast to invade China—this kind of path is generally called the polar path. Third, cold air invades China from the north to the south along the east of Lake Baikal. According to the different cold air sources and paths, Northern China is divided into three parts: Northwest China (NW) (35–50° N, 73–105° E), Northeast China (NE) (43–54° N, 115–135° E), and North China (NC) (35–43° N, 105–123° E) (details in Figure 1). The definitions of the subregions are consistent with those given by Chen et al. [28] and Liang et al. [29]. The six projected extreme low temperature indices were calculated for each region based on the model simulation data after bias correction was applied.
2.2.3. Bias Correction
The deviation of the extreme indices obtained from the model dataset was tested by comparing them with the observation results. We constructed the extreme low temperature index series after bias correction as detailed by Jung [30]:
where MModel and MBC represent daily results of the simulation and corrections, respectively, and M’Obs and M’Model represent the averages of the climate observations and simulations, respectively, from 1976 to 2005.
MBC = MModel − (M’Model − M’Obs),
2.2.4. Probability Ratio
A small number of studies have analyzed the probability ratio (PR) of temperatures [31,32] to study the subregions which are severely affected by extreme events. The defining formula of the PR is
PR = P1 × P0−1.
The probability of extreme events at a certain intensity for the reference period from 1976 to 2005 is expressed in terms of P0, and P1 is the probability corresponding to future events.
2.2.5. Avoided Impacts
As the global temperature rises, extreme low temperature events will also change. In order to investigate the avoided impacts of extreme low temperature events under the condition of a 1.5 °C warming compared with a 2.0 °C warmer scenario, Li et al. [22] defined a formula as follows:
where AI represents avoided impacts, and Changes1.5 and Changes2.0 are the changes in extreme low temperature events in 1.5 °C and 2.0 °C warming scenarios (2071–2100), respectively, compared to the present day (1976–2005).
AI = [(Changes2.0 − Changes1.5)/Changes2.0] × 100%,
3. Results
3.1. Evaluation of Historical Simulation
We used a Taylor diagram [33] to evaluate the performance of the CESM model with reference to the CN05 observation dataset for Northern China.
We used the bias correction method to rectify the climatology of the daily mean, maximum, and minimum SAT in simulations. As shown in Figure 2, the intensity indices TXn and TNn had better performance in the correlation, while the duration index CSDI had lower performance than the intensity indices in the correlation and spatial standard deviations. The frequency indices TX10p and TN10p did not change with the bias correction method [34,35,36]. From Figure 2b, we can see that there was a large gap in the magnitudes and correlations of the four extreme low temperature indices presented between the original model data and the observational data, especially for TXn and TNn. It is obvious that the bias-corrected simulation data were closer to the observational data in terms of the ratio and correlation of the four indices.
3.2. Minimum Surface Air Temperature Changes
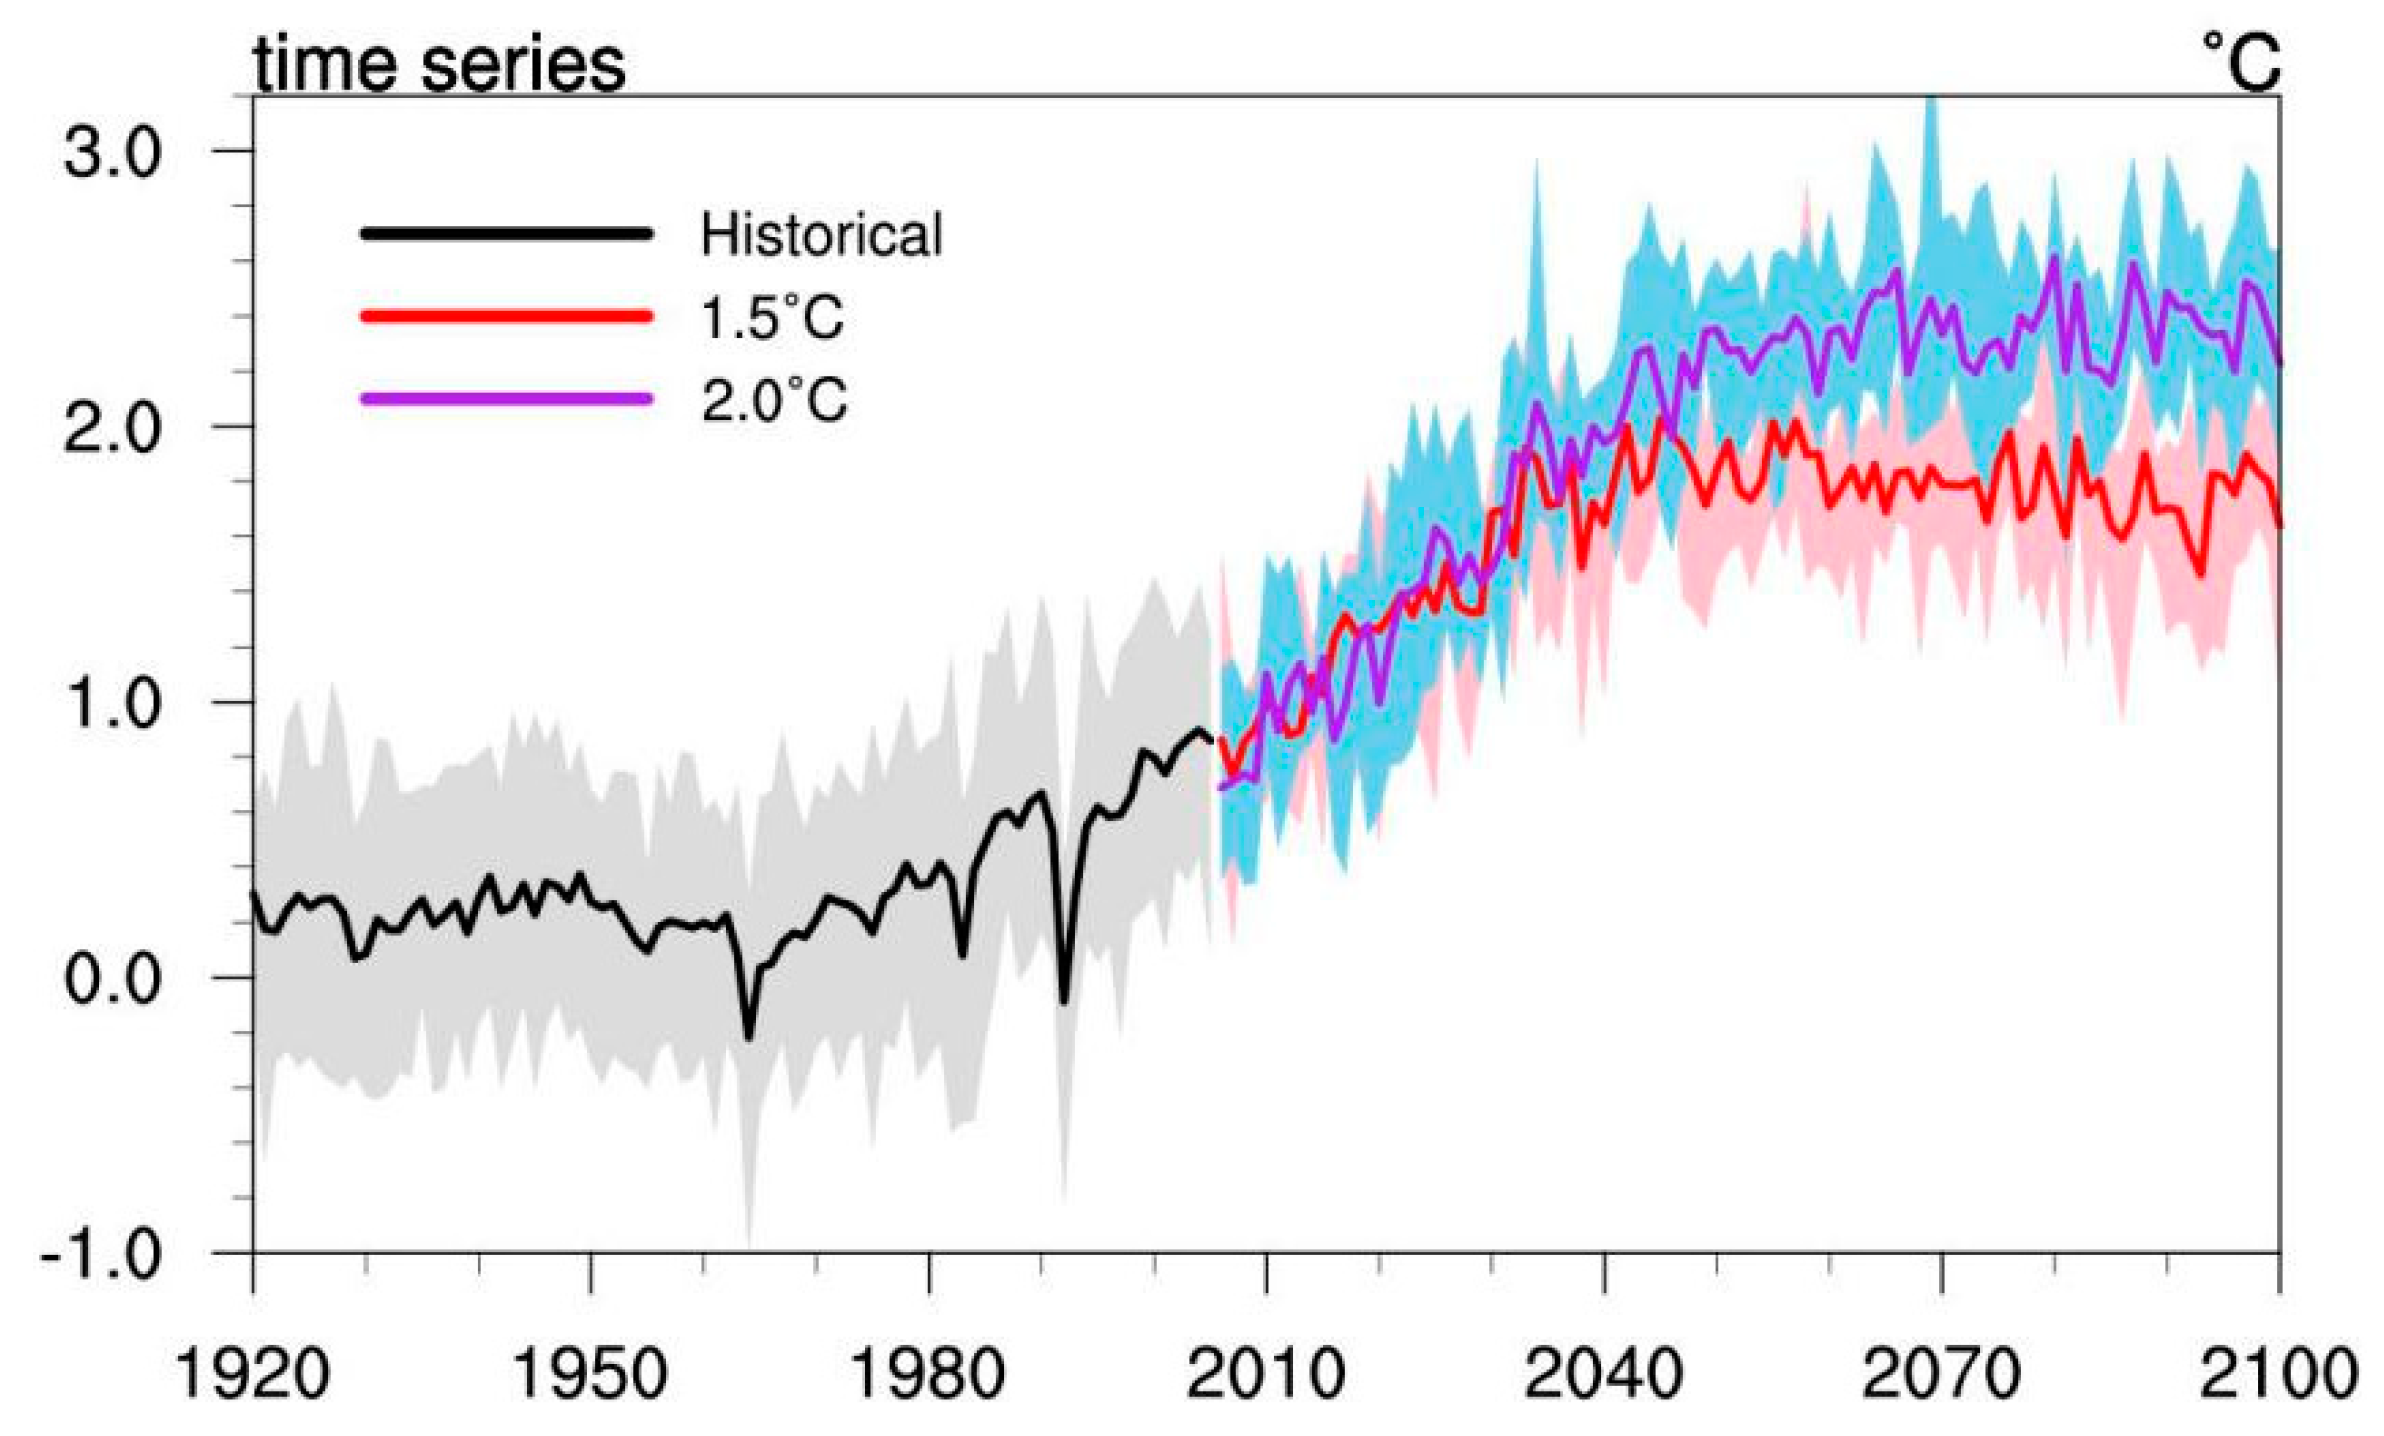
The annual regional minimum SAT over China stabilizes at an approximate increase of 1.82 °C above pre-industrial levels in the 1.5 °C simulations from 2071 to 2100, and at 2.46 °C warming in the 2.0 °C simulations for the same period (Figure 3). This means that the annual minimum SAT over China is about 20% higher than the global level in each warming scenario. This result is consistent with those found by Li et al. [36] and Shi et al. [37]. The shaded area of the Figure represents the uncertainty of the model estimation, and represents the upper and lower bounds of minimum temperature change.
There are different warming patterns of the winter minimum SAT over China for different scenarios (Figure 4a–c). We applied a Student’s t-test to indicate the 0.05 significance level. Compared to the present day, we determined that the warmest area under 1.5 °C and 2.0 °C global warming will be Northern China. In most parts of Northern China, the warming was predicted to be greater than 1.5 °C, and for parts of NW it was predicted to be even greater than 2.0 °C in the 1.5 °C scenario (Figure 4a). The minimum SAT in winter in Northern China will increase by more than 2.0 °C under the 2.0 °C warming scenario compared with the present day, especially in NW and parts of NC (higher than 2.5 °C) (Figure 4b). Figure 4c shows the difference between the 2.0 °C and 1.5 °C scenarios. The average increase across Northern China will be more than 0.8 °C. The most significant growth areas were still determined to be NW and parts of NE.
3.3. Changes in Low Temperature Extremes
We further investigated the intensity changes in regional minimum SAT extremes (TXn, TNn, and DTR) under the 1.5 °C and 2.0 °C scenarios (Figure 5, Figure 6 and Figure 7, and Table 2). All of the box and whisker plots show the 10th, 25th, 50th, 75th, and 90th percentiles. The magnitude of TXn across Northern China under 1.5 °C warming was calculated to increase by −2.5 to 6.0 °C (Figure 5a,d), but in Figure 5a, we found a small decrease in TXn in the Northeast region, which may be due to some extremely strong low temperature events under 1.5 °C warming, making the overall spatial distribution a weak decreasing representation. However, only a few areas in Figure 5a passed the 0.05 significance level, which also indicates that the overall weakening was not significant. At 2.0 °C warming, the increase was determined to be between −2.5 and 7.0 °C compared to the present day (Figure 5b,e). TXn will increase by about −0.7 to 2.8 °C relative to 1.5 °C in 2.0 °C warmer climates. TXn was found to increase the most in Northeast China, increasing by 1.9 °C/2.0 °C at the 50th percentile under 1.5 °C/2.0 °C global warming. The additional half-degree of warming will lead to increases of TXn above −0.7 to 1.7 °C across NC, 0.7–2.6 °C across NW, and 0–2.8 °C across NE. The average of the spatial field over the projected 30 years is consistent with the corresponding effect: NE had the most robust increase (Figure 5e,f).
Accordingly, the magnitude of the increase in TNn across Northern China under 1.5 °C warming will be from −2.1 to 5.5 °C (Figure 6a,d), and the increases at the 50th percentile will be from 0.9 to 2.0 °C. At the same time, the probability of TNn in NE and part of NW was also reduced, but the reduction in probability was very small and the area passing the significance test was also very small, which is consistent with Figure 6a,d. The increase under 2.0 °C warming was found to be from −2.6 to 5.9 °C compared to the present day (Figure 6b,e). In 2.0 °C warmer climates, it will increase by about −1.4 to 2.6 °C relative to 1.5 °C warmer (Figure 6c,f). TNn increased most in Northeast China, increasing by 2.0 °C/2.5 °C at the 50th percentile under 1.5 °C/2.0 °C global warming. As with TXn, 0.5 °C warming will cause increases in TNn of −1.4 °C to 1.5 °C in NC, −0.6 to 2.6 °C in NW, and 0 to 1.8 °C in NE.
Unlike TXn and TNn, the change in DTR was different across the three regions. The changing magnitude of DTR was not uniform across NC (Figure 7). At 1.5 °C warming, the DTR was predicted to increase by −1.7 to −0.3 °C in NW and by −1.7 to 0.2 °C in NE, but increase by 0.5–2.8 °C in NC (Figure 7a,d). Under 2.0 °C warming, the DTR was predicted to increase by −2.7 to −0.5 °C in NW and by −2.0 to 0.2 °C in NE, but increase by 0.7–2.7 °C in NC (Figure 7b,e). This shows that the increase in the daily maximum SAT in NC will be greater than that in the daily minimum SAT under 1.5 °C and 2.0 °C warming, but in the other two regions, the change will be the opposite. An additional half-degree of warming will result in 0.5–1.9 °C and 0.8–1.9 °C decreases in DTR in NW and NE and an increase of −1.2 to 1.7 °C in NC (Figure 7c,f and Table 2). The spatial distribution shown in Figure 7a–c is relatively consistent with the statistical results shown in Figure 7d–f. In Figure 7a–c, it can be clearly seen that the DTR in some areas of Central Northern China increased or decreased.
The changes in the frequency of extreme low temperature events (TX10p and TN10p) showed regional differences (Figure 8 and Figure 9). The frequency change in extreme low temperature events in the daytime will be close to that at night (TX10p versus TN10p) in Northern China.
The magnitudes of decrease in TX10p were relatively uniform across Northern China. Under 1.5 °C warming, the decrease will be 1–12.5 days (Figure 8a,d); under 2.0 °C warming, the decrease will be 4–16 days compared to the present day (Figure 8b,e). In 2.0 °C warmer climates, it will decrease by about 1.1–6.8 days relative to 1.5 °C warming (Figure 8c,f). The extra 0.5 °C warming will result in 1.1–4.8 days, 1.5–5.2 days, and 4.0–6.8 days decreases in TX10p in NW, NC, and NE, respectively. Under 1.5 °C warming, TX10p will decrease the most in NC, while in the context of 2.0 °C warming, the decreases in NC, NW, and NE will be relatively consistent. NE will have the largest decrease at 2.0 °C relative to 1.5 °C.
Under the 1.5 °C warming scenario, TN10p was predicted to decrease by 1.2–11.4 days (Figure 9a,d); under the 2.0 °C warming scenario, the decrease will be 6.2–11 days compared to the present day (Figure 9b,e). TN10p will decrease by about 1.1–8.0 days relative to 1.5 °C warming in 2.0 °C warmer climates (Figure 9c,f). Our results are consistent with those found by Wang et al. [38], but there are also other researchers who gave a smaller decrease in TX10p and TN10p under global warming. Compared with 1.5 °C warming, 0.5 °C warmer temperatures will cause 0.7–3.8 days, 0.5–5.0 days, and 2.5–8.5 days decreases in TN10p in NW, NC, and NE, respectively (Figure 9c,f and Table 2). The variation characteristics of TN10p are the same as those of TX10p, with the greatest decrease in NC under 1.5 °C warming and the decreases in NC, NW, and NE being relatively consistent in the context of 2.0 °C warming. In addition, NE saw the largest decrease at 2 °C relative to 1.5 °C. The frequency of low temperature events will decrease relatively more in North China, with TX10p decreasing by 8 days/11 days and TN10p decreasing by 7 days/9 days under 1.5 °C/2.0 °C warming. The spatial distribution shown in Figure 9 is relatively consistent with the statistical results in Figure 9a–c.
The specific changes in the cold spell duration indicator (CSDI) were also examined (Figure 10, Table 2). Of the extreme indices based on duration, CSDI was predicted to have relatively uniform magnitudes of decrease across Northern China. Figure 9 shows the results of decreases in CSDI: CSDI will decrease most in Northwest China, with decreases of 7 days/10 days at the 50th percentile under 1.5 °C/2.0 °C warming. The decreases were predicted to be 0.6–13.2 days and 1.5–12.3 days under 1.5 °C (Figure 10a,d) and 2.0 °C (Figure 10b,e) warming compared to the present day, respectively. Previous studies indicated that by the end of this century, the cold wave duration will decrease by 71% [11]; our results are consistent with this. The magnitude of the CSDI will decrease by about 0.1–5.0 days in 2.0 °C warmer climates relative to 1.5 °C warming (Figure 10c,f). The additional half-degree of warming will lead to 0.3–5.0 days, 0.1–4.0 days, and 0.2–4.8 days decreases in CSDI in NW, NC, and NE, respectively. Under 1.5 °C warming, CSDI will decrease the most in NW, while in the context of 2.0 °C warming, the decrease in NW will be larger than those in NC and NE.
Detailed changes between 1.5 °C and 2.0 °C warming scenarios for the six extreme indices in NW, NC, and NE are shown in Table 2. All the Figures in the table represent the 50th percentile. This indicates that the largest changes will occur in NE and the smallest changes will occur in NC.
3.4. Changes in Probability Ratio
We calculated the probability ratio changes for the two warming levels. The results of the PRs for mean temperature extremes at different percentages for the 2.0 °C scenario were predicted to be lower than those for the 1.5 °C scenario (Figure 11). For the mean SAT in winter, the PR estimates of 5% and 10% under 1.5 °C global warming were 0.68 and 0.79 of those for the present day. In the 2.0 °C scenario, the PRs were 0.55 and 0.67 at 5% and 10% levels for the mean SAT. Therefore, the global temperature increases from 1.5 °C to 2.0 °C will bring about PR decreases of around 0.13 and 0.14 at 5% and 10% levels, respectively, for the winter mean SAT. This shows that the low temperature extremes will occur less frequently in winter under an additional half-degree of global warming.
3.5. Avoided Impacts
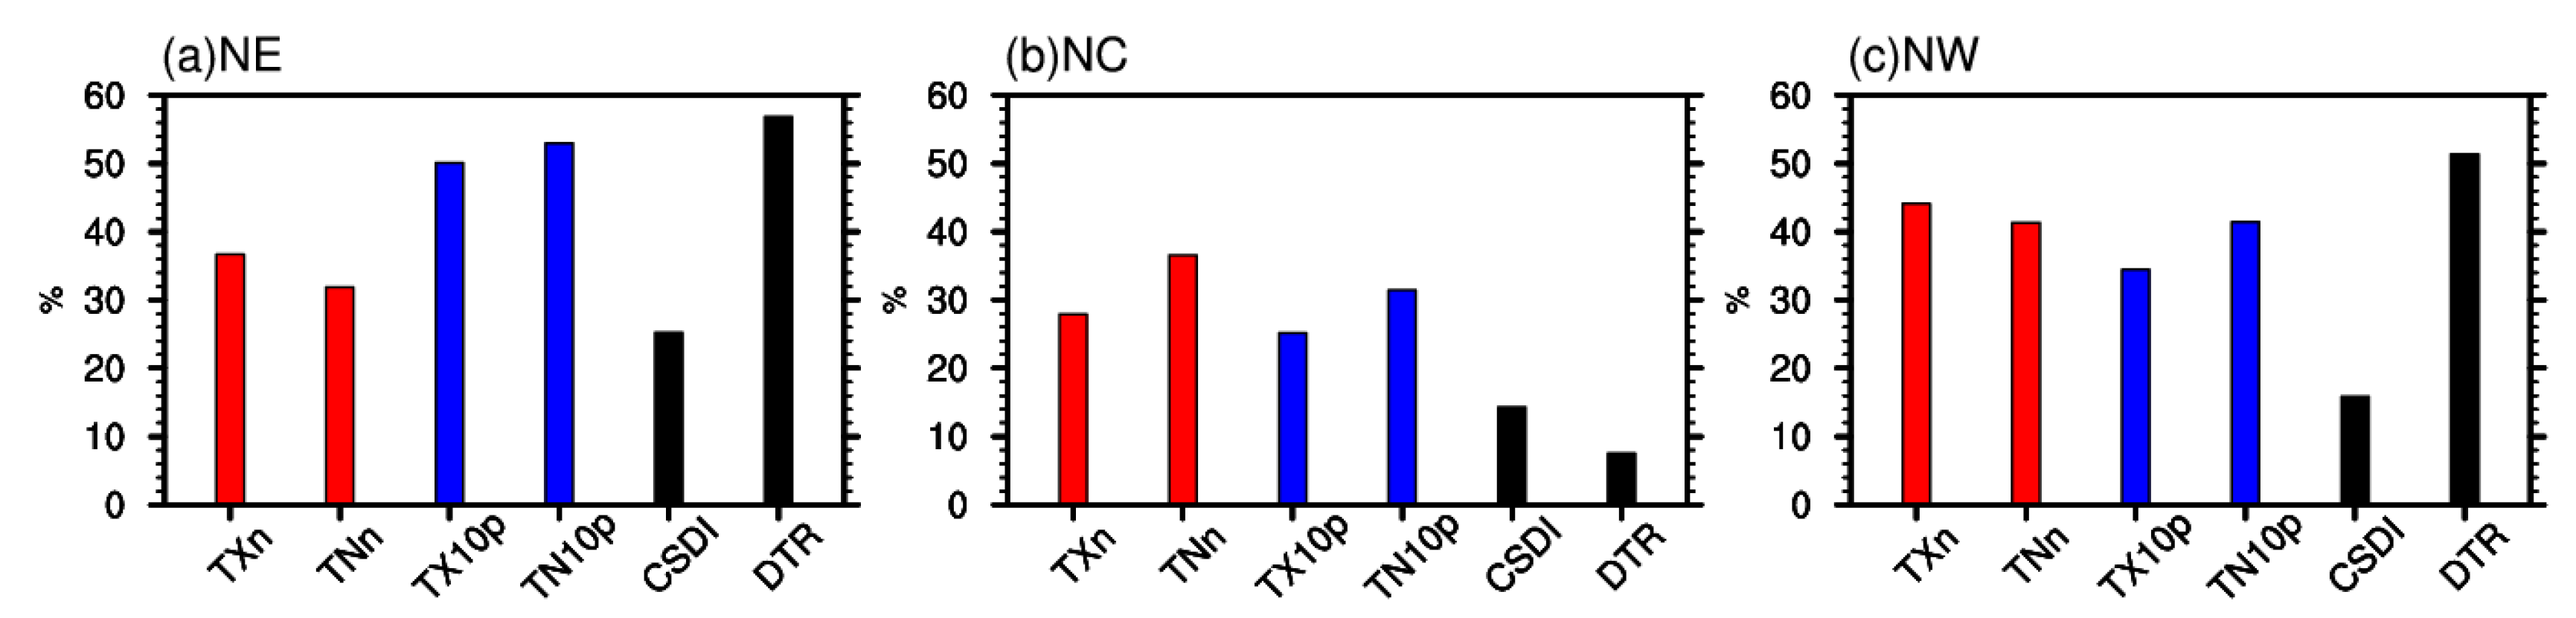
Formula (3) was used to quantify the avoided influence (AI) in the 1.5 °C scenario compared to the 2 °C warming level (Figure 12 and Table 3). All positive results mean negative values in the context of 2.0 degrees, that is, a reduction in the avoiding of influence, which is consistent with the logic of this paper. The AI changes for the six indices between 1.5 °C and 2.0 °C warming are shown in Table 3. Compared to 2.0 °C global warming, half a degree less of warming in the future will help increase the intensity of extreme low temperature events by 28–56% (TXn, TNn, and DTR), increase of the frequency of extreme low temperature events by about 24–54% (TX10p and TN10p), and increase the duration of extreme low temperature events by 6–25% (CSDI) in Northern China. In general, holding global warming at less than 1.5 °C rather than 2.0 °C could avoid a 6–56% reduction in the intensity, frequency, and duration of extreme temperature events in Northern China. The corresponding largest values in NE and NW were found to be 24–56% and 14–52%, respectively.
4. Conclusions and Discussion
We used the CESM low-warming simulation results to evaluate changes in extreme low temperature events over Northern China under 1.5 °C and 2.0 °C global warming scenarios. The impacts of the 0.5 °C difference between these warming scenarios and the possible cause for the change of extreme low temperature were discussed in this paper.
It was found that China’s minimum SAT would be higher than the global minimum SAT by between 0.32 and 0.46 °C. Comparing 1.5 °C warming with 2.0 °C warming, the areas with greater increase (over 0.8 °C) in minimum winter SAT were found to be NW and NC.
In the 2.0 °C warmer future, extreme low temperature events will decrease more in NE and NW than in NC in regard to intensity, frequency, duration, and DTR compared to the 1.5 °C scenario. The response to the extra half-degree of global warming will be largely linear, although the rise will vary by region. Compared to 2.0 °C global warming, the half-degree less of warming under 1.5 °C global warming will cause an increase of 6–56% in the intensity, 24–50% in the frequency, and 14–24% in the duration of extreme low temperature events.
Furthermore, it was found that the probability ratios of extreme low temperature events will decrease under 1.5 °C and 2.0 ℃ global warming backgrounds, and an increase of 0.5 degrees will result in a greater reduction in the PRs of extreme cold events.
The possible cause for the change of extreme low temperature in Northern China was discussed here. Preliminary analysis of net surface radiation flux (Figure S1) and 500 hPa geopotential height (Figure S2) indicated an enhancement of net radiation in Northern China and a weakening of the East Asian trough in winter under 1.5 °C/2.0 °C warming. These can potentially explain the increase of winter temperature in Northern China under these two scenarios, but further analysis is needed in our future work, including the changes of temperature advection, East Asian winter monsoon system, Arctic Oscillation, underlying surface factors (e.g., sea surface temperature, sea ice, soil moisture), and so on. In addition, multi-model low-warming simulations and multi-model outputs from the CMIP5 and the coming CMIP6 are also needed to explore the changes and causes of extreme low temperature in Northern China under 1.5 °C/2.0 °C global warming.
Supplementary Materials
The following are available online at https://www.mdpi.com/2073-4433/10/1/1/s1, Figure S1: Regional mean changes in 500 hPa geopotential height in (a) 1.5 °C warming relative to the present day, (b) 2.0 °C warming relative to the present day, and (c) 2.0 °C warming relative to 1.5 °C warming. The dotted areas are statistically significant at the 5% level according to the Student’s t-test, Figure S2: Regional mean changes in surface net radiation flux in (a) 1.5 °C warming relative to the present day, (b) 2.0 °C warming relative to the present day, and (c) 2.0 °C warming relative to 1.5 °C warming. The dotted areas are statistically significant at the 5% level according to the Student’s t-test.
Author Contributions
Data curation, G.Z. (Guwei Zhang); Formal analysis, W.H.; Funding acquisition, G.Z. (Gang Zeng); Methodology, W.H.; Resources, G.Z. (Gang Zeng); Supervision, G.Z. (Gang Zeng) and Z.L.; Writing–Original draft, W.H.; Writing–Review & editing, G.Z. (Gang Zeng)
Funding
This research was funded by [the National Key Research and Development Program of China] grant number [2017YFA0603804] and [the National Nature Science Foundations of China] grant number [41575085 and 41430528].
Conflicts of Interest
The authors declare no conflict of interest.
References
- IPCC. Climate Change 2013: The Physical Sciences Basis. Contribution of Working Group I to the Fifth Assessment Report of the Intergovernmental Panel on Climate Change; Cambridge University Press: Cambridge, UK; New York, NY, USA, 2013; p. 1535. [Google Scholar]
- Zhou, B.; Xu, Y.; Wu, J.; Dong, S.; Shi, Y. Changes in temperature and precipitation extreme indices over China: Analysis of a high-resolution grid dataset. Int. J. Climatol. 2016, 36, 1051–1066. [Google Scholar] [CrossRef]
- Zeng, N.; Ding, Y.H.; Pan, J.H.; Zing, N.; Ding, Y.; Pan, J.; Wang, H.; Gregg, J. Climate change—The Chinese challenge. Science 2008, 319, 730–731. [Google Scholar] [CrossRef] [PubMed]
- UNFCCC. Adoption of the Paris Agreement. Proposal by the President. Report No.FCCC/CP/2015/L.9/Rev.1. Proposal by the President. 2015. Available online: https://unfccc.int/sites/default/files/resource/docs/2015/cop21/eng/l09r01.pdf (accessed on 12 December 2015).
- Schleussner, C.F.; Lissner, T.K.; Fischer, E.M.; Wohland, J.; Perrette, M.; Golly, A.; Rogelj, J.; Childers, K.; Schewe, J.; Frieler, K.; et al. Differential climate impacts for policy-relevant limits to global warming: The case of 1.5 °C and 2 °C. Earth Syst. Dyn. 2016, 7, 327–351. [Google Scholar] [CrossRef]
- Hur, J.; Ahn, J.B.; Shim, K.M. The change of cherry first-flowering date over South Korea projected from downscaled IPCC AR5 simulation. Int. J. Climatol. 2014, 34, 2308–2319. [Google Scholar] [CrossRef]
- Dosio, A.; Fischer, E.M. Will half a degree make a difference? Robust projections of indices of mean and extreme climate in Europe under 1.5 °C, 2 °C, and 3 °C global warming. Geophys. Res. Lett. 2018, 45, 935–944. [Google Scholar] [CrossRef]
- Jiang, D.; Sui, Y.; Lang, X. Timing and associated climate change of a 2 °C global warming. Int. J. Climatol. 2016, 36, 4512–4522. [Google Scholar] [CrossRef]
- Sui, Y.; Lang, X.; Jiang, D. Projected signals in climate extremes over China associated with a 2 °C global warming under two RCP scenarios. Int. J. Climatol. 2018, 38, e678–e697. [Google Scholar] [CrossRef]
- Yang, J.H.; Ren, C.Y.; Jiang, Z.H. Characteristics of Extreme Temperature Event and Its Response to Regional Warning in Northwest China in Past 45 Years. Chin. Geogr. Sci. 2008, 18, 70–76. [Google Scholar] [CrossRef]
- Pal, I.; Al-Tabbaa, A. Long-term changes and variability of monthly extreme temperatures in India. Theor. Appl. Climatol. 2010, 100, 45–56. [Google Scholar] [CrossRef]
- You, Q.L.; Kang, S.C.; Aguilar, E.; Pepin, N.; Flügel, W.A.; Yan, Y.; Xu, Y.; Zhang, Y.; Huang, J. Changes in daily climate extremes in China and their connection to the large scale atmospheric circulation during 1961–2003. Clim. Dyn. 2011, 36, 2399–2416. [Google Scholar] [CrossRef]
- Su, B.D.; Jiang, T.; Jin, W.B. Recent trends in observed temperature and precipitation extremes in the Yangtze River basin, China. Theor. Appl. Climatol. 2006, 83, 139–151. [Google Scholar] [CrossRef]
- Chen, X.C.; Xu, Y.; Yao, Y. Changes in climate extremes over China in a 2 °C, 3 °C and 4 °C warmer world. Chin. J. Atmos. Sci. 2015, 39, 1123–1135. [Google Scholar] [CrossRef]
- Yao, Y.; Luo, Y.; Huang, J.B. Evaluation and projection of temperature extremes over China based on 8 modeling data from CIMP5. Adv. Clim. Change 2012, 8, 250–256. [Google Scholar]
- Yang, J.H.; Shen, Y.P.; Wang, P.X.; Yang, Q.G. Extreme low temperature events in Northwest China and their response to regional warming in the recent 45 Years. J. Glaciol. Geocryol. 2007, 29, 536–542. [Google Scholar]
- Zhang, Y.; Cao, L.J.; Xu, Y.L.; Dong, W.J. Scenario analyses on future changes of extreme temperature events over China. J. Appl. Meteorol. Sci. 2008, 19, 655–660. [Google Scholar]
- Yu, R.; Zhai, P.; Lu, Y. Implications of differential effects between 1.5 and 2 °C global warming on temperature and precipitation extremes in China’s urban agglomerations. Int. J. Climatol. 2017, 38, 2374–2385. [Google Scholar] [CrossRef]
- Sanderson, B.M.; Xu, Y.; Tebaldi, C.; Wehner, M.; O’Neill, B.C.; Jahn, A.; Pendergrass, A.G.; Lehner, F.; Strand, W.G.; Lin, L.; et al. Community climate simulations to assess avoided impacts in 1.5 and 2 °C futures. Earth Syst. Dyn. 2017, 8, 827–847. [Google Scholar] [CrossRef]
- Nangombe, S.; Zhou, T.; Zhang, W.; Wu, B.; Hu, S.; Zou, L.; Li, D. Record-breaking climate extremes in Africa under stabilized 1.5 °C and 2 °C global warming scenarios. Nat. Clim. Change 2018, 8, 375–380. [Google Scholar] [CrossRef]
- Kay, J.E.; Kay, J.E.; Deser, C.; Phillips, A.; Mai, A.; Hannay, C.; Strand, G.; Arblaster, J.M.; Bates, S.C.; Danabasoglu, G.; et al. The community earth system model (CESM) large ensemble project: A community resource for studying climate change in the presence of internal climate variability. Bull. Am. Meteorol. Soc. 2015, 96, 1333–1349. [Google Scholar] [CrossRef]
- Li, D.H.; Zhou, T.J.; Zou, L.W.; Zhang, W.X.; Zhang, L.X. Extreme high-temperature events over East Asia in 1.5 °C and 2 °C warmer futures: Analysis of NCAR CESM low-warming experiments. Geophys. Res. Lett. 2018, 45, 1541–1550. [Google Scholar] [CrossRef]
- Lin, L.; Wang, Z.L.; Xu, Y.Y.; Zhang, X.Y.; Zhang, H.; Dong, W.J. Additional Intensification of Seasonal Heat and Flooding Extreme Over China in a 2 °C Warmer World Compared to 1.5 °C. Earth Future 2018, 6, 968–972. [Google Scholar] [CrossRef]
- Xu, Y.; Gao, X.J.; Shen, Y.; Xu, C.H.; Shi, Y.; Giorgi, F. A daily temperature dataset over China and its application in validating a RCM simulation. Adv. Atmos. Sci. 2009, 26, 763–772. [Google Scholar] [CrossRef] [Green Version]
- Wu, J.; Gao, X.J. A gridded daily observation dataset over China region and comparison with the other datasets. Chin. J. Geophys. 2013, 56, 1102–1111. (In Chinese) [Google Scholar]
- Karl, T.R.; Nicholls, N.; Ghazi, A. Clivar/GCOS/WMO Workshop on Indices and Indicators for Climate Extremes Workshop Summary. Clim. Change 1999, 42, 3–7. [Google Scholar] [CrossRef]
- Tao, S.Y. Ten years in our country the study of cold wave in east Asia. Acta Meteorol. 1959, 30, 226–230. [Google Scholar]
- Chen, S.H.; Wang, J.S.; Ren, Y.; Qian, L. Evaluative characteristic of extreme minimum temperature of northwest China in recent 49 years. Plateau Meteorol. 2011, 30, 1266–1273. [Google Scholar]
- Liang, M.; Wu, L.G. Analysis of features of summer extreme high temperature in eastern China. J. Meteorol. Sci. 2015, 35, 701–709. [Google Scholar]
- Jung, T. Systematic errors of the atmospheric circulation in the ECMWF forecasting system. Q. J. R. Meteorol. Soc. 2005, 131, 1045–1073. [Google Scholar] [CrossRef] [Green Version]
- Scott, P.A.; Stone, D.A.; Allen, M.R. Human contribution to the European heatwave of 2003. Nature 2004, 432, 610–614. [Google Scholar]
- Ma, S.; Zhou, T.; Stone, D.A.; Polson, D.; Dai, A.; Stott, P.A.; von Storch, H.; Qian, Y.; Burke, C.; Wu, P.; et al. Detectable anthropogenic shift toward heavy precipitation over eastern China. J. Clim. 2017, 30, 6543–6560. [Google Scholar] [CrossRef]
- Taylor, K.E. In a Single Diagram. J. Geophys. Res. Atmos. 2001, 106, 7183–7192. [Google Scholar] [CrossRef]
- Cannon, A.J.; Sobie, S.R.; Murdock, T.Q. Bias correction of GCM precipitation by quantile mapping: How well do methods preserve changes in quantiles and extremes? J. Clim. 2015, 28, 6938–6959. [Google Scholar] [CrossRef]
- Dosio, A. Projections of climate change indices of temperature and precipitation from an ensemble of bias-adjusted high-resolution EURO-CORDEX regional climate models. J. Geophys. Res. Atmos. 2016, 121, 5488–5511. [Google Scholar] [CrossRef] [Green Version]
- Li, W.; Jiang, Z.; Zhang, X.; Li, L.; Sun, Y. Additional risk in extreme precipitation in China from 1.5 °C to 2.0 °C global warming levels. Sci. Bull. 2018, 63, 228–234. [Google Scholar] [CrossRef]
- Shi, C.; Jiang, Z.H.; Chen, W.L.; Li, L. Changes in temperature extremes over China under 1.5 °C and 2 °C global warming targets. Adv. Clim. Change Res. 2018. [Google Scholar] [CrossRef]
- Wang, A.Q.; Su, B.D.; Wang, Y.J.; Huang, J.L.; Wen, S.S.; Jiang, T. Variation of the extreme low-temperature events and farmland exposure under global warming of 1.5 °C and 2.0 °C. Acta Meteorol. Sin. 2017, 75, 415–428. [Google Scholar]
Figure 1.
Subregions of Northern China.
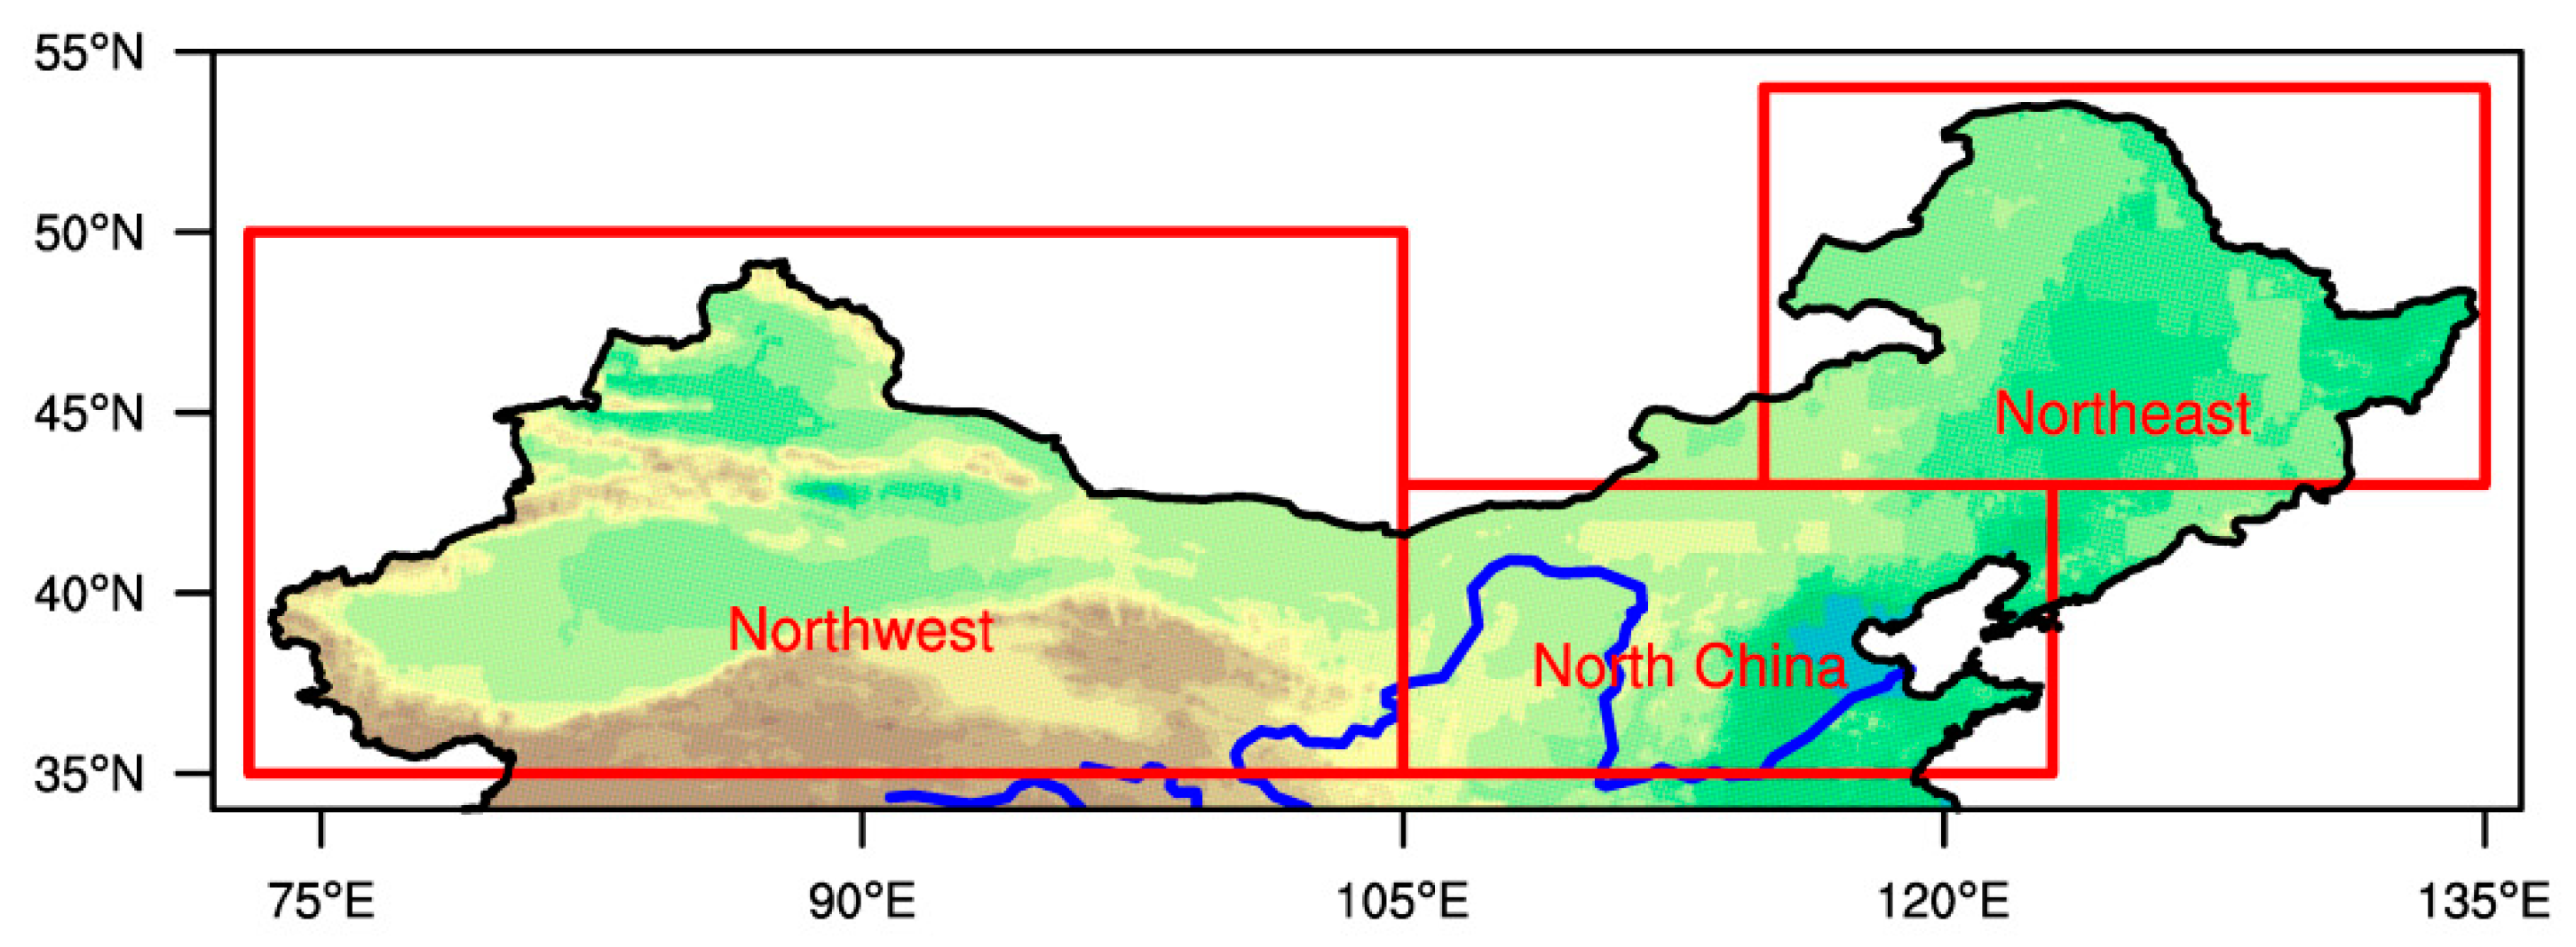
Figure 2.
(a) Taylor diagrams reflecting the performance of bias-corrected extreme indices from the model historical dataset for TXn (red), TNn (blue), CSDI (black), and DTR (purple) as compared with the observed data during 1976–2005 for Northwest China (NW), North China (NC), and Northeast China (NE). (b) The performance without the bias correction method. Angular axes show spatial corrections between simulated and observed indices; radial axes show spatial standard deviations normalized against the observed data. Each marker represents a region, identified by its number in the top left corner. For the models located between the two dashed lines, correlations are between 0.68 and 0.99.
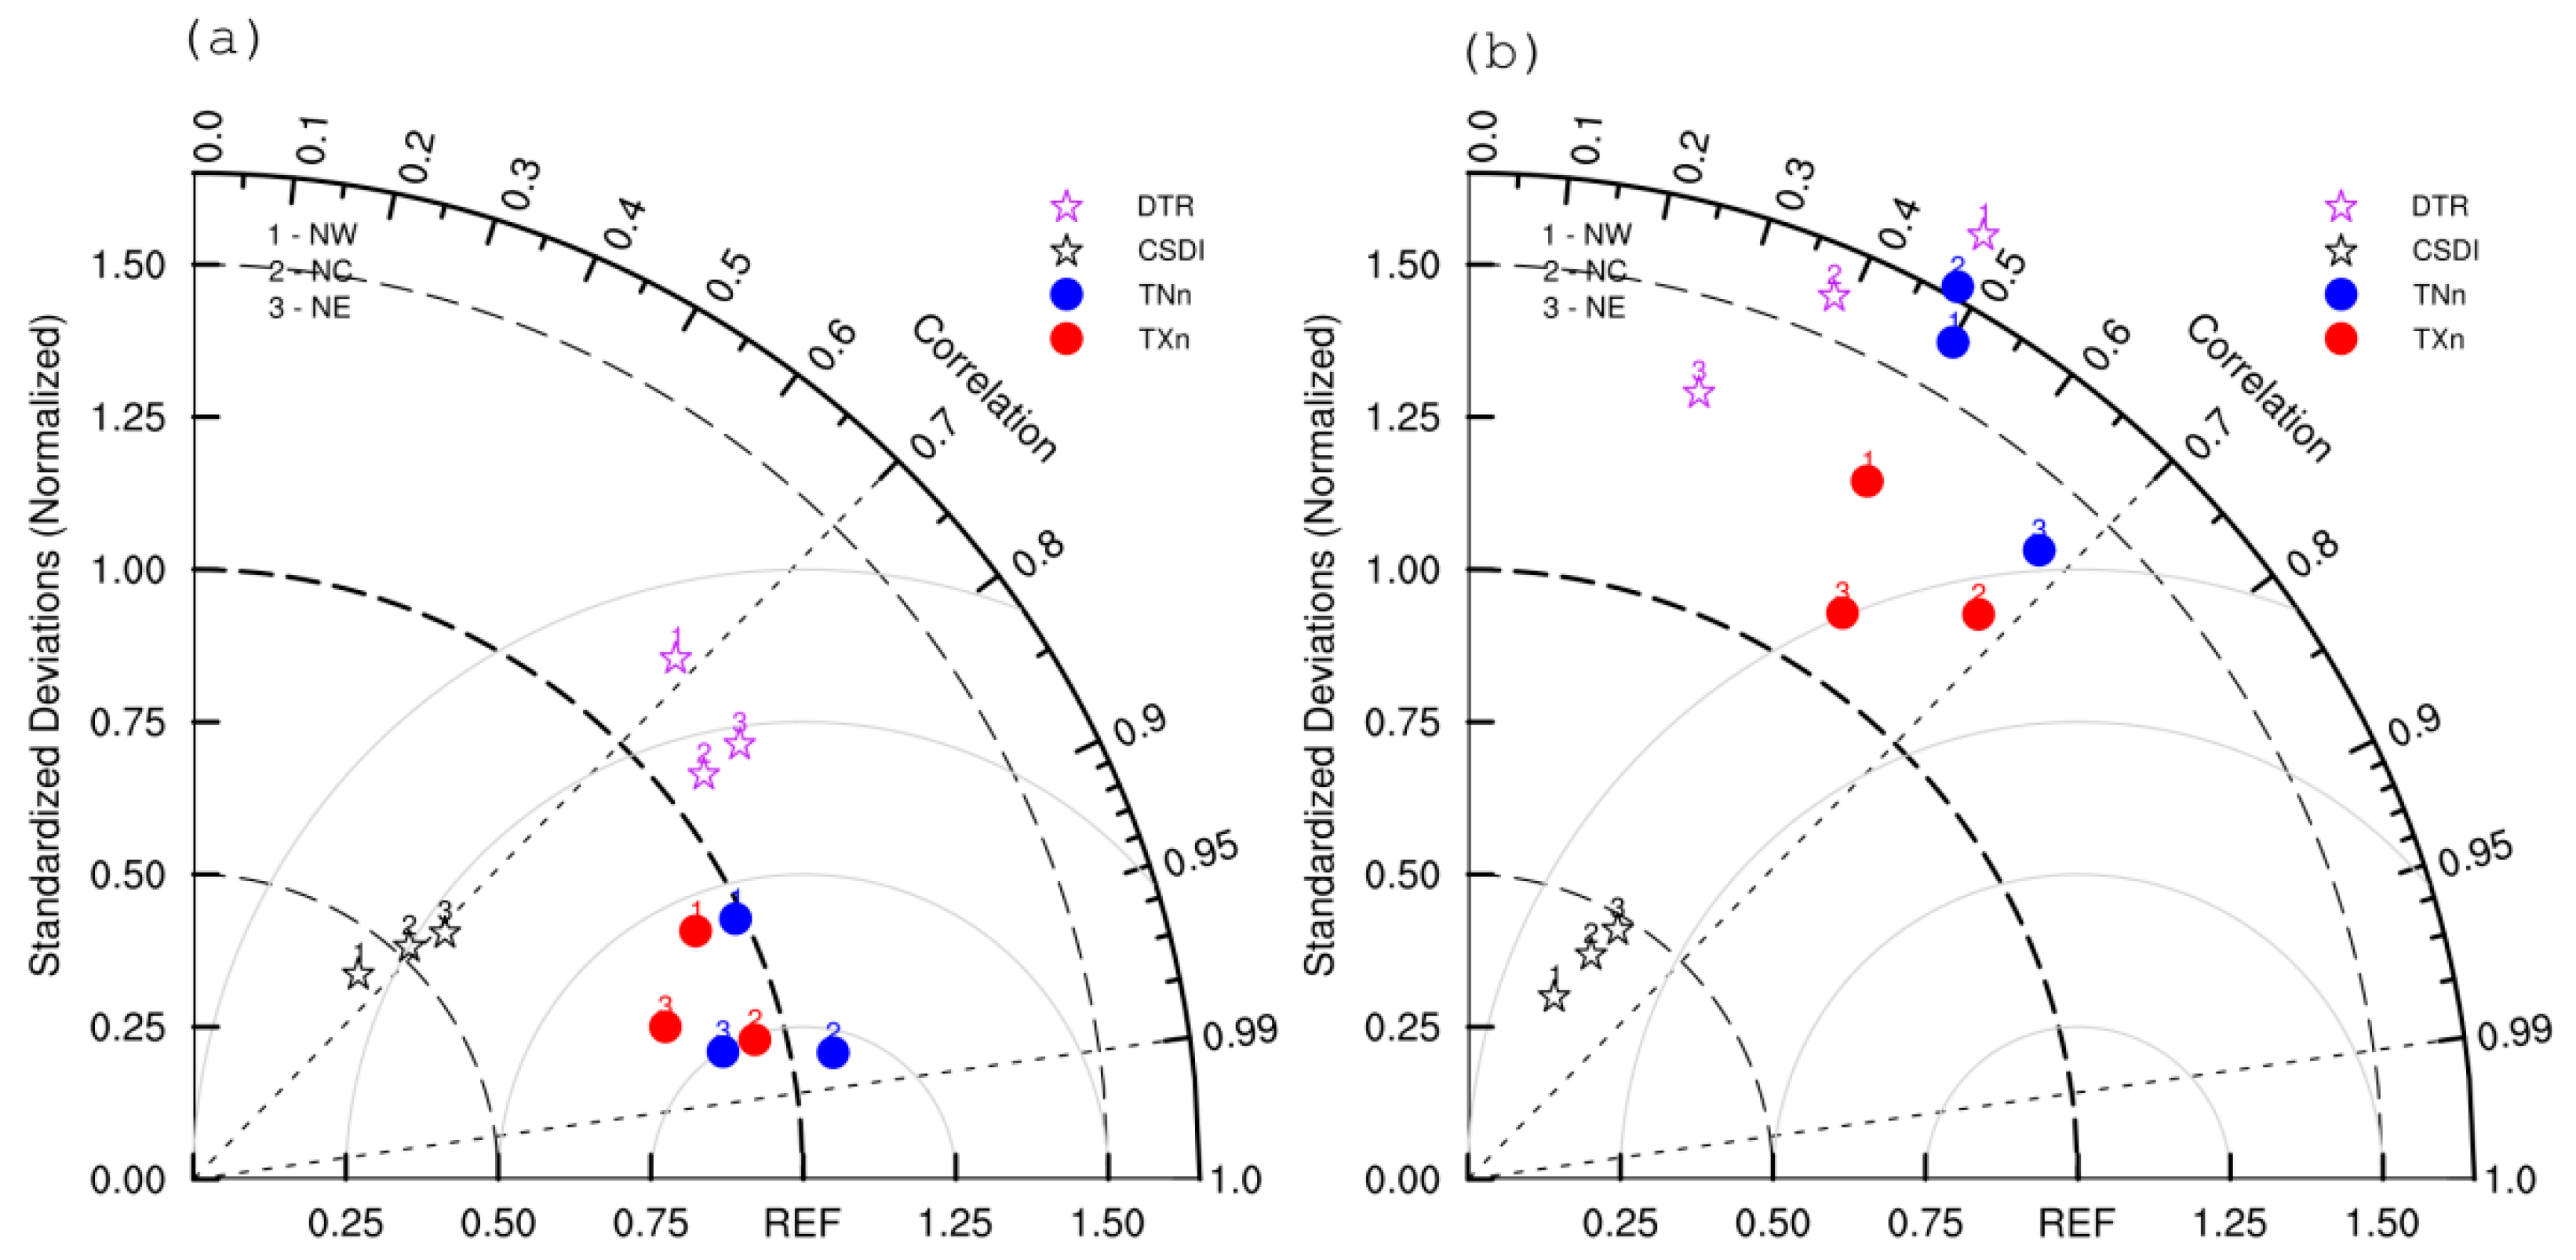
Figure 3.
Time series of the annual minimum surface air temperature (SAT) anomalies in China relative to preindustrial levels.
Figure 3.
Time series of the annual minimum surface air temperature (SAT) anomalies in China relative to preindustrial levels.

Figure 4.
Changes in minimum SAT in December, January, and February (DJF) of the years 2071–2100 relative to the present day (1976–2005) in (a) the 1.5 °C scenario, (b) the 2 °C scenario, and (c) their difference. The dotted areas are statistically significant at the 5% level according to the Student’s t-test.
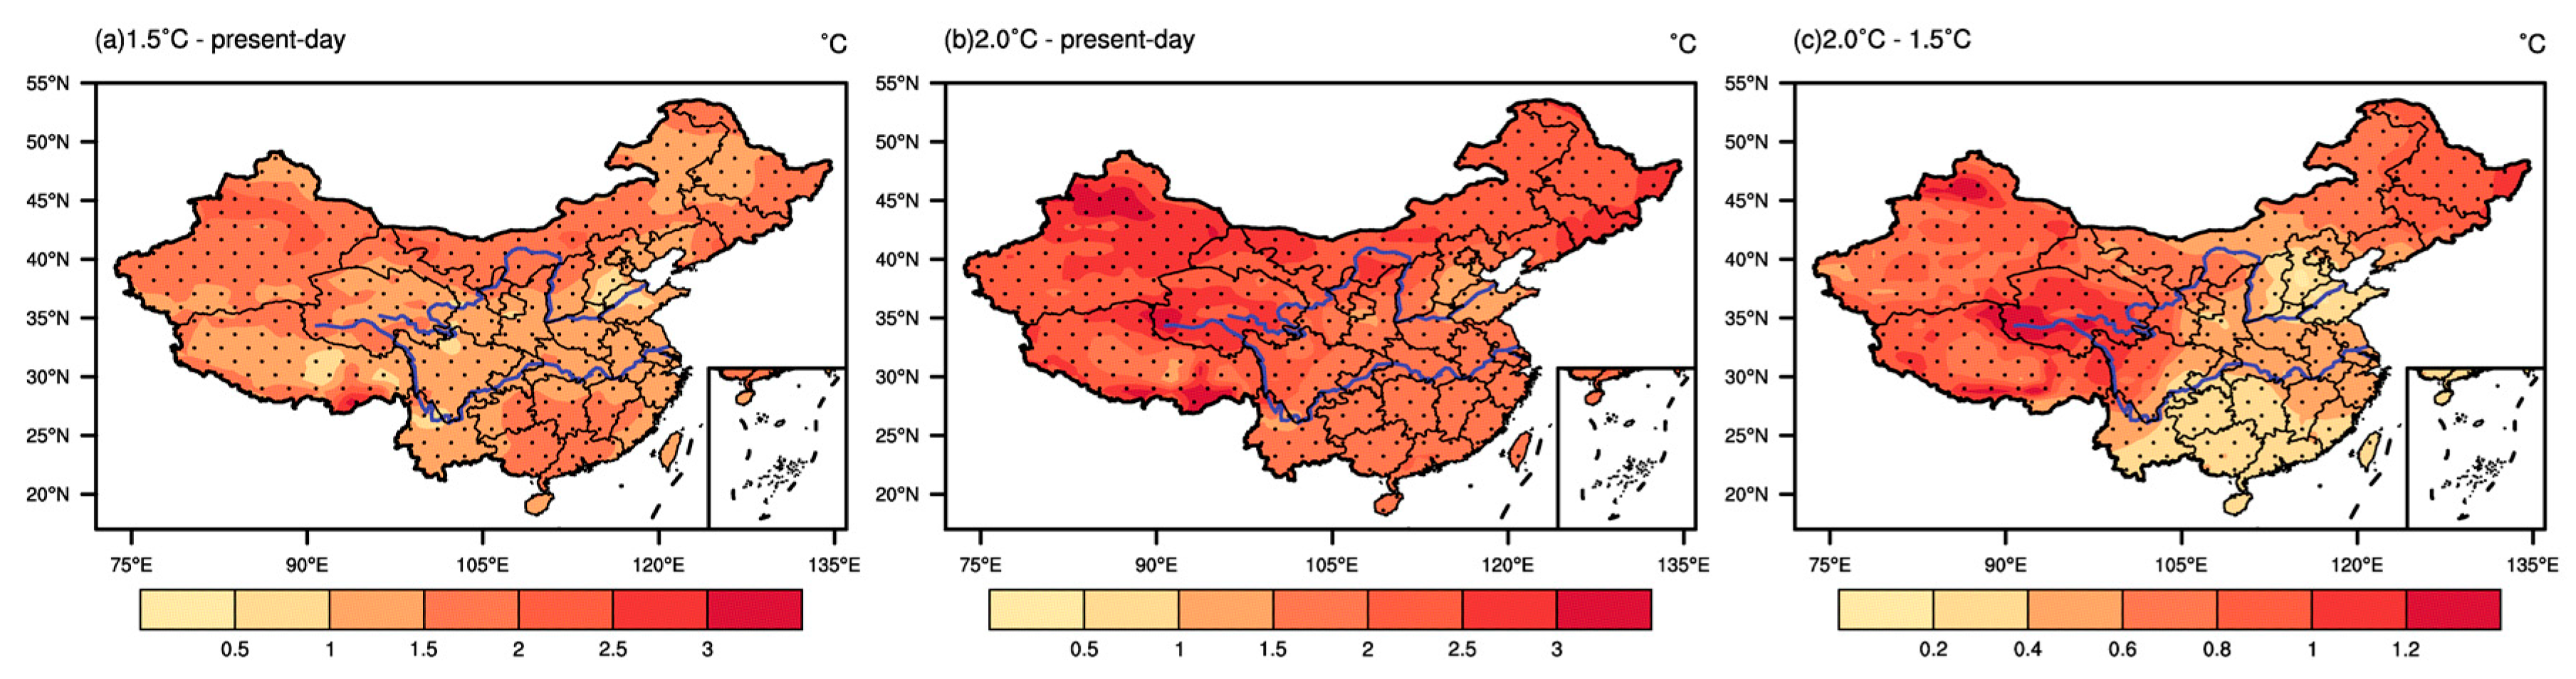
Figure 5.
Regional mean changes of TXn in (a)/(d) 1.5 °C warming relative to the present day, (b)/(e) 2.0 °C warming relative to the present day, and (c)/(f) 2.0 °C warming relative to 1.5 °C warming. The box and whisker plots show the 10th, 25th, 50th, 75th, and 90th percentiles. The dotted areas are statistically significant at the 5% level according to the Student’s t-test.

Figure 6.
Regional mean changes in TNn in (a)/(d) 1.5 °C warming relative to the present day, (b)/(e) 2.0 °C warming relative to the present day, and (c)/(f) 2.0 °C warming relative to 1.5 °C warming. The box and whisker plots show the 10th, 25th, 50th, 75th, and 90th percentiles. The dotted areas are statistically significant at the 5% level according to the Student’s t-test.
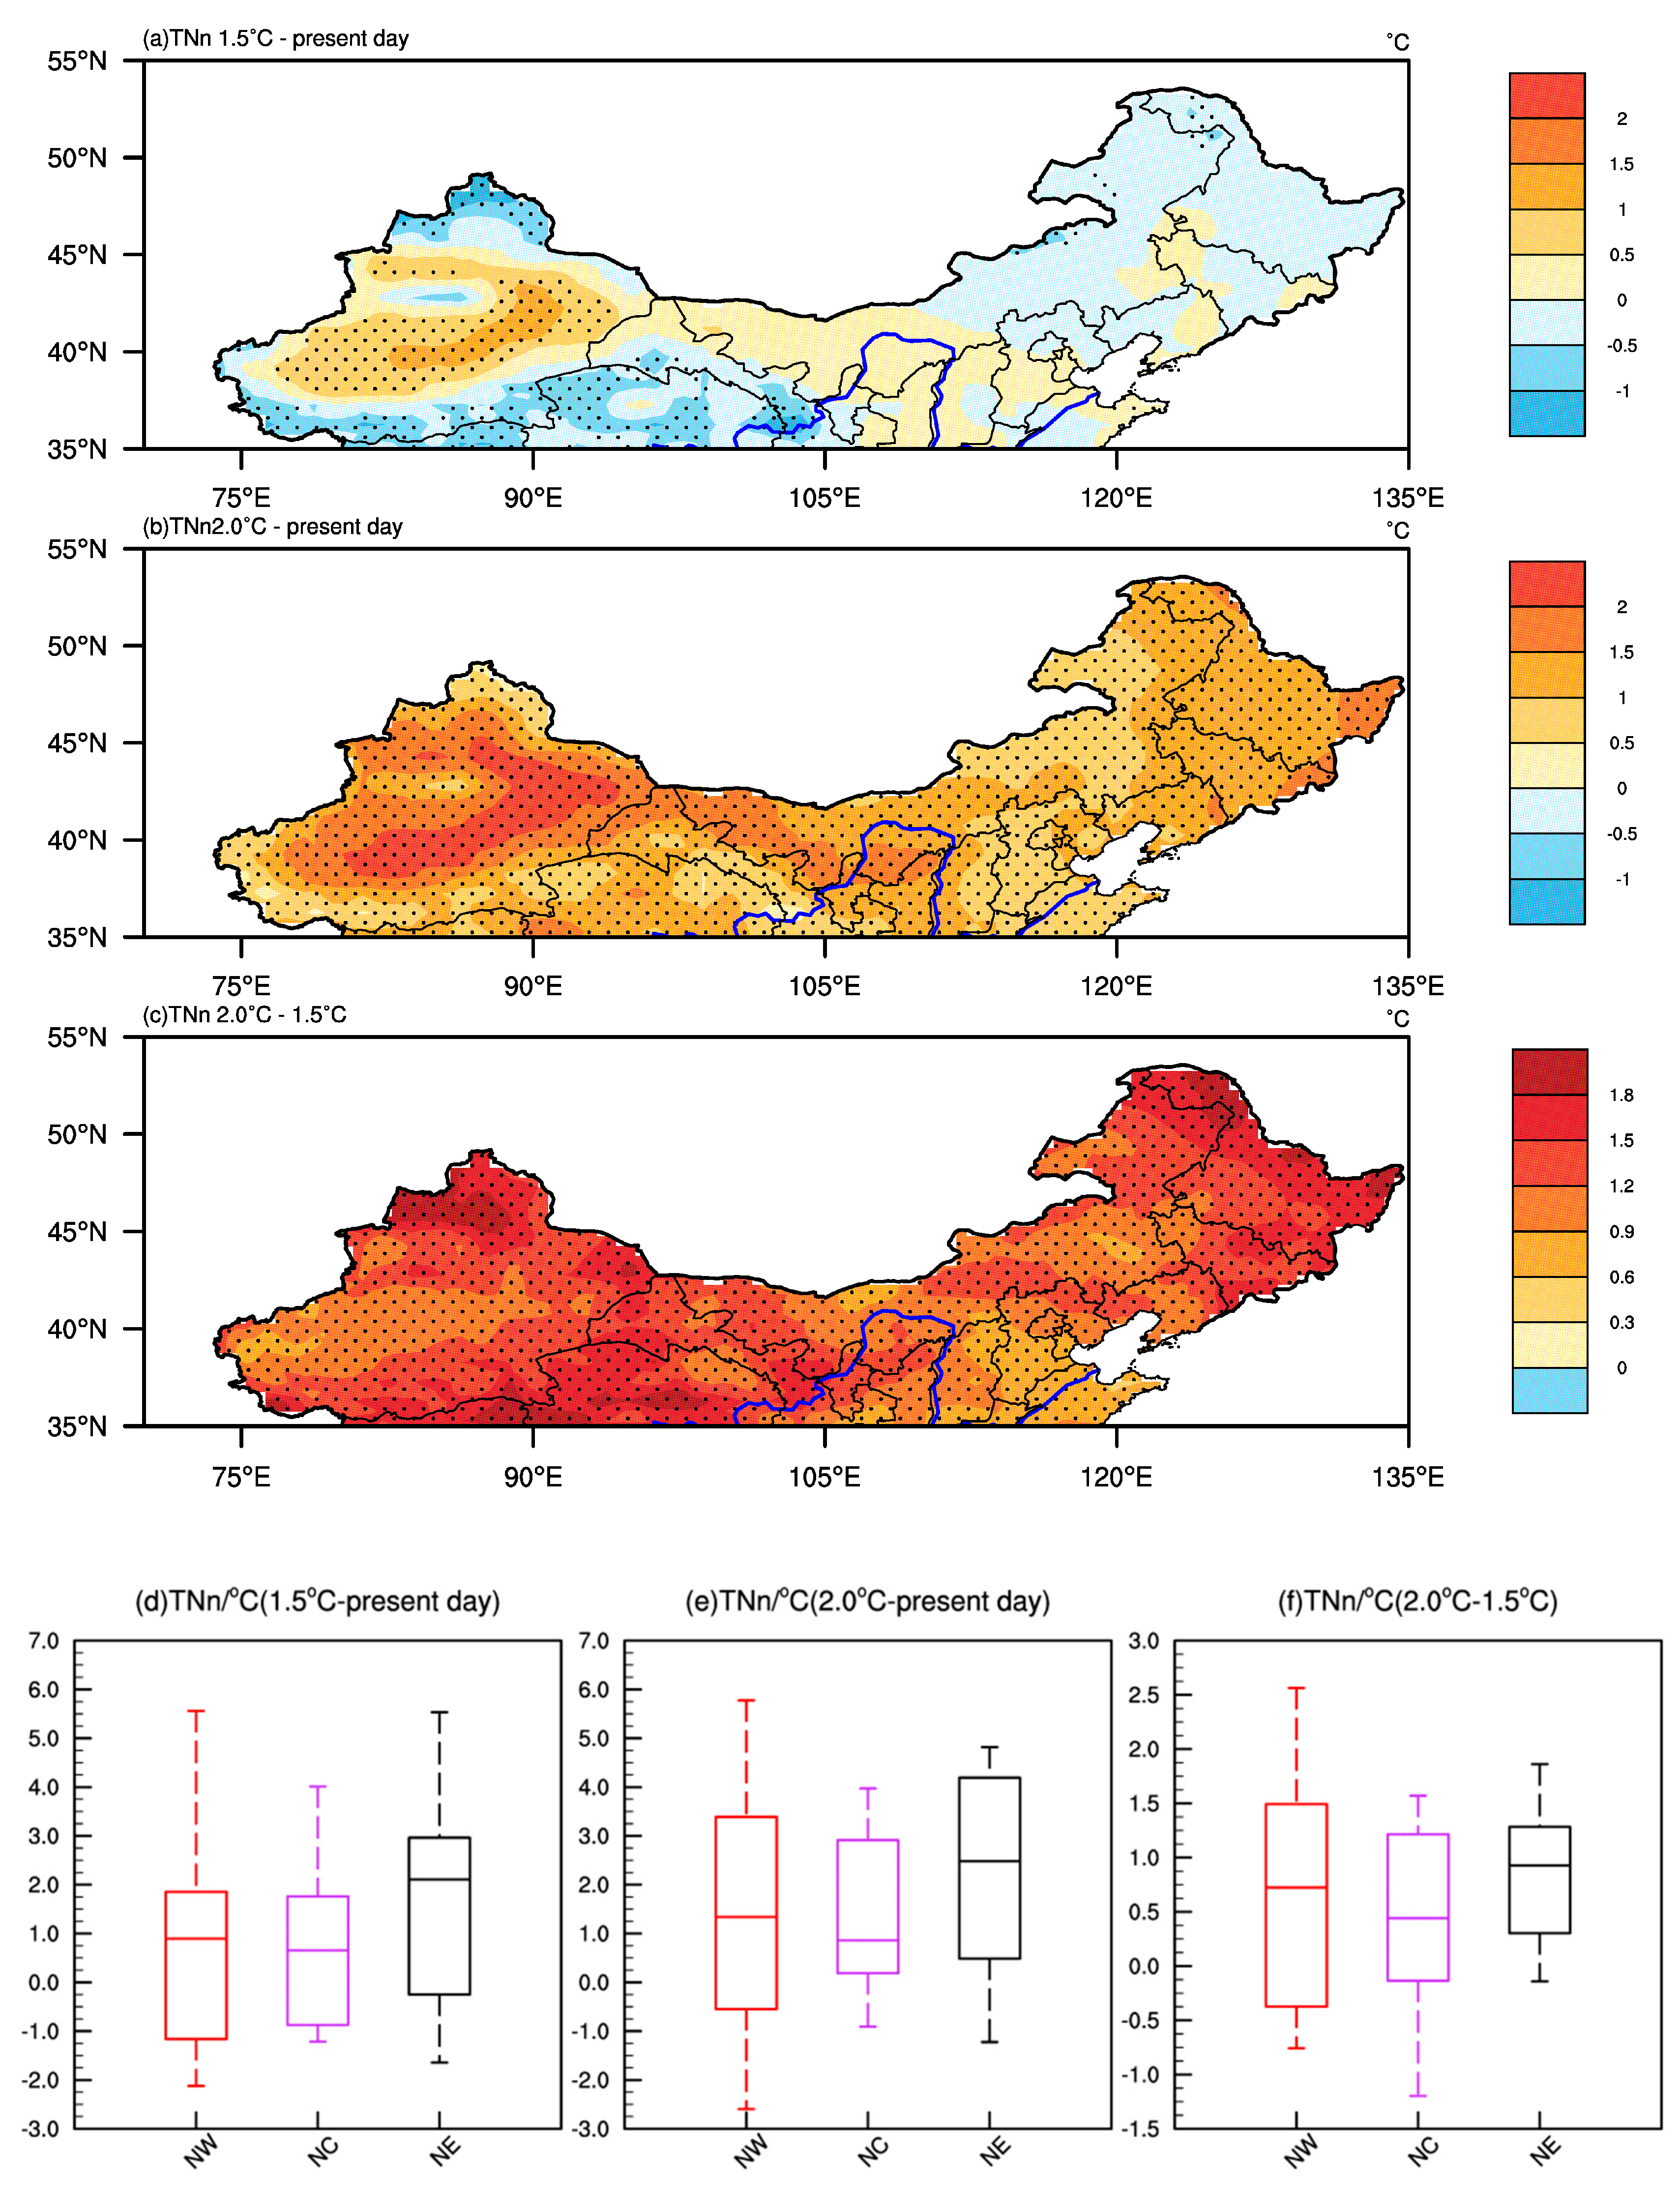
Figure 7.
Regional mean changes in DTR in (a)/(d) 1.5 °C warming relative to the present day, (b)/(e) 2.0 °C warming relative to the present day, and (c)/(f) 2.0 °C warming relative to 1.5 °C warming. The box and whisker plots show the 10th, 25th, 50th, 75th, and 90th percentiles. The dotted areas are statistically significant at the 5% level according to the Student’s t-test.
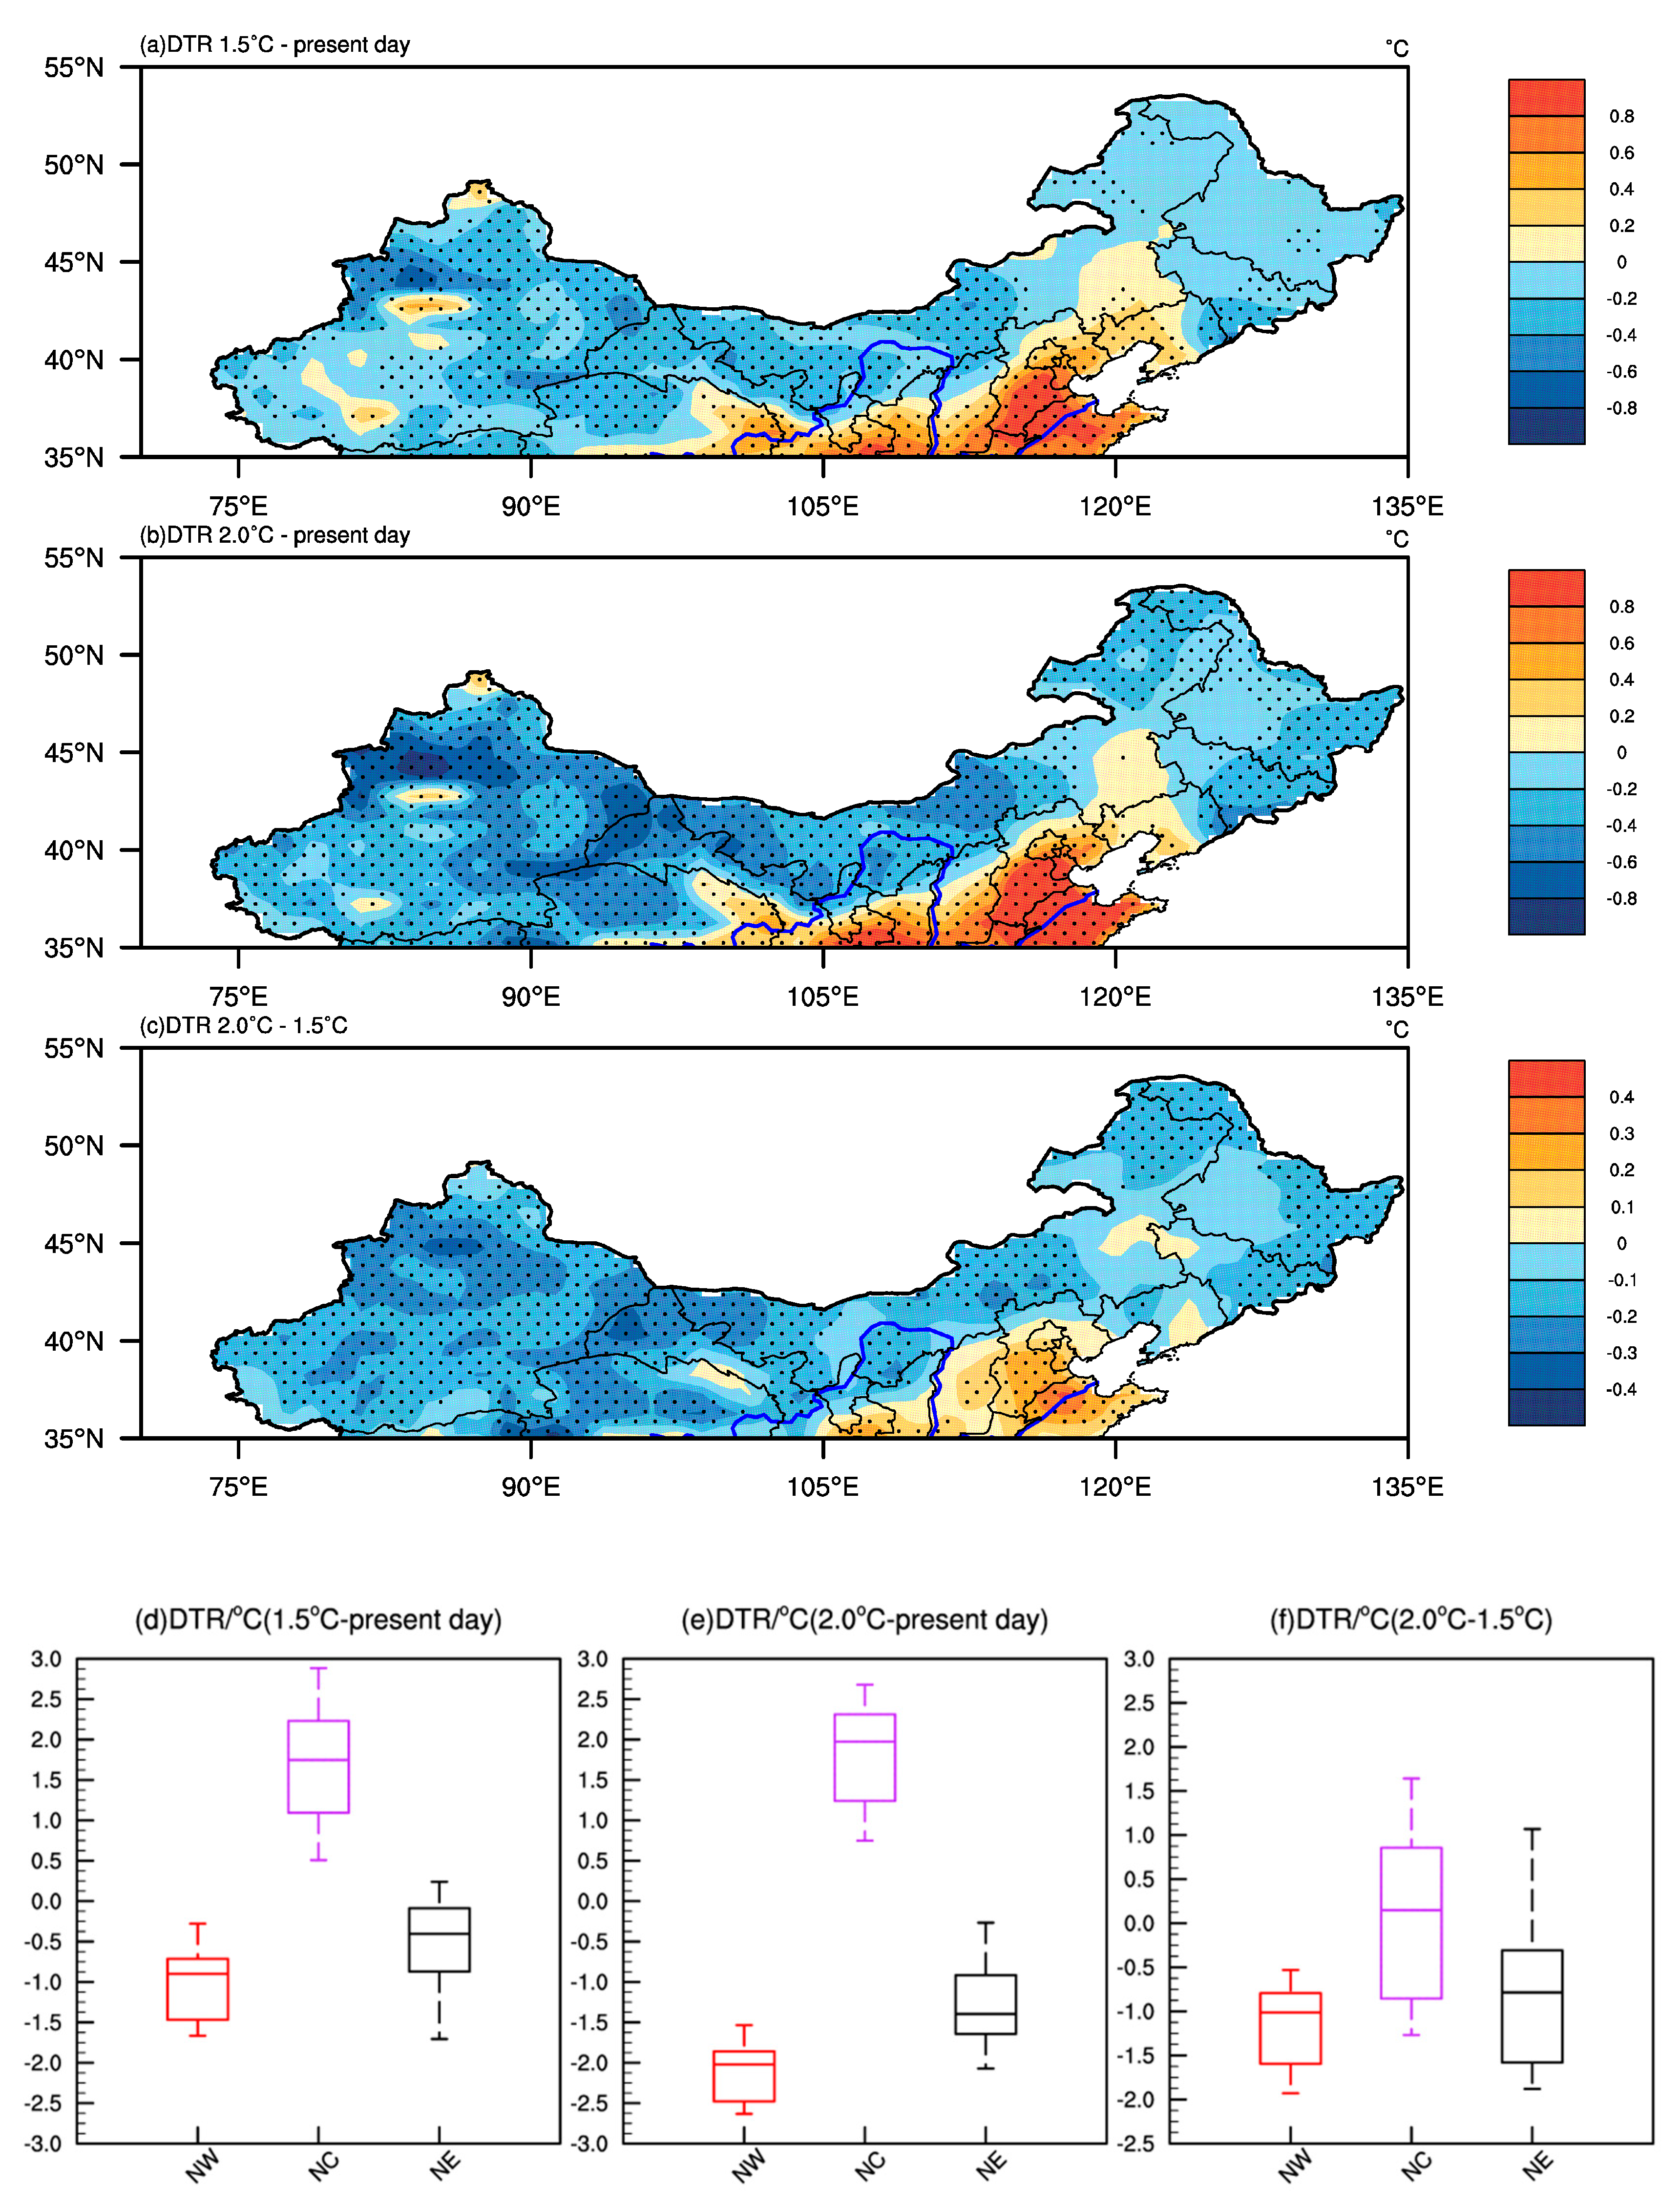
Figure 8.
Regional mean changes in TX10p in (a)/(d) 1.5 °C warming relative to the present day, (b)/(e) 2.0 °C warming relative to the present day, and (c)/(f) 2.0 °C warming relative to 1.5 °C warming. The box and whisker plots show the 10th, 25th, 50th, 75th, and 90th percentiles. The dotted areas are statistically significant at the 5% level according to the Student’s t-test.
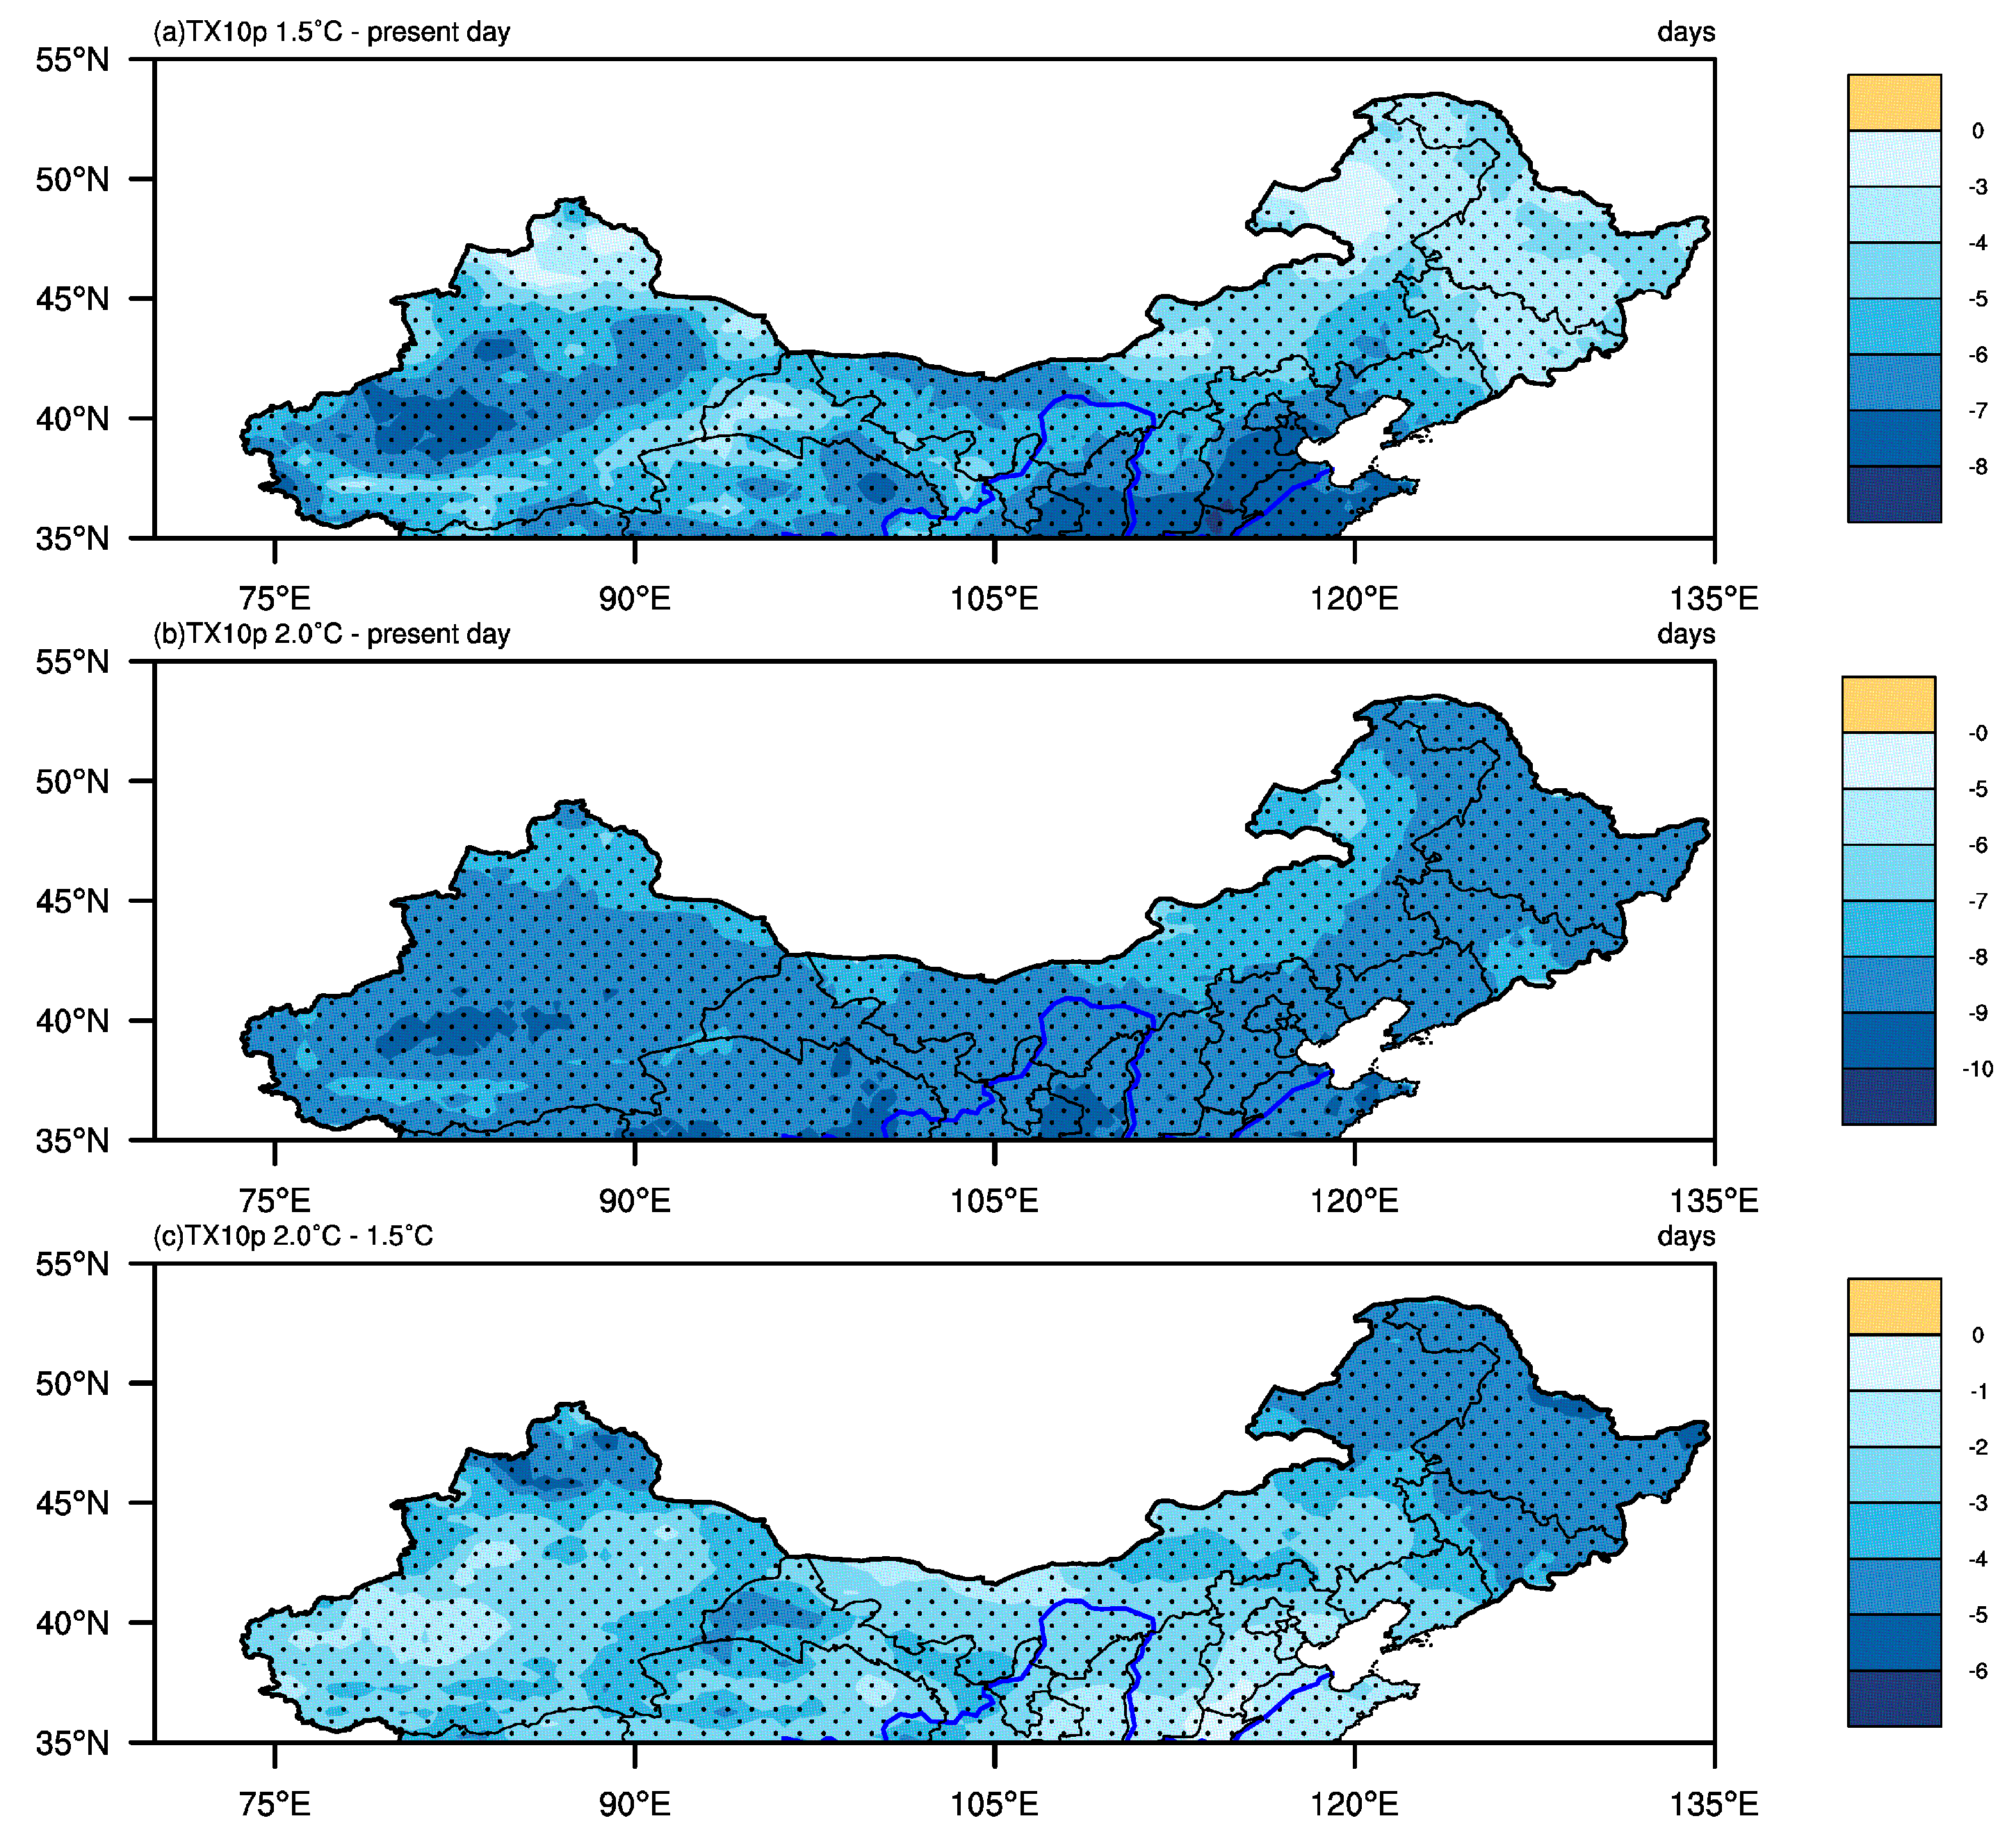
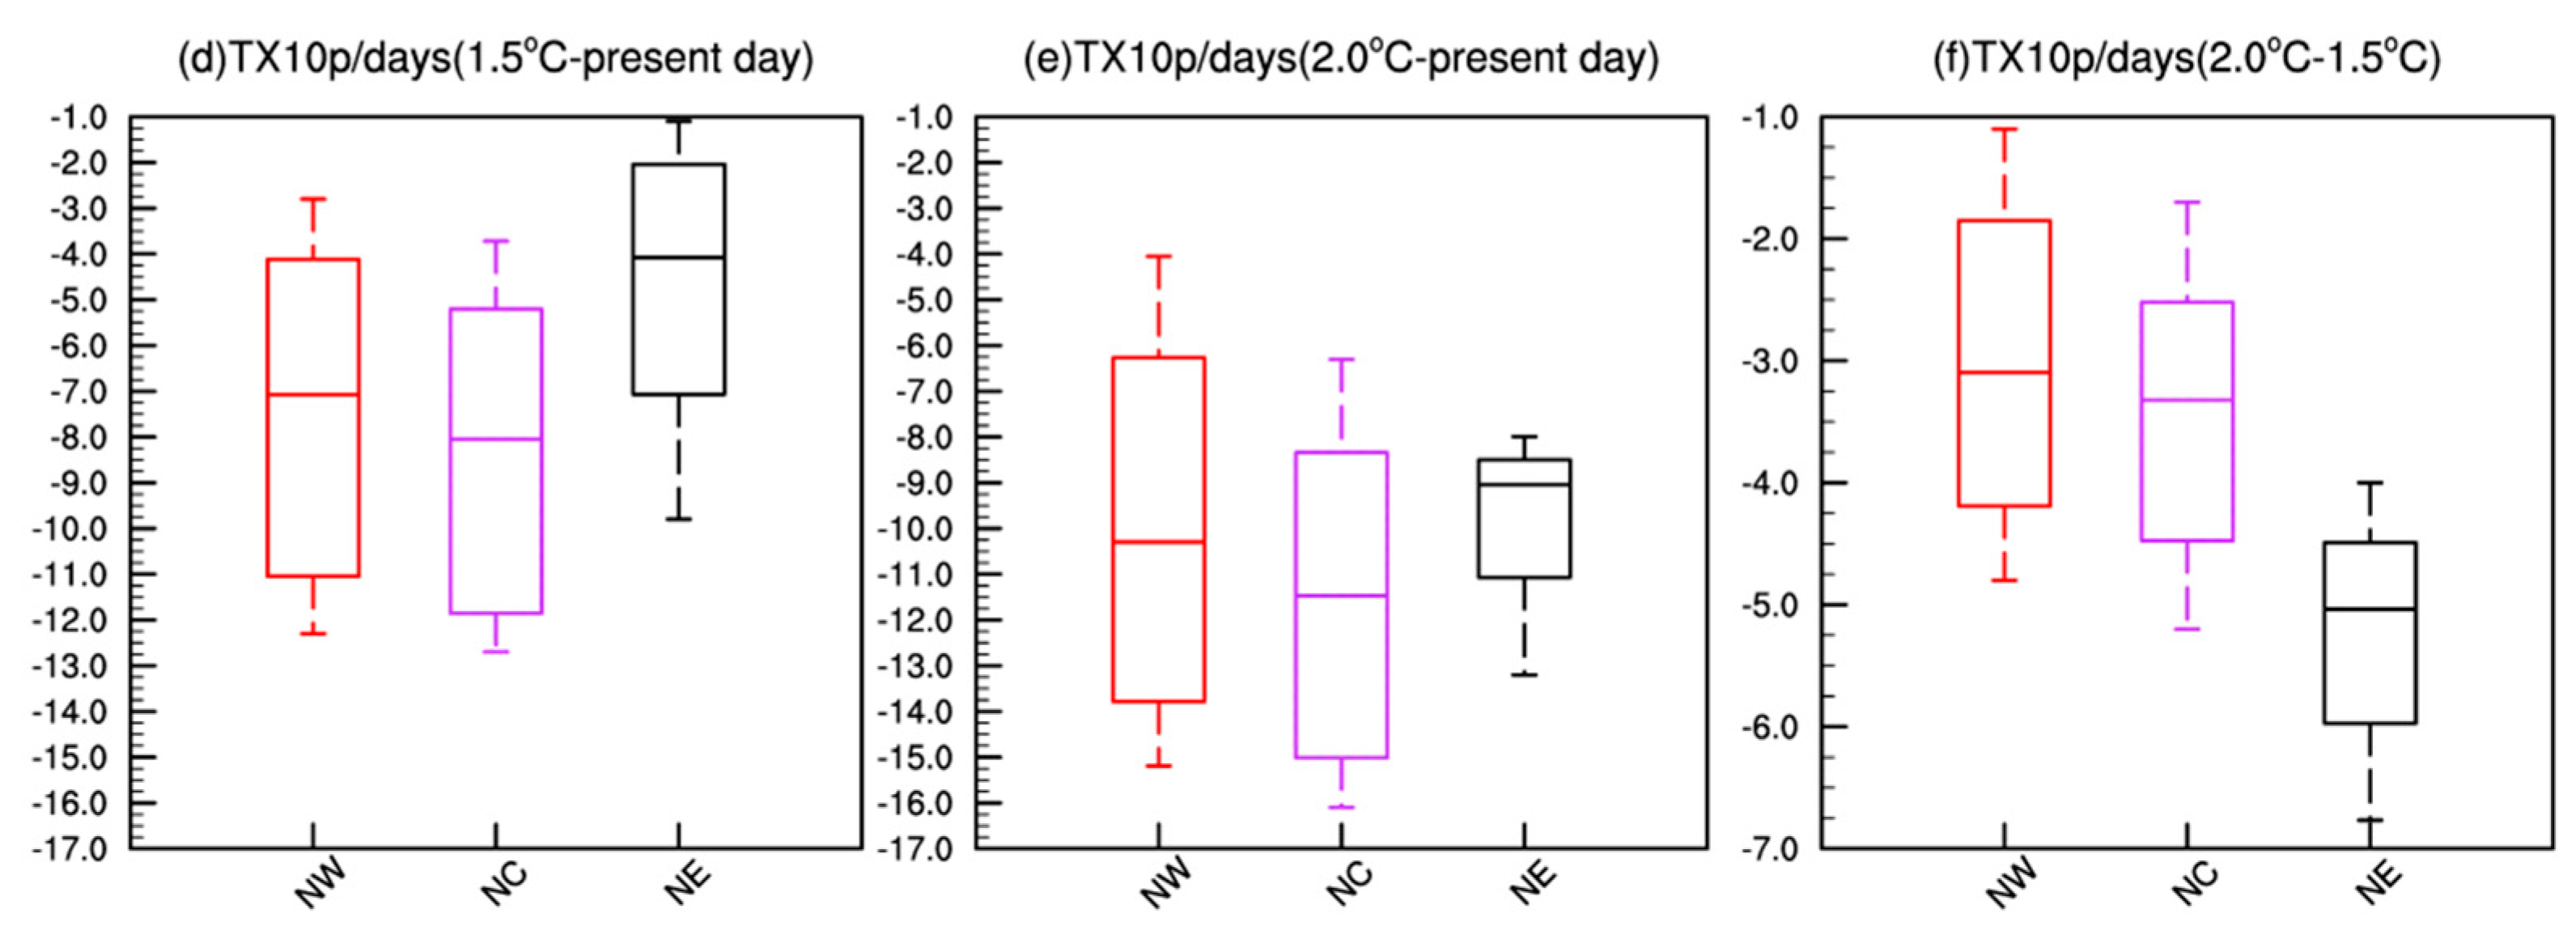
Figure 9.
Regional mean changes in TN10p in (a)/(d) 1.5 °C warming relative to the present day, (b)/(e) 2.0 °C warming relative to the present day, and (c)/(f) 2.0 °C warming relative to 1.5 °C warming. The box and whisker plots show the 10th, 25th, 50th, 75th, and 90th percentiles. The dotted areas are statistically significant at the 5% level according to the Student’s t-test.
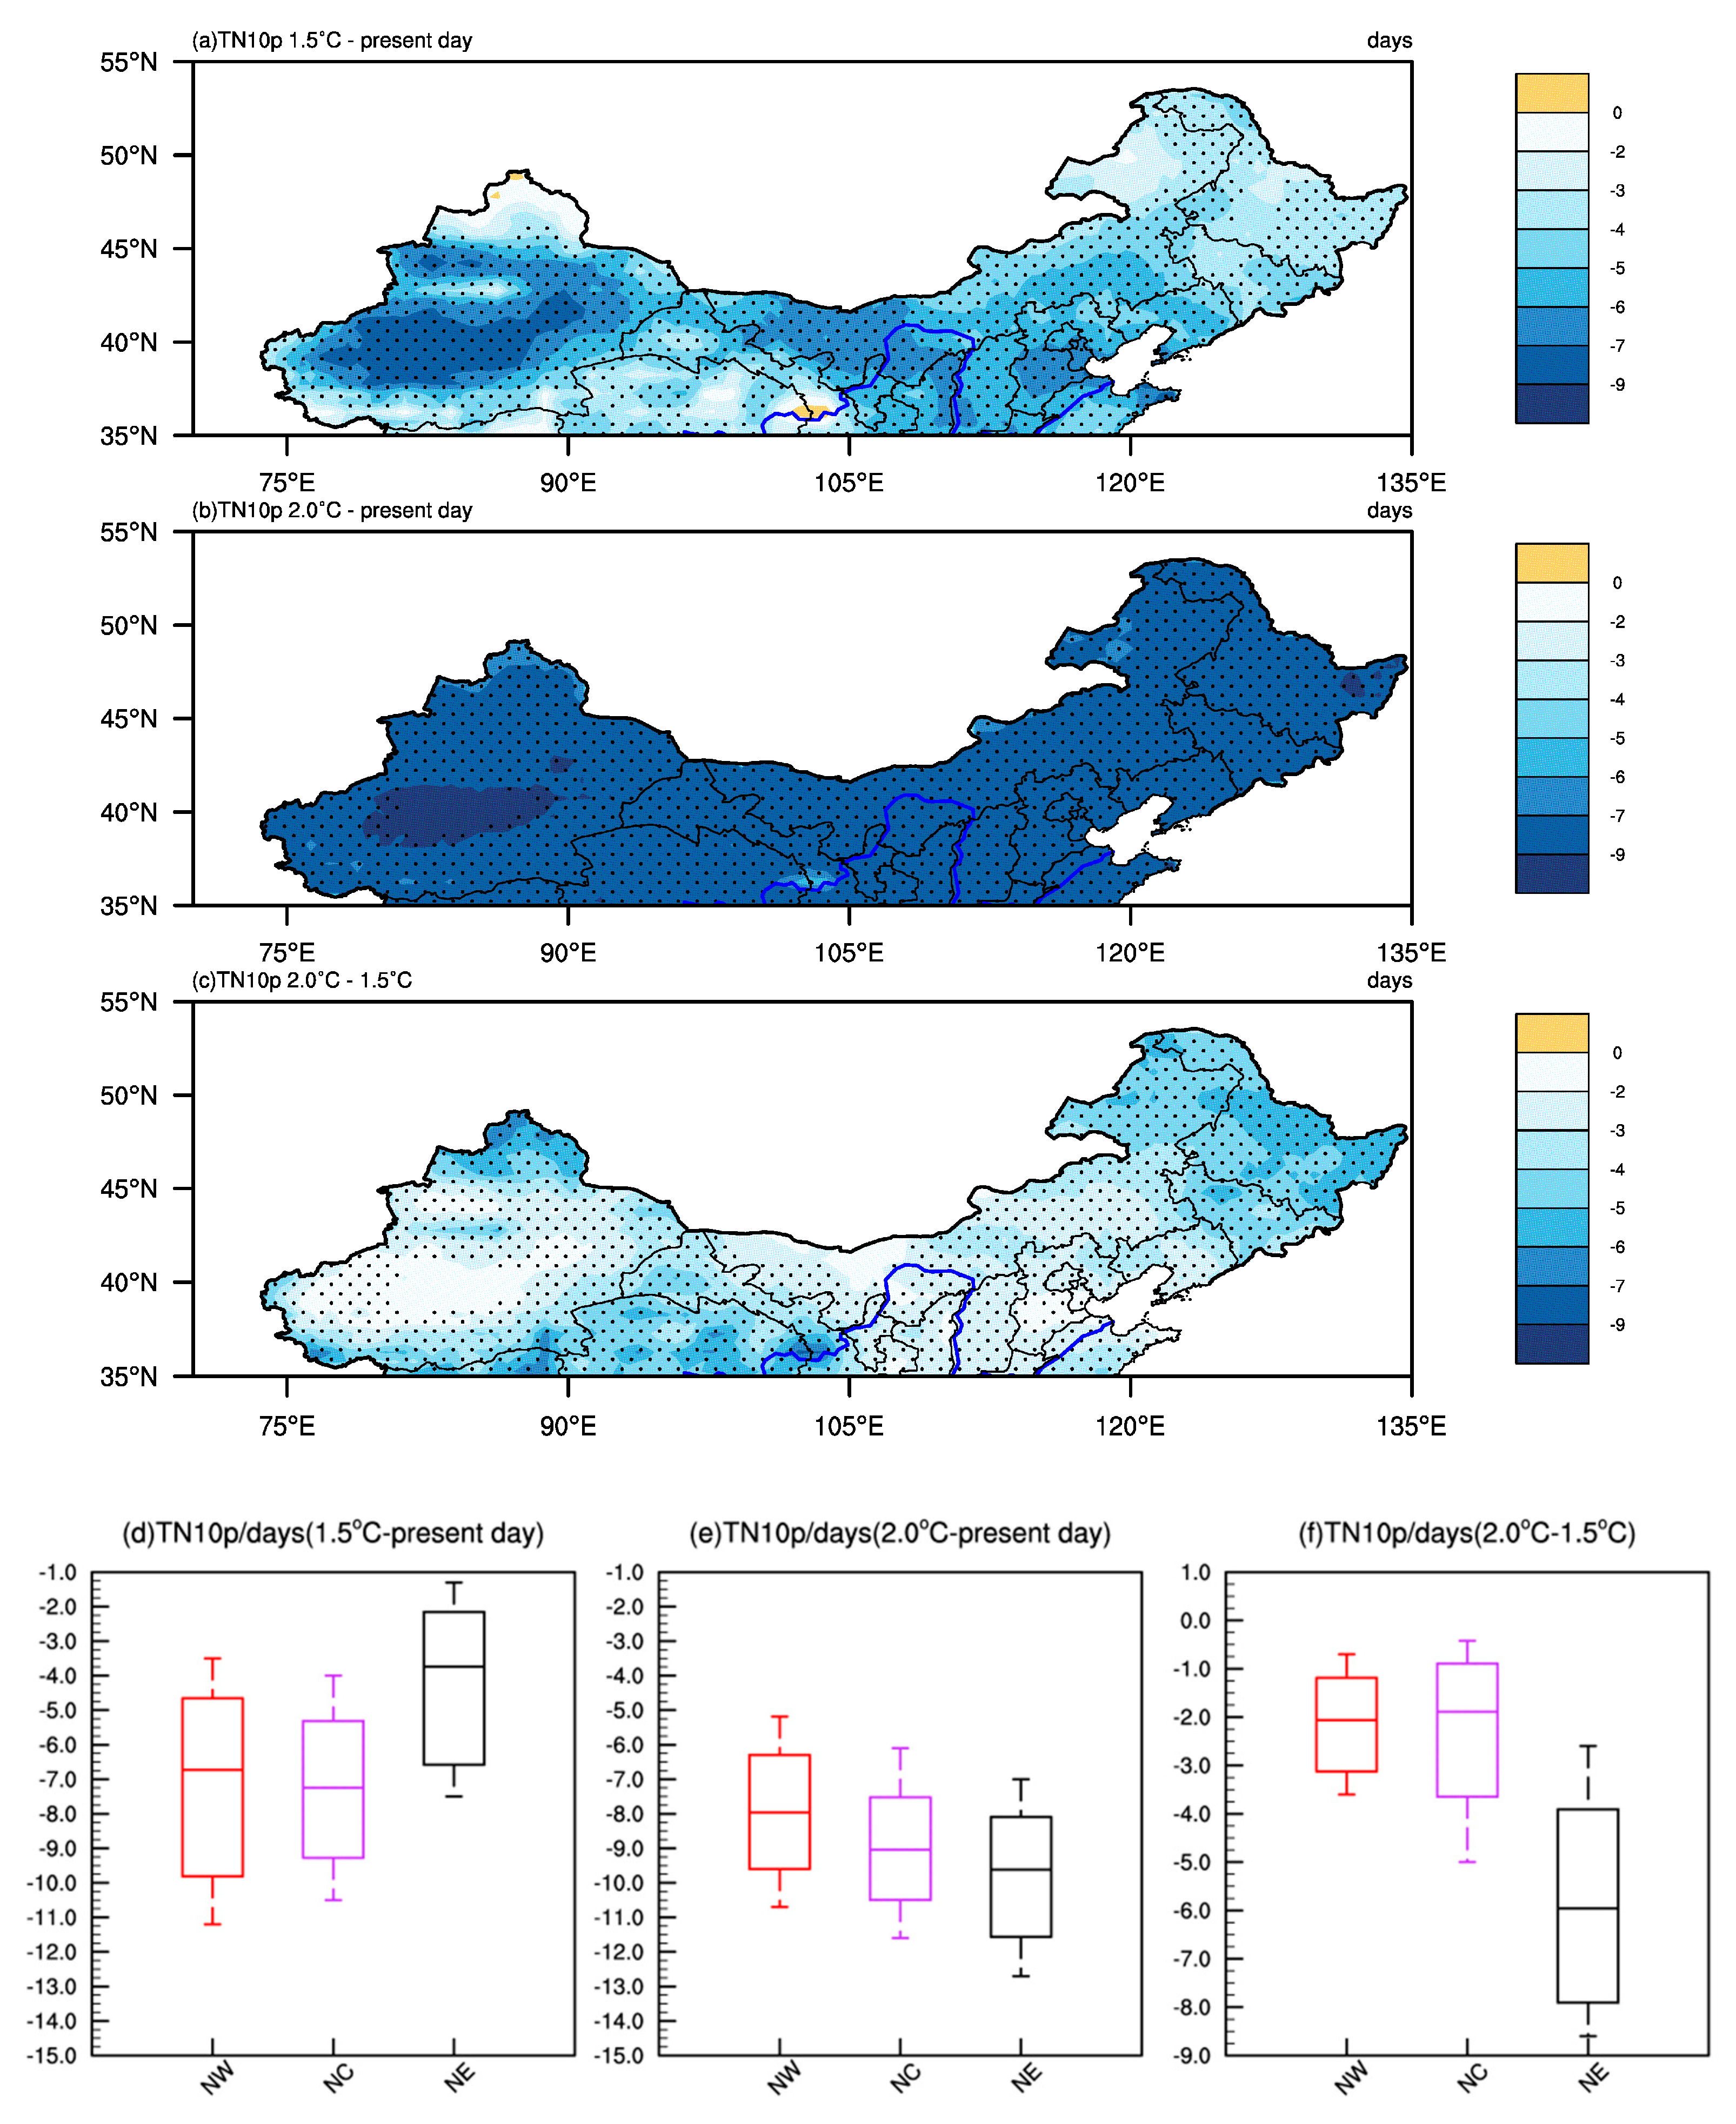
Figure 10.
Regional mean changes in CSDI in (a)/(d) 1.5 °C warming relative to the present day, (b)/(e) 2.0 °C warming relative to the present day, and (c)/(f) 2.0 °C warming relative to 1.5 °C warming. The box and whisker plots show the 10th, 25th, 50th, 75th, and 90th percentiles. The dotted areas are statistically significant at the 5% level according to the Student’s t-test.
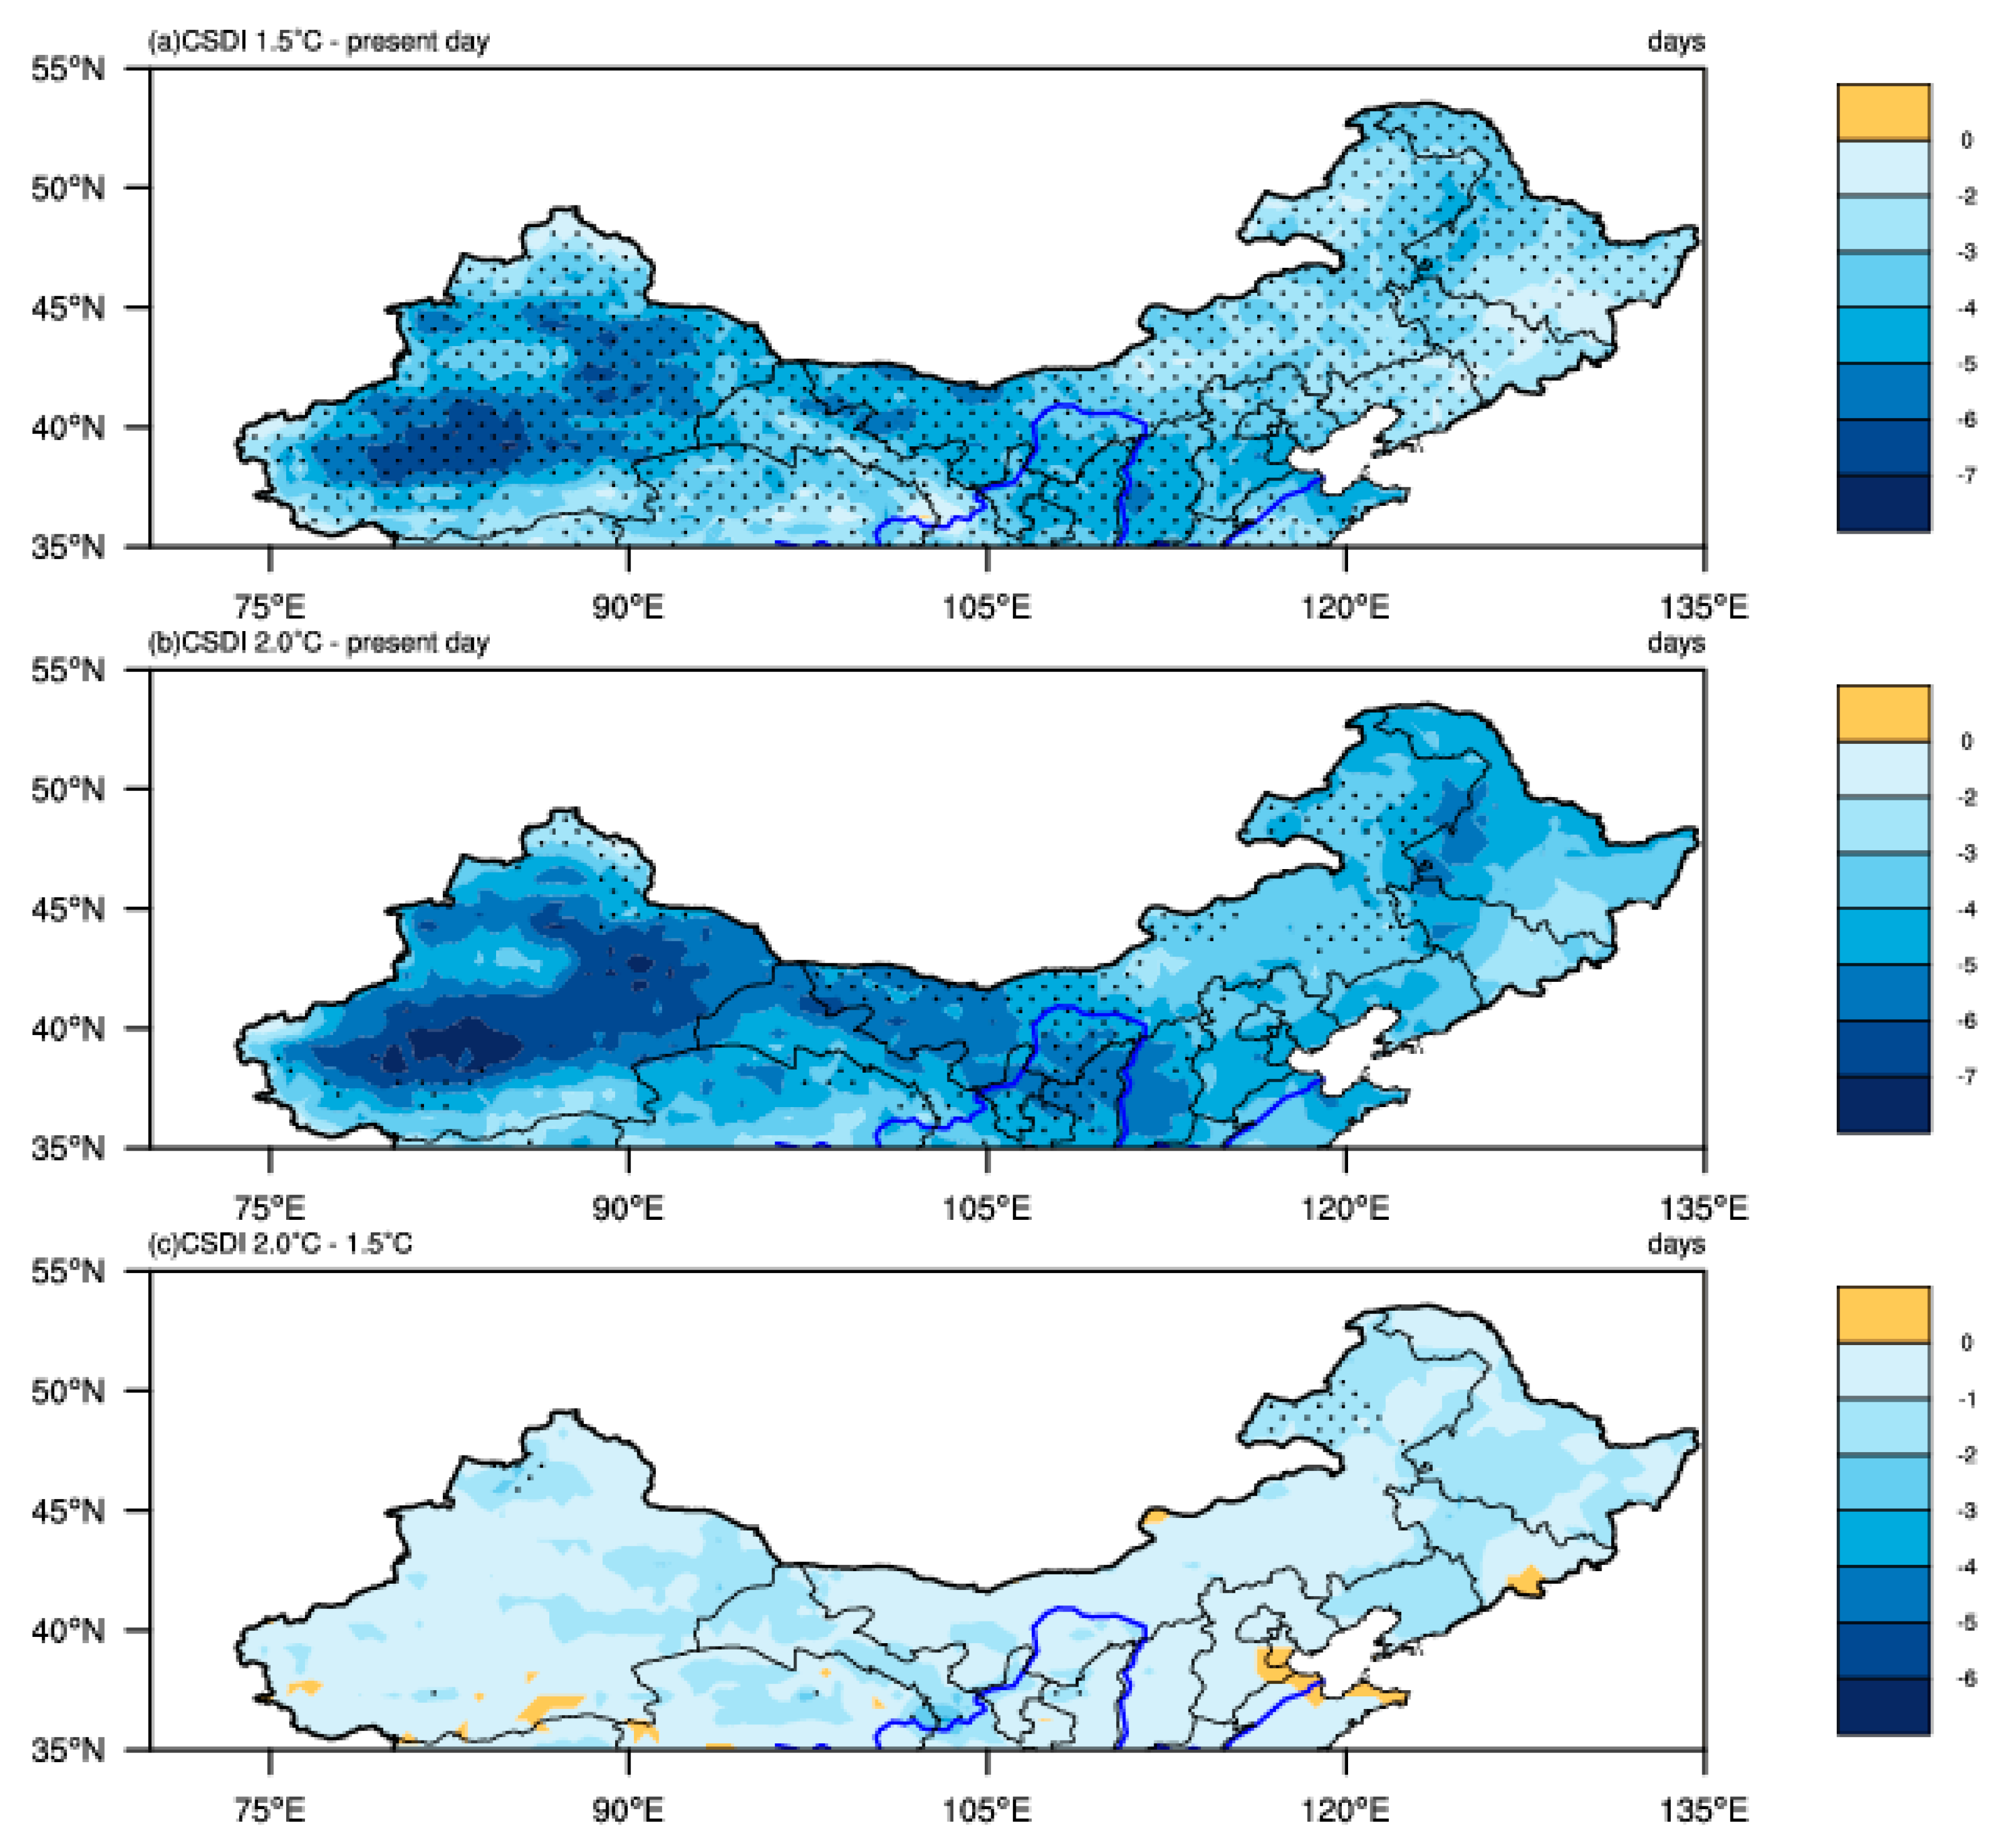

Figure 11.
Regional mean probability ratio (PR) values for the responses of daily mean temperatures in DJF to 1.5 °C (red) and 2.0 °C (purple) global warming based on the percentile thresholds determined from the 1976–2005 base period (black).
Figure 11.
Regional mean probability ratio (PR) values for the responses of daily mean temperatures in DJF to 1.5 °C (red) and 2.0 °C (purple) global warming based on the percentile thresholds determined from the 1976–2005 base period (black).
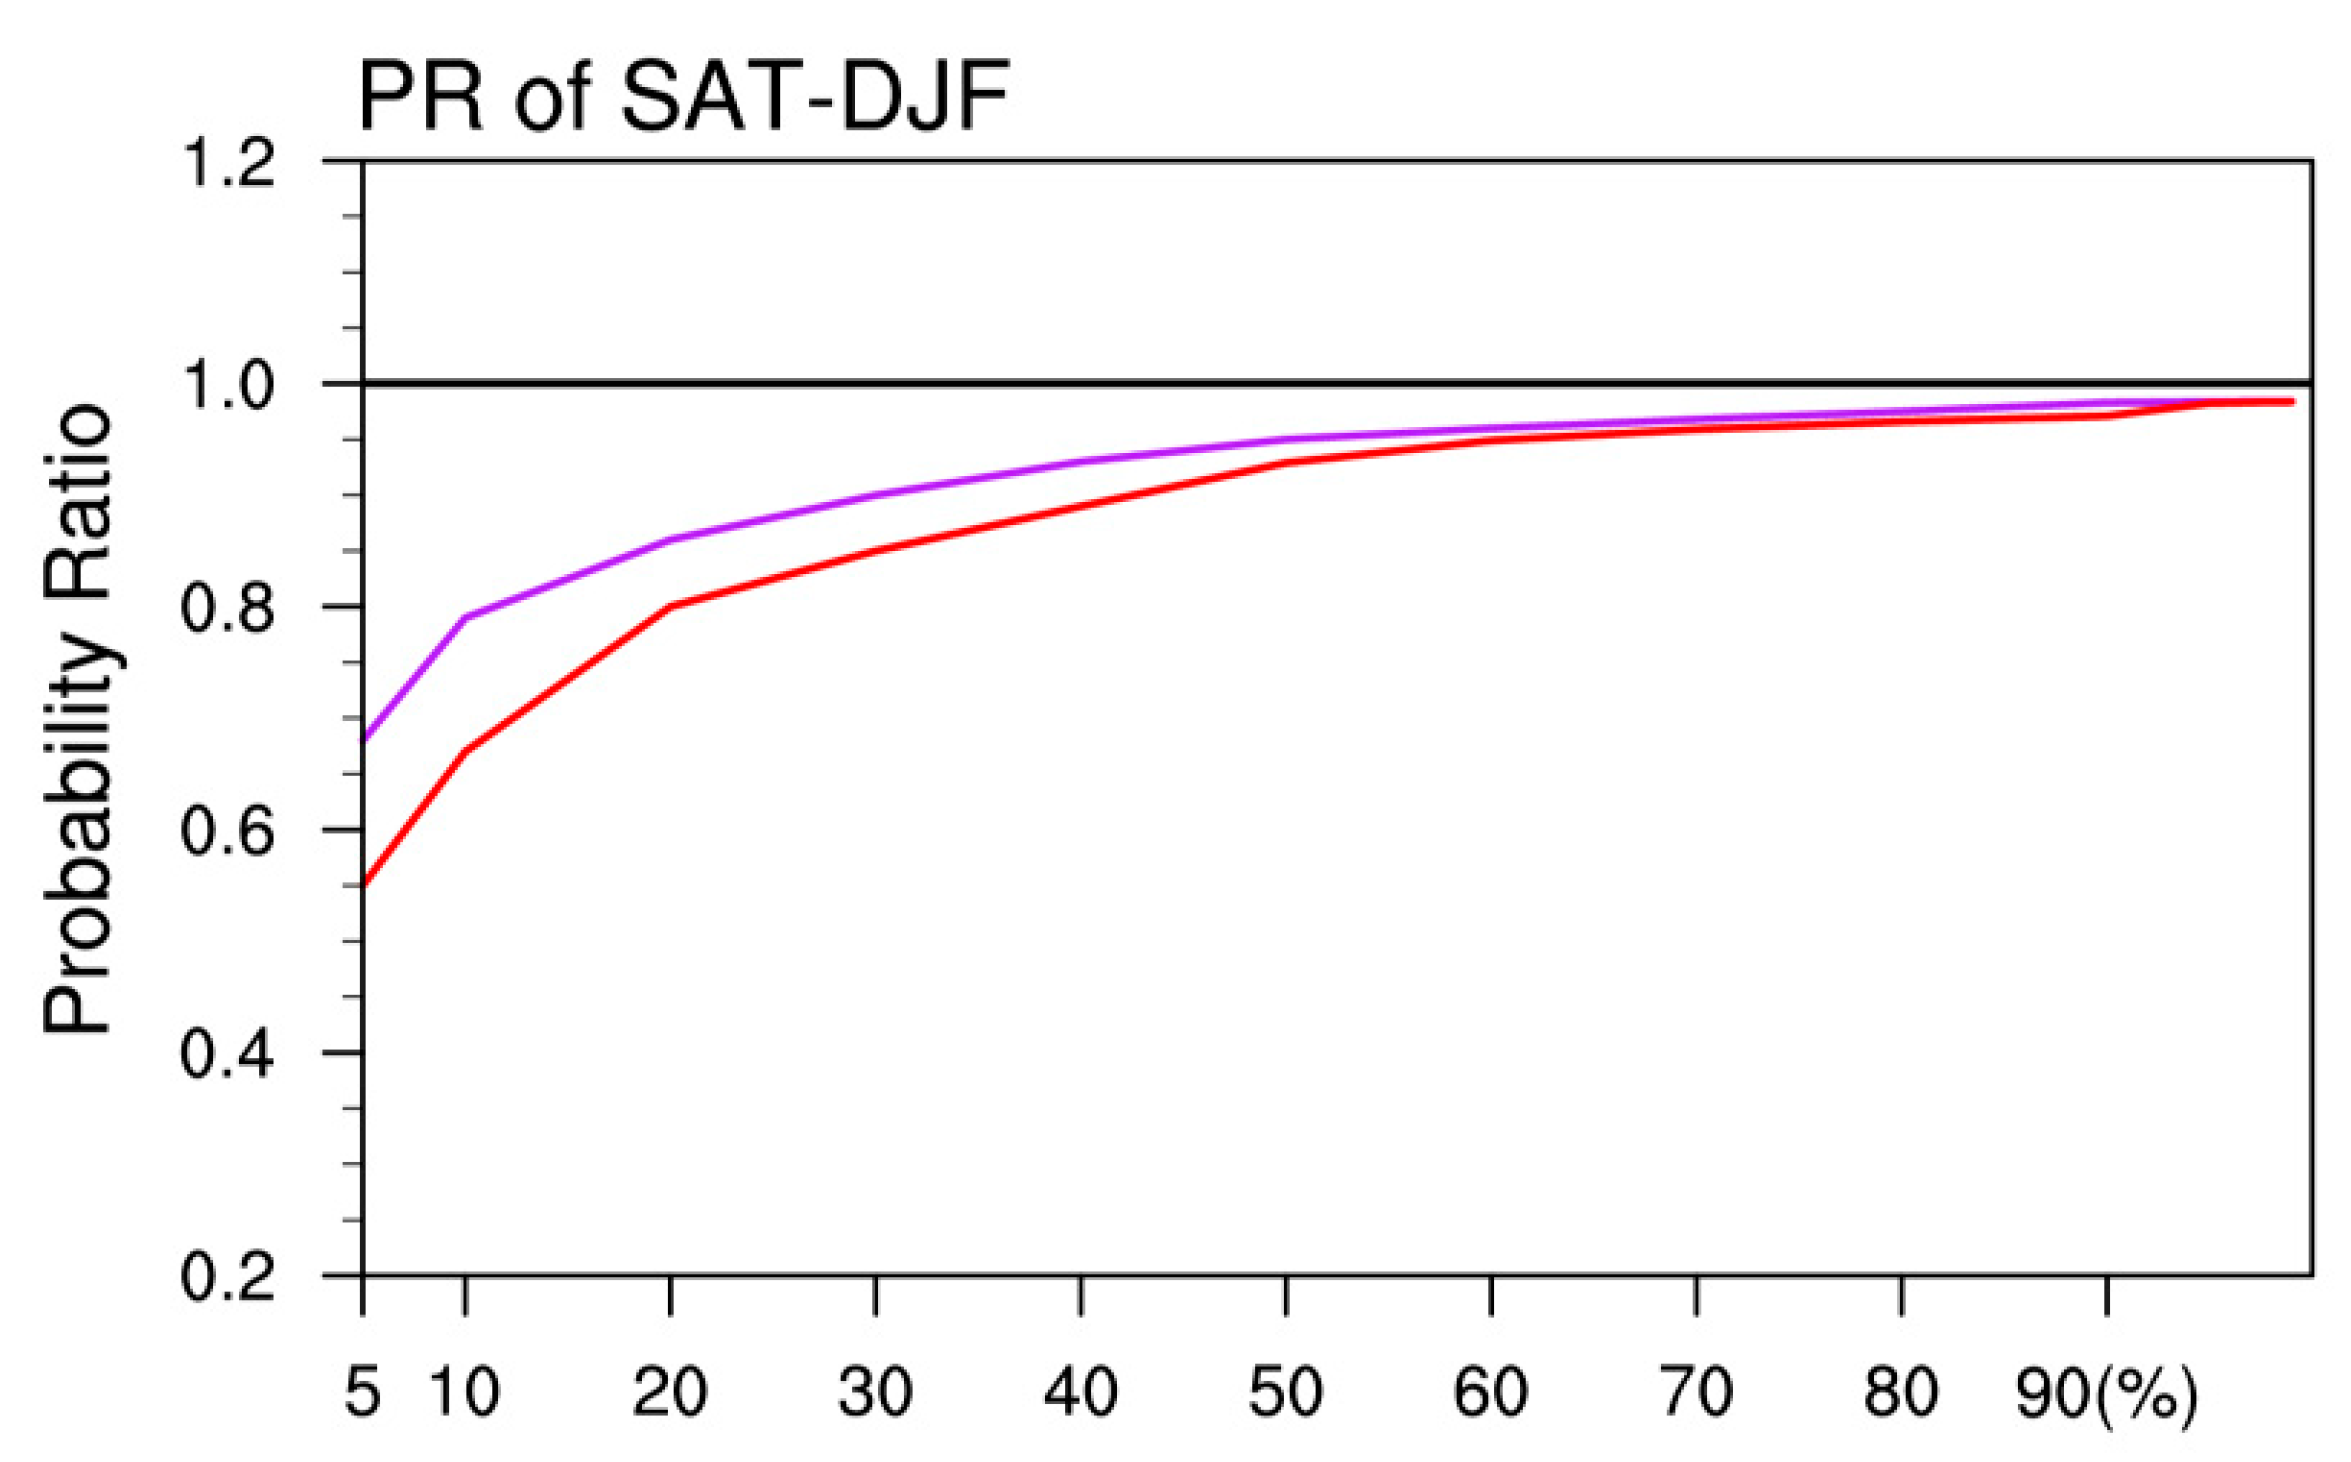
Figure 12.
Changes in extreme low temperature events avoided over Northern China and its regions in a 1.5 °C warmer future compared with a 2.0 °C warmer future (units: %). The red bars represent the indices defined by intensity, the blue bars represent the indices defined by frequency, and the black bars represent the indices defined by duration and difference.

Table 1.
Definitions of the extreme low temperature indices.
| Indices | Indicator Name | Definition | Unit |
|---|---|---|---|
| TXn | Min Tmax | Lowest winter daily maximum temperature | °C |
| TNn | Min Tmin | Lowest winter daily minimum temperature | °C |
| TX10p | Cool days | Days when Tmax < 10th percentile of 1976–2005 | days |
| TN10p | Cool nights | Days when Tmin < 10th percentile of 1976–2005 | days |
| CSDI | Cold spell duration indicator | At least six consecutive days when Tmin < 10th percentile | days |
| DTR | Diurnal temperature range | Difference between daily Tmax and Tmin | °C |
Where Tmax (Tmin) means daily maximum (minimum) temperature.
Table 2.
Changes in the six extreme indices between 1.5 °C and 2.0 °C warmer futures.
| Indices | TXn | TNn | TX10p | TN10p | CSDI | DTR |
|---|---|---|---|---|---|---|
| NW | 0.4 °C | 0.7 °C | −3.0 days | −2.0 days | −2.1 days | −1.1 °C |
| NC | 0.3 °C | 0.4 °C | −3.5 days | −1.8 days | −0.6 days | 0.2 °C |
| NE | 1.0 °C | 0.9 °C | −5.0 days | −6.0 days | −1.9 days | −0.8 °C |
Table 3.
Avoided influence (AI) of six extreme indices between 1.5 °C and 2.0 °C global warming (%).
Table 3.
Avoided influence (AI) of six extreme indices between 1.5 °C and 2.0 °C global warming (%).
| Areas | TXn | TNn | TX10p | TN10p | CSDI | DTR |
|---|---|---|---|---|---|---|
| NW | 44 | 42 | 34 | 44 | 14 | 52 |
| NC | 28 | 36 | 24 | 34 | 14 | 6 |
| NE | 37 | 30 | 50 | 54 | 24 | 56 |
© 2018 by the authors. Licensee MDPI, Basel, Switzerland. This article is an open access article distributed under the terms and conditions of the Creative Commons Attribution (CC BY) license (http://creativecommons.org/licenses/by/4.0/).
Share and Cite
MDPI and ACS Style
Hu, W.; Zhang, G.; Zeng, G.; Li, Z. Changes in Extreme Low Temperature Events over Northern China under 1.5 °C and 2.0 °C Warmer Future Scenarios. Atmosphere 2019, 10, 1. https://doi.org/10.3390/atmos10010001
AMA Style
Hu W, Zhang G, Zeng G, Li Z. Changes in Extreme Low Temperature Events over Northern China under 1.5 °C and 2.0 °C Warmer Future Scenarios. Atmosphere. 2019; 10(1):1. https://doi.org/10.3390/atmos10010001
Chicago/Turabian StyleHu, Weiwei, Guwei Zhang, Gang Zeng, and Zhongxian Li. 2019. "Changes in Extreme Low Temperature Events over Northern China under 1.5 °C and 2.0 °C Warmer Future Scenarios" Atmosphere 10, no. 1: 1. https://doi.org/10.3390/atmos10010001
Note that from the first issue of 2016, this journal uses article numbers instead of page numbers. See further details here.