Spatial and Temporal Variation of Wind Erosion Climatic Erosivity and Its Response to ENSO in the Otindag Desert, China


1
Department of Hydraulic Engineering, Tsinghua University, Beijing 10084, China
2
Key Laboratory of Water Cycle and Related Land Surface Processes, Institute of Geographic Sciences and Natural Resources Research, Chinese Academy of Sciences, Beijing 100101, China
*
Author to whom correspondence should be addressed.
Atmosphere 2019, 10(10), 614; https://doi.org/10.3390/atmos10100614
Submission received: 14 August 2019
/
Revised: 24 September 2019
/
Accepted: 8 October 2019
/
Published: 10 October 2019
(This article belongs to the Section Meteorology)
Abstract
:Wind erosion is a major cause of soil losses in China’s drylands which is further stimulated by climate variability and fragile ecological conditions. Climatic erosivity is an important index of wind erosion, therefore, evaluation of its spatiotemporal variations and relationship with the El Niño–Southern Oscillation (ENSO) will provide a theoretical basis for the comprehensive management and prevention of soil erosion. In this study, by using the climatic erosivity equation, geographic information system (GIS) and geostatistical analysis, we quantified the climatic erosivity, explored its spatiotemporal variations, and detected the effects of the Multivariate ENSO Index (MEI) on climatic erosivity in the Otindag Desert during the period of 1980–2016. The results indicated that the climatic erosivity (C-factor value) ranged from 82–445, and it decreased from the western margin to the eastern margin of the desert. The climatic erosivity showed a significant downward trend at seasonal and annual scales (p < 0.05). As far as spring, autumn and annual climatic erosivity, the whole region showed a downward trend, however, the summer and winter climatic erosivity varied spatially, in which the central and western regions showed a downward trend, but the eastern region showed an upward trend. The results showed that the average climatic erosivity is weaker during La Niña events than during El Niño events. The climatic erosivity recorded by 14 of the 20 meteorological stations, all located in central and west regions, exhibited a significant correlation with MEI (p < 0.05). The ENSO has a significant impact on climatic erosivity.
1. Introduction
Wind erosion causes land degradation in arid regions and is affected by natural and human factors such as climate, landscape, farming, grazing and other factors. There have been various changes in the global and regional climate patterns, especially in the past few decades [1]. The major alterations were associated with the frequency and intensity of wind events and precipitation patterns. These changes influence not only the wind erosivity, but also adversely affect the land erodibility [2,3,4,5,6].
Currently, there are various models to quantify wind erosivity, among which the wind erosion equation (WEQ) and the revised wind erosion equation (RWEQ) are well-known and widely used [7,8]. These models require multiple inputs, such as soil, vegetation types and climate data. Therefore, due to the data limitations, these models are generally unsuitable analyses of wind erosion at large-scale. In contrast, the wind erosion climatic factor (C-factor), commonly referred to as the indicator of wind erosion, can be used to measure the trend of climate change and its influence on wind erosion conditions [5,9]. Therefore, the spatial and temporal distribution difference of the C-factor often indicates the wind erosion potential of the region [10].
Numerous studies have been done on the spatial distribution of climatic erosivity in many countries, and the distribution of climatic erosivity on different scales in China has also been reported [11,12,13,14]. The identification of wind erosion regions should consider the comprehensive effect of soil type, climate, vegetation and other factors. Wind erosion region is the basic unit of desertification control, soil conservation inventory and planning. Therefore, it is necessary to understand the spatial distribution of climatic erosivity [5].
The trend analysis of time series of climatic erosivity is helpful to analyze the potential impact of climate change on wind erosion, especially in arid regions with strong soil erosion potential, and arid regions are more sensitive to climate variability due to fragile biophysical conditions [15,16]. In China’s arid regions, various changes have taken place in climate factors such as temperature and precipitation in recent decades [3,4,17]. Therefore, understanding the temporal variation of climatic erosivity and its effect on climate variability are of great significance to combat desertification.
Climate variability affects the intensity of wind erosion and that is the dominant factor controlling the desertification of the arid region [18]. Many proxies indicating climate variability have been proposed, such as El Niño–Southern Oscillation (ENSO), North Atlantic Oscillation (NAO), Indian Ocean Dipole (OPD) and Pacific Decadal Oscillation (PDO) [19,20,21,22]. In terms of climate variability, ENSO has been an important factor in attracting people’s attention. It has a significant impact on the global climate through the interaction between the atmosphere and the ocean. ENSO occurs only near the equator of the Pacific Ocean, but it can cause climate anomalies across almost the entire world [23,24].
The ENSO is called the ENSO cycle because of its obvious periodicity of interaction between sea and air. La Niña and El Niño, which represent the cold and warm periods respectively, are two extreme phases of the ENSO cycle. Various indicators reflect ENSO, including Niño 3.4 sea surface temperature (SST) anomalies, the Multivariate ENSO Index (MEI) and the Southern Oscillation Index (SOI). Because the MEI contains more information than other indexes, it is more suitable to monitor ENSO than the SOI or SST indexes [25,26].
The Otindag Desert is one of the four major sandy lands and an important part of the ecological barrier in China [27]. The ecological environment in this area is fragile and vulnerable. Wind erosion is the main factor affecting the ecological environment in this region [28,29]. However, there is a lack of study on the spatial and temporal characteristics of climatic erosivity in Otindag Desert. In order to better direct the soil conservation management agents in the Otindag desert, it is necessary for scholars to fill this knowledge gap. Additionally, studies on the effects of ENSO on climatic erosivity in arid areas of northern China have not previously been reported. This study does not only provide a theoretical basis for the comprehensive management and prevention of soil erosion in Otindag desert, but also is of great significance for proper monitoring, evaluation, prediction, and management of wind erosion-susceptible lands. Therefore, the aims of this study are to (1) detect the temporal and spatial distributions of climatic erosivity in the Otindag Desert, China; and to (2) assess the effect of La Niña and El Niño on climatic erosivity at annual and monthly scales during the period from 1980 to 2016.
2. Materials and Methods
2.1. Study Area
The Otindag Desert is located approximately between 111°06′ and 18°18′ E and between 41°52′ and 45°10′ N latitude (Figure 1). Its location is in the latitudes of the westerlies of the Northern Hemisphere and on the northwestern margin of the East Asia Summer Monsoon [30], which is bounded by the Yan Mountains in the south and by the Great Khingan Mountain in the east. The altitude of the Otindag Desert ranges from ~2000 m in the southeast to ~1000 m in the northwest. Rivers originating from the surrounding mountains flow into or pass through this dune field. In all climate classifications, the Otindag Desert belongs to the temperate semi-arid zone. According to data from weather stations inside and around the desert, the average annual precipitation of the desert increases from northwest to southeast, varying from 150 to 400 mm, and the average annual temperature ranges from ~2 °C in the north to ~4 °C in the south. The average wind speed decreases from northwest to southeast, varying from 3.5 to 5.3 m/s, and the main wind direction is NW [29].
2.2. Database
During the study period from 1980 to 2016, daily weather data such as precipitation, maximum and minimum temperature, wind speed and relative humidity of 20 weather stations in and around Otindag Desert were recorded by the National Meteorological Information Centre of China [31].
In this study, monthly series of the variability index of MEI from 1980 to 2016, which were derived from the US National Oceanic and Atmospheric Administration [32], were used to demonstrate the consistency of the ENSO and to analyze the relationship between the ENSO and climatic erosivity in Otindag Desert.
2.3. Climatic Erosivity Calculation
Various algorithms have been developed for the climatic erosivity, among which the Food and Agriculture Organization of the United Nations (FAO)equation is widely used because it is more easily obtains accurate results when compared to the complex physics-based models [9]. The FAO equation is a revised version of the Chepil model [33], and the equation is:
where , , Pi and di are the monthly average wind speed at 2 m above the ground, monthly potential evaporation, monthly rainfall, and the number of days per month, respectively. The is calculated by the Equation (2) [34]:
where Ti is the monthly average temperature, and ri is the monthly humidity.
The C-factor value of each month was calculated according to Equations (1) and (2).
2.4. Method of Linear Regression
Linear regression is a simple and efficient tool to analyze the variation trend of climatic erosivity. The key to linear trend analysis is to detect sudden change (in increasing or decreasing directions) in time series and to describe the possible generation processes under a given observation sequence [35]. The linear regression equation is:
where Xi and Yi are the independent and dependent variables, respectively; where a is the regression slope that reflects the rate of changes of the time series, and b is the intercept. The correlation coefficient between Xi and Yi can be written as:
where the value range of correlation coefficient r is −1.0 to 1.0. The two variables Xi and Yi show a positive correlation if r > 0; negative correlation if r < 0 and no correlation if r = 0 [36].
Yi = aXi + b (i = 1, 2, 3...., n),
2.5. Method of Spatial Interpolation
The kriging method is a geostatistical interpolation technique which considers both the distance and the degree of variation between known data points when estimating values in unknown areas [37]. Spatial continuity of climatic erosivity was investigated by calculating semi-variograms, and the semi-variograms γ(h) using Equation (5) [38]:
where n(h) is the number of paired points within a distance h, z(sp) and z(sp + h) are the values in points sp and sp + h, respectively. Experimental variograms were fitted with the exponential, spherical, Gaussian, and linear models. The model with the smallest residual sum of squares (RSS) was further investigated to find the number of neighbors that returned the best cross-validation result. Geostatistical and spatial correlation analysis including cross-validation tests were performed by ArcGIS 10.1. After evaluating the results given by above analyses, it was shown that ordinary kriging with spherical model performed the best as it generated the lowest RSS; ordinary kriging was also widely used in a number of studies for the estimation of meteorological and hydrological variables [39,40]. Therefore, the ordinary kriging method was selected to calculate the spatial distribution of the C-factor value from 20 weather stations and to generate the spatial distribution map of the Otindag Desert for the period of 1980–2016.
In order to understand the spatial distribution for change features of climatic erosivity, the average values, changes, and the trends of C-factor value were further interpolated as well.
2.6. Correlation Analysis
Climatic erosivity is calculated by wind speed, rainfall, temperature and other climate factors. Meanwhile, ENSO is closely related to these climate factors [41]. Therefore, correlation analysis was carried out and specifically considered the trends in El Niño and La Niña events.
In the correlation analysis, the monthly MEI was taken as one variable, and the corresponding data of monthly C-factor values from 1980 to 2016 were taken as another variable. Afterward, the relationship between the C-factor value and ENSO was analyzed.
3. Results
3.1. Annual Climatic Erosivity Analysis
The annual C-factor value of each weather station was obtained by accumulating the C-factor value of each month. The 36-year average annual C-factor value distribution map was generated by the ordinary kriging interpolation method. From Figure 2, we can see that the mean annual C-factor value ranged from 82 to 445, with an average value of 184. However, the standard deviation reached 64, which shows that there is great spatial variation.
The lower values were mainly distributed in the eastern Otindag Desert, while the southwest had higher levels. The C-factor value increased gradually from east to west showing that in these areas, especially in the western region, soil conservation measures should be implemented and at the same time human activities should be closely monitored.
In order to analyze the influence of spatial location differences on climatic erosivity, a linear regression between longitude, latitude and annual C-factor value was carried out. In this study, at 95% confidence level (significance level a = 0.05) and weather station number n = 20, the critical value of the correlation coefficient was 0.444. Figure 3a shows that the correlation coefficient is r = 0.448 (p < 0.05), which means that a significant relationship exists between the longitude and C-factor value. Figure 3b shows that the correlation coefficient is r = 0.182 (p > 0.05), suggesting no existing significant relationship. Thereby, the C-factor value decreases with the increase of longitude, i.e., the C-factor value gradually decreased from the western margin to the eastern margin of the desert.
3.2. Trend Analysis
The annual and seasonal variations in trends of climatic erosivity from 1980 to 2016 were analyzed via linear regression. As can be seen from Figure 4, the C-factor values in spring were the highest of the four seasons and in summer they were the lowest. Besides, C-factor values in both seasonal and annual scales showed a fluctuating decreasing trend starting from the 1980s. Furthermore, the C-factor values in spring and autumn decreased continuously from 1980 to 2000 and thereafter kept a relatively stable state, while in summer they decreased continuously before 2004 but slightly increased after 2004. In addition, the annual C-factor values decreased before 1990 and slightly recovered between 1990 and 1996 but decreased before 2005 and thereafter slowly increased. In winter they fluctuated greatly, having the lowest correlation coefficient (R2 = 0.12).
In terms of the general trend from 1980 to 2016, the C-factor values both in seasonal and annual scales suggested a decreasing trend, with the highest (−0.23 per year) and the lowest (−0.10 per year) degrees of decrease occurring in spring and winter, respectively; its annual decrease degree was −1.87 per year. Importantly, all the R2 values in Figure 4 are above = 0.32862 = 0.1080, which suggests that all of the results have passed the significance test. Therefore, the declining trend of the C-factor values of the Otindag Desert is significant.
3.3. Distribution of Climatic Erosivity Variation Trends
A linear relationship of seasonal (as well as annual) C-factor value during the time series from 1980 to 2016 was established, and correlation coefficients for the 20 weather stations were calculated. The variation trends can be analyzed and discussed at a 95% confidence level (significance level a = 0.05) based on the correlation coefficients. The critical value of correlation coefficient test R0.05,36 is 0.3286 at significance level a = 0.05 and year number n = 36. If the variation of climatic erosivity passed the significance test at a 95% confidence level, it indicated that there is a significant downward or upward trend; if it did achieve a 95% confidence level, it showed a non-significant downward or upward trend.
The statistics of variation trend (see Table 1) show that the spring, summer, autumn, winter and annual climatic erosivity all tended to decline overall at most of the weather stations. Especially in the summer, there were 15 weather stations with a downward trend, accounting for about 75% of the total, which indicates that climatic erosivity in the season tends to decline as a whole.
Based on the linear relationship between C-factor values and time series, the characteristics of climatic erosivity variation at different weather stations were described. The trend line slope representing the rate of change was also calculated from the linear relationship. Then, the ordinary kriging interpolation technique was used to spatially interpolate the slope data at different time scales, as shown in Figure 5.
As far as spring, autumn and annual climatic erosivity, the whole region exhibited a downward trend, especially at Zhurihe, Siziwang Banner, Jining, Huade and Zhangbei stations, which all showed a significant decline. Summer and winter climatic erosivity in the central and western regions were on the decline, but some regions in the east exhibited an upward trend. Moreover, Fengning and Weichang stations showed a significant upward trend. As a whole, no matter at the seasonal or annual scale, climatic erosivity in most regions of the Otindag Desert was on the decline.
3.4. Climatic Erosivity Anomalies Associated with ENSO
La Niña and El Niño are the cold and warm periods of the ENSO cycle, respectively. In this study, MEI from 1980 to 2016 was taken as the basis to predict La Niña events (cold) and El Niño events (warm) and the statistical value of the C-factor is obtained (Table 2).
Information on average erosivity is presented in Table 2, which shows that climatic erosivity for El Niño events is higher than the average value, while the La Niña events are exactly the opposite. Statistical analysis exhibited that from 1980 to 2016, the average monthly C-factor value was 11.9. The C-factor value was 12.03 during the El Niño/La Niña period, which was slightly higher than the average C-factor value within 1980–2016. The climatic erosivity showed high variability in warm and cold events. In the cold events, the C-factor value reached the minimum value, namely 6.31; its maximum was 21.67, and its average value was only 11.16. In the warm events, the C-factor value reached the minimum value of 7.1; its maximum was 23.6, and its average value was 12.41.
A comparison between neutral average monthly C-factor value and the El Niño period C-factor value shows that the rate is 0.95, thereby indicating that the neutral monthly climatic erosivity is lower than the El Niño period monthly climatic erosivity. The average monthly C-factor value during the La Niña period is 11.16, which is a little lower than the neutral average monthly C-factor value. As shown in Table 2, the C-factor value is lower during cold events and higher during warm events. After excluding other factors affecting soil erosion, wind erodibility was relatively light during the La Niña period, while it was potentially serious during the El Niño period in the Otindag Desert.
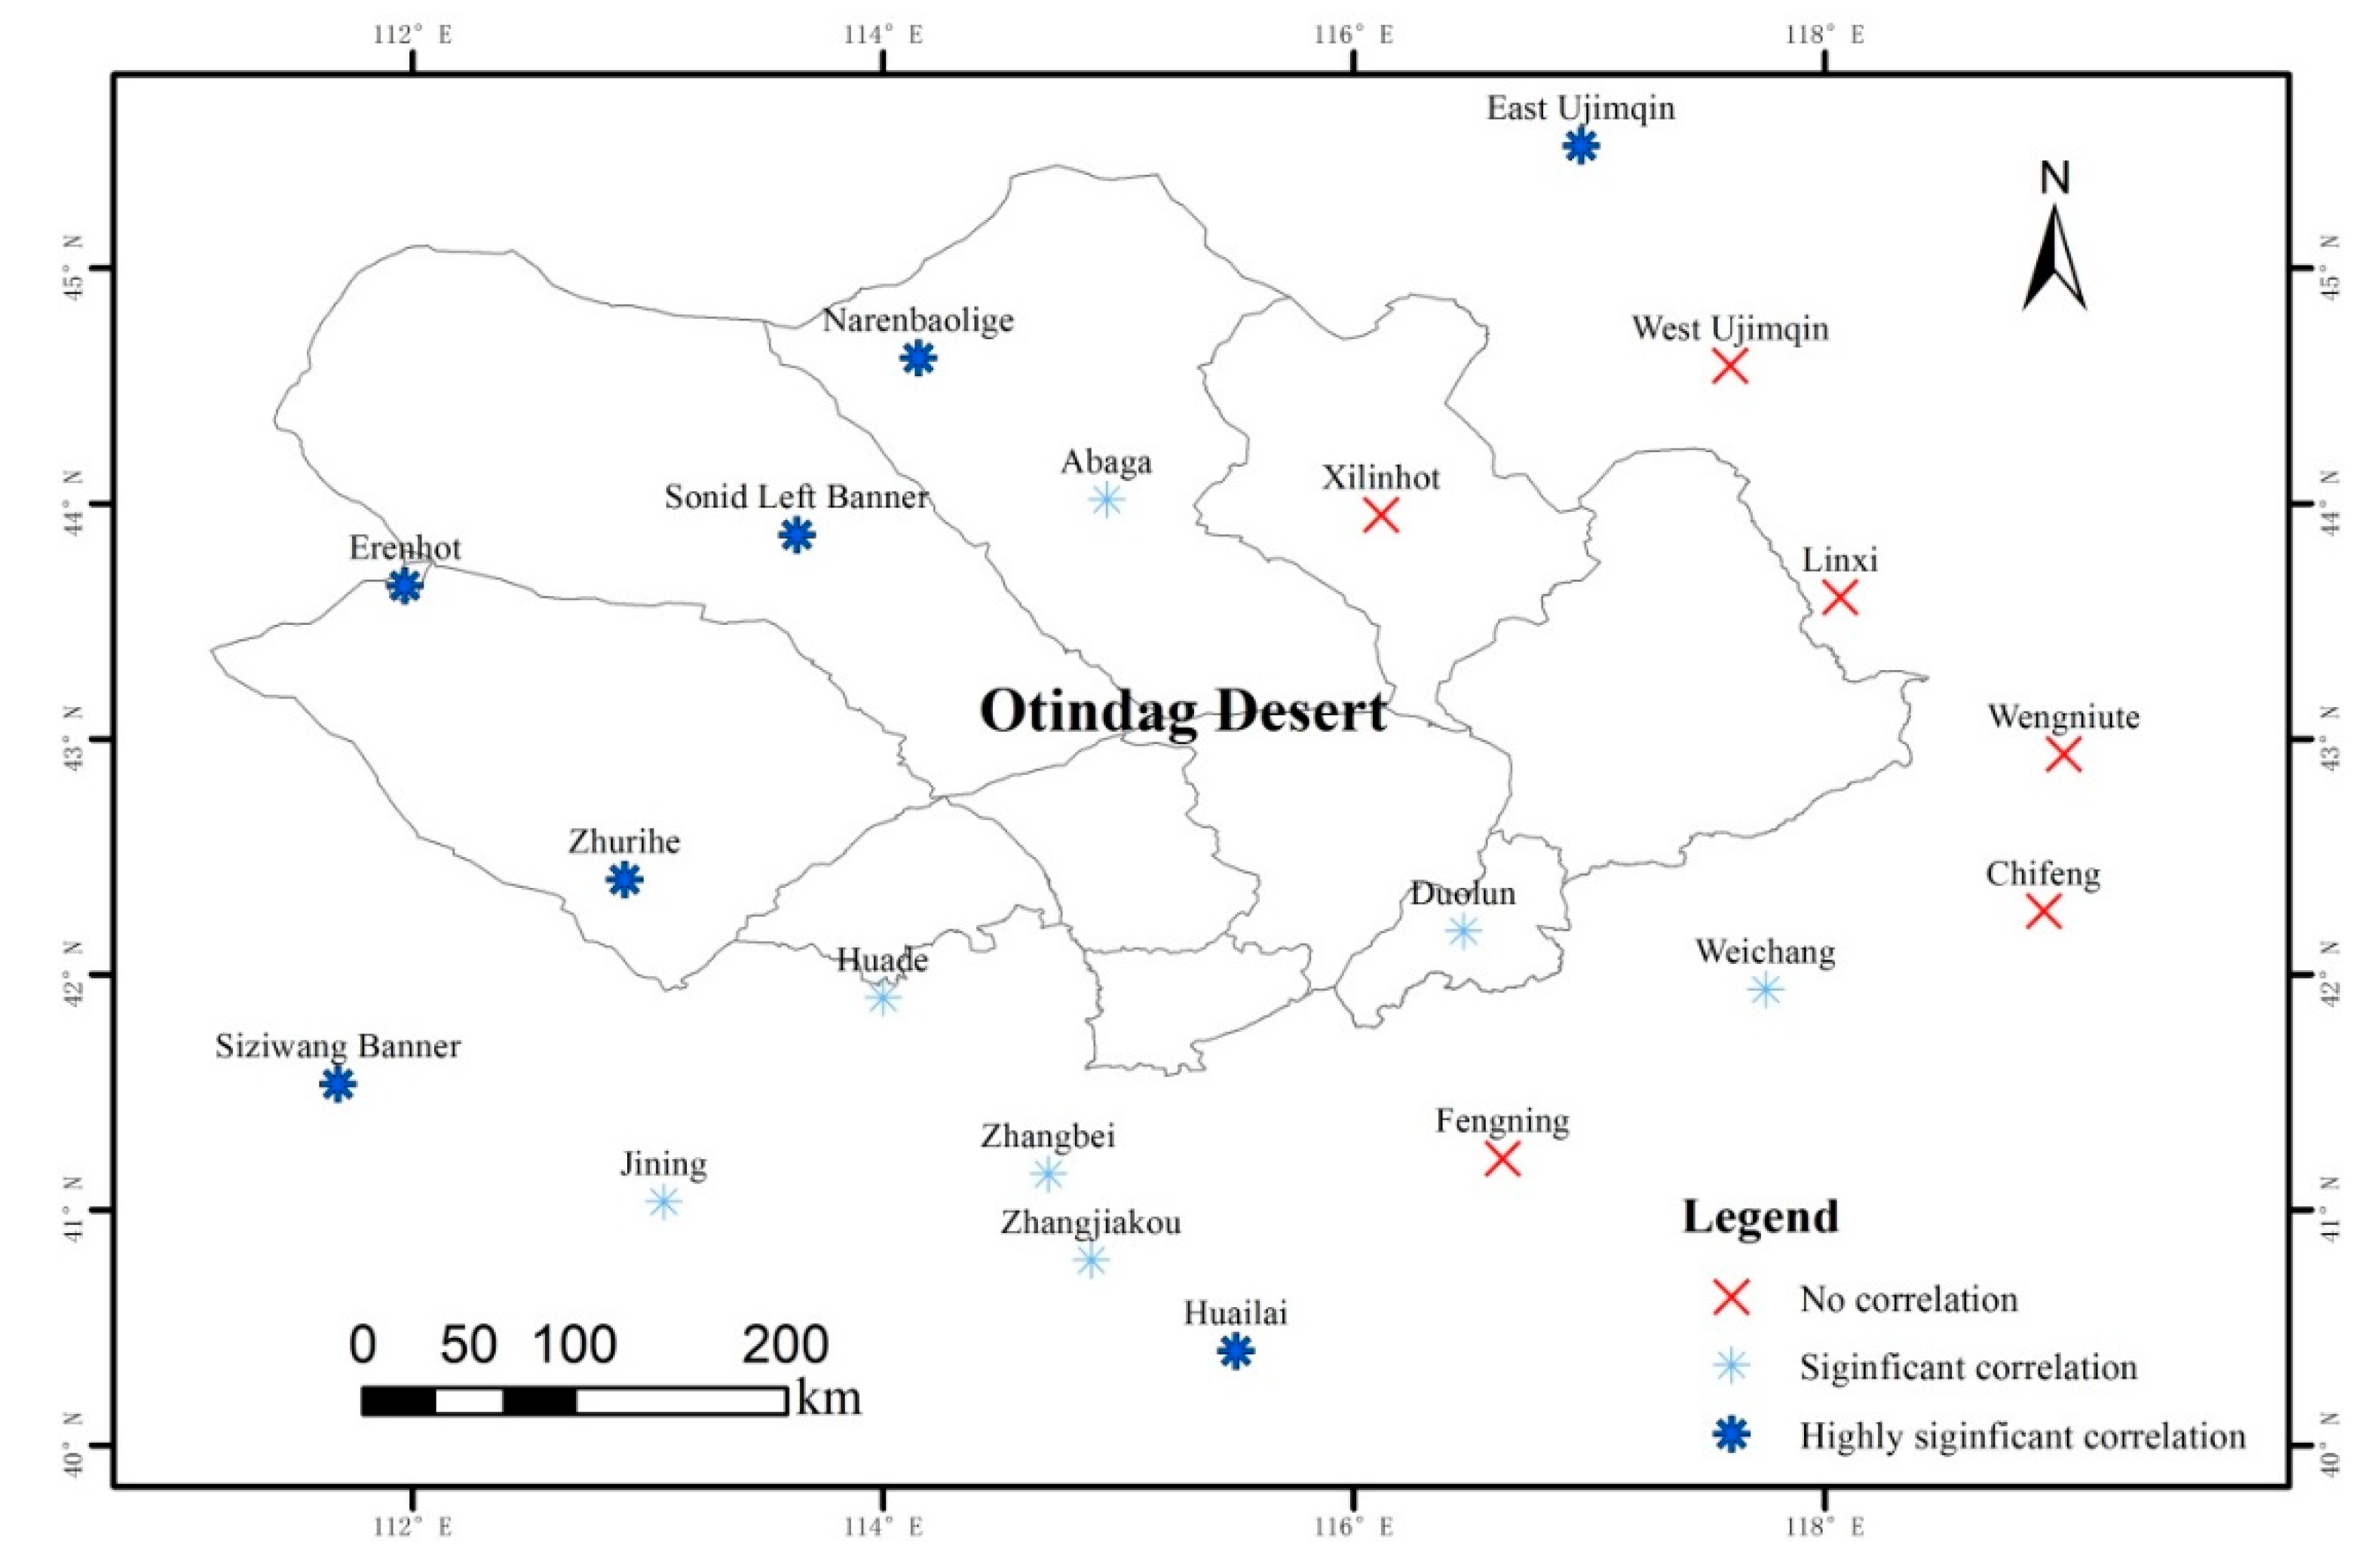
During the period from 1980 to 2016, the correlation between the C-factor value and MEI was significant at a 99% confidence level (p < 0.01). The C-factor value in the Otindag Desert increased as the MEI increased and showed a significant positive correlation. With regard to the annual C-factor value and MEI for 20 stations for the period of 1980 to 2016, 14 of the 20 weather stations were significantly correlated (p < 0.05), and 7 weather stations were highly correlated (p < 0.01). As shown in Figure 6, the stations with significant correlation between monthly C-factor value and MEI are mostly located in Otindag Desert, while those with non-significant correlation between C-factor value and MEI mostly located in the eastern margin of the Otindag Desert.
4. Discussion
The Otindag Desert, with severe aeolian processes, is an important dust emission area in China [29]. Our results showed that the annual average C-factor value was 184 in Otindag Desert during 1980–2016 and it has reached the level of severe wind erodibility (C ≥ 100) [42]. By way of contrast, the climatic erosivity mean value in Tarim Basin [43] and western Inner Mongolia [11] were 17.5 and 154.5, respectively, which indicated that the Otindag Desert has higher risk of wind erosion desertification than other areas of China, and more attention should be focused on forecasting wind erosion and combating desertification in the region.
Based on the analysis of the C-factor value in the Otindag Desert in the last 40 years from 1980 to 2016, it is found that the C-factor values in the region show a significant downward trend in both the seasonal scale and the annual scale (Figure 4). In addition, most of the weather stations exhibited a downward trend, gradually decreasing from the west to the east (Figure 5). The interaction between the dominant atmospheric conditions and complex local topography might affect the spatial distribution of the C-factor to some extent [44]. In the region, the Great Khingan Mountain and Yan Mountain are located in the eastern and southern borders, respectively. The two mountains intersect in the southeast of the Otindag Desert, thus forming the topography of the low west and high east. Thereby, they directly hinder the movement of the near-surface airflow, which results in the C-factor value being higher in the west but lower in the east of Otindag Desert (Figure 2).
The decrease in average wind speed is the main reason for the decrease of the C-factor value [45,46]. Wind speed in the Otindag Desert has decreased significantly over the past 50 years [6]. In the past decades, similar downward wind trends have been observed in many parts of the world, such as North America [47,48], central and northeastern China [47], European countries [49,50], African countries [51] and Australia [52]. In the two hemispheres, in the tropics and mid-latitudes, surface wind speeds drop at a rate of −0.014 m s−1 a−1 [53]. The reason for wind weakening was recognized to include a decrease in pressure gradient [54] and weakness of continental cold high pressure [55,56], which were closely related to climate variability.
Climate variability is a very interesting issue, especially considering the impact of ENSO on the climate. Climate models show that global warming may be associated with increases in El Niño frequencies [57]. ENSO, as a climate driver, has complex effects on the biota. It not only affects the temperature and rainfall [58], it may also affect wind speed which controls the aeolian processes [59].
Our findings indicate that La Niña events have climatic erosivity that is lower than the normal value, while for El Niño the effect is the opposite (Table 2). This result is similar to the relationship between the rates of dune migration in Northeastern Brazil with the ENSO events as analyzed by Maia et al. [60]. They indicated that the rate of dune migration in El Niño years is faster than normal years whereas in La Niño year it is lower than normal years.
MEI shows a significant positive correlation with C-factor value, and meteorological stations which exhibited a significant correlation between monthly C-factor value and MEI are mostly located in Otindag Desert. Meteorological stations located in the eastern margin of the Otindag Desert showed no significant correlation between C-factor value and MEI, as well as lower changing rates (Figure 5 and Figure 6), as discussed above, which may be directly influenced by the local topography. In addition, the airflow of Otindag Desert is mostly affected by the Asian monsoon [29], which generated a considerable aeolian process at that time. It is also noteworthy that the Asian monsoon is closely related to the ENSO cycles [61,62]. Therefore, finding out the impact mechanism of ENSO on climatic erosivity in the future is a feasible way to predict the climatic erosivity in Otindag Desert.
5. Conclusions
Wind erosion is the most common cause of land degradation in arid areas. In this study, the wind erosion climatic erosivity in the Otindag Desert of China during 1980–2016 was calculated based on the climatic erosivity equation. The spatial and temporal variations in wind erosion climatic erosivity at both seasonal and annual scales were also analyzed. The results indicated that the annual mean climatic erosivity (C-factor value) ranged from 82–445 during the study period, and it decreased from the western margin to the eastern margin of the desert. From 1980 to 2016, the C-factor value showed a significant declining trend (p < 0.05) at both seasonal and annual scales. As far as spring, autumn, and annual climatic erosivity, a downward trend was observed in the whole desert; but for summer and winter, the central and western regions exhibited a downward trend while the eastern region showed an upward trend. The average C-factor value was weaker during La Niña events and stronger during El Niño events, which implies that the climatic erosivity was controlled by large-scale atmospheric circulations. If ENSO has a significant effect on climatic erosivity in the Otindag Desert, it may also affect climatic erosivity in other parts of the North China or other regions where the climate is remotely related to the ENSO system. Our results not only improve the understanding of how the ENSO affects climatic erosivity in arid areas like the Otindag Desert but also provide a new way to predict and control long-term desertification.
Supplementary Materials
The following are available online at https://www.mdpi.com/2073-4433/10/10/614/s1, Table S1: Information of weather stations.
Author Contributions
J.L. performed the data analysis and participated in the writing of the manuscript. X.W. and D.C. helped the data preparation and participated in the discussion on results.
Funding
This work was supported by the National Natural Science Foundation of China (41771012 and 41930640), National Key Research and Development Program of China (No. 2016YFA0601900), and Key Frontier Program of Chinese Academy of Sciences (QYZDJ-SSWDQC043).
Acknowledgments
We would like to thank the Editor and three anonymous reviewers for their comments, which helped improve the manuscript.
Conflicts of Interest
The authors declare no conflict of interest.
References
- IPCC. Climate Change: The Physical Science Basis; Contribution of Working; Cambridge University Press: Cambridge, UK; New York, NY, USA, 2013; Volume 43, pp. 866–871. [Google Scholar]
- Lan, F.; Zhao, C. Long-term trends of precipitation in the North China Plain. J. Geogr. Sci. 2012, 22, 989–1001. [Google Scholar]
- Ge, Q.; Wang, H.J.; Dai, J. Shifts in spring phenophases, frost events and frost risk for woody plants in temperate China. Clim. Res. 2013, 57, 249–258. [Google Scholar] [CrossRef]
- Meng, X.; Zhang, S.; Zhang, Y.; Wang, C. Temporal and spatial changes of temperature and precipitation in Hexi Corridor during 1955–2011. J. Geogr. Sci. 2013, 23, 653–667. [Google Scholar] [CrossRef]
- Yang, F.; Lu, C. Assessing changes in wind erosion climatic erosivity in China’s dryland region during 1961–2012. J. Geogr. Sci. 2016, 26, 1263–1276. [Google Scholar] [CrossRef]
- Wang, X.; Hua, T.; Lang, L.; Ma, W. Spatial differences of aeolian desertification responses to climate in arid Asia. Glob. Planet. Chang. 2017, 148, 22–28. [Google Scholar] [CrossRef] [Green Version]
- Woodruff, N.P.; Siddoway, F.H. A wind erosion equation. Soil Sci. Soc. Am. J. 1965, 29, 602–608. [Google Scholar] [CrossRef]
- Fryrear, D.W.; Saleh, A.; Bilbro, J.D.; Schomberg, H.M.; Stout, J.E.; Zobeck, T.M. Revised Wind Erosion Equation (RWEQ). Wind Erosion and Water Conservation Research Unit, USDA-ARS; Technical Bulletin No.1; Southern Plains Area Cropping System Research Laboratory: Big Spring, TX, USA, 1998. [Google Scholar]
- Skidmore, E.L. Wind erosion climatic erosivity. Clim. Chang. 1986, 9, 195–208. [Google Scholar] [CrossRef]
- Morgan, R.P.C. Soil Erosion and Conservation; Blackwell Publishing: London, UK, 2005. [Google Scholar]
- Wang, X.; Dong, Z.; Ping, Y.; Zhang, J.; Qian, G. Wind energy environments and dunefield activity in the Chinese deserts. Geomorphology 2005, 65, 33–48. [Google Scholar] [CrossRef]
- Chi, W.; Zhao, Y.; Kuang, W.; He, H. Impacts of anthropogenic land use/cover changes on soil wind erosion in China. Sci. Total Environ. 2019, 668, 204–215. [Google Scholar] [CrossRef]
- Zhao, Y.; Xin, Z.; Ding, G. Spatiotemporal variation in the occurrence of sand-dust events and its influencing factors in the Beijing-Tianjin Sand Source Region, China, 1982–2013. Reg. Environ. Chang. 2018, 18, 2433–2444. [Google Scholar] [CrossRef]
- Uzun, O.; Kaplan, S.; Basaran, M.; Deviren, S.; Youseef, F.; Nouri, A.; Ozcan, A.U.; Erpul, G. Spatial distribution of wind-driven sediment transport rate in a fallow plot in Central Anatolia, Turkey. Arid Land Res. Manag. 2017, 31, 125–139. [Google Scholar] [CrossRef]
- Huang, J.; Guan, X.; Ji, F. Enhanced cold-season warming in semi-arid regions. Atmos. Chem. Phys. 2012, 12, 4627–4653. [Google Scholar] [CrossRef]
- Feng, S.; Fu, Q. Expansion of global drylands under a warming climate. Atmos. Chem. Phys. 2013, 13, 10081–10094. [Google Scholar] [CrossRef] [Green Version]
- Wang, X.M.; Wenyong, M.A.; Hua, T.; Danfeng, L.I. Variation in vegetation greenness along China’s land border. Sci. China Earth Sci. 2017, 60, 121–128. [Google Scholar] [CrossRef]
- Wang, X.; Chen, F.; Dong, Z. The relative role of climatic and human factors in desertification in semiarid China. Glob. Environ. Chang. 2006, 16, 48–57. [Google Scholar] [CrossRef]
- Hurrell, J.W. Decadal trends in the north atlantic oscillation: Regional temperatures and precipitation. Science 1995, 269, 676–679. [Google Scholar] [CrossRef] [PubMed]
- Saji, N.H.; Goswami, B.N.; Vinayachandran, P.N.; Yamagata, T. A dipole mode in the tropical Indian Ocean. Nature 1999, 401, 360–363. [Google Scholar] [CrossRef] [PubMed]
- Alexander, M.A.; Bladé, I.; Newman, M.; Lanzante, J.R.; Scott, J.D. The Atmospheric Bridge: The Influence of ENSO Teleconnections on Air-Sea Interaction over the Global Oceans. J. Clim. 2002, 15, 2205–2231. [Google Scholar] [CrossRef]
- Mantua, N.J.; Hare, S.R. The Pacific Decadal Oscillation. J. Oceanogr. 2002, 58, 35–44. [Google Scholar] [CrossRef]
- L’Heureux, M.L.; Tippett, M.K.; Kumar, A.; Butler, A.H.; Ciasto, L.M.; Ding, Q.; Harnos, K.J.; Johnson, N.C. Strong Relations Between ENSO and the Arctic Oscillation in the North American Multi-Model Ensemble: Relations between ENSO and the AO. Geophys. Res. Lett. 2017, 44, 1165–11662. [Google Scholar]
- Peng, Y.; Long, S.; Ma, J.; Song, J.; Liu, Z. Temporal-spatial variability in correlations of drought and flood during recent 500 years in Inner Mongolia, China. Sci. Total Environ. 2018, 633, 484. [Google Scholar] [CrossRef] [PubMed]
- Wolter, K.; Timlin, M.S. El Niño/Southern Oscillation behaviour since 1871 as diagnosed in an extended multivariate ENSO index (MEI.ext). Int. J. Climatol. 2011, 31, 1074–1087. [Google Scholar] [CrossRef]
- Wolter, K.; Timlin, M.S. Measuring the strength of ENSO events: How does 1997/98 rank? Weather 2012, 53, 315–324. [Google Scholar] [CrossRef]
- Wang, X.M.; Zhang, C.X.; Hasi, E.; Dong, Z.B. Has the Three Norths Forest Shelterbelt Program solved the desertification and dust storm problems in arid and semiarid China? J. Arid Environ. 2010, 74, 13–22. [Google Scholar] [CrossRef]
- Lou, J.; Wang, X.; Zhu, B.; Li, D.; Jiao, L.; Ma, W.; Cai, D. The potential effects of aeolian processes on the vegetation in a semiarid area: Geochemical evidence from plants and soils. Arab. J. Geosci. 2018, 11, 306. [Google Scholar] [CrossRef]
- Wang, X.; Lou, J.; Ma, W.; Jiao, L.; Hui, L.; Hua, T. The impact of reclamation on aeolian desertification of four species in the Otindag Desert, China. Catena 2017, 157, 189–194. [Google Scholar] [CrossRef]
- Liu, Z.; Yang, X. Geochemical-geomorphological Evidence for the Provenance of Aeolian Sands and Sedimentary Environments in the Hunshandake Sandy Land, Eastern Inner Mongolia, China. Acta Geol. Sin. Engl. 2013, 87, 871–884. [Google Scholar]
- Daily Weather Data. Available online: http://cdc.cma.gov.cn (accessed on 20 April 2018).
- Multivariate El Niño–Southern Oscillation Index (MEI). Available online: https://www.esrl.noaa.gov/psd/enso/mei/rank.html (accessed on 1 April 2018).
- FAO. A Provisional Methodology for Soil Degradation; FAO: Rome, Italy, 1979. [Google Scholar]
- Tianwen, C. Determination and Calculation Method of Field Evaporation and Evaporation Power; Science Press: Beijing, China, 1980. [Google Scholar]
- Nyeko-Ogiramoi, P.; Willems, P.; Ngirane-Katashaya, G. Trend and variability in observed hydrometeorological extremes in the Lake Victoria basin. J. Hydrol. 2013, 489, 56–73. [Google Scholar] [CrossRef]
- Lai, C.; Chen, X.; Wang, Z.; Wu, X.; Zhao, S.; Wu, X.; Bai, W. Spatio-temporal variation in rainfall erosivity during 1960–2012 in the Pearl River Basin, China. Catena 2016, 137, 382–391. [Google Scholar] [CrossRef]
- Panagiotopoulou, A.; Anastassopoulos, V. Super-resolution image reconstruction employing Kriging interpolation technique. In Proceedings of the 14th International Workshop on Systems, Signals and Image Processing and 6th EURASIP Conference focused on Speech and Image Processing, Multimedia Communications and Services, Maribor, Slovenia, 27–30 June 2007; pp. 144–147. [Google Scholar]
- Mcbratney, A.; Webster, R. Choosing functions for semi-variograms of soil properties and fitting them to sampling estimates. Eur. J. Soil Sci. 2010, 37, 617–639. [Google Scholar] [CrossRef]
- Yue, S.; Yang, R.; Yan, Y.; Yang, Z.; Wang, D. Spatial and temporal variations of wind erosion climatic erosivity in the farming-pastoral zone of Northern China. Theor. Appl. Climatol. 2019, 135, 1339–1348. [Google Scholar] [CrossRef]
- Borges, P.D.A.; Franke, J.; da Anunciação, Y.M.T.; Weiss, H.; Bernhofer, C. Comparison of spatial interpolation methods for the estimation of precipitation distribution in Distrito Federal, Brazil. Theor. Appl. Climatol. 2016, 123, 335–348. [Google Scholar] [CrossRef]
- De Mello, C.; Darrell, N.; Curi, N.; Nazaré Monteiro Yanagi, S. Sea surface temperature (SST) and rainfall erosivity in the Upper Grande River Basin, southeast Brazil. Ciênc. Agrotec. 2012, 36, 53–59. [Google Scholar] [CrossRef] [Green Version]
- Chepil, W.S.; Siddoway, F.H.; Armbrust, D.V. Climatic factor for estimating wind erodibility fields. J. Soil Water Conserv. 1962, 17, 3. [Google Scholar]
- Yang, X.H.; Qing, H.E.; Hong-Jun, L.I.; Huo, W.; Ding, G.F. Calculation and Analysis on Wind Erosion Climatic Erosivity in the Tarim Basin. J. Des. Res. 2012, 32, 990–995. [Google Scholar]
- Duan, X.; Gu, Z.; Li, Y.; Xu, H. The spatiotemporal patterns of rainfall erosivity in Yunnan Province, southwest China: An analysis of empirical orthogonal functions. Glob. Planet. Chang. 2016, 144, 82–93. [Google Scholar] [CrossRef]
- Dong, Y.; Kang, G. Study on the Wind Erosion Climatic Erosivity in Arid and Semi-Arid Areas in China. J. Soil Eros. Water Conserv. 1994, 3, 1–7. (In Chinese) [Google Scholar]
- Yang, F.; Lu, C. Spatiotemporal variation and trends in rainfall erosivity in China’s dryland region during 1961–2012. Catena 2015, 133, 362–372. [Google Scholar] [CrossRef]
- Vautard, R.; Cattiaux, J.; Yiou, P.; Thépaut, J.N.; Ciais, P. Northern Hemisphere atmospheric stilling partly attributed to an increase in surface roughness. Nat. Geosci. 2010, 3, 756–761. [Google Scholar] [CrossRef]
- Wan, H.; Wang, X.L.; Swail, V.R. Homogenization and trend analysis of Canadian near-surface wind speeds. J. Clim. 2010, 23, 1209–1225. [Google Scholar] [CrossRef]
- Najac, J.; Boé, J.; Terray, L. A multi-model ensemble approach for assessment of climate change impact on surface winds in France. Clim. Dyn. 2009, 32, 615–634. [Google Scholar] [CrossRef]
- Dadaser, F.; Cengiz, E. Wind speed trends over Turkey from 1975 to 2006. Int. J. Climatol. 2014, 34, 1913–1927. [Google Scholar] [CrossRef]
- Hoffman, M.T.; Cramer, M.D.; Gillson, L.; Wallace, M. Pan evaporation and wind run decline in the Cape Floristic Region of South Africa (1974–2005): Implications for vegetation responses to climate change. Clim. Chang. 2011, 109, 437–452. [Google Scholar] [CrossRef]
- Mcvicar, T.R.; Niel, T.G.V.; Ling, T.L.; Roderick, M.L.; Rayner, D.P.; Ricciardulli, L.; Donohue, R.J. Wind speed climatology and trends for Australia, 1975–2006: Capturing the stilling phenomenon and comparison with near-surfacereanalysis output. Geophys. Res. Lett. 2008, 35, 288–299. [Google Scholar] [CrossRef]
- McVicar, T.R.; Roderick, M.L.; Donohue, R.J.; Li, L.T.; Van Niel, T.G.; Thomas, A.; Grieser, J.; Jhajharia, D.; Himri, Y.; Mahowald, N.M.; et al. Global review and synthesis of trends in observed terrestrial near-surface wind speeds: Implications for evaporation. J. Hydrol. 2012, 416–417, 182–205. [Google Scholar] [CrossRef]
- Tuller, S.E.; Tuller, S.E. Measured wind speed trends on the west coast of Canada. Int. J. Climatol. 2010, 24, 1359–1374. [Google Scholar] [CrossRef]
- Klink, K. Atmospheric Circulation Effects on Wind Speed Variability at Turbine Height. J. Appl. Meteorol. Clim. 2009, 46, 445–456. [Google Scholar] [CrossRef]
- You, Q.L.; Kang, S.C.; Fluegel, W.A.; Yan, Y.P.; Huang, J. Decreasing wind speed and weakening latitudinal surface pressure gradients in the Tibetan Plateau. Clim. Res. 2010, 42, 57–64. [Google Scholar] [CrossRef] [Green Version]
- Timmermamn, A.; Oberhuber, J.; Bacher, A.; Esch, M.; Latif, M. Increased El Niño frequency in a climate model forced by future greenhouse warming. Nature 1999, 398, 694–697. [Google Scholar] [CrossRef]
- Pryor, S.C.; Barthelmie, R.J.; Takle, G.S. Wind speed trends over the contiguous USA. J. Geophys. Res. Atmos. 2009, 114, 092023. [Google Scholar] [CrossRef]
- George, S.S.; Wolfe, S.A. El Niño stills winter winds across the southern Canadian Prairies. Geophys. Res. Lett. 2009, 36, L23806. [Google Scholar] [CrossRef]
- Maia, L.P.; Freire, G.S.S.; Lacerda, L.D. Accelerated Dune Migration and Aeolian Transport During El Niño Events along the NE Brazilian Coast. J. Coast. Res. 2005, 21, 1121–1126. [Google Scholar] [CrossRef]
- Li, X.; Ting, M. Recent and future changes in the Asian monsoon—ENSO relationship: Natural or forced? Geophys. Res. Lett. 2015, 42, 3502–3512. [Google Scholar] [CrossRef]
- Zhao, K.; Wang, Y.; Edwards, R.L.; Cheng, H.; Liu, D.; Kong, X.; Ning, Y. Contribution of ENSO variability to the East Asian summer monsoon in the late Holocene. Palaeogeogr. Palaeoclimatol. Palaeoecol. 2016, 449, 510–519. [Google Scholar] [CrossRef]
Figure 1.
Location map of the Otindag Desert and weather stations. Detailed information about the 20 weather stations is in Table S1.
Figure 1.
Location map of the Otindag Desert and weather stations. Detailed information about the 20 weather stations is in Table S1.

Figure 2.
The 36-year average annual C-factor value distribution characteristics.

Figure 3.
The relationship between (a) longitude, (b) latitude and annual C-factor value.
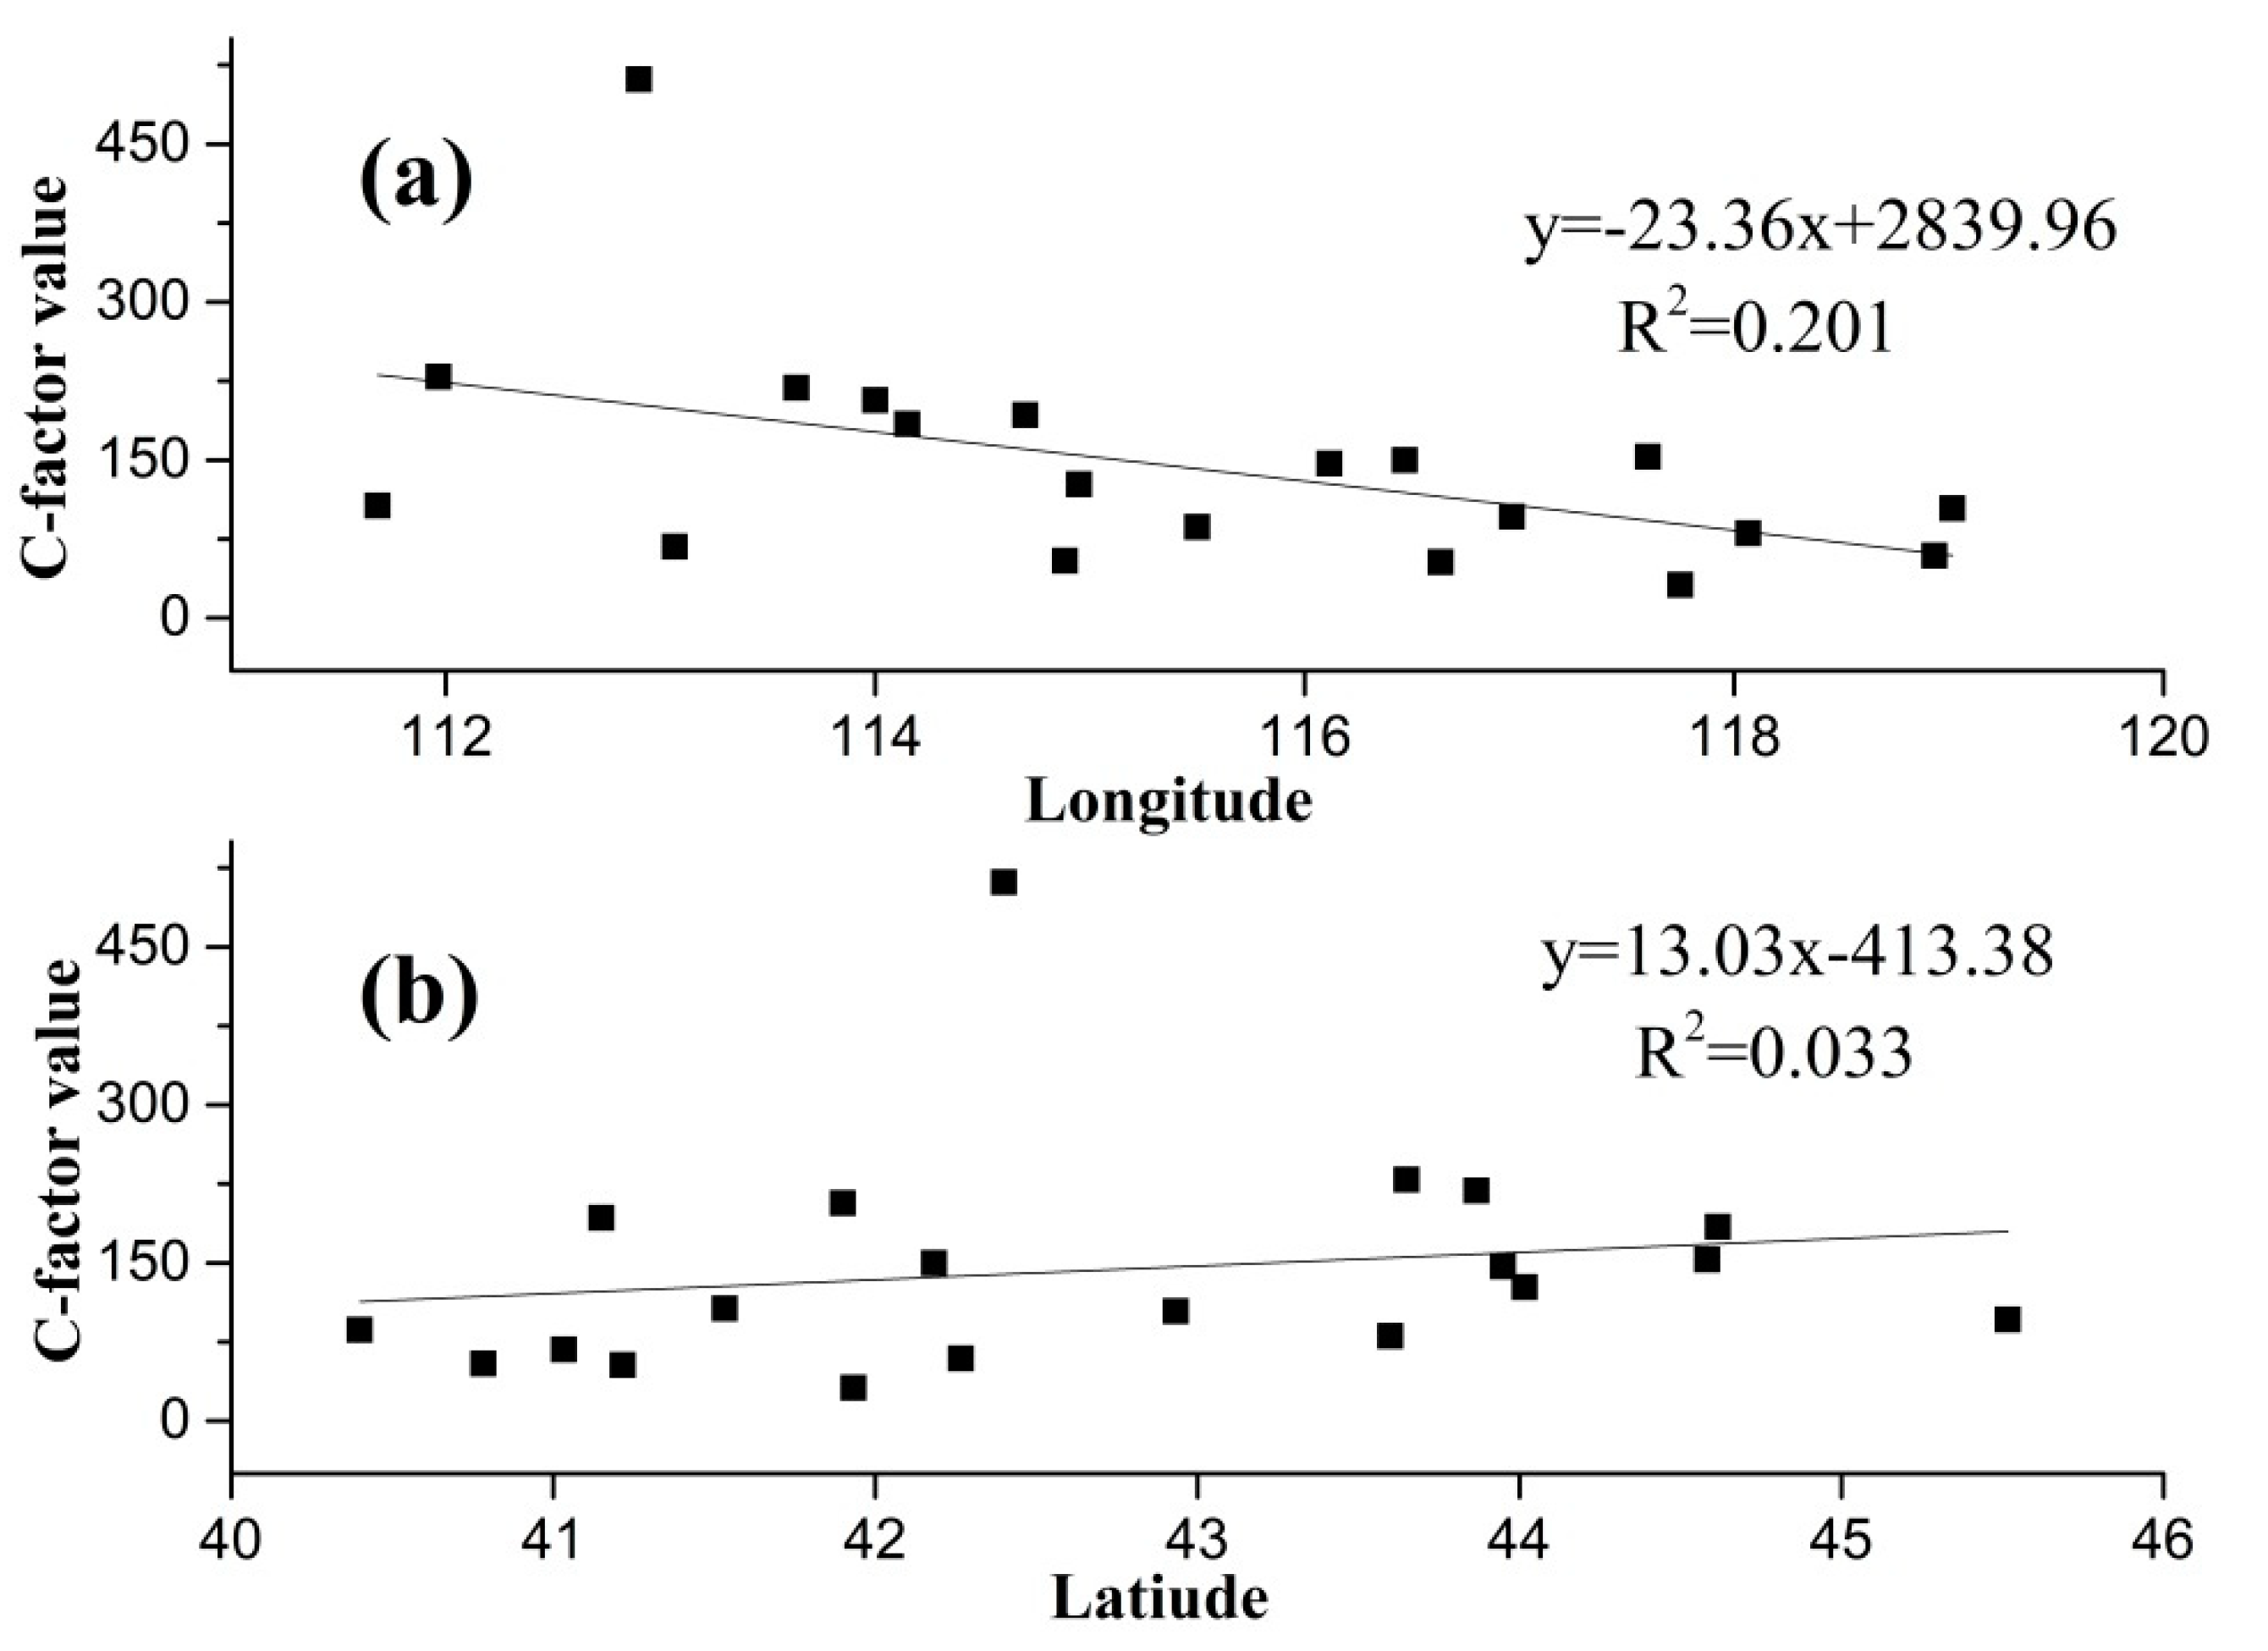
Figure 4.
Trend charts of C-factor value in (a–d) seasonal and (e) annual scales from 1980 to 2016.
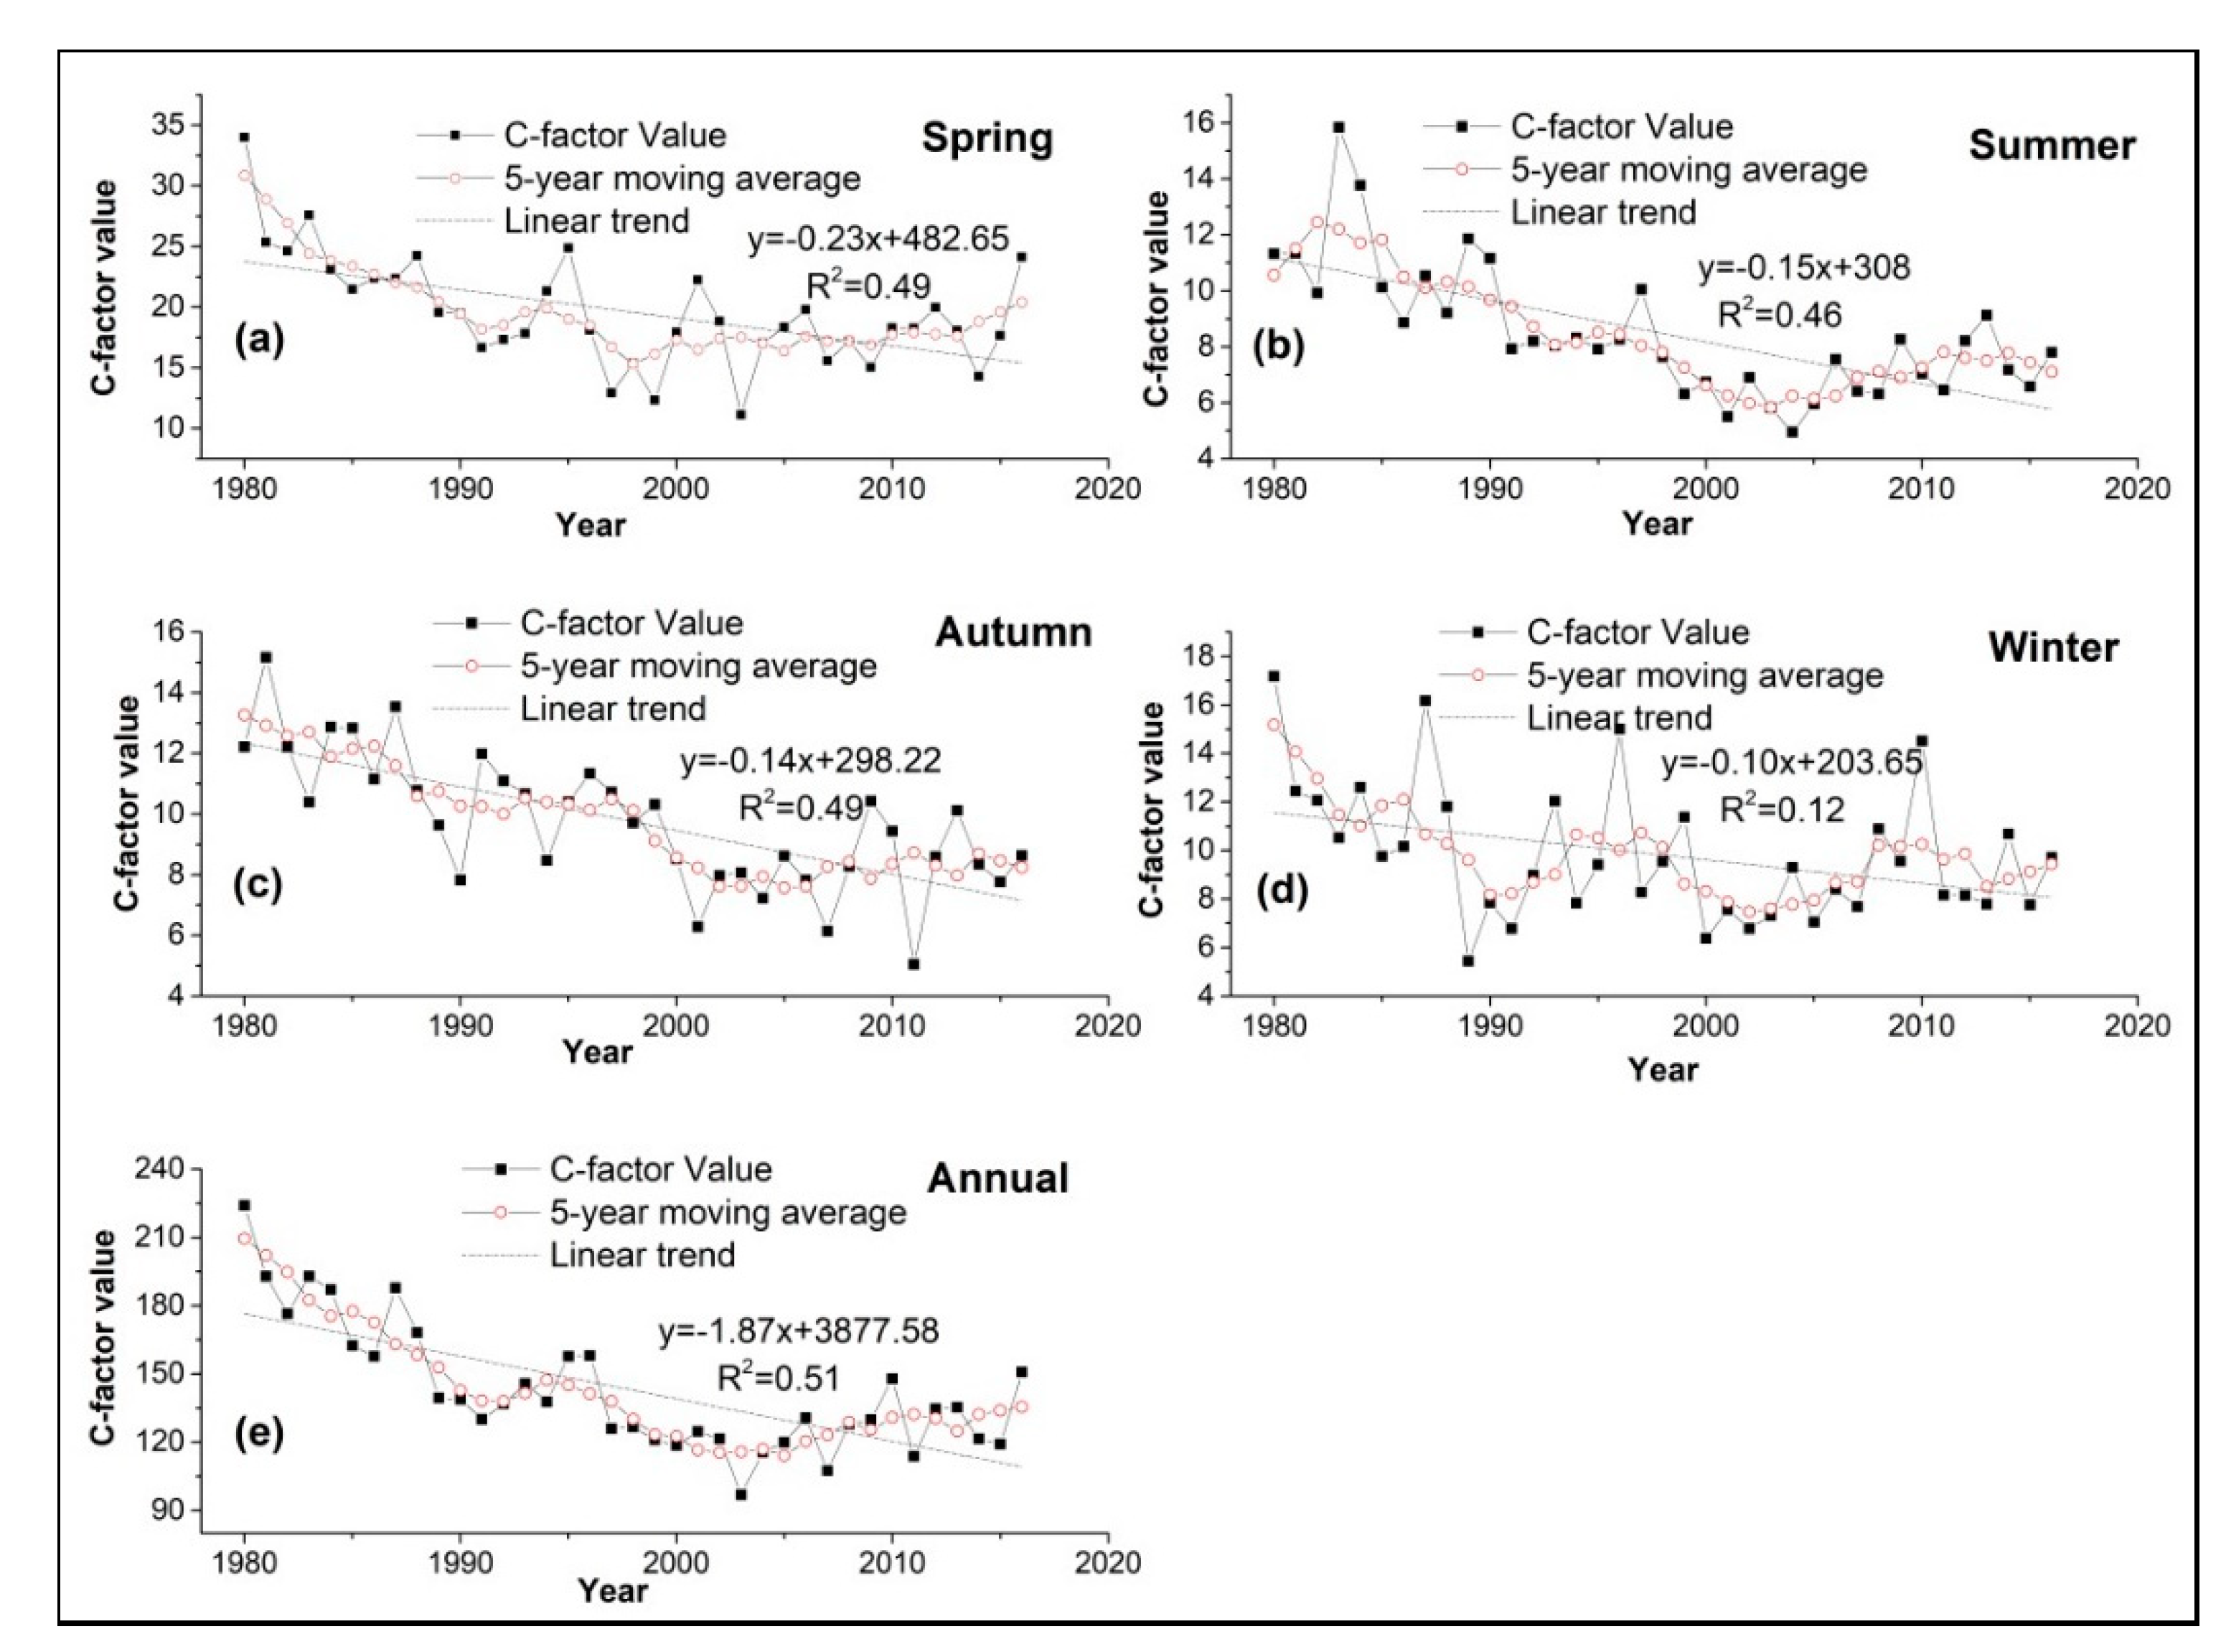
Figure 5.
Distribution maps of C-factor value change rates and variation trends in (a–d) seasonal and (e) annual scales. Red and green triangles denote upward and downward trends, respectively, and larger triangles denote those which have passed the significance test at p = 0.05 while the smaller ones do not.

Figure 6.
Correlation between annual climatic erosivity and Multivariate ENSO Index (MEI) for 20 weather stations from 1980 to 2016. A red cross shows a non-significant correlation (p > 0.05), a light blue asterisk represents a significant correlation at p < 0.05, and a larger blue asterisk represents a highly significant correlation at p < 0.01.

Table 1.
Variation trends of the C-factor value of weather stations.
| Periods of Time | ↑ | ↑* | ↑** | ↓ | ↓* | ↓** |
|---|---|---|---|---|---|---|
| Spring | 6 | 4 | 2 | 14 | 6 | 8 |
| Summer | 5 | 2 | 3 | 15 | 5 | 10 |
| Autumn | 6 | 4 | 2 | 14 | 6 | 8 |
| Winter | 9 | 7 | 2 | 11 | 5 | 6 |
| Annual | 6 | 4 | 2 | 14 | 6 | 8 |
Note: ‘↓’ and ‘↑’ represent the total number with downward and upward trends, respectively; ‘↓*’ and ‘↑*’ represent the number with a non-significant downward and upward trend, respectively; and ‘↓**’ and ‘↑**’ represent the number with a significant downward and upward trends (95% confidence level), respectively.
Table 2.
Average monthly climatic erosivity during El Niño and La Niña events from 1980 to 2016.
| No. | Warm and Cold Events | Time Span | Average Monthly Erosivity | No. | Warm and Cold Events | Time Span | Average Monthly Erosivity |
|---|---|---|---|---|---|---|---|
| 1 | Warm | 1980.1–1980.7 | 23.6 | 12 | warm | 2005.2–2005.5 | 14.78 |
| 2 | Warm | 1982.6–1983.8 | 15.73 | 13 | cold | 2006.3–2006.4 | 21.67 |
| 3 | Cold | 1985.3–1985.5 | 21.47 | 14 | warm | 2006.7–2007.2 | 7.29 |
| 4 | Warm | 1986.8–1988.3 | 13.91 | 15 | cold | 2007.8–2008.5 | 10.02 |
| 5 | Cold | 1988.6–1989.8 | 11.64 | 16 | warm | 2009.7–2010.5 | 11.75 |
| 6 | Warm | 1991.5–1992.7 | 11.47 | 17 | cold | 2010.6–2011.4 | 10.98 |
| 7 | Warm | 1992.12–1993.12 | 11.92 | 18 | cold | 2011.8–2012.2 | 6.31 |
| 8 | Warm | 1994.6–1995.3 | 9.34 | 19 | warm | 2012.5–2012.7 | 12.19 |
| 9 | Warm | 1997.4–1998.6 | 11.92 | 20 | warm | 2014.5–2014.9 | 10.09 |
| 10 | Cold | 1998.9–2000.4 | 10.58 | 21 | warm | 2015.3–2016.6 | 12.96 |
| 11 | Warm | 2002.5–2003.3 | 7.1 | Average climatic erosivity El Niño/La Niña | 12.03 | ||
| Average climatic erosivity El Niño | 12.41 | Average climatic erosivity La Niña | 11.16 | ||||
| Neutral average climatic erosivity | 11.78 | Average climatic erosivity | 11.9 | ||||
| Neutral average monthly climatic erosivity/average monthly climatic erosivity El Niño | 0.95 | ||||||
| Neutral average monthly climatic erosivity/average monthly climatic erosivity La Niña | 1.06 | ||||||
© 2019 by the authors. Licensee MDPI, Basel, Switzerland. This article is an open access article distributed under the terms and conditions of the Creative Commons Attribution (CC BY) license (http://creativecommons.org/licenses/by/4.0/).
Share and Cite
MDPI and ACS Style
Lou, J.; Wang, X.; Cai, D. Spatial and Temporal Variation of Wind Erosion Climatic Erosivity and Its Response to ENSO in the Otindag Desert, China. Atmosphere 2019, 10, 614. https://doi.org/10.3390/atmos10100614
AMA Style
Lou J, Wang X, Cai D. Spatial and Temporal Variation of Wind Erosion Climatic Erosivity and Its Response to ENSO in the Otindag Desert, China. Atmosphere. 2019; 10(10):614. https://doi.org/10.3390/atmos10100614
Chicago/Turabian StyleLou, Junpeng, Xunming Wang, and Diwen Cai. 2019. "Spatial and Temporal Variation of Wind Erosion Climatic Erosivity and Its Response to ENSO in the Otindag Desert, China" Atmosphere 10, no. 10: 614. https://doi.org/10.3390/atmos10100614
Note that from the first issue of 2016, this journal uses article numbers instead of page numbers. See further details here.