Airglow Derived Measurements of Q-Branch Transition Probabilities for Several Hydroxyl Meinel Bands
by
 ,
,
Christoph Franzen
1,2,*, 
Patrick Joseph Espy
1,2,
Niklas Hofmann
3,
Robert Edward Hibbins
1,2 and
Anlaug Amanda Djupvik
4 1
Department of Physics, Norwegian University of Science and Technology (NTNU), 7491 Trondheim, Norway
2
Birkeland Centre for Space Science (BCSS), 5007 Bergen, Norway
3
Department of Physics, Universität Regensburg, 93053 Regensburg, Germany
4
Nordic Optical Telescope, E-38700 Santa Cruz De La Palma, Spain
*
Author to whom correspondence should be addressed.
Atmosphere 2019, 10(10), 637; https://doi.org/10.3390/atmos10100637
Submission received: 27 September 2019
/
Revised: 13 October 2019
/
Accepted: 15 October 2019
/
Published: 22 October 2019
(This article belongs to the Special Issue Atmospheric Airglow—Recent Advances in Observations, Experimentations, and Modeling)
Abstract
:Spectroscopic measurements of the hydroxyl (OH) airglow emissions are often used to infer neutral temperatures near the mesopause. Correct Einstein coefficients for the various transitions in the OH airglow are needed to calculate accurate temperatures. However, studies showed experimentally and theoretically that the most commonly used Einstein spontaneous emission transition probabilities for the Q-branch of the OH Meinel (6,2) transition are overestimated. Extending their work to several Δv = 2 and 3 transitions from v′ = 3 to 9, we have determined Einstein coefficients for the first four Q-branch rotational lines. These have been derived from high resolution, high signal to noise spectroscopic observations of the OH airglow in the night sky from the Nordic Optical Telescope. The Q-branch Einstein coefficients calculated from these spectra show that values currently tabulated in the HITRAN database overestimate many of the Q-branch transition probabilities. The implications for atmospheric temperatures derived from OH Q-branch measurements are discussed.
1. Introduction
The reduction of ozone in the upper mesosphere creates hydroxyl (OH) via:
This chemical reaction is exothermic by ~3.3 eV, and creates the OH in vibrational levels with v′= 6–9 and excited rotational states. Relaxation of the vibrationally excited OH molecule happens through radiative and collisional relaxation. Radiative relaxation of this excited OH in the Meinel system results in the bright near-infrared (NIR) radiation known as OH nightglow or airglow. The OH Meinel emission occurs over an approximately 8 km thick layer [1], and spectroscopic observations of the nightglow have been used to infer the atmospheric conditions at the peak of the layer near 87 km altitude [2,3,4,5,6,7,8].
If the OH rotational states are fully thermalized with the surrounding atmosphere into a Boltzmann distribution, then the distribution of intensities in the rotational structure will yield a rotational temperature equal to the atmospheric temperature at this altitude. It is then possible to calculate the rotational temperature of the OH whenever at least two spectral lines originating from different upper rotational levels, J′, are observed (e.g., [9]). However, the calculation of a rotational temperature from spectral line intensities requires the precise knowledge of the Einstein spontaneous emission coefficients, Av′,v″,J′,J″. There have been several calculations and experimental estimates of these Einstein coefficients in the past [10,11,12,13], and those calculated by Pickett et al. [13] have been tabulated in the HITRAN database [14].
French et al. [15] showed that the Einstein coefficients from the (6,2) Meinel transition with ΔJ = 0 (Q-branch) become significantly lower with increasing rotational level than three different published sets of values. This discrepancy would affect the atmospheric temperatures fitted to either the Q-branch or a combination of the P-, Q-, and R-branches, depending upon their relative weighting.
Pendleton and Taylor [16] explained this disparity in the Q-branch transition probabilities as due to perturbation by the excited A2Σ1/2+ electronic state. This perturbation causes the ground state electronic angular momentum to de-couple from the inter-nuclear axis and couple directly with the nuclear angular momentum with increasing rotation. This L-uncoupling mixes the two ground-state levels whose electronic and spin angular momentum along the inter-nuclear axis are given by Ω = 1/2 and 3/2, changing the coupling from an intermediate Hund’s case (a)–(b) to Hund’s case (d), thus affecting the transition probabilities [17]. The primary perturbation of the P- and R- branch transition probabilities with ΔJ = ±1 is vibration-rotation coupling, which is generally included in line-strength calculations. Thus, the P- and R- branch transition probabilities tabulated in HITRAN agree with those calculated by Pendleton and Taylor [16]. However, the L-uncoupling proposed by Pendleton and Taylor [16] primarily affects the Q-branch transitions with ΔJ = 0. While Mies [10] attempted to correct for L-uncoupling in the transition from case (a)–(b) to case (d) with increasing rotation, it is generally not considered in the calculation of line strengths. Pendleton and Taylor showed that this effect accounted for the discrepancy found by French et al. [15] for the (6,2) Q-branch line strengths. However, while this angular-momentum uncoupling was verified for the (6,2) band, it has not been tested experimentally for transitions from other vibrational levels.
Due to the exothermicity of reaction (1), the internal rotational energy, primarily at high rotational levels N > 3, of the OH molecule may not be completely thermalized with the surrounding gas as has been indicated by recent observations [18]. This would result in a rotational temperature that is substantially different from the local kinetic temperature and calls into question the suitability of using OH airglow observations for remote sensing of mesospheric temperature. On the other hand, Fabry–Pérot interferometer observations at high enough spectral resolution to observe the Doppler line shape can be used to compare kinetic and rotational temperatures in order to quantify the degree of non-thermalization [19]. However, such observations have restricted free-spectral-range, limiting such high-resolution spectra to observations of the closely spaced rotational structure of the Q-branch for rotational temperature determinations [20,21]. The results of French et al. [15] and Pendleton and Taylor [16] for the (6,2) transition highlight the need for improved Q-branch transition probabilities for all the OH Meinel vibration–rotation transitions.
Here, we present measurements of the Q-branch Einstein coefficients, relative to the P- or R-branch, for seven vibrational transitions, (3,1), (4,2), (5,3), (6,4), (7,4), (8,5) and (9,7) using two different methods. We show that many of the measured Einstein coefficients are significantly lower than those tabulated in HITRAN [14], suggesting that the angular momentum uncoupling is a general feature that varies with vibrational level.
2. Instrumentation and Data Set
The data presented in this paper were obtained with the Nordic Optical Telescope (NOT). The NOT is located on La Palma, the Canary Islands (17°53′ W, 28°45′ N) and is equipped with a 2560 mm primary mirror [22]. Spectroscopic observations in the near-infrared are taken with the Nordic Optical Telescope near-infrared Camera and spectrograph (NOTCam) instrument. Data presented here were recorded with a slit size of 50 × 0.128 mm, corresponding to a field of view of 4 arc minutes by 0.6 arc seconds. This projects to approximately 100 m by 25 cm at the OH layer. The resolving power of R = λ/Δλ ~ 2100 is enough to separate the main OH airglow rotational lines in observed spectra.
NOTCam spectroscopy uses a grism with filters to isolate specific spectral regions. Most frequently the filters J, H, and K are used to isolate the wavelength regions 1.165–1.328 µm, 1.484–1.780 µm, and 2.083–2.363 µm, respectively. The J-band filter spans two OH Meinel transitions, the (7,4) and (8,5), while the H-band filter contains the (3,1), (4,2), (5,3) and (6,4) transitions and the K-band filter spans the (9,7) transition.
The airglow data were extracted from the terrestrial background of astronomical observations of point sources that span the years from 2007 to 2017. Data were selected with a preference for long integration times in order to achieve the highest quality. For sequences of consecutive, short integration observations, the sequences have been treated as a single observation with an integration time equal to the sum of integration times of the individual spectra. This resulted in observations with integration times between 4 and 80 min. Any spectra perturbed by other light sources or otherwise contaminated were not used. All observations were obtained at solar zenith angles greater than 105° in order to exclude solar scattering and twilight emissions. Observations of the same astronomical target on the same night were combined, resulting in 10 individual observations for each of the J and H bands, and 15 individual observations for the K band. Each of these individual observations was treated separately in the following analysis, and the results were combined to minimize the effect of different observing conditions. The total integration time of all observations considered in this research is 4.1 h for each of the J- and H- bands, and 9.6 h for the K-band
3. Method
3.1. Data Preparation
The data reduction employed here follows that developed and described in Franzen et al. [23]. The NOTCam spectra of astronomical point sources were chosen as described above. First, non-functioning pixels or pixels with an oversensitive measured current were removed according to established pixel masks [24]. The dark current was subtracted, and a relative intensity calibration was obtained using a flat-field image from a 3200 K halogen lamp. Since point-source astronomical objects only extend over a few spatial pixels (typically less than 60), these regions were masked leaving the spectrum of the extended-source atmosphere in the background. Warping effects along the slit from the telescope optics were corrected [23], and the final OH spectrum was integrated along the slit dimension to yield a conventional intensity versus wavelength spectrum. These steps were executed for each individual spectrum of a given astronomical target and then integrated to yield a single, high signal-to-noise spectrum of the OH airglow. Wavelength calibration was done with the OH line positions tabulated in the HITRAN database. As a further check on data quality, initial OH rotational temperatures were estimated with a simple least-square fit of the lowest three P-branch lines. Spectra yielding a temperature outside the range between 120 and 250 K, and therefore, exceeding the range normally found near the subtropical mesopause [25], were not used. Such temperatures would indicate unusual background conditions that could result in unreliable retrievals of the Q-branch coefficients.
The result is a spectrum of the OH airglow with a slowly changing background due to signal-dependent read-out processes. Since it is signal-dependent, it is not part of the dark image. To assess this background, we took any signal in the areas between the individual OH lines to be due to the background. A polynomial fit of fourth-order was made to only the areas free from OH emission to estimate the contribution of the background under the emission lines in that branch. This background was then subtracted to construct a background-free spectrum. Figure 1a shows an example of this background subtraction for the P-branch of the (3,1) transition, based on a total of seven minutes of integration time at an air mass of 1.3. The total spectrum is shown as a solid black line. The areas between the lines that are free of OH emission are marked with blue shading, and the fit through these areas is presented as a red, dashed line. Figure 1b then shows the spectrum with the background subtracted. This background subtraction method is used for each of the bands examined.
To verify the relative, wavelength-dependent radiance calibration, ratios of the intensities of P- and R-branch lines from the same upper state were compared with the ratio of their corresponding Einstein coefficients from the HITRAN database, and were found to be within the noise limits of the spectra.
3.2. Measuring Q-branch Einstein Coefficients
To measure the Q-branch Einstein coefficients two techniques were used. The first one involves measuring the ratio between Q- and either R- or P-branch lines from the same upper state to deduce the Einstein coefficients. This technique is the same as that used by French et al. [15]. This method, however, relies on lines from the same upper level being available for both the Q- and either the P- or R-branches. For transitions where P- or R-branch lines are not available for all corresponding Q-branch lines, a whole spectral fit method was employed. The two methods are described in detail below. We follow here the naming convention used in [15,17]. In addition to the P-, Q-, and R- branch, each line is denoted with its spin sub-state as a subscript and the rotational quantum number N in brackets.
3.2.1. Direct Line Ratio Method
The intensity of each rotational line from a given upper vibrational-rotational level, v′ and J′, is given by:
where, Nv′j′ is the relative population of the upper vibrational–rotational level v′, J′ and Av′,v″,J′,J″ is the Einstein coefficient for the J′ to J″ transition in question. In a given vibrational–rotational level, the upper state population is the same for all branches. Thus, the ratio of two lines from the same upper rotational level, but with different lower rotational levels, J″, collapses to the ratio of the two Einstein coefficients:
For example, given the intensities of the Q1(1) and P1(2) lines, which originate in the same upper level, the ratio of the transition probabilities in terms of the observed intensities can be calculated from:
In this manner, the Einstein coefficients of the Q-branch lines can be calculated relative to those in the P-branch that do not suffer from L-uncoupling [16]. For transitions, where the P-branch is not observed, for example, the (6,4) transition, the R-branch can be used. However, since the R-branch does not have a line from the lowest upper-state rotational level, the Q1(1) line Einstein coefficient cannot be calculated this way. Since the R-branch lines are less intense than the P-branch lines, the (6,4) transition coefficients determined using R-branch ratios typically have larger uncertainties.
To obtain the intensities of all lines, Gaussian functions that characterize the instrumental line-shape [23] were centered at the HITRAN positions of the rotational lines and their integrated intensities fitted to the spectrum using a least-squares method. The line width of the Gaussian line-shapes was allowed to vary by up to 2%, to account for small noise variations. In the case of overlaps between several lines, all lines were fitted at the same time. Figure 2 shows an example of such an overlap in the Q-branch of the (3,1) transition. The lines of the Q1-sub-branch (red) and the Q2-sub-branch (blue) overlap in parts. Tests with synthetic data showed that the wavelength positions of the overlapping lines are separated enough that the fit correctly retrieves the individual line intensities.
3.2.2. Spectral Fit Method
In addition, a second method was used to measure the Einstein coefficients for individual Q lines in cases where no corresponding line in the R- or P-branch was available within the optical filter range. Here, a synthetic spectrum of the P-branch of each transition was constructed for each vibrational level assuming an isothermal Boltzmann distribution for the populations of the rotational levels. The intensity of each rotational line from a given upper vibrational-rotational level, v′, is then given by:
where Nv′ is the relative population of the upper vibrational level v′, and T is the rotational temperature. The energy of the upper state Ev′,J′ is taken from the HITRAN database, and k is the Boltzmann constant. Convolving the lines with the Gaussian line shape of the instrument, the resulting synthetic spectrum was least-squares fitted to the P-branch to retrieve the relative population of the upper v′ vibrational level, Nv′, and the rotational temperature, T. Since the P-branch transition probabilities have been shown to be reliable by Pendleton and Taylor [16], the HITRAN Einstein coefficients were used in this least-squares fitting procedure.
Fixing the vibrational population and rotational temperature to that determined by the fit to the P-branch lines, a synthetic spectrum was then fitted to the corresponding Q-branch using the Einstein transition probabilities as free parameters. This resulted in fitted Q-branch transition probabilities that are relative to the P-branch coefficients tabulated in HITRAN. The low intensity of the Q2 sub-branch lines relative to the bright, overlapping Q1 lines resulted in large fitting errors for the Q2 coefficients. As a result, only the Q1 coefficients were significantly different from the values tabulated in HITRAN, and only these results will be discussed here.
3.2.3. Verification
To test the validity of the two methods employed here, synthetic data were created using tabulated Einstein coefficients and subjected to the same retrieval process. The coefficients were varied between 50% and 150% of the HITRAN values, and artificial Gaussian-white noise up to double the noise observed in the data was added. The Einstein coefficients retrieved from these synthetic data by both methods agreed with the values used in the synthetic dataset to within the fitting error. Moreover, the addition of a simple linear or quadratic background did not significantly skew the calculated values in any direction.
We also investigated whether the change in Einstein coefficients could be caused by external mechanisms, rather than the internal quantum mechanical coupling as discussed by Pendleton and Taylor [16]. Correlation coefficients were calculated between the measured Einstein coefficients and the temperature of the MLT region, the air mass through which the OH was observed, the integration time of the observation, the day of the year of the observation and the time in the night of the observation. None of these parameters showed any significant correlation with the Einstein coefficients, supporting the assertion that it is the Einstein coefficients themselves that differ from the tabulated values.
The 10 independent observations of the J- and H- bands, as well as the 15 independent K-band observations, were analyzed separately using each of the two methods described above to derive Einstein coefficients. For each method, the weighted average and standard error of the mean of the Einstein coefficients derived from the independent observations were then computed for each vibrational transition. The results for each method are presented and discussed below.
4. Results and Discussion
The two methods described above have been used to measure the Einstein coefficients. The direct line ratio method yielded transition probabilities for most of the Q1-branch lines, which are shown in Table 1 as the upper entry in each cell. The cases where no Einstein coefficient could be calculated are marked as (-). The spectral fit method resulted in transition probabilities of the first four Q1- branch lines for all seven Meinel transitions. The results for this method are also shown in Table 1 as the lower entry in each cell. All numbers are relative to the P-branch Einstein spontaneous emission transition probabilities except for the (6,4) transition, where no P-branch was available in the data due to the filter cut-off. In this case, transition probabilities were determined relative to the corresponding R-branch values. The respective values from the HITRAN (HIT) database are shown for comparison.
These data are illustrated in Figure 3, which shows the ratios of the measured Einstein coefficients derived from each method relative to the values listed in HITRAN. The dashed line at the value one is included for clarity. The seven transitions measured in this paper are separated in the vertical direction. The red circles are the results from the direct line ratios, while the blue crosses are the results from the spectral fit. All error bars shown represent twice the standard error of the mean of the measurements. The horizontal shift between the blue crosses and red circles for the same upper vibrational level J′ is merely for visibility.
As can be seen in Figure 3, where both methods for retrieving the Einstein coefficient could be measured together, they agree to within their standard errors. The direct line ratio method could not retrieve Einstein coefficients for the Q1(1) line of the (6,4) transition since only the R-branch, which does not have a transition from the same upper state as the Q1(1), was available. Similarly, the Q1(3) and Q1(4) lines cannot be retrieved from the (8,5) transition due to the filter cutting off the corresponding P-lines.
Most of the values shown in Figure 3 show smaller transition probabilities than listed in HITRAN. This is especially the case for the (3,1), (6,4), (7,4), (8,5), and (9,7) transitions, which show smaller values than HITRAN with tendencies to even smaller values at higher J′. Most of these values are significantly different from the HITRAN values by at least twice the standard error of the mean. However, the (4,2) and the (5,3) transitions lie closer to the HITRAN values than the others. Additionally, while the Q1(2) and Q1(4) lines of the (9,7) and (4,2) transitions, respectively, indicate that the HITRAN values may be slightly too small, the difference between the observations and the HITRAN values is insignificant to within the combined two-sigma uncertainties of the two data sets for these lines [26].
French et al. [15] studied the ratio of the line intensities from the Q- and the P-branches of the (6,2) transition. This transition is beyond the spectroscopic range of the NOTCam instrument, but data on the (6,4) transition, which originates from the same upper vibrational level, are available. The ratio of the P- and Q-branch Einstein coefficients in each of the two transitions are shown in Figure 4 for comparison with their corresponding HITRAN values. The measurements from French et al. [15] and the HITRAN values for the (6,2) transition are shown in black. Similarly, the measurements from this study, using the spectral fit method, and the values from HITRAN for the (6,4) transition are shown in red. While the absolute values of the two transitions are different, the relative differences between the measurements and the HITRAN values of the two transitions are similar.
An examination of Table 1 and Figure 3 shows that the deviations of the observed transition probabilities from the HITRAN values are similar for most vibrational levels with the exception of the v′ = 4 and 5. Thus, using this measured set of Einstein coefficients will change the temperature of any fit performed on the Q-branches of OH spectra. To quantify the extent of the temperature difference, synthetic spectra of the Q-branches were created using the spectral-fit Einstein coefficients listed in Table 1 at temperatures of 150, 175, 200, 225, and 250 K. A temperature fit was then performed employing the HITRAN Einstein coefficients. The deviation of the temperature extracted with the HITRAN coefficients (THITRAN) to the temperature of the original synthetic spectrum with the measured coefficients (Tmeasured) is shown in Figure 5.
We see from Figure 5 that the temperature obtained with tabulated Einstein coefficients is always different from the rotational temperature at which the OH was synthesized. For the v′ = 4 and 5 transitions, where the Einstein coefficients measured here are closer to the tabulated ones in HITRAN, the temperature difference is between 5 and 25 K, dependent on the synthesized temperature of the OH. For the other transitions, where there is a larger difference between the measured Einstein coefficients and the tabulated values, the temperature difference is between 5 and 43 K, again dependent on the synthesized temperature of the OH.
To test these new coefficients on an independent data set, we applied them to the rotational line intensities of the (3,1) and (7,4) bands listed in Espy and Hammond [27]. Fitting all the P1- and P2-branch lines present in both bands (N < 5) with the HITRAN coefficients produced temperatures for the (3,1) and (7,4) transitions of 158.6 ± 0.5 K and 164.8 ± 0.2 K, respectively. Fitting Q-branch temperatures with the HITRAN coefficients resulted in temperatures −15.6 K lower for the (3,1) and −6.7 K lower for the (7,4) bands. However, using the Q-branch Einstein coefficients measured here reproduced the P-branch temperatures for both bands. These temperature differences when using the Q-branch transition probabilities from HITRAN and those measured here are consistent with the results shown in Figure 5 for the NOT data, and the results are shown in Figure 5 as red diamonds with error bars.
5. Conclusions
By evaluating a total of 17.8 h of astronomical background NIR spectroscopic observations of the OH airglow obtained by the Nordic Optical Telescope NOTCam instrument, we have calculated Einstein coefficients of the Q1-branches of seven Meinel vibrational transitions (3,1), (4,2), (5,3), (6,4), (7,4), (8,5) and (9,7). The methods used to extract the coefficients were tested and verified with synthetic data, and the resulting transition probabilities were found not to be influenced by observation conditions. Most of the measured Einstein coefficients are significantly lower than the values tabulated in the HITRAN database, differing from the tabulated values by at least twice the standard error of the measurements.
Analysis of an independent data set showed that these experimentally derived transition probabilities lead to consistent rotational temperatures from the P- and Q-branches of the OH Meinel bands. However, currently tabulated HITRAN Einstein coefficients yield temperatures for the Q-branch that differ from the P-branch temperature by 5 to 43 K, depending on the Meinel transition in question and the temperature of the OH. This would affect the atmospheric temperatures fitted to either the Q-branch or a combination of the P-, Q-, and R-branches. Thus, temperature determinations using the Q-branch lines and existing tabulated transition probabilities will lead to artificial inconsistencies between rotational and translational temperatures [20,21].
Author Contributions
Conceptualization, C.F. and P.J.E.; methodology, C.F. and P.J.E.; software, C.F. and N.H.; validation, C.F.; formal analysis, C.F.; investigation, A.A.D. and C.F.; resources, A.A.D.; writing-original draft preparation, C.F.; writing-review and editing, C.F., P.J.E., R.E.H., N.H. and A.A.D.; visualization, C.F.; supervision, P.J.E. and R.E.H.; project administration, P.J.E.; funding acquisition, P.J.E. and R.E.H.
Funding
This research was funded by Research Council of Norway/CoE under contract 223252/F50.
Acknowledgments
This work was based on observations made with the Nordic Optical Telescope, operated by the Nordic Optical Telescope Scientific Association at the Observatorio del Roque de los Muchachos, La Palma, Spain of the Instituto de Astrofisica de Canarias. It was supported by the Research Council of Norway/CoE under contract 223252/F50. Archive data from the NOTCam can be accessed via: http://www.not.iac.es/observing/forms/fitsarchive/.
Conflicts of Interest
The authors declare no conflict of interest.
References
- Baker, D.J.; Stair, J.A.T. Rocket measurements of the altitude distributions of the hydroxyl airglow. Phys. Scr. 1988, 37, 611–622. [Google Scholar] [CrossRef]
- Franzen, C.; Espy, P.J.; Hibbins, R.E.; Djupvik, A.A. Observation of Quasiperiodic Structures in the Hydroxyl Airglow on Scales Below 100 m. J. Geophys. Res.-Atmos. 2018, 123, 10935–10942. [Google Scholar] [CrossRef]
- Pendleton, W.R.; Espy, P.J.; Baker, D.; Steed, A.; Fetrow, M.; Henriksen, K. Observation of OH Meinel (7,4) P(N″ = 13) transitions in the night airglow. J. Geophys. Res.-Space 1989, 94, 505–510. [Google Scholar] [CrossRef]
- Sivjee, G.G. Airglow hydroxyl emissions. Planet. Space Sci. 1992, 40, 235–242. [Google Scholar] [CrossRef]
- Espy, P.J.; Stegman, J. Trends and variability of mesospheric temperature at high-latitudes. Phys. Chem. Earth 2002, 27, 543–553. [Google Scholar] [CrossRef]
- Bittner, M.; Offermann, D.; Graef, H.H. Mesopause temperature variability above a midlatitude station in Europe. J. Geophys. Res.-Atmos. 2000, 105, 2045–2058. [Google Scholar] [CrossRef]
- Wüst, S.; Bittner, M.; Yee, J.H.; Mlynczak, M.G.; Russell, J.M., III. Variability of the Brunt–Väisälä frequency at the OH* layer height. Atmos. Meas. Tech. 2017, 10, 4895–4903. [Google Scholar]
- Taylor, M.J.; Pendleton, W.R., Jr.; Pautet, P.-D.; Zhao, Y.; Olsen, C.; Babu, H.K.S.; Medeiros, A.F.; Takahashi, H. Recent progress in mesospheric gravity wave studies using nightglow imaging system. Rev. Bras. Geofísica 2007, 25, 49–58. [Google Scholar] [CrossRef]
- Pautet, P.D.; Taylor, M.J.; Pendleton, W.R.; Zhao, Y.; Yuan, T.; Esplin, R.; McLain, D. Advanced mesospheric temperature mapper for high-latitude airglow studies. Appl. Opt. 2014, 53, 5934–5943. [Google Scholar] [CrossRef] [Green Version]
- Mies, F.H. Calculated vibrational transition probabilities of OH(X2Π). J. Mol. Spectrosc. 1974, 53, 150–188. [Google Scholar] [CrossRef]
- Turnbull, D.N.; Lowe, R.P. New hydroxyl transition probabilities and their importance in airglow studies. Planet. Space Sci. 1989, 37, 723–738. [Google Scholar] [CrossRef]
- Langhoff, S.R.; Werner, H.J.; Rosmus, P. Theoretical transition probabilities for the OH meinel system. J. Mol. Spectrosc. 1986, 118, 507–529. [Google Scholar] [CrossRef]
- Pickett, H.M.; Poynter, R.L.; Cohen, E.A.; Delitsky, M.L.; Pearson, J.C.; Müller, H.S.P. Submillimeter, Millimeter, and Microwave Spectral Line Catalog. J. Quant. Spectrosc. Radiat. Transf. 1998, 60, 883–890. [Google Scholar] [CrossRef]
- Rothman, L.S.; Gordon, I.E.; Babikov, Y.; Barbe, A.; Chris Benner, D.; Bernath, P.F.; Birk, M.; Bizzocchi, L.; Boudon, V.; Brown, L.R.; et al. The HITRAN2012 molecular spectroscopic database. J. Quant. Spectrosc. Radiat. Transf. 2013, 130, 4–50. [Google Scholar] [CrossRef]
- French, W.J.R.; Burns, G.B.; Finlayson, K.; Greet, P.A.; Lowe, R.P.; Williams, P.F.B. Hydroxyl (6/2) airglow emission intensity ratios for rotational temperature determination. Ann. Geophys. 2000, 18, 1293–1303. [Google Scholar]
- Pendleton, W.R.; Taylor, M.J. The impact of L-uncoupling on Einstein coefficients for the OH Meinel (6,2) band: Implications for Q-branch rotational temperatures. J. Atmos. Sol. Terr. Phys. 2002, 64, 971–983. [Google Scholar] [CrossRef]
- Herzberg, G. Molecular Spectra and Molecular Structure. I. Spectra of the Diatomic Molecule; D. Van Nostrand Company, Inc.: New York, NY, USA, 1950; p. 658. [Google Scholar]
- Noll, S.; Kausch, W.; Kimeswenger, S.; Unterguggenberger, S.; Jones, A.M. OH populations and temperatures from simultaneous spectroscopic observations of 25 bands. Atmos. Chem. Phys. 2015, 15, 3647–3669. [Google Scholar] [CrossRef] [Green Version]
- Greet, P.A. Mesospheric observations by high-resolution Fabry-Perot spectrometers: Calibrations required for climate change studies. J. Atmos. Sol. Terr. Phys. 1997, 59, 281–294. [Google Scholar] [CrossRef]
- Innis, J.L.; Phillips, F.A.; Burns, G.B.; Greet, P.A.; French, W.J.R.; Dyson, P.L. Mesospheric temperatures from observations of the hydroxyl (6–2) emission above Davis, Antarctica: A comparison of rotational and Doppler measurements. Ann. Geophys. 2001, 19, 359–365. [Google Scholar] [CrossRef]
- Wiens, R.H.; Moise, A.; Brown, S.; Sargoytchev, S.; Peterson, R.N.; Shepherd, G.G.; Lopez-Gonzalez, M.J.; Lopez-Moreno, J.J.; Rodrigo, R. SATI: A spectral airglow temperature imager. Adv. Space Res. 1997, 19, 677–680. [Google Scholar] [CrossRef]
- Djupvik, A.A.; Andersen, J. The Nordic Optical Telescope. In Highlights of Spanish Astrophysics V; Diego, J.M., Goicoechea, L., González-Serrano, J.I., Gorgas, J., Eds.; Springer: Berlin/Heidelberg, Germany, 2010; pp. 211–218. [Google Scholar] [Green Version]
- Franzen, C.; Hibbins, R.E.; Espy, P.J.; Djupvik, A.A. Optimizing hydroxyl airglow retrievals from long-slit astronomical spectroscopic observations. Atmos. Meas. Tech. 2017, 10, 3093–3101. [Google Scholar] [CrossRef] [Green Version]
- Djupvik, A.A. The Nordic Optical Telescope Near-Infrared Camera and Spectrograph. Available online: http://www.not.iac.es/instruments/notcam/ (accessed on 24 April 2019).
- Leblanc, T.; Stuart McDermid, I.; Keckhut, P.; Hauchecorne, A.; She, C.-Y.; Krueger, D. Temperature climatology of the middle atmosphere from long-term lidar measurements at middle and low latitudes. J. Geophys. Res. 1998, 1031, 17191–17204. [Google Scholar] [CrossRef]
- Goldman, A.; Schoenfeld, W.G.; Goorvitch, D.; Chackerian, C.; Dothe, H.; Mélen, F.; Abrams, M.C.; Selby, J.E.A. Updated line parameters for OH X2II–X2II (ν″,ν′) Transitions. J. Quant. Spectrosc. Radiat. Transf. 1998, 59, 453–469. [Google Scholar] [CrossRef]
- Espy, P.J.; Hammond, M.R. Atmospheric transmission coefficients for hydroxyl rotational lines used in rotational temperature determinations. J. Quant. Spectrosc. Radiat. Transf. 1995, 54, 879–889. [Google Scholar] [CrossRef]
Figure 1.
Example of the background fit and subtraction on the P-branch of the (3,1) transition. (a) Fit to the background. The clean areas between the lines are marked in blue, and the fit of a fourth-order polynomial to these areas is shown as a red dashed line. (b) The same spectrum with the background subtracted.

Figure 2.
Example of the decomposition of the Q-branch. All lines are synthetic data. Black shows the total spectrum of the Q-branch of the (3,1) transition with a rotational temperature of 200 K and line widths commensurate with the instrumental resolution. The dashed red line shows the contribution from the Q1(N) lines. The dashed blue line shows the contribution from the Q2(N) sub-branch.
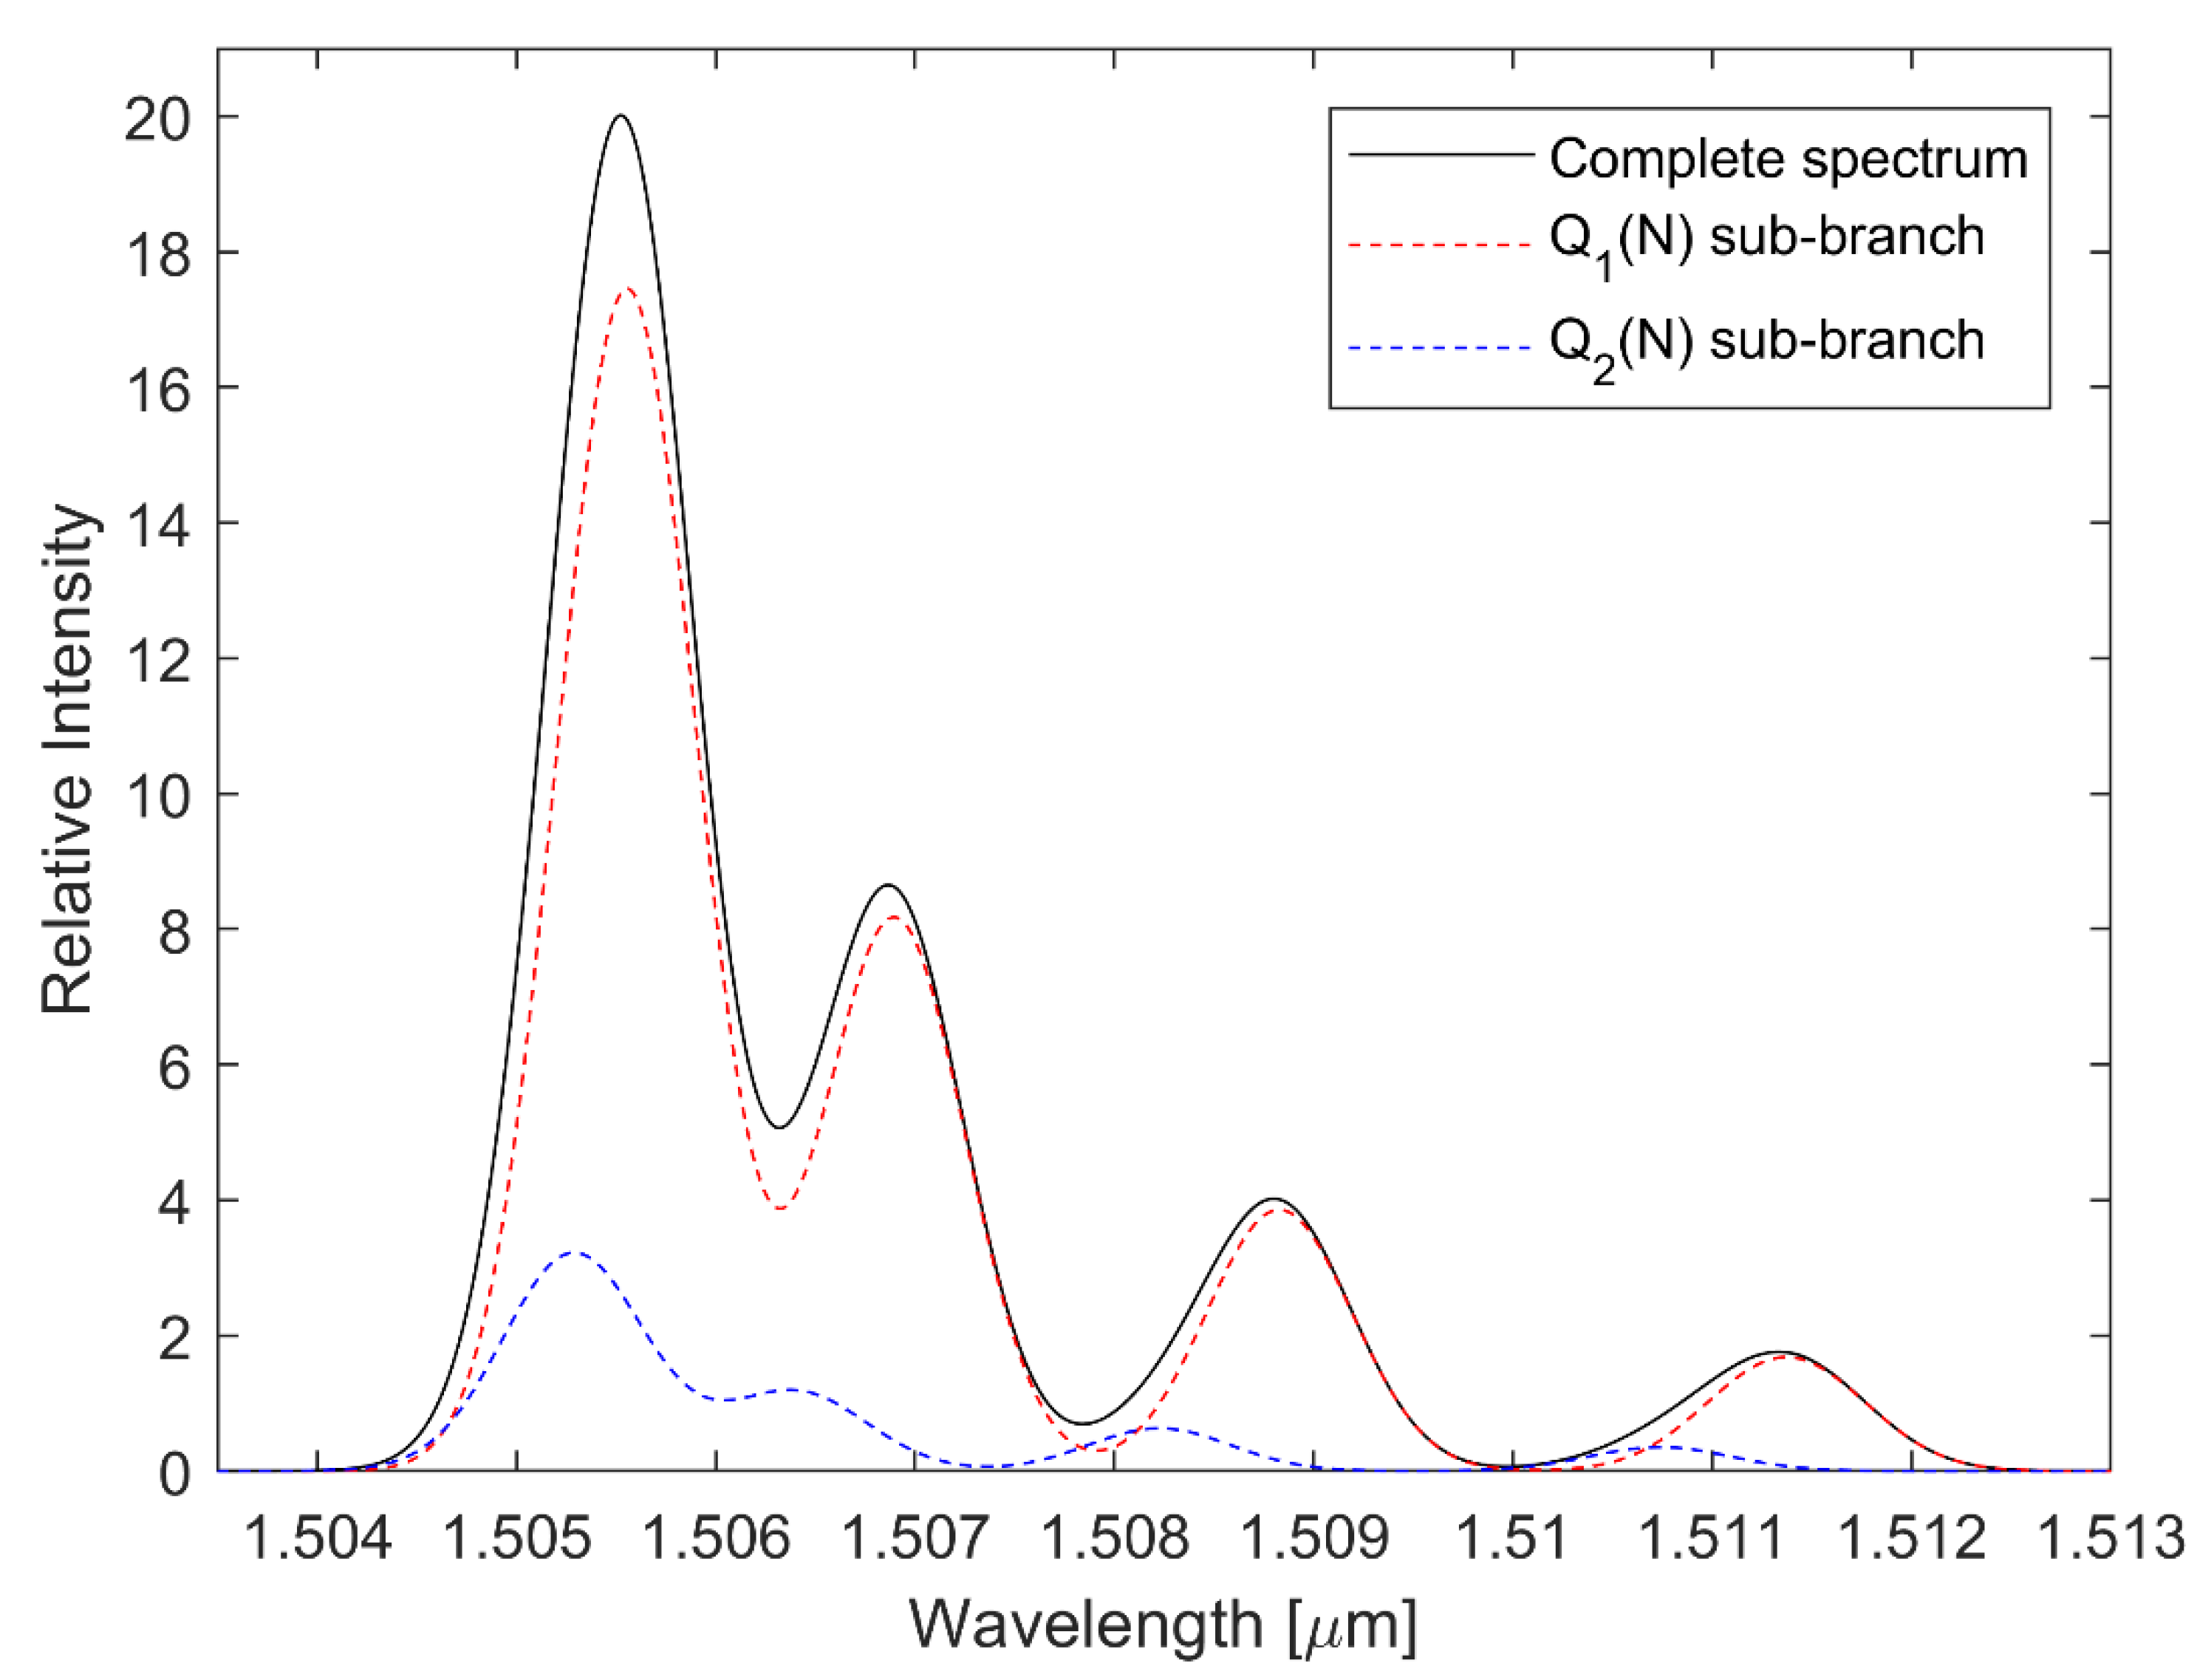
Figure 3.
Ratio of the measured Einstein coefficients relative to those reported in the HITRAN database. The first four Q1-branch lines of the seven Meinel transitions are shown. The red circles are those determined using the direct line ratio method, while the blue crosses represent those determined from the spectral fit method. The error bars represent twice the standard error of the mean.

Figure 4.
In black: The ratio of the Einstein coefficients derived from the P-and Q-branch lines French et al. [15] of the (6,2) transition (crosses) and the HITRAN values for the (6,2) transition (circles, dashed). In red: The same ratio from this study of the (6,4) transition using the spectral fit method (crosses) and from HITRAN for the same transition (circles, dashed).

Figure 5.
Difference between the temperature of the fit with HITRAN coefficients and the temperature of the synthetic spectrum created with the coefficients measured in this study plotted as a function of upper vibrational level v′ for a range of synthetic spectra temperatures between 150 and 250 K. The two red diamonds represent fits to data from Espy and Hammond [27].


Table 1.
Einstein transition probabilities for the spontaneous emission of the first four Q-branch lines of the vibrational transitions. Each value is given for the direct line ratio method (upper entry) and the spectral fit method (lower entry). Values which could not be calculated are marked as (-). The measured values are given with their respective errors of one standard error of the mean and the HITRAN (HIT) value for comparison. All numbers are in units of s−1.
| Line: | Q1(1) | Q1(2) | Q1(3) | Q1(4) | ||||
|---|---|---|---|---|---|---|---|---|
| Transition | Measured | HIT | Measured | HIT | Measured | HIT | Measured | HIT |
| (3,1) | 13.80 ± 0.06 13.57 ± 0.06 | 15.70 | 5.68 ± 0.07 5.83 ± 0.05 | 6.39 | 2.30 ± 0.05 2.45 ± 0.06 | 3.35 | 1.32 ± 0.18 1.27 ± 0.07 | 2.01 |
| (4,2) | 25.20 ± 0.13 24.83 ± 0.09 | 27.71 | 10.65 ± 0.09 10.71 ± 0.05 | 11.30 | 5.59 ± 0.13 5.54 ± 0.07 | 5.94 | 3.71 ± 0.15 3.80 ± 0.13 | 3.57 |
| (5,3) | 34.66 ± 0.15 34.44 ± 0.20 | 40.29 | 14.89 ± 0.18 15.20 ± 0.10 | 16.46 | 8.30 ± 0.24 8.51 ± 0.06 | 8.67 | 4.36 ± 0.10 4.41 ± 0.06 | 5.22 |
| (6,4) | (-) 46.35 ± 1.32 | 51.88 | 19.58 ± 0.59 19.63 ± 0.59 | 21.25 | 7.45 ± 0.51 7.58 ± 0.49 | 11.21 | 4.03 ± 0.79 4.01 ± 0.75 | 6.75 |
| (7,4) | 14.10 ± 0.05 13.71 ± 0.07 | 15.72 | 6.16 ± 0.13 6.34 ± 0.15 | 6.46 | 2.97 ± 0.14 2.98 ± 0.12 | 3.42 | 1.19 ± 0.16 1.25 ± 0.19 | 2.07 |
| (8,5) | 20.00 ± 0.36 19.11 ± 0.27 | 22.78 | 7.89 ± 0.20 8.28 ± 0.16 | 9.38 | (-) 4.16 ± 0.16 | 4.98 | (-) 1.09 ± 0.07 | 3.02 |
| (9,7) | 56.93 ± 0.47 56.03 ± 0.36 | 63.16 | 27.12 ± 0.26 27.35 ± 0.30 | 26.01 | 11.72 ± 0.18 11.55 ± 0.13 | 13.75 | 4.55 ± 0.24 4.83 ± 0.25 | 8.30 |
© 2019 by the authors. Licensee MDPI, Basel, Switzerland. This article is an open access article distributed under the terms and conditions of the Creative Commons Attribution (CC BY) license (http://creativecommons.org/licenses/by/4.0/).
Share and Cite
MDPI and ACS Style
Franzen, C.; Espy, P.J.; Hofmann, N.; Hibbins, R.E.; Djupvik, A.A. Airglow Derived Measurements of Q-Branch Transition Probabilities for Several Hydroxyl Meinel Bands. Atmosphere 2019, 10, 637. https://doi.org/10.3390/atmos10100637
AMA Style
Franzen C, Espy PJ, Hofmann N, Hibbins RE, Djupvik AA. Airglow Derived Measurements of Q-Branch Transition Probabilities for Several Hydroxyl Meinel Bands. Atmosphere. 2019; 10(10):637. https://doi.org/10.3390/atmos10100637
Chicago/Turabian StyleFranzen, Christoph, Patrick Joseph Espy, Niklas Hofmann, Robert Edward Hibbins, and Anlaug Amanda Djupvik. 2019. "Airglow Derived Measurements of Q-Branch Transition Probabilities for Several Hydroxyl Meinel Bands" Atmosphere 10, no. 10: 637. https://doi.org/10.3390/atmos10100637
Note that from the first issue of 2016, this journal uses article numbers instead of page numbers. See further details here.