Article

Sustainable Development of New Urbanization from the Perspective of Coordination: A New Complex System of Urbanization‒Technology Innovation and the Atmospheric Environment

1
School of International Business & Languages, Ningbo Polytechnic, Ningbo 315800, Zhejiang, China
2
Institute of Environmental Economics Research, Ningbo Polytechnic, Ningbo 315800, Zhejiang, China
3
Ningbo Institute of Oceanography, Ningbo 315832, Zhejiang, China
*
Author to whom correspondence should be addressed.
Atmosphere 2019, 10(11), 652; https://doi.org/10.3390/atmos10110652
Submission received: 26 September 2019 / Revised: 24 October 2019 / Accepted: 25 October 2019 / Published: 28 October 2019
(This article belongs to the Section Biometeorology)

Abstract

:
Exploring the coordinated development of urbanization (U), technology innovation (T), and the atmospheric environment (A) is an important way to realize the sustainable development of new-type urbanization in China. Compared with existing research, we developed an integrated index system that accurately represents the overall effect of the three subsystems of UTA, and a new weight determination method, the structure entropy weight (SEW), was introduced. Then, we constructed a coordinated development index (CDI) of UTA to measure the level of sustainability of new-type urbanization. This study also analyzed trends observed in UTA for 11 cities in Zhejiang Province of China, using statistical panel data collected from 2006 to 2017. The results showed that: (1) urbanization efficiency, the benefits of technological innovation, and air quality weigh the most in the indicator systems, which indicates that they are key factors in the behavior of UTA. The subsystem scores of the 11 cities show regional differences to some extent. (2) Comparing the coordination level of UTA subsystems, we found that the order is: coordination degree of UT > coordination degree of UA > coordination degree of TA. This suggests that the atmospheric environment system improvement is an important strategic decision for sustainable urbanization in Zhejiang. (3) The UTACDI values of the 11 cities are not high enough, as the coordination is mainly low, basic, or good, while none of the cities reached the stage of excellent coordination. (4) Gray Model (1,1) revealed that the time taking to achieve excellent coordination varies for different cities. Hangzhou and Ningbo were predicted to reach the excellent coordination level in 2018. Other cities are predicted to take 2–4 years to adjust their urbanization strategies enough to be considered to have excellent coordination of their UTA system.

1. Introduction

Sustainable progress towards new-type urbanization is an important part of the Beautiful China project [1,2]. Urbanization is one of the most significant human activities to affect regional environment and sustainable development. Over the past 40 years since the reform and opening-up, China’s urbanization has undergone rapid development [3,4], with the urban demographic growing from 17.9% in 1978 to 58.52% in 2017. However, urban expansion alters land cover and industrial structure, and the surge in fossil fuel consumption is accelerating urban air pollution [5,6], which not only affects the health of residents, but also directly threatens the sustainable construction of new urban structures. Thus, under the background of increasingly developed scientific and technological innovation, it is of great significance to realize the coordinated development of regional urbanization and the atmospheric environment [7,8,9].
Urbanization sustainability assessment is a test of population agglomeration, land space use, industrial economy, social and cultural reconstruction, the development of science and technology, and eco-environmental sustainability [10,11]. In recent years, within systems theory and complexity science, more and more scholars have been paying attention to the relationship between urbanization and the environment [12,13,14,15,16]. The coupling of urbanization and the environment is a dynamic, multidimensional, and collaborative system. It forms a set of concepts, for instance urban social‒ecological systems (USEs) [17], urbanization‒resources‒environment systems (UREs) [18,19], and urban population‒resources‒environment‒economic and social development systems (PRED) [20]. Although the evaluation indicators selected by different evaluation systems are different, they undoubtedly have deepened our understanding of the functional relationship between urbanization and the environment. As an important component of the eco-environment, the air environment subsystem has an extremely complex interaction with the urbanization process, and has been a major concern in social and academic circles [8,9,21]. Existing studies using a coupling coordination degree model focus on the interaction between urbanization and the air environment [7], which exhibited a S-shaped curve. The double exponential curve and three principals were proposed to analyze the coupling regularity between urbanization and the atmospheric environment [22,23]. In addition, many environmental economists have discussed the relationship between urbanization and air quality by using econometric and geographic methods, such as ordinary least squares (OLS) [24], spatial regression models [6,25], geographically weighted regression (GWR) [6,26], and the geographical detector method [27]. All of these studies reveal the impact of population, industrial structure, energy consumption, and other factors on the air environment system in the process of urbanization [6,12,28]. However, the above studies present the following two problems: (1) Urbanization is an open and complex system; however, the regulation and promotion of science and technology are neglected in the existing urbanization‒air environment system, although research on the relationship between technological innovation and environmental pollution in industrial enterprises has been receiving more and more attention [29,30]. (2) The existing urbanization and eco-environmental coupling (UEC) model always treat urbanization, resources, and the environment as independent systems with complex interactive forcing relationships [18]. However, from the perspective of coordination, the three systems of urbanization, technological innovation, and the atmospheric environment are inseparable and thus form a larger system, UTA, the coherence and internal state of which indicate the sustainability of new-type urbanization. Hence, it is necessary to reanalyze and explore the interactions among the urbanization, technological innovation, and atmospheric environment subsystems of UTA to realize sustainable new-type urbanization with a new framework. Suitable management measures should be implemented without delay in rapidly urbanizing areas [18,31].
Compared with the existing research, the main contributions of this paper are as follows: (1) we develop an integrated index system that accurately represents the overall effect of urbanization, technological innovation, and the atmospheric environment (UTA) on the sustainability of new-type urbanization. This paper investigates the three subsystems of UTA at the same level to highlight the important coordination and linking role of technological innovation in urbanization and the atmospheric environment. (2) The structure entropy weight (SEW) method is introduced in this study and the advantages of subjective and objective weight methods are considered so that more accurate and reliable scoring results of coordinated development index of UTA can be obtained. (3) The values of individual cities in Zhejiang are predicted based on the Gray Model (1,1), which is conducive to the formulation of new urbanization management policies.
The remainder of this paper is organized as follows. Section 2 describes the study area, data processing, and the methodology used to establish the analysis theoretical framework for UTACDI. Section 3 discusses the models developed in Section 2, analyzes the results obtained for 11 cities in Zhejiang, and predicts the variation of UTACDI. Section 4 draws the main conclusions derived from the empirical study.

2. Methods and Materials
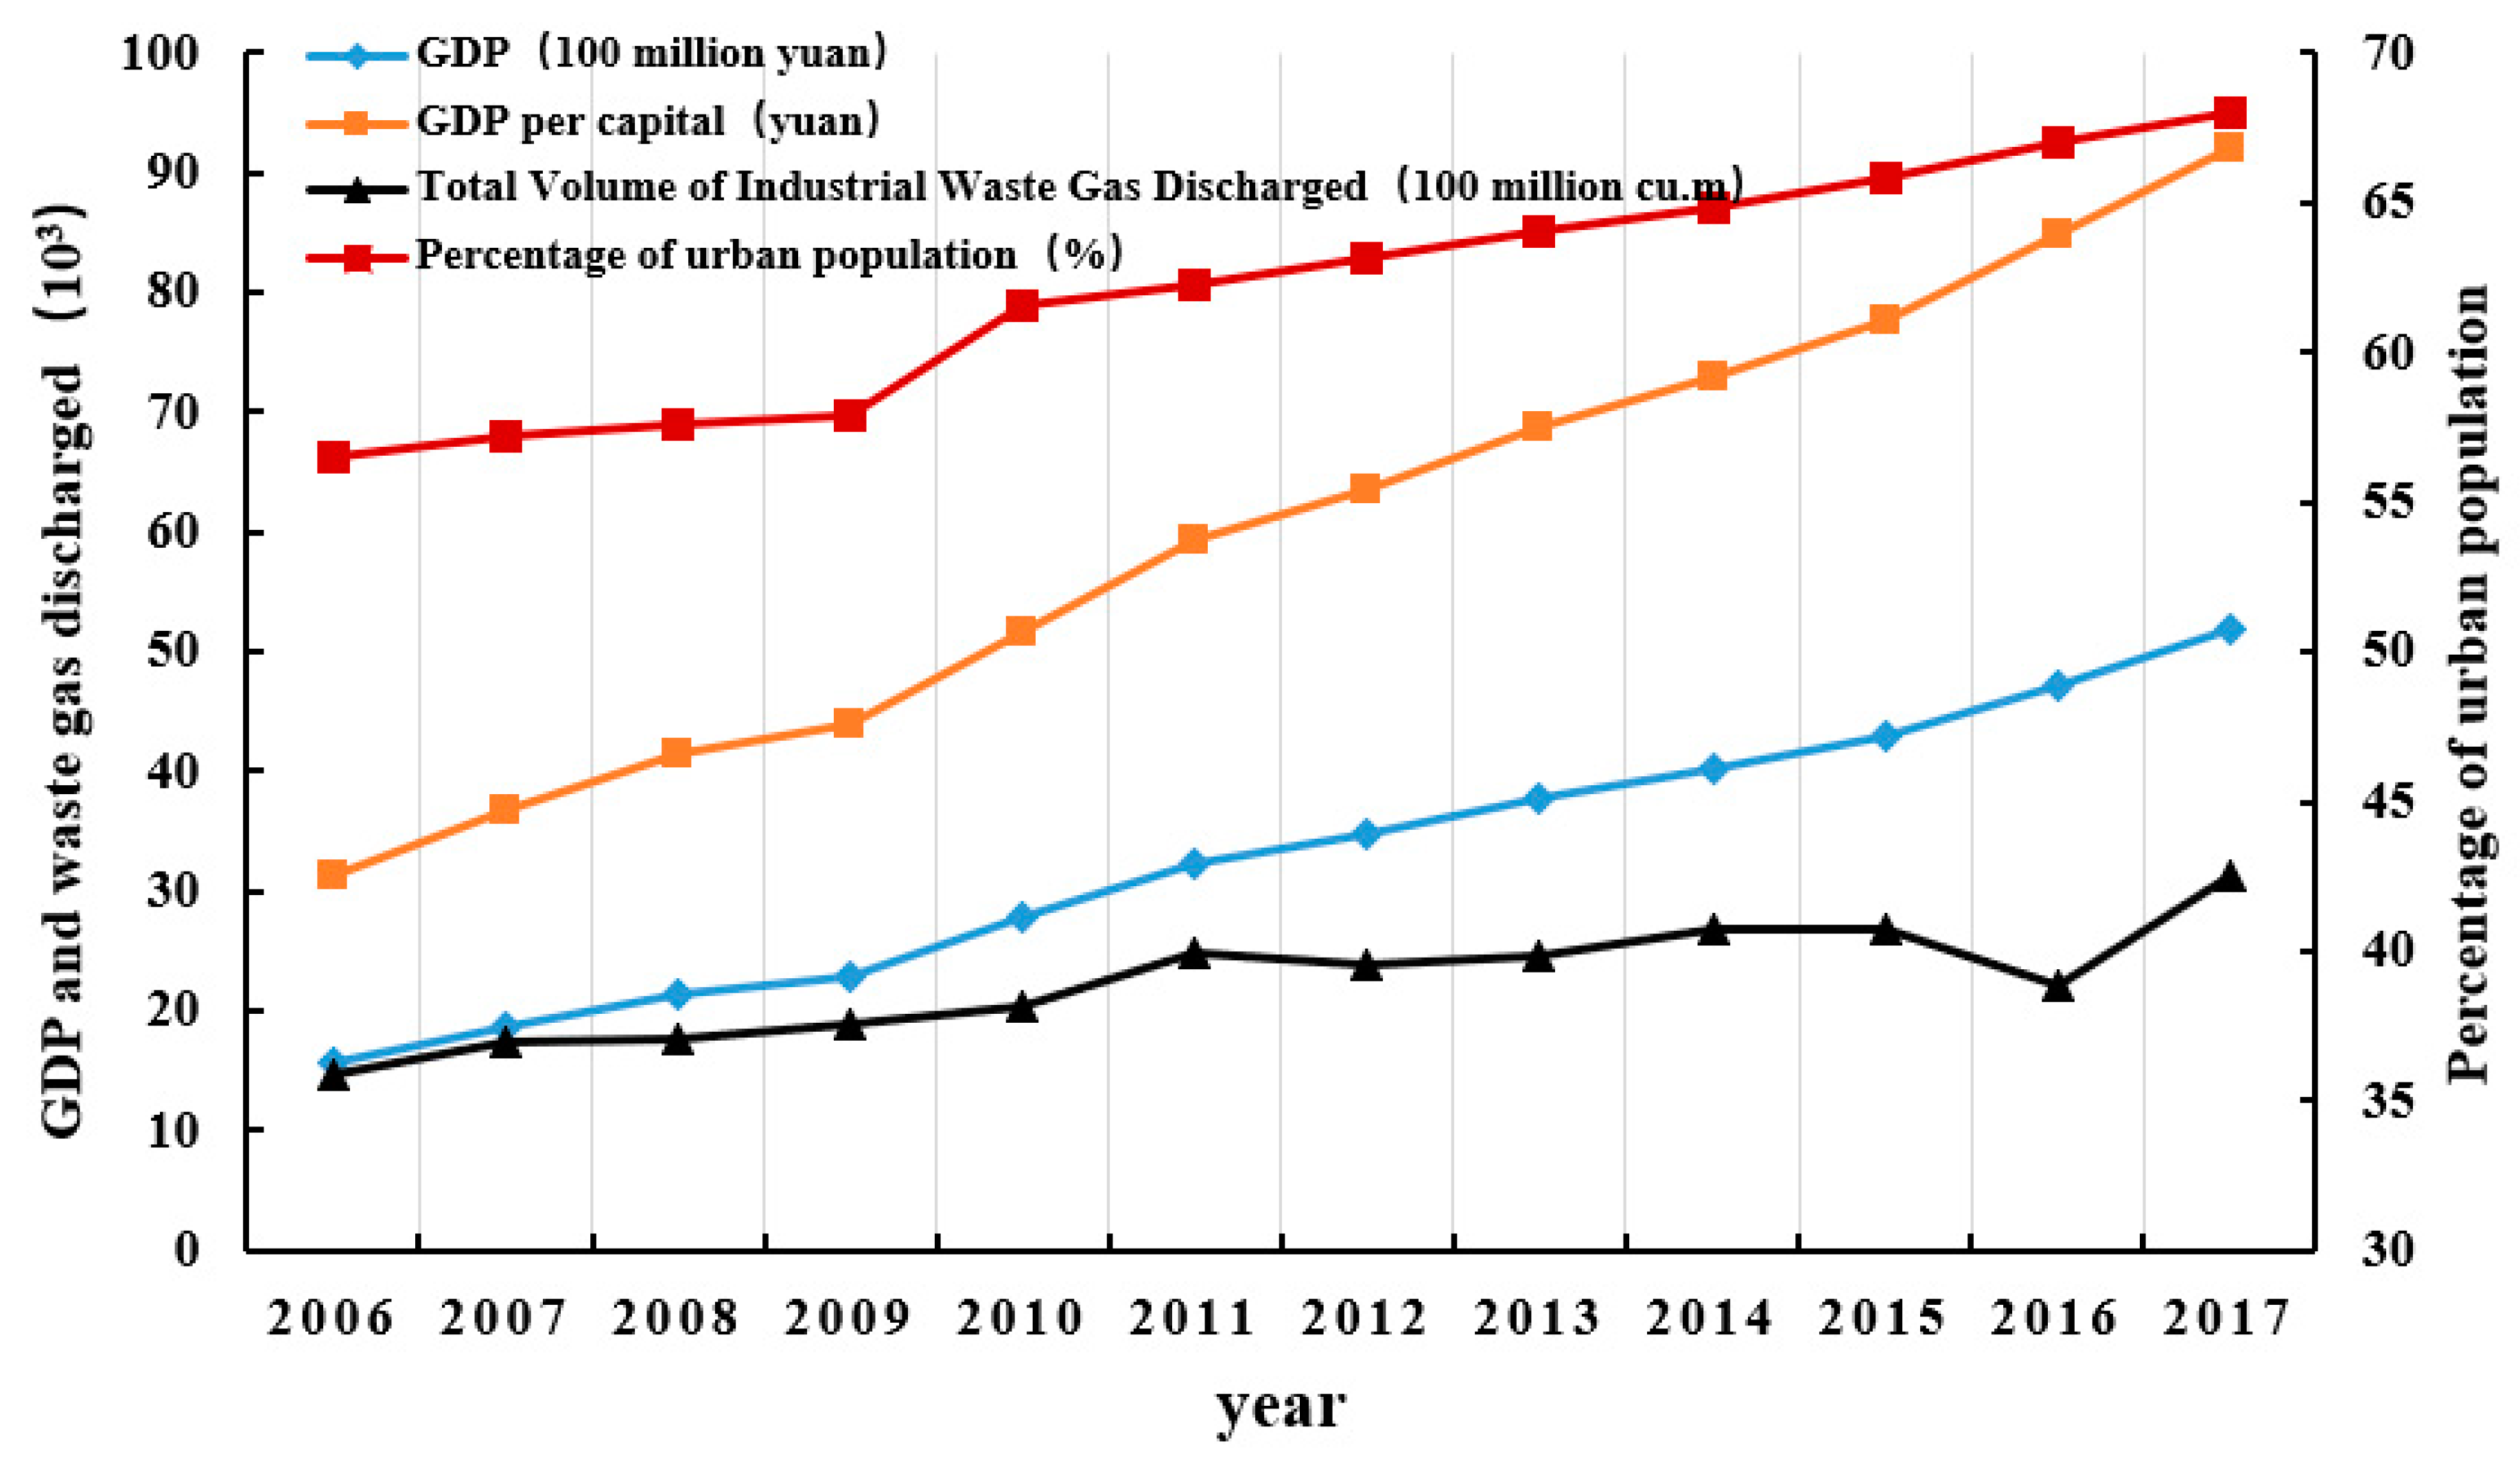
2.1. Study Area

Zhejiang, located on the southeast coast of China, is an economically developed province, which includes Hangzhou (capital city), Ningbo, Wenzhou, Jiaxing, Huzhou, Shaoxing, Jinhua, Quzhou, Zhoushan, Taizhou, and Lishui—11 cities in total. As an important part of the Yangtze River Delta economic circle and the Yangtze River economic belt, Zhejiang’s economic development and urbanization have important referential significance and play a guiding role. It covers 105,500 km2, 1.06% of China’s territory, and in 2017 it had a population of 56.57 million and a GDP of 5176.8 billion yuan, 6.13% of China’s total GDP. Zhejiang is rapidly urbanizing, with the percentage of urban population growing from 48.67% in 2000 to 56.5% in 2006 and 68% in 2017, with an average annual growth rate of 2.2% over the last 18 years. The rapid urbanization of Zhejiang Province inevitably intensifies the consumption of resources and environmental damage [32]; for instance, the emission of air pollutants is increasing [33,34]. Figure 1 shows the economic indicators, waste gas discharged, and urbanization rates for the whole of Zhejiang Province from 2006 to 2017.
In recent years, with the implementation of the National New-Type Urbanization Plan (2014–2020), Zhejiang Province is also accelerating the implementation of new-type urbanization construction. A number of cities (e.g., Ningbo, Jiaxing, Taizhou) have been included in a national pilot program for the comprehensive construction of new urbanization. Therefore, it is important to realize the sustainability of new-type urbanization and build a beautiful Zhejiang.

2.2. Data Preprocessing

Based on existing research and data availability, we chose to focus on 2006–2017 in this study; 2006 also marked the start of China’s 11th Five-Year Plan (2006–2010). The Five-Year Plan outlines the country’s plans for national economic and social development, setting goals and directions for the long-term development of the national economy. The data used in this paper were mainly obtained from the Zhejiang Statistical Yearbook (2007–2018) [35], the Zhejiang Natural Resources and Environment Statistical Yearbook (2007–2018) [36], the Zhejiang Statistical Yearbook of Science and Technology (2007–2018) [37], Zhejiang 11 cities’ Statistical Yearbook (2007–2018), and the National Economic and Social Development Bulletin; some additional data are available from Zhejiang and 11 cities’ Environmental Quality Bulletin, as well as related official government websites.
To eliminate the influence of different indicators’ magnitude, dimension, and sign, we normalized the data using Equations (1) and (2) [18,38,39]:
For a positive indicator:
X i j = ( x i j min { x j } ) / ( max { x j } min { x j } ) .
For a negative indicator:
X i j = ( max { x j } x i j ) / ( max { x j } min { x j } ) ,
where x i j represents the value of indicator variable, x, indexed by j, in year i; max { x j } and min { x j } denote the maximum and minimum values of indicator x j over all years, respectively. Thus, the value of all indicators x j were normalized in the range of [0,1].

2.3. Methods

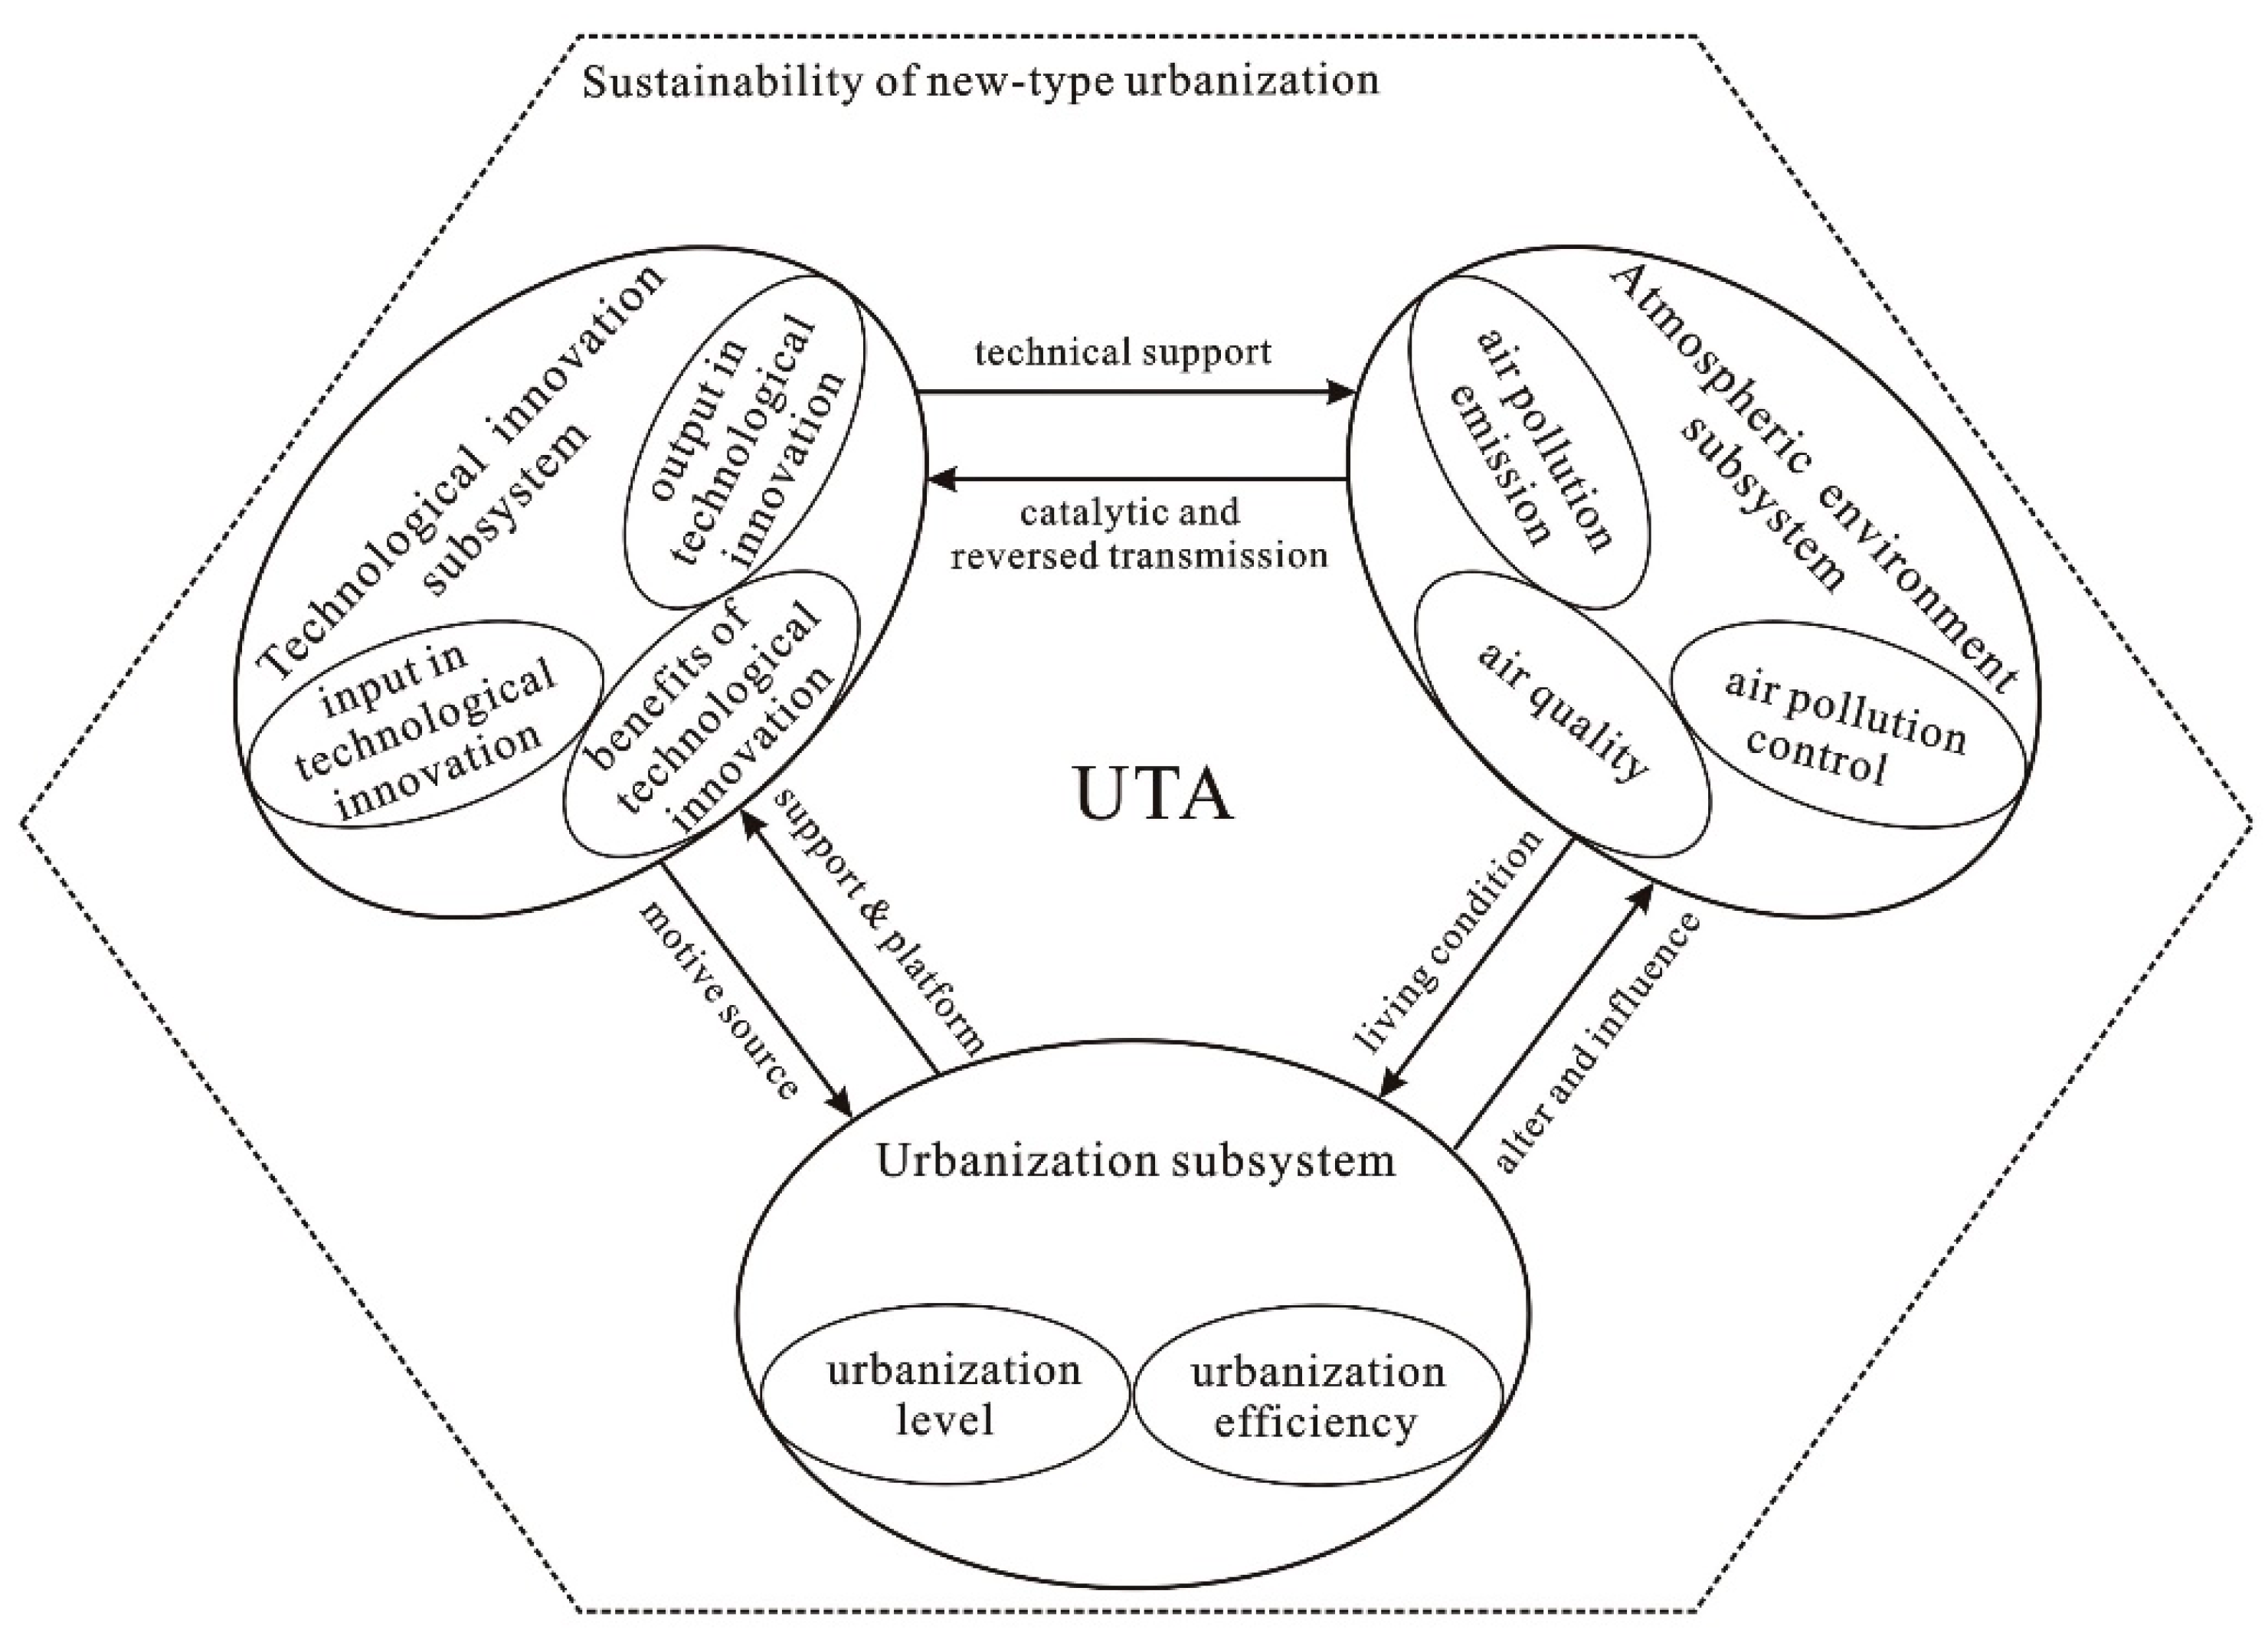
2.3.1. Theoretical Framework and Indicator System for the Evaluation of UTA

Compared with existing analysis frameworks between urbanization and air environment system [7], we developed a new comprehensive indicator system to evaluate the relationship among urbanization, technology innovation, and the atmospheric environment (UTA) and its component subsystems. UTA subsystems have natural interactions and couplings and they are mutually conditional, restrictive, and reinforcing, which guarantees the sustainable development of new-type urbanization (shown in Figure 2). The development of new urbanization relies on technological innovation and constant improvement of the environment, which includes the air environment.
First of all, the development of urbanization provides a broad platform for technological innovation, but it also brings about challenges in the form of changes in the regional atmospheric environment [7,22]. The process of urbanization is a process of agglomeration and the utilization of population, land, industry, and other factors, which provides a basis for scientific development and technological innovation; it also provides a platform for applications of scientific and technological innovations. On the other hand, the expansion of urbanization has intensified the consumption of resources, brought about an increase in pollutant emissions, and affected the quality of the city’s atmospheric environment to various degrees. Maintaining a beautiful living environment and continuously improving the quality of the air environment are goals pursued by new urbanization.
Secondly, technology innovation is the source of power for the development of new urbanization and the key to achieving air pollution control and air quality improvement. Technology innovation can not only promote industrialization to attract rural surplus labor, but also integrate and coordinate with urbanization. For example, through the application of technological innovation products, urbanization will develop in a sustainable, healthy, and intelligent direction, reducing energy consumption and accelerating regional industrial transformation and upgrading. At the same time, the upgrading of corporate pollution control technologies and equipment can improve resource utilization efficiency, effectively reduce the emissions of atmospheric pollutants, and thus improve the quality of the air environment.
Thirdly, the atmospheric environment is a powerful catalyst for restricting urbanization and accelerating technological innovation. The deteriorating urban atmospheric environment will restrict the migration of the urban population and affect the health of residents. In order to pursue excellent urban environmental quality, environmental regulation measures restricting the entry of polluting industries and controlling the rapid expansion of population are strategies that must be adopted. At the same time, under the high-pressure objectives of atmospheric environment control, enterprises have to accelerate the pace of technological innovation and realize the development and upgrading of new technologies and new products.
Figure 2 shows the structure of UTA and its internal interaction.
Comprehensive content and a reasonable level of evaluation system are the premises of the coupling coordination analysis among the three UTA subsystems. Based on the above analysis, considering data availability, index representativeness, system relevance, etc., and referring to the existing relevant research results [7,22,23], we create a comprehensive evaluation indicator system consisting of three subsystems, eight second-level indicators, and 28 primary level indicators (shown in Table 1). The urbanization (U) subsystem is derived from two weighted indexes for second-level indicators (urbanization level and urbanization efficiency), which are in turn derived from nine primary indicators. The technology innovation (T) subsystem is derived from three weighted indexes for second-level indicators (input in technological innovation, output in technological innovation, and benefits of technological innovation), which are in turn derived from eight primary indicators. The atmospheric environment (A) subsystem is also derived from three weighted indexes for second-level indicators (air pollution emission, air pollution control, and air quality), which are in turn derived from 11 primary indicators.

2.3.2. Determination of Indicator Weight

At present, there are two kinds of quantitative weighting methods: subjective weighting and objective weighting. The subjective weighting method has a strong subjectivity, which is based on the experts’ experience of how the index influences the system, such as the AHP method [40,41]. The greater the degree of subjectivity, the greater the indicator’s weight. By contrast, the objective weighting method does not rely on people’s subjective judgment and is based on a strong theoretical calculation process, such as the entropy method [18,42], principal component analysis [43,44], or the mean squared deviation decision (MSD) method [7,45,46]. However, the objective method sometimes loses more information, and sometimes it is greatly affected by the discrete value [47]. Thus, a synthetic evaluation method has been widely adopted in recent research [7,12,47]. In order to eliminate the deviation between subjective and objective weight, the structure entropy weight (SEW) method is introduced in this study, which considers the advantages of the subjective and objective weight methods [48,49,50]. It is a method of weight coefficient structure analysis combining qualitative analysis and quantitative analysis. The basic principle of the SEW method involves ranking the importance degree of each index and then using the entropy method to quantitatively analyze the uncertainty of the typical order. The data of the deviation are statistically processed, and then the weight of each index is obtained [48,51]. A detailed explanation of the above steps is as follows.
Step 1: Collect opinions of experts and form a typical ranking.
Select experts who are familiar with the UTA index system to form an expert group. In this study, we obtain the judgments of the index’s importance ratings from 20 experts in the fields of urban geography, technological management, environmental science, and sustainable development based on the Delphi procedure. Table 2 shows a sample questionnaire survey of the importance of index rankings, where experts use natural numbers to rank the indexes. The most important indexes are ranked as 1 and so on, in a similar formation.
Step 2: Transform typical ranking to entropy values.
The opinions of experts on typical rankings often have data noise, which may cause errors and uncertainties. The entropy theory method can effectively reduce the uncertainty of the typical rankings [48]. The specific steps are the statistical analysis and processing of the qualitative judgment conclusions of the indexes in Table 1, and the transformation equation is as follows:
μ ( a i j ) = ln ( m S ) ln ( m 1 ) .
In the above equation, a ij refers to the sequence number of ith expert’s evaluation on jth index. j is the number of indexes and m equals j + 2. bij equals μ(aij), and are the transformed value of a ij. Thus, the overall recognition of index j among k experts can be calculated with the following equation:
b j = [ μ ( a 1 j ) + μ ( a 2 j ) + μ ( a k j ) ] / k .
Step 3: Reduce the typical ranking uncertainty.
The uncertainty generated by experts’ knowledge is also called blindness, Qj. It is calculated as follows:
Q j = { [ max ( b 1 j , b 2 j b k j ) b j ] + [ min ( b 1 j , b 2 j b k j ) b j ] } / 2 .
Obviously, Qj>0.
Then, we define all invited experts to have an overall awareness of c j for each index j.
c j = b j × ( 1 Q j ) .
Step 4: Normalize and calculate the final weight.
The overall evaluation vector of all indexes by all k experts is: C = ( c 1 , c 2 , … c j ).
To obtain the weight of index j, normalize c j :
w j = c j i = 1 m c j ,
where, (j = 1,2,⋯,n)>0, and i = 1 n w j = 1 . W = {w1,w2⋯, wn} is the weight vector of the index set. In the actual calculation, we perform the operation in three steps. First, we obtain the second-level indicators’ weight in Table 1, named W1. Then, we calculate the primary indicator’ weight corresponding to the second-level indicator, named W2. Thus, each indicator’s weight W3 is the result of W1*W2 in the corresponding index hierarchy. The final detailed weight values are shown in Table 1.
Furthermore, we calculated the composite index Si for each subsystem UTA in year i using Equation (8):
Composite index for each subsystems UTA in year i:
S i = j = 1 t W 3 × X i j ,
where Si represents the final score of UTA subsystems, which is applied to Equations (9)–(11). Furthermore, t represents the number of indicators in comprehensive UTA subsystems, among them t = 9 in the subsystem of urbanization (U), t = 8 in the subsystem of technology innovation (T), and t = 11 in the subsystem of atmospheric environment (A).

2.3.3. UTA Coordinated Development Index

Coordination evaluation is an important means to measure the relationship and coherence among all subsystems [52]. Many existing studies have adopted a coupling coordination degree model (CCDM) to measure the subsystems’ relationship [7,42,53,54,55]; however, this method has some subjective differences when setting the weight coefficient of each subsystem. In order to evaluate the coordination level of subsystems more objectively and comprehensively, we developed the UTA coordinated development index (UTACDI), which is based on the coordination degree model for China National Sustainable Communities [56]. UTACDI can be used to assess sustainable new-type urbanization in most regions as the interactions between urbanization, technology innovation, and the environment occur everywhere that urbanization occurs. Compared with the CCDM method, the UTACDI calculation process is more convenient and efficient. Meanwhile, the above index will comprehensively reflect the comprehensive level of sustainable new-type urbanization. To obtain UTACDI, we first estimate the coordination degree between pairs of subsystems as follows:
Coordination degree between U and T in year i:
C U T i = 1 | S U i S T i | max ( S U i , S T i ) .
Coordination degree between U and A in year i:
C U A i = 1 | S U i S A i | max ( S U i , S A i ) .
Coordination degree between T and A in year i:
C T A i = 1 | S T i S A i | max ( S T i , S A i ) ,
where S U i , S T i , and S A i represent the composite indexes of the individual subsystems U, T, and A, respectively, in year i. Then, we calculate the coordination degree of the combined system UTA by:
Coordination degree of UTA in year i:
C i = average ( C U T i , C U A i , C T A i ) .
This overcomes the subjective difference of the artificial setting of the subsystem weight coefficient. Furthermore, to fully reveal the coordination degrees between different systems, a coordinated development index of UTA is established:
C D I i = a v e r a g e ( S U i , S T i , S A i ) × C i .
The final value of CDIi is distributed in the range of [0,1]. Meanwhile, the higher the value of CDIi, the more coherence there will be between the subsystems of UTA. Furthermore, the coordination level of UTA’s CDIi, can be divided into five types, as shown in Table 3.

2.3.4. Gray Predicted Model (1,1)

A grey prediction model is an effective tool to deal with small sample prediction problems, and requires fewer basic data with high accuracy [57,58]. The common gray prediction model is GM (1,1), which has no specific requirements for sample size, and can be used to research future time distributions for specific time intervals. In addition, the model can filter out irregular changes in sample data, reflect trend changes, and forecast the main trends of sequence changes [57,59].
In order to predict the coordinated development index (CDI) of the UTA system in 11 cities of Zhejiang Province, the Gray Model (1,1) is used for forecasting. We record the i city’s (i = 1,2⋯, 11) time series of CDI in 2006–2015 as: x i ( 0 ) = { x i ( 0 ) ( 1 ) , x i ( 0 ) ( 2 ) , , x i ( 0 ) ( 10 ) } , where the CDI in 2006 is expressed as x i ( 0 ) ( 1 ) , and the CDI in 2015 is expressed as x i ( 0 ) ( 10 ) by analogy. The whitening equation of the model is as follows:
d x i ( 1 ) d t + a i x i ( 1 ) = u i ,
where x i ( 1 ) = { x i ( 1 ) ( 1 ) , x i ( 1 ) ( 2 ) , , x i ( 1 ) ( 10 ) } can be the cumulative coupling degree time series of the time series value of the CDI of the city i x i ( 0 ) . That is to say, d x i ( 1 ) d t refers to the change rate of time series of cumulative CDI of the city i.
Thus, the d x i ( 1 ) ( k ) d t will be the CDI of the year k. u i and a i will be the endogenous control gray level and development gray level. These two parameters can be solved by the least square method. Finally, the predicted value of the cumulative CDI sequence of the i city can be solved:
x ^ i ( 1 ) ( k + 1 ) = [ x i ( 0 ) ( 1 ) μ a ] e a k + μ a .
By progressive reduction, the gray prediction model of the number series of i city’s CDI can be obtained:
x ^ i 1 ( 0 ) ( k + 1 ) = x ^ i 1 ( 1 ) ( k + 1 ) x ^ i 1 ( 1 ) ( k ) .
The final CDI forecast results are shown in Section 3.3.

3. Results and Discussion

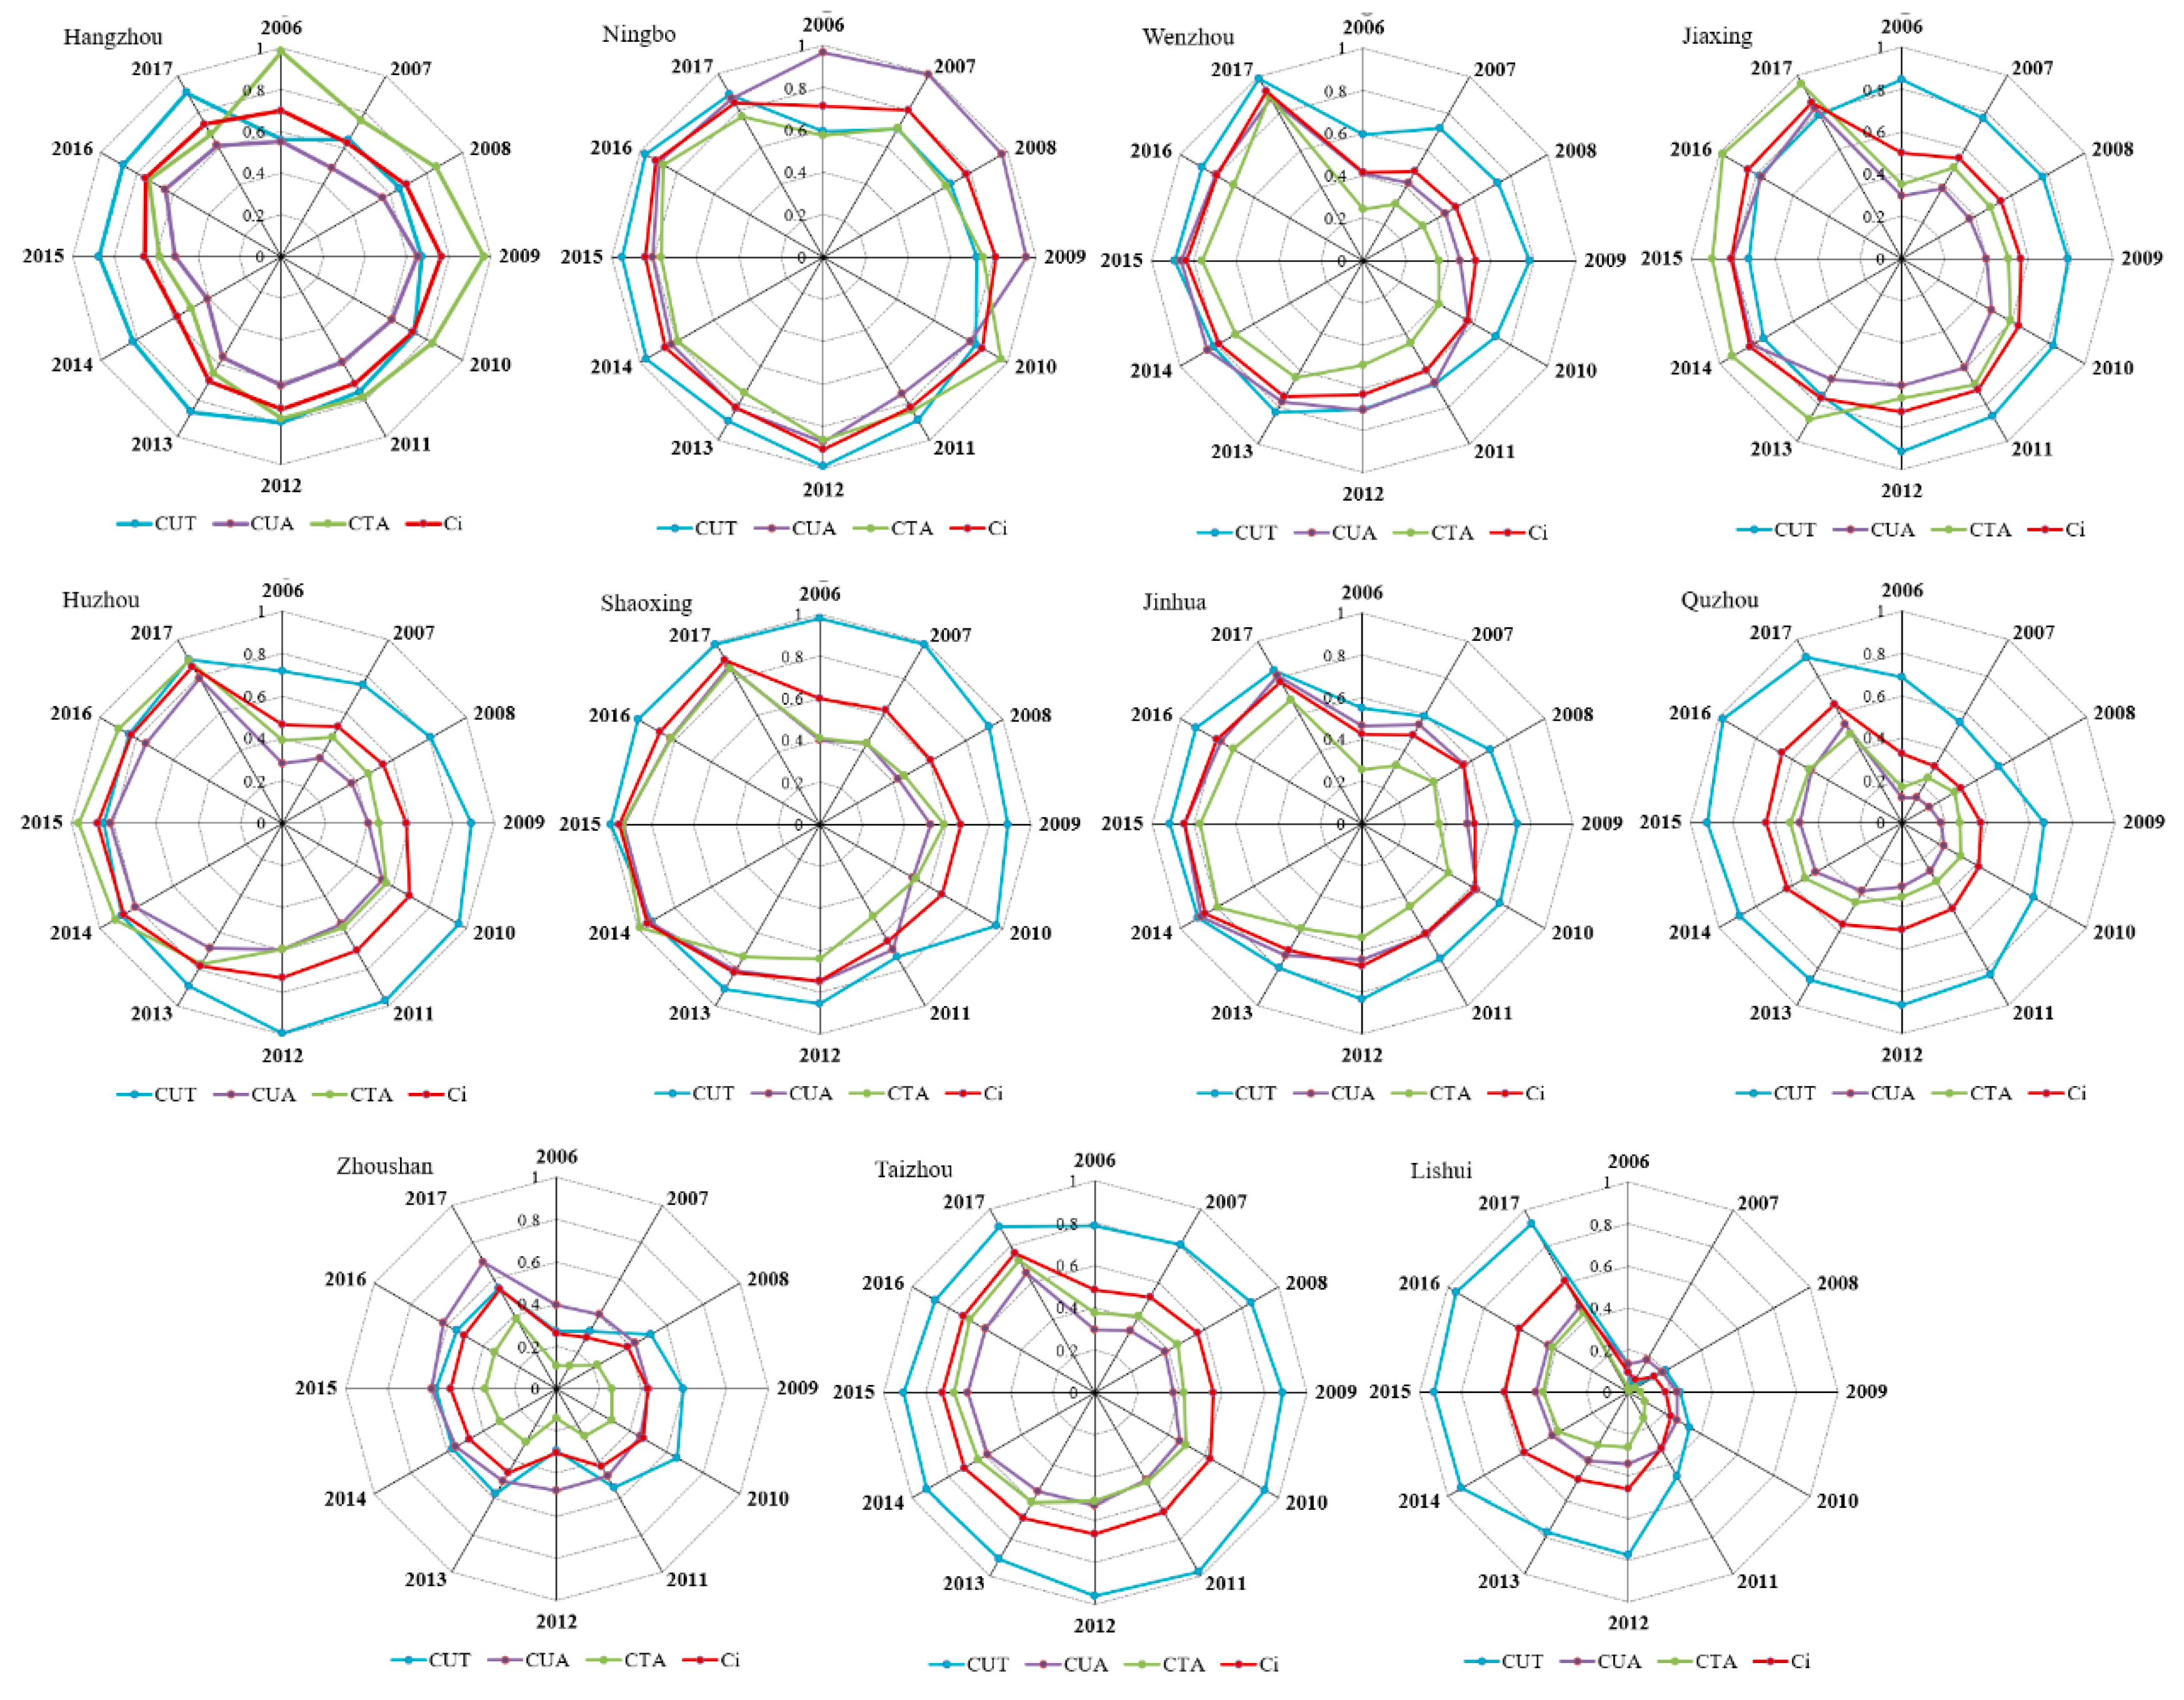
3.1. Variations of Comprehensive Level of UTA Subsystems

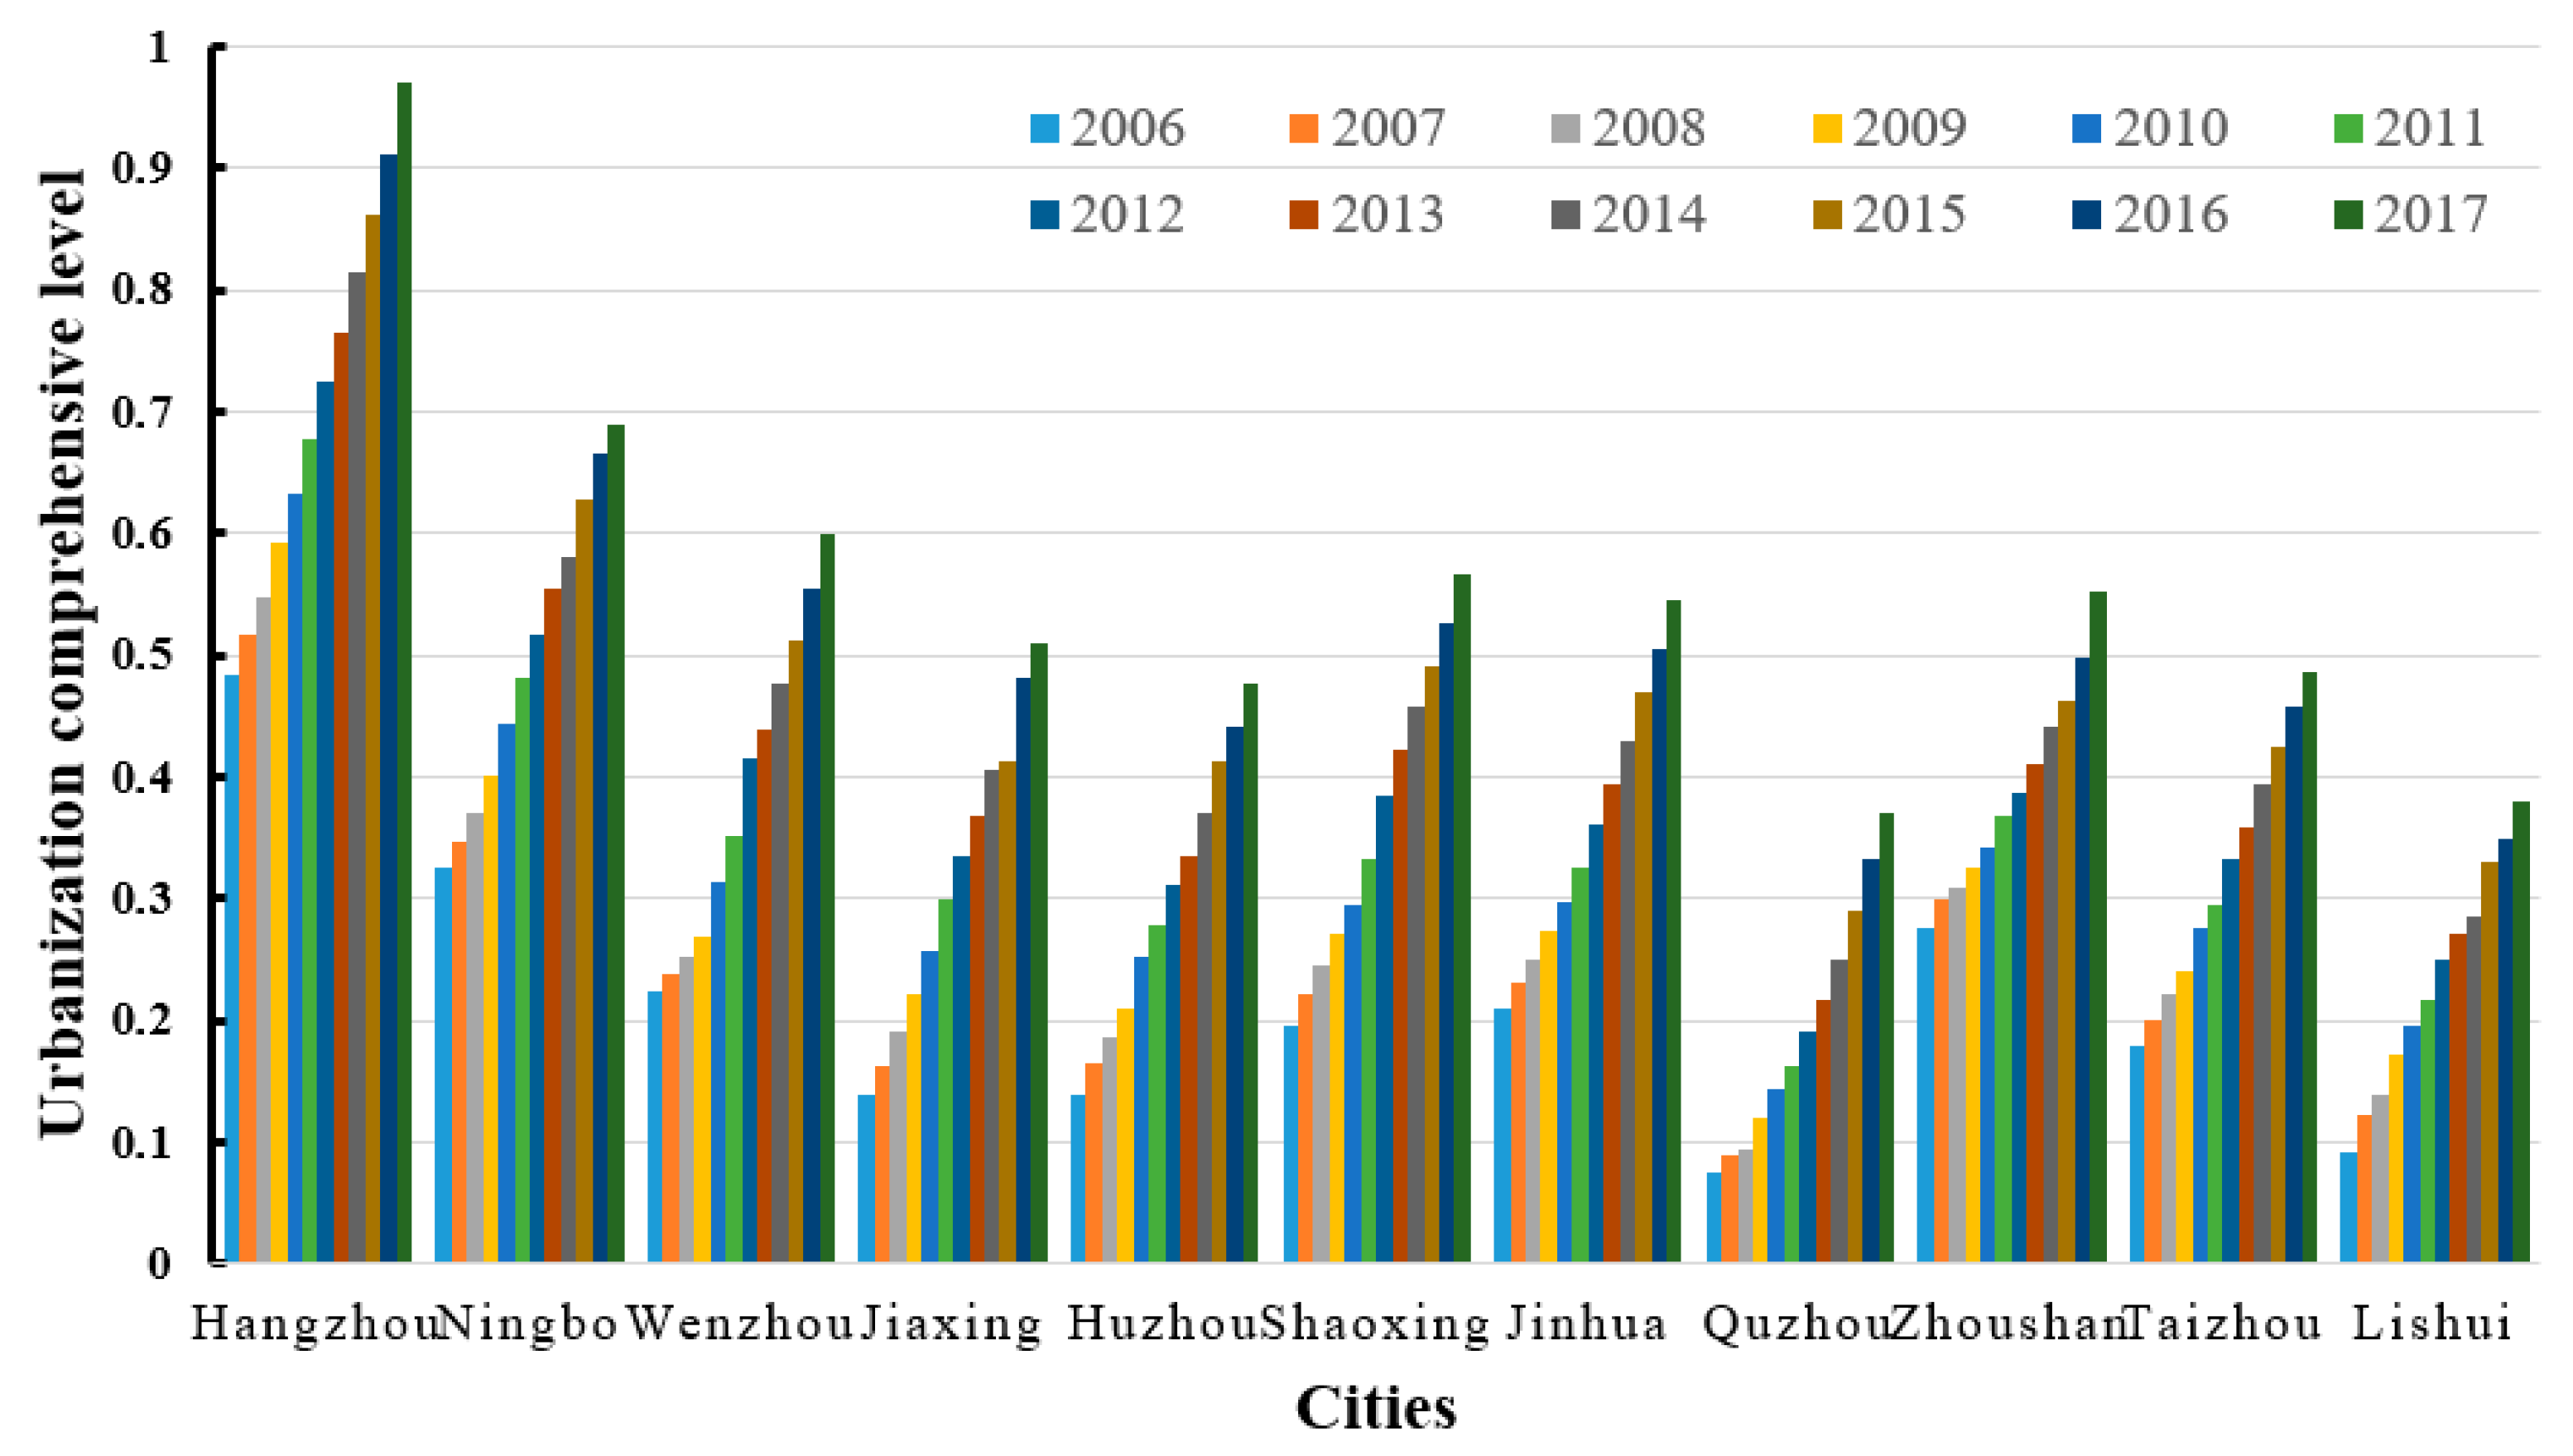
3.1.1. Urbanization Subsystem

As shown in Table 1, in the urbanization system, the population urbanization rate (0.180) has a greater impact on the urbanization level subsystem. Meanwhile, the per capita disposable income (0.111) and per capita GDP (0.109) of urban residents have a greater impact on the urbanization efficiency subsystem. The three indicators have a 40% explanatory effect on the change of the whole urbanization subsystem. This means that, since the 11th Five-Year Plan, the urbanization of Zhejiang has mainly relied on population agglomeration and economic development, while the positive impact of urbanization on higher education, health care, public facilities construction, and other aspects has not been fully assessed. In the future, improving the urbanization efficiency in these areas should be focused on.
Furthermore, according to the above system score calculation formula, we obtained the urbanization comprehensive score (SUi) of 11 cities in Zhejiang Province from 2006 to 2017, as shown in Figure 3.
We see that: (1) From 2006 to 2017, the comprehensive score of urbanization of 11 cities showed a trend of steady growth. The comprehensive score of urbanization of Hangzhou, the provincial capital, was the highest, increasing from 0.483 in 2006 to 0.971 in 2017, with an average annual growth rate of 6.56%. Quzhou, the city with the lowest urbanization score, had the highest growth rate, from 0.076 in 2006 to 0.371 in 2017, with an average annual growth rate of about 15.5%. (2) There are significant spatial differences in the urbanization scores of cities with different social and natural backgrounds. As to the ranking of city scores, the overall pattern, from high to low, is: Hangzhou > Ningbo > Wenzhou > Zhoushan > Shaoxing > Jinhua > Taizhou > Jiaxing > Huzhou > Lishui > Quzhou. The highest score of Hangzhou in 2017 is 2.62 times that of Quzhou. It is noteworthy that Zhoushan, an island city, has a high comprehensive score in urbanization, ranking fourth in the province, mainly due to its high urbanization rate, per capita GDP, and developed tertiary industry. Since it was incorporated into the National New Area Construction in 2011, Zhoushan has taken advantage of its location near the ocean and in a free trade zone, and has promoted the high-quality development of urbanization [60]. Restricted by natural conditions and industrial factors, the urbanization level of Quzhou and Lishui in southwestern Zhejiang has always been the lowest in the whole province.

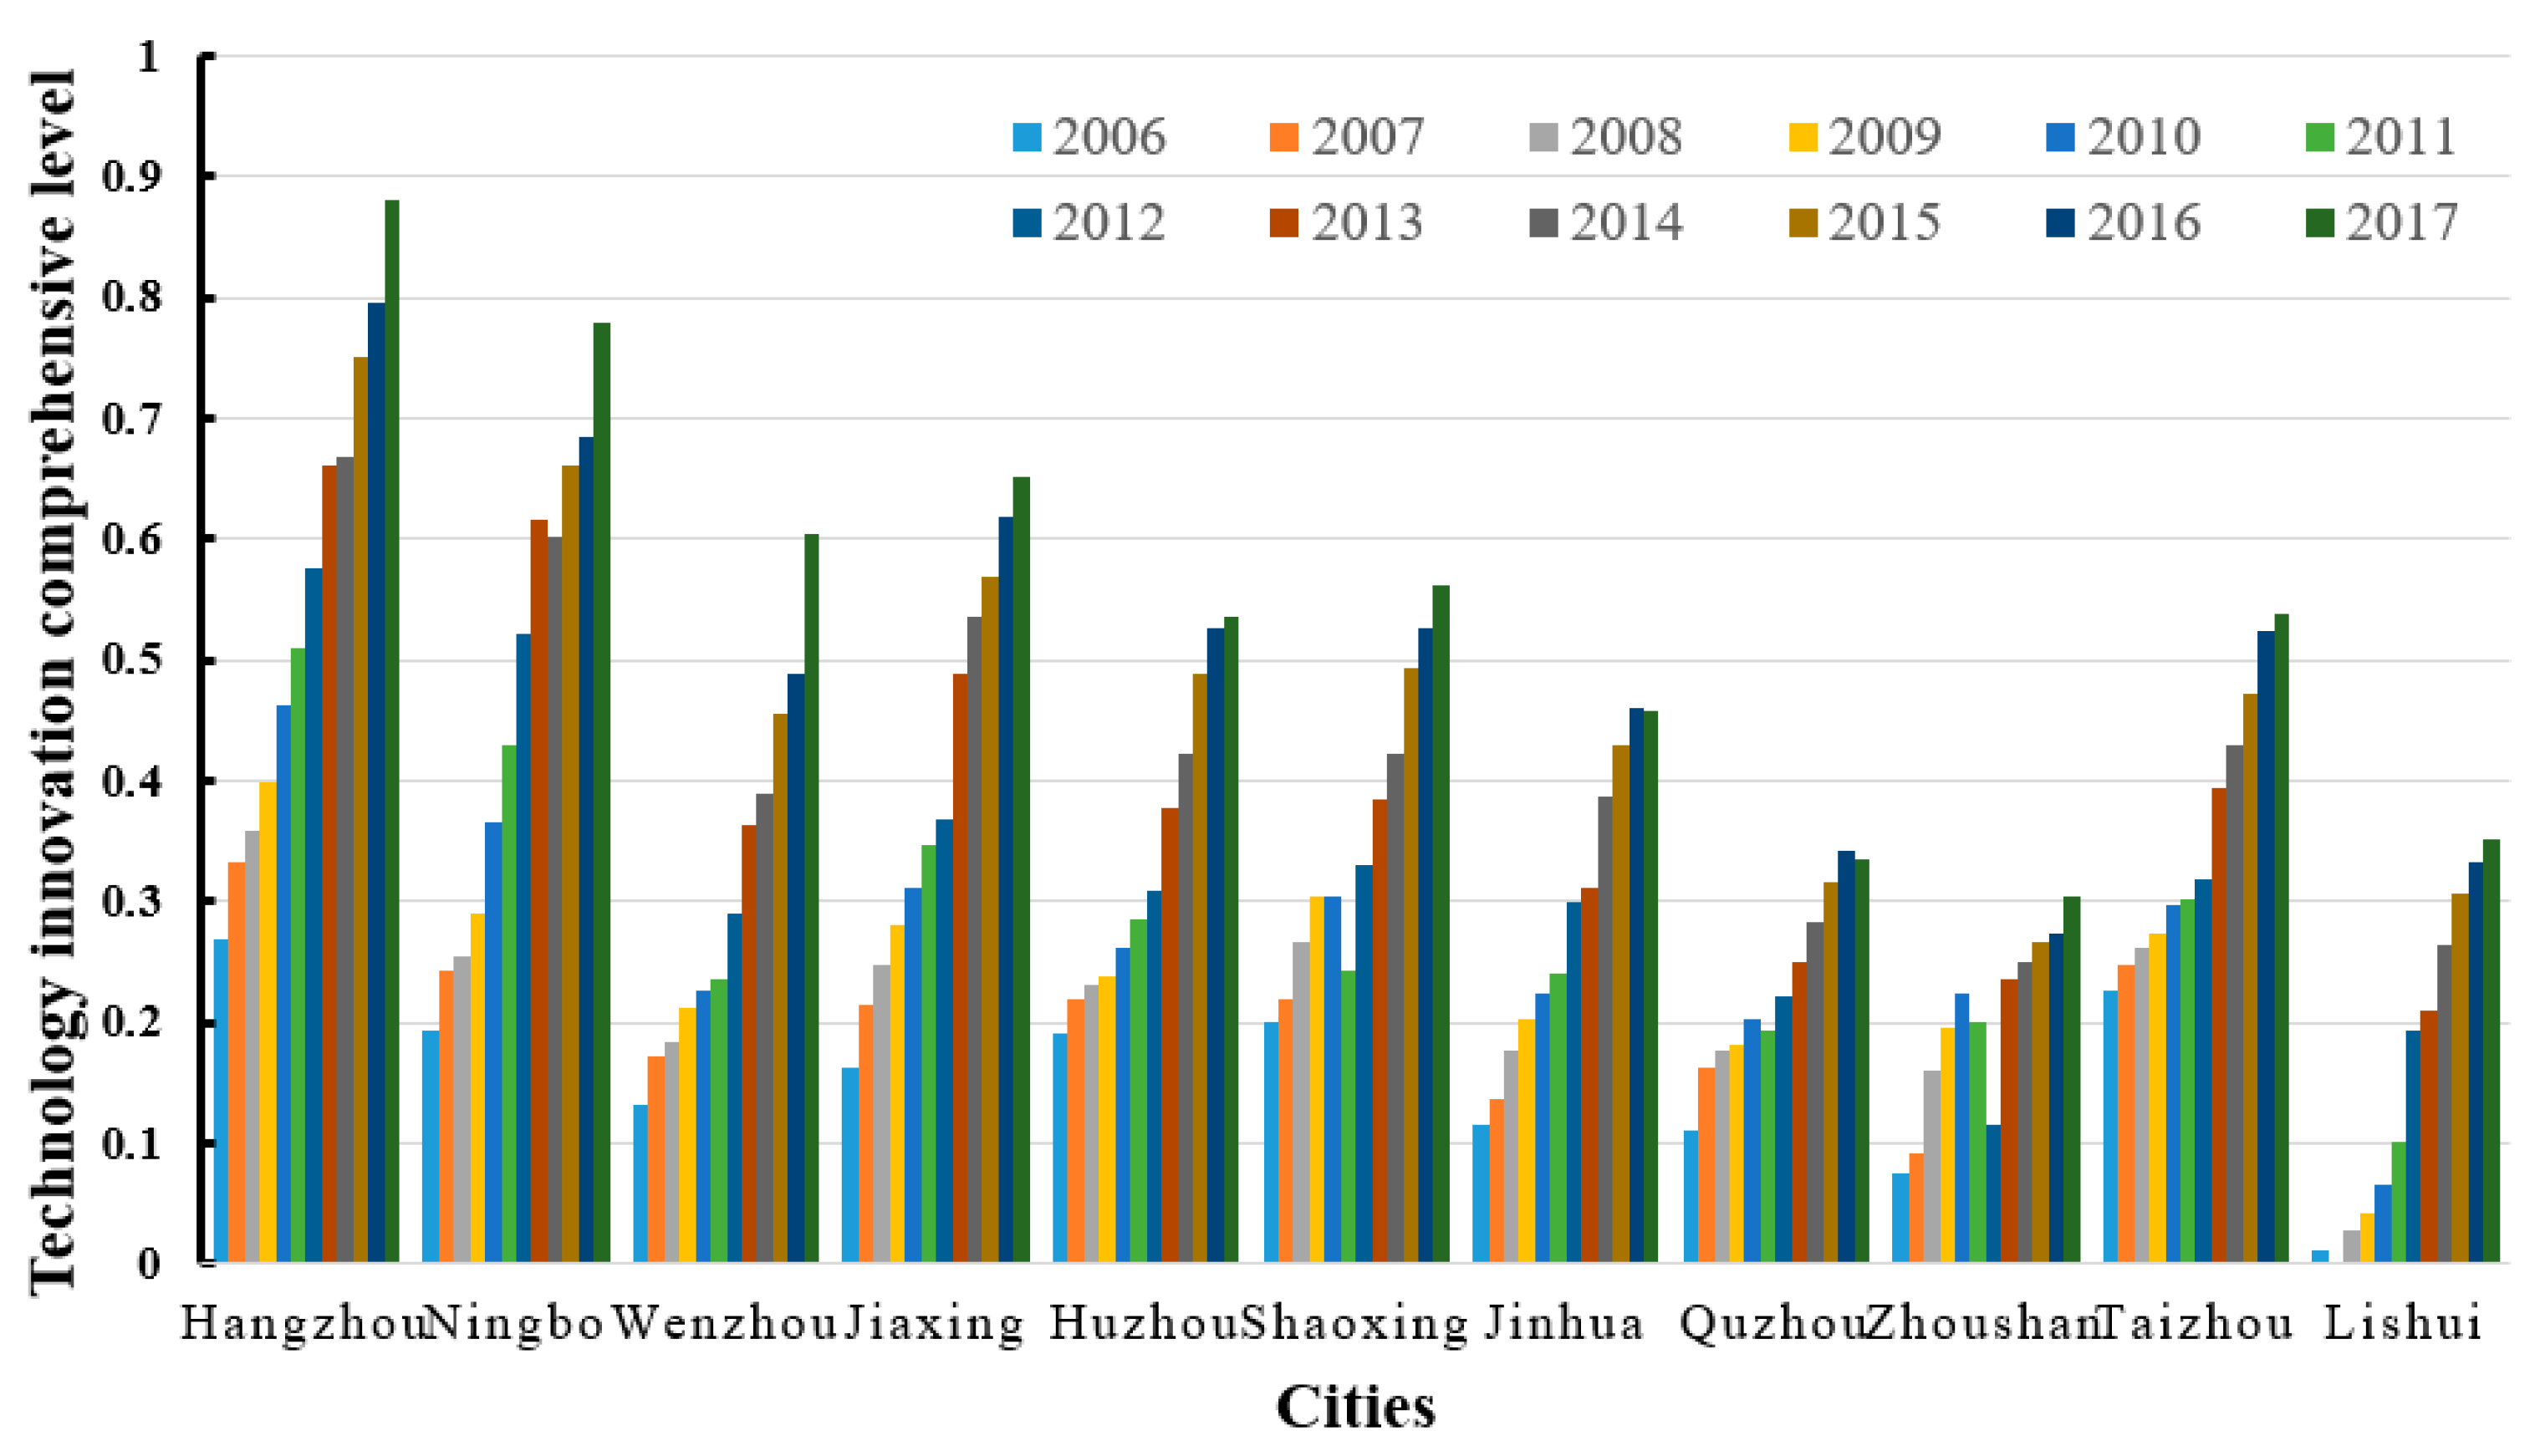
3.1.2. Technology Innovation Subsystem

Similarly, as shown in Table 1, in the technology innovation system, the proportion of R&D expenditure in GDP (0.109) has a greater impact on the subsystem of input in technological innovation; the output value of high-tech industry (0.126) has a greater impact on the subsystem of output in technological innovation, and the production rate of new products (0.210) has a greater impact on the benefit subsystem of technological innovation. The three indicators have a 44.5% explanatory effect on the change of the whole technological innovation subsystem. This means that since the 11th Five-Year Plan, the development of technological innovation in Zhejiang Province has mainly relied on the input of R&D funds, the development of high-tech industries, and the high output rate of new products. In recent years, in order to speed up the construction of a strong province through innovation, Zhejiang has vigorously promoted comprehensive innovation based on scientific and technological innovation and the innovation ecosphere, providing strategic support for the construction of a modern economic system [61].
Furthermore, according to the above system score calculation formula, we obtained the comprehensive score of technological innovation (STi) of 11 cities in Zhejiang Province from 2006 to 2017, as shown in Figure 4.
It can be observed that: (1) From 2006 to 2017, the comprehensive score of technological innovation in 11 cities showed a trend of steady growth, consistent with that of urbanization, but the growth rate was higher than the development of urbanization. Hangzhou had the highest comprehensive score of technological innovation, which increased from 0.269 in 2006 to 0.881 in 2017, with an average annual growth of about 11.36%. Lishui’s comprehensive score for technological innovation increased the fastest, from 0.012 in 2006 to 0.351 in 2017, with an average annual growth of about 35.94%. (2) There are also significant spatial differences in technological innovation scores among the cities. As to the ranking of city scores, the overall pattern, from high to low, is: Hangzhou > Ningbo > Jiaxing > Wenzhou > Shaoxing > Taizhou > Huzhou > Jinhua > Lishui > Quzhou > Zhoushan. The highest score, that of Hangzhou in 2017, is 2.9 times that of the lowest score (for Zhoushan).
In recent years, Hangzhou has made the establishment of national independent innovation demonstration zones and small and micro enterprises its main focus, pushing forward the reform of system and mechanism, improving the environment of scientific and technological innovation, and achieving remarkable results in various scientific and technological areas. For example, R&D expenditure accounts for more than 3% of GDP; the added value of high-tech industries is 137.29 billion yuan, ranking first in the province; and the number of successful patents is 36,579, ranking first in the capital cities of the country and second in the subprovincial cities. The number of state-level incubators reaches 30, ranking first in provincial capitals and subprovincial cities.

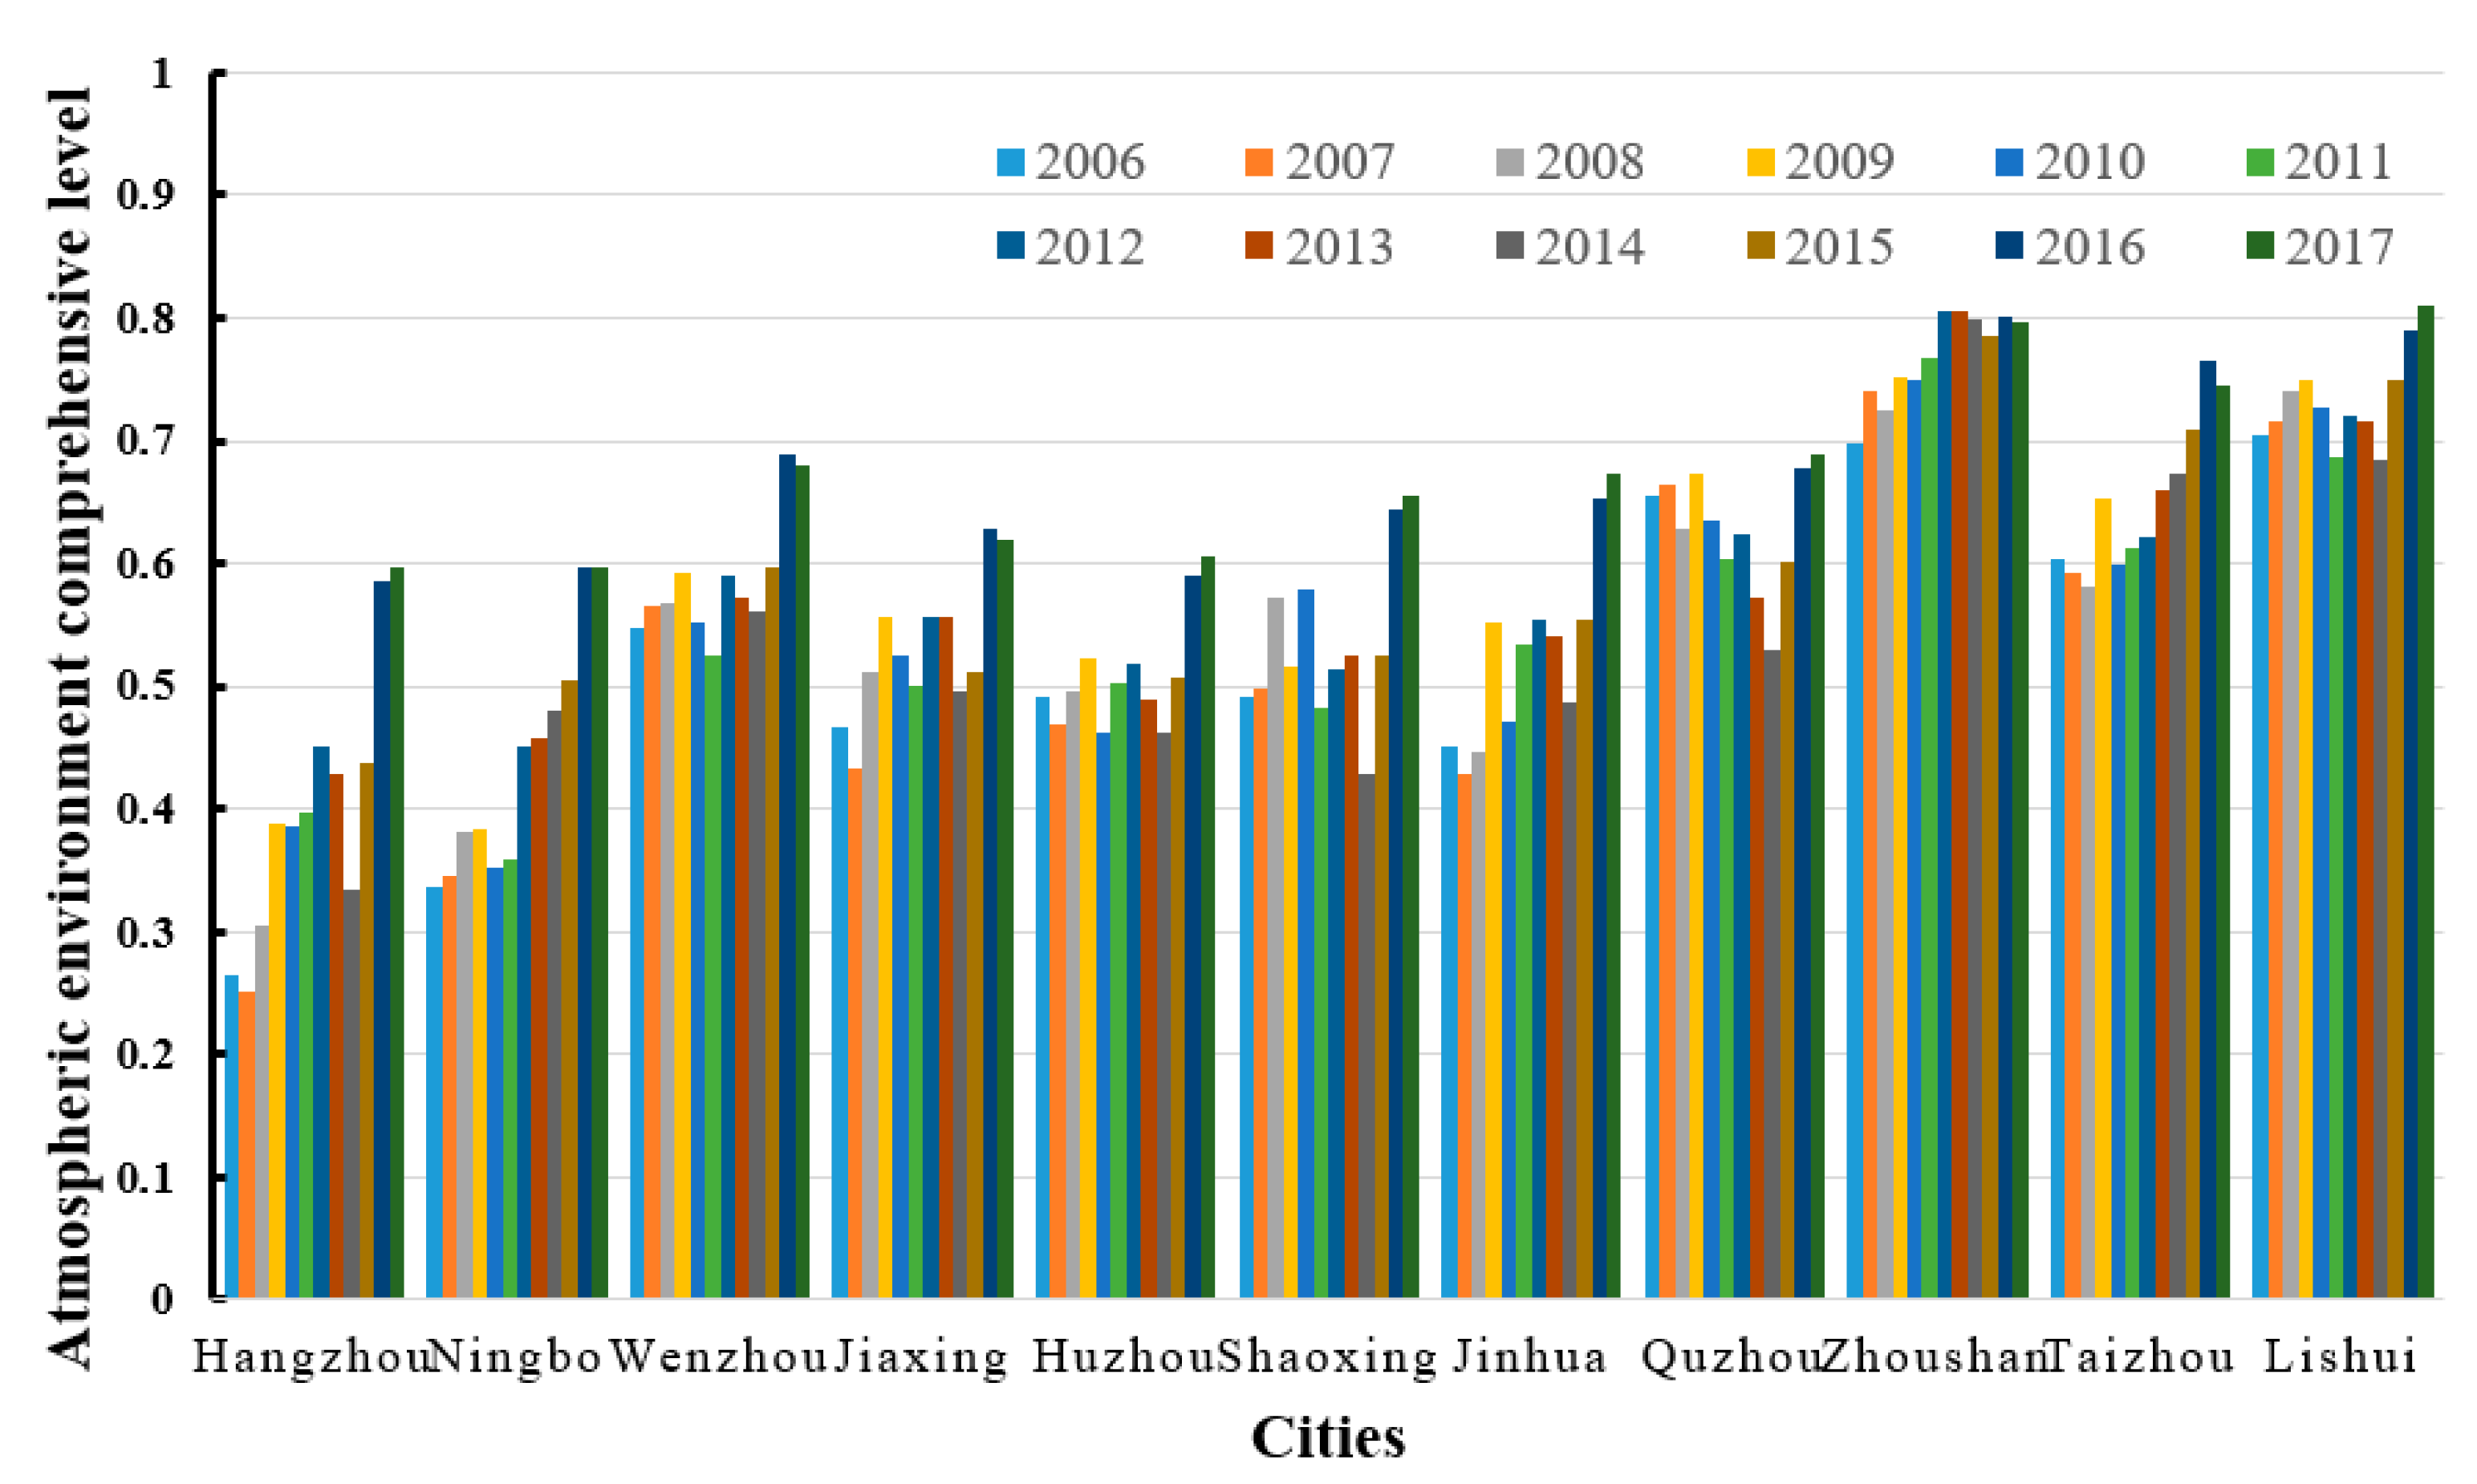
3.1.3. Atmospheric Environment Subsystem

As shown in Table 1, in the atmospheric environment system, the volume of smoke and dust emission (0.089) has the greatest impact on the air pollution emission subsystem. Energy consumption per unit of GDP (0.101) has a greater impact on the air pollution control subsystem, while a good air quality rate (0.124) has a greater impact on the air quality subsystem. The three indicators have a 31.4% explanatory effect on the change of the whole atmospheric environment system. Because the volume of smoke and dust emission is closely related to the concentration of atmospheric particulate matter, and the reduction of energy consumption per unit GDP is the fundamental guarantee to realize the emission of atmospheric pollutants from the source, the air environment system in Zhejiang Province since the 11th Five-Year Plan has been realized mainly on the basis of energy saving, emissions reduction, and air quality improvement.
Furthermore, according to the above system score calculation formula, we obtained the trends in the atmospheric environment system scores (SAi) of 11 cities in Zhejiang Province from 2006 to 2017, as shown in Figure 5.
It can be seen that: (1) From 2006 to 2017, the comprehensive atmospheric environment score of 11 cities showed a trend of fluctuation and good transition, which is different from the change characteristics of the previous two systems. This phenomenon is mainly attributed to the fluctuation of the air environment quality and the instability of pollution control. Especially in some cities, the air environment has been changing for the better. For example, the air environment improved significantly in Hangzhou, Ningbo, and Wenzhou since 2016. The effect of pollutant emissions reduction is remarkable, and the air quality has improved significantly. However, in some years, there are lower scores indicating the deterioration of the air environment. This shows that the effective improvement of the air environment will be a long-term process of prevention and control. (2) The scores for air environment in different cities also exhibit a relatively large variation in ranking. As to the ranking of city scores, the overall pattern of 12 years’ average values, from high to low, is: Zhoushan > Lishui > Taizhou > Quzhou > Wenzhou > Shaoxing > Jiaxing > Jinhua > Huzhou > Ningbo > Hangzhou. Because of the good natural conditions (good vegetation in an island or mountainous city) and less-polluted industrial structures, Zhoushan and Lishui have the best air environment scores in the province, at 0.769 and 0.732, respectively. The two cities are in first place in different years. The cities with relatively poor air environment scores are mainly those with a developed industrial economy and urbanization, such as Hangzhou and Ningbo. The deteriorating air environment also poses severe challenges to the sustainable development and ecological civilization construction of these cities.
To sum up, urbanization efficiency, the benefits of technological innovation, and air quality are the largest influences in the indicator system, which indicates that they are key factors in the behavior of UTA. The subsystem scores of 11 cities show regional differences to some extent.

3.2. Variations of Coordinated Development Index of UTA Subsystems

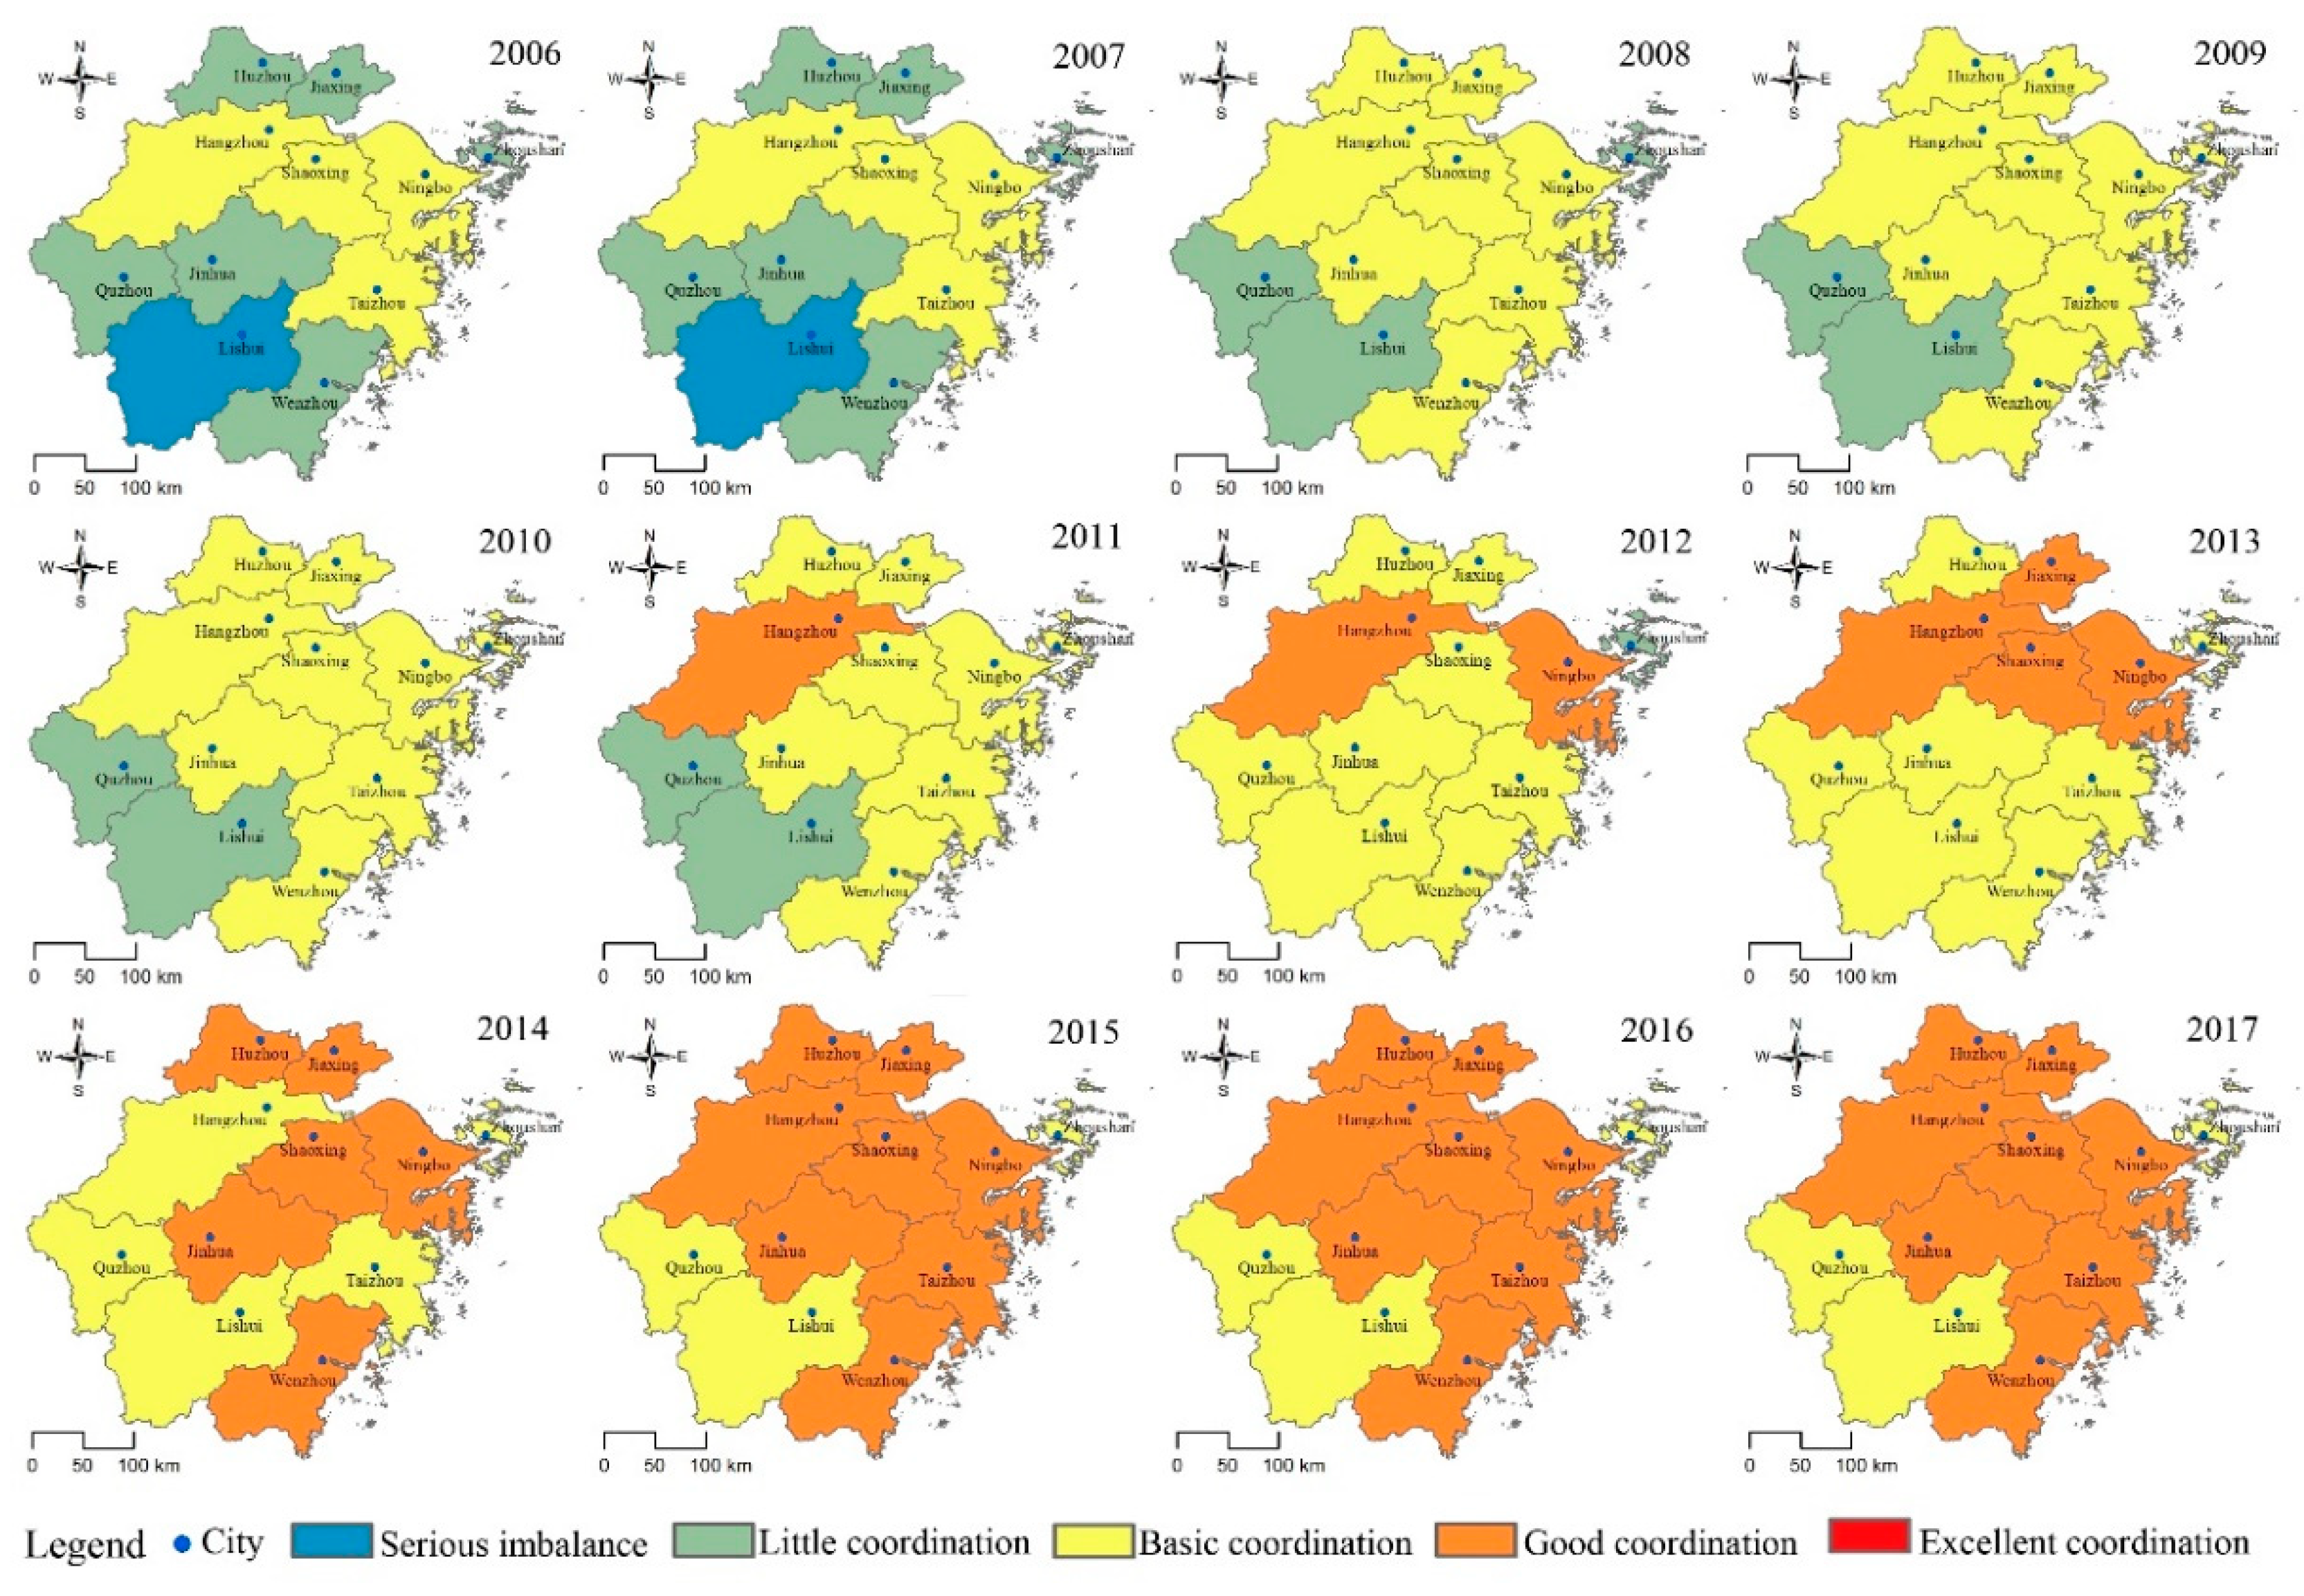
3.2.1. Coordination Degree of UTA in 11 Cities

The coordination degree of UTA reflects the behavior and coordination relationship between the two UT subsystems, UA and TA. Based on Equations (9)‒(12), we get the values of CUT, CUA, CTA, and Ci. Figure 6 shows the radar map of annual coordination degree of 11 cities in Zhejiang in 2006–2017; a larger radar circle indicates a higher level of coordination between the two systems.
As shown in Figure 6, different cities have significant differences in coordination levels. Based on the results of the coordination level of CUT, Hangzhou and Ningbo have a higher coordination level, as well as higher values of SUi and STi, which reflects the coordination level of urbanization and technological innovation. Hangzhou is the capital city of Zhejiang and has received enough investment to improve the urbanization. With Zhejiang University and Alibaba as typical examples, the technology leading platforms have greatly promoted scientific and technological innovation and other achievements in Hangzhou in terms of talent, information technology, and other factors. As a deputy provincial city, Ningbo is also a new-type urbanization pilot city. Relying on strong industrial and economic advantages, Ningbo has achieved remarkable results in terms of urbanization and scientific and technological innovation. On the contrary, Lishui and Zhoushan have a lower coordination level of CUT, as well as lower values of SUi and STi, which reflect the low coordination level of urbanization and technological innovation. There is huge room for improvement in the future. The rest of the cities, despite their high coordination level of CUT, scored poorly on urbanization and technological innovation, so there is still great potential for improvement.
As for urbanization and the atmospheric environment system, Ningbo, Wenzhou, Shaoxing, and Jinhua have a higher coordination level of CUA. These are regions where urbanization and the air quality are moving forward in tandem. Lishui, Zhoushan, and Quzhou, though they have high scores of SAi, lag behind in terms of the urbanization level (SUi), thus affecting the final coordination level values of CUA. It is urgent to improve the level of urbanization infrastructure and social and economic investment in these cities.
As for technological innovation and the atmospheric environment system, Hangzhou, Ningbo, Jiaxing, Huzhou, and Shaoxing, have a higher coordination level of CTA. These cities are the major regions of Zhejiang’s scientific and technological innovation, with rapid development of high-tech industries and a fast increase of technological innovation enterprises. They have played a good role in energy consumption control and air pollution reduction [33]. Similarly, although Quzhou, Zhoushan, and Lishui have high air environment system scores, their technological innovation levels are relatively low, which will directly affect the sustainable development of these regions. It is important for these three cities to explore a new type of urbanization that is led by science and technology, featuring green strategies and coordinated development.
In addition, when comparing the coordination level of UTA subsystems among cities, we found that CUT > CUA > CTA, and the latter two coordination levels are generally close. Therefore, it is an important strategic decision to improve the atmospheric environment system for the sustainable promotion of new urbanization in Zhejiang. Referring to policies that have become reality in recent years, with the stated aim to “ Build a beautiful Zhejiang, create a better life,” Zhejiang introduced a series of governance policies, such as the Action Plan for Prevention and Control of Air Pollution in Zhejiang province (2013–2017), the 13th Five-year Plan for Industrial Pollution Prevention and Control in Zhejiang Province, and a Three-year Action Plan to Win the Blue Sky Battle in Zhejiang Province (2018–2020). Influenced by these policies, Zhejiang Province has made every effort to promote the cogovernance of the five gases (coal-burning flue gas, industrial exhaust gas, vehicle and ship exhaust gas, dust and ash gas, and catering exhaust gas), accelerated the transformation and upgrading of heavily polluting enterprises with the support of scientific and technological progress, vigorously developed a circular economy and clean production, and established an improved atmospheric environment supervision system.

3.2.2. Coordinated Development Index of UTA in 11 Cities

The coordinated development index (CDI), represents the behavior of the composite complex system UTA, which indicates the sustainability of new-type urbanization within the 11 cities in Zhejiang. As previously described, Table 3 categorizes the degree of coherence between the subsystems of UTA according to the values of CDI and defines them by five coordination types. Figure 7 shows the annual classifications of 11 cities by coordination type within Zhejiang, according to the coordination level defined in Table 3.
From Figure 6, we can see that within the study period, the UTACDI values of all cities are not high enough, the coordination is mainly at the low, basic, or good level, and none of the cities achieved excellent coordination. In particular, Lishui experienced a serious imbalance in 2006–2007. According to the analysis results, the reasons for this are that the urbanization development level and technology innovation ability of Lishui are in last place in Zhejiang Province, even though Lishui has good air quality. At the same time, the weak basic ability of urban development also directly affects the quality of life of local residents and impairs sustainable development.
The UTACDI types of almost all cities have undergone step-by-step evolutionary development. For example, the cities in the first tier, including Hangzhou, Ningbo, Shaoxing, and Taizhou, have experienced a transition from basic coordination to good coordination; although the transition time varied (specifically, Hangzhou entered the stage of good coordination in 2011, Ningbo in 2012, Shaoxing in 2013, and Taizhou in 2015), these cities all have relatively good urbanization and economic development levels, as well as outstanding technological innovation capabilities, and they play a better coordinating role in air governance and improvement. Therefore, we named these high-coordinated cities. In the second class, the cities of Wenzhou, Jinhua, Jiaxing, and Huzhou have experienced a three-level transition from low coordination to good coordination, and their coordinated development abilities have been rapidly optimized. Therefore, they are defined as rapid-coordinated cities. The third class comprises three cities, Lishui, Quzhou, and Zhoushan, which have advanced from serious imbalance to basic coordination. The urbanization and technology innovation abilities of these cities developed more slowly than in the first class, so they are defined as low-coordinated cities. In particular, Zhoushan, as a sea-island city, had its coordinated development is restricted by its special geographical location and basic conditions of urbanization development, which caused it to remain at a basic level of coordination for a long time.
In addition, a previous study has revealed that understanding CDI is essential for sustainable urbanization [18]. Considering the development differences in each city, it is necessary to monitor the CDI variation in these cities to ensure the sustainability of the urbanization, technology innovation, and atmospheric environment subsystems.

3.3. Predicted Results of UTACDI Based on GM (1,1)

In order to predict the year that each city will achieve the excellent coordination level, we selected the GM (1,1) to forecast the CDI value for 2018 and beyond, and ran the process in Matlab7.1 software, The MathWorks, Inc., MI, USA. Firstly, we tested the predicted value error of the GM (1,1); the relative error test, relational degree test, mean square error ratio test, and small error probability test results are shown in Table 4. The relational degree test, also known as a geometric test, tests the similarity between the shape of the model curve and the shape of the original series curve. Small error probability and mean variance ratio are the indexes of the residual probability test [62,63].
From Table 4 we see that the relative error is mainly between 0.01 and 0.04, but always less than 0.05 (except Lishui); all of the values are within an acceptable error range, which indicates that the prediction effect of the model is good. Moreover, the relational degree is greater than 0.6, which means that the prediction result is acceptable; the mean variance ratio is less than 0.35, and the small error probability is greater than 0.95, indicating that the prediction effect is very good. Hence, comprehensive evaluation shows that the GM (1,1) has good prediction ability and is suitable for medium- and long-term prediction in a UTA system.
Thus, we obtain detailed forecast results of UTACDI in 11 cities from 2018 to 2017, as shown in Table 5.
From the prediction results in the above table, we can find out when different cities will achieve excellent coordination. Hangzhou and Ningbo were predicted to enter the stage of excellent coordination in 2018. In reality, as one of the first batch of cities to enter the national new urbanization construction pilot, Ningbo vigorously promoted urbanization and high-quality construction after 2017. For instance, the government issued an annual work plan for the comprehensive pilot project of a new-type urbanization in Ningbo, specifying the requirements for people’s livelihood, scientific and technological innovation, and environmental protection [64]. In 2018, relying on technical progress, Ningbo deepened its industrial waste gas treatment. The cement, steel, and plate glass industries have completed the renovation of their desulfurization, denitrification, and dust removal facilities. Thus, the emission of air pollutants decreased rapidly, while the air quality in Ningbo continued to improve, with the excellent and good rate of air quality in the central urban area being 87.7% in 2018, 2.5 percentage points higher than in the previous year. The average annual concentration of PM2.5 was 33 μg/m3, down 10.8% from the previous year, reaching the national secondary standard (35 μg/m3) for the first time. Later, Wenzhou, Jiaxing, Shaoxing three cities, will enter the excellent coordination level in 2019. Huzhou, Jinhua, and Lishui will enter the excellent coordination level in 2020, followed by Taizhou in 2021 and Quzhou in 2023. This means that these cities are predicted to take 2–4 years to adjust their urbanization strategies to achieve the excellent coordination level according to the UTA system. Considering the particular needs of island cities, UTA coordination in Zhoushan still has a long way to go. It may need to focus on improving traffic environment, developing marine and shipbuilding industries, and actively promoting the construction of a free trade zone.

3.4. Policy Implications

The following suggestions for policy-makers can be offered based on the above analysis.
First, special attention should be paid to air quality. A large amount of industrial waste gas, vehicle tail gas, and road dust is produced in the process of urbanization. Thus, new urbanization should strictly control pollutant emissions and reinforce clean production. To achieve this goal, the scientific disposal of waste gas should be promoted. Science and technology should play a further role in dealing with air pollution and improving the investment efficiency for pollutant treatment so that the air quality in Zhejiang can catch up to the pace of urbanization and the UTA system will have coordinated development.
Secondly, the modernization of city governance should be a focus. The governance capability of new urbanization should be promoted. Modern information technology and city governance service should be merged, and intellectual public service should be developed. Science and technical innovation should be applied to city services and pollutant treatment in order to achieve excellent coordination as soon as possible. The top-class cities like Hangzhou and Ningbo can set good examples, and information technology should be exported to other cities so as to improve the management and service capabilities of surrounding cities and promote coordinated development.
Thirdly, balanced development is important. The urbanization development in Zhejiang shows significant regional differences. Cities in the second category should try their utmost to overcome their weaknesses, considering their own situations so as to maintain the coordinated development of urbanization, science, and the environment. The third category cities (less coordinated cities like Lishui, Quzhou, and Zhoushan), which lag behind in the urbanization and science indexes, may consider taking the advantage of their healthy environment and rich natural resources to promote the development of ecological agriculture, tourism, and marine industry. Logic and systematic working should be applied to these industries to achieve balanced development.

4. Conclusions

Rapid and disorderly urbanization can cause serious environmental problems, so the promotion of sustainable new-type urbanization is a vital goal. A major step towards this goal is to balance and coordinate the relationships between urbanization, technological innovation, and the environment. This paper takes increasing concerns about the atmospheric environment system as a starting point to measure the sustainable development of urbanization. Furthermore, we investigate the three subsystems of UTA at the same level to highlight the important coordination and linking role of technological innovation in urbanization and the atmospheric environment. Compared with purely economic or social approaches, systems theory coupled with complexity science is selected to assess sustainable new-type urbanization. We think that sustainable new-type urbanization requires the long-lasting, coordinated development of UTA systems, and needs to go hand-in-hand with the current construction of a Beautiful China.
Then, we conducted a coordinated development index of UTA that indicates the sustainability of new-type urbanization. Taking 11 cities in Zhejiang as examples, we illustrated how the comprehensive indexes and CDI can show the degree of coordination and coherence of UTA. The results showed that the comprehensive score of urbanization and technological innovation system in 11 cities showed a trend of steady growth, while the comprehensive atmospheric environment score of 11 cities showed fluctuation. Comparing the coordination level of UTA subsystems, we found that CUT > CUA > CTA, and the latter two coordination levels are generally close. This suggested that the atmospheric environment system improvement is an important strategic decision for sustainable new urbanization in Zhejiang. Furthermore, within the study period, the UTACDI values of all cities were not high enough; the coordination levels were mainly low, basic, or good, and none of the cities reached the stage of excellent coordination. The coordination levels of the UTA systems in different cities are significantly different, thus, we divided the 11 cities into three categories: high-coordinated cities (Hangzhou, Ningbo, Shaoxing, and Taizhou), rapid-coordinated cities (Wenzhou, Jinhua, Jiaxing, and Huzhou) and low-coordinated cities (Quzhou, Lishui, and Zhoushan).
To predict the year that each city would achieve the “excellent” coordination level, we selected GM (1,1) to forecast the CDI value for 2018 and beyond. The results revealed that the time taken to achieve excellent coordination is different for different cities. Hangzhou and Ningbo were predicted to achieve the excellent coordination level in 2018. Other cities are predicted to take 2–4 years to adjust their urbanization strategies to achieve excellent coordination.
In fact, there are various ways to evaluate the sustainable development of new urbanization. This paper constructs a new analysis framework by UTACDI and provides a reference for China’s new urbanization construction and relevant policy-making. On the one hand, the construction of new urbanization must improve or at least maintain the environment, including the atmospheric environment. On the other hand, the sustainable development of new urbanization must rely on the support of scientific and technological progress. At the same time, we must realize that different cities have different sustainable development strategies due to their different development backgrounds.

Supplementary Materials

Supplementary File 1

Author Contributions

B.J. and L.D. designed the study, analyzed the data, and wrote the manuscript. X.F., and B.J. collected the data and coordinated the data analysis. B.J. and L.D. revised the manuscript. All authors reviewed the manuscript and approved the final version.

Funding

This research was funded by the Soft Science Research Project in Zhejiang Province (Grant No. 2019C35108), Philosophy and Social Science Planning Project in Zhejiang Province (Grant No. 18NDJC109YB).

Conflicts of Interest

The authors declare no conflict of interest.

References

  1. Wang, X.; Hui, E.; Choguill, C.; Jia, S. The new urbanization policy in China: Which way forward? Habitat. Int. 2015, 47, 279–284. [Google Scholar] [CrossRef]
  2. Chen, M.; Liu, W.; Lu, D.; Chen, H.; Ye, C. Progress of China’s new-type urbanization construction since 2014: A preliminary assessment. Cities 2018, 78, 180–193. [Google Scholar] [CrossRef]
  3. Guan, X.; Wei, H.; Lu, S.; Dai, Q.; Su, H. Assessment on the urbanization strategy in China: Achievements, challenges and reflections. Habitat. Int. 2018, 71, 97–109. [Google Scholar] [CrossRef]
  4. Fang, C.; Yu, D. China’s New Urbanization; Springer: Berlin/Heidelberg, Germany; Science Press: Beijing, China, 2016. [Google Scholar]
  5. Lin, B.; Zhu, J. Changes in urban air quality during urbanization in China. J. Clean. Prod. 2018, 188, 312–321. [Google Scholar] [CrossRef]
  6. Fang, C.; Liu, H.; Li, G.; Sun, D.; Miao, Z. Estimating the Impact of Urbanization on Air Quality in China Using Spatial Regression Models. Sustainability 2015, 7, 15570–15592. [Google Scholar] [CrossRef] [Green Version]
  7. Ding, L.; Zhao, W.; Huang, Y.; Cheng, S.; Liu, C. Research on the Coupling Coordination Relationship between Urbanization and the Air Environment: A Case Study of the Area of Wuhan. Atmosphere 2015, 6, 1539–1558. [Google Scholar] [CrossRef] [Green Version]
  8. Han, L.; Zhou, W.; Li, W.; Li, L. Impact of urbanization level on urban air quality: A case of fine particles (PM2.5) in Chinese cities. Environ. Pollut. 2014, 194, 163–170. [Google Scholar] [CrossRef]
  9. Xu, S.; Miao, Y.; Gao, C.; Long, R.; Chen, H.; Zhao, B.; Wang, S. Regional differences in impacts of economic growth and urbanization on air pollutants in China based on provincial panel estimation. J. Clean. Prod. 2019, 208, 340–352. [Google Scholar] [CrossRef]
  10. Zhou, D.; Xu, J.; Wang, L.; Lin, Z. Assessing urbanization quality using structure and function analyses: A case study of the urban agglomeration around Hangzhou Bay (UAHB), China. Habitat. Int. 2015, 49, 165–176. [Google Scholar] [CrossRef]
  11. Tan, Y.; Jiao, L.; Shuai, C.; Shen, L. A system dynamics model for simulating urban sustainability performance: A China case study. J. Clean. Prod. 2018, 199, 1107–1115. [Google Scholar] [CrossRef]
  12. Wang, S.; Ma, H.; Zhao, Y. Exploring the relationship between urbanization and the eco-environment—A case study of Beijing-Tianjin-Hebei region. Ecol. Indic. 2014, 45, 171–183. [Google Scholar] [CrossRef]
  13. He, J.; Wang, S.; Liu, Y.; Ma, H.; Liu, Q. Examining the relationship between urbanization and the eco-environment using a coupling analysis: Case study of Shanghai, China. Ecol. Indic. 2017, 77, 185–193. [Google Scholar] [CrossRef]
  14. Liu, N.; Liu, C.; Xia, Y.; Da, B. Examining the coordination between urbanization and eco-environment using coupling and spatial analyses: A case study in China. Ecol. Indic 2018, 93, 1163–1175. [Google Scholar] [CrossRef]
  15. Zhao, Y.; Wang, S.; Ge, Y.; Liu, Q.; Liu, X. The spatial differentiation of the coupling relationship between urbanization and the eco-environment in countries globally: A comprehensive assessment. Ecol. Model. 2017, 360, 313–327. [Google Scholar] [CrossRef]
  16. Tian, L.; Xu, G.; Fan, C.; Zhang, Y.; Gu, C.; Zhang, Y. Analyzing Mega City-Regions through Integrating Urbanization and Eco-Environment Systems: A Case Study of the Beijing-Tianjin-Hebei Region. Int. J. Environ. Res. Public Health 2019, 16, 114. [Google Scholar] [CrossRef]
  17. Ostrom, E. A general framework for analyzing sustainability of social-ecological systems. Science 2009, 325, 419–422. [Google Scholar] [CrossRef]
  18. Cui, X.; Fang, C.; Liu, H.; Liu, X. Assessing sustainability of urbanization by a coordinated development index for an Urbanization-Resources-Environment complex system: A case study of Jing-Jin-Ji region, China. Ecol. Indic. 2019, 96, 383–391. [Google Scholar] [CrossRef]
  19. Xie, M.; Wang, J.; Chen, K. Coordinated Development Analysis of the “Resources-Environment-Ecology-Economy-Society” Complex System in China. Sustainability 2016, 8, 582. [Google Scholar] [CrossRef]
  20. Zheng, D.; Zang, Z.; Zhang, Y.; Sun, C. Comprehensive assessment of regional PRED system based on new urbanization approach: A case study in Dalian. Prog. Geogr. 2014, 33, 364–374. (In Chinese) [Google Scholar]
  21. Xu, X.; González, J.; Shen, S.; Dou, J. Impacts of urbanization and air pollution on building energy demands—Beijing case study. Appl. Energy 2018, 225, 98–109. [Google Scholar] [CrossRef]
  22. Wang, Q.S.; Yuan, X.L.; Lai, Y.H.; Ma, C.Y.; Ren, W. Research on interactive coupling mechanism and regularity between urbanization and atmospheric environment: A case study in Shandong Province, China. Stoch. Environ. Res. Risk Assess. 2012, 26, 887–898. [Google Scholar] [CrossRef]
  23. Wang, Q.S.; Yuan, X.L.; Zhang, J.; Mu, R.M.; Yang, H.C.; Ma, C.Y. Key evaluation framework for the impacts of urbanization on air environment: A case study. Ecol. Indic. 2013, 24, 266–272. [Google Scholar] [CrossRef]
  24. Qiu, G.; Song, R.; He, S. The aggravation of urban air quality deterioration due to urbanization, transportation and economic development—Panel models with marginal effect analyses across China. Sci. Total Environ. 2019, 651, 1114–1125. [Google Scholar] [CrossRef] [PubMed]
  25. Liu, H.; Fang, C.; Zhang, X.; Wang, Z.; Bao, C.; Li, F. The effect of natural and anthropogenic factors on haze pollution in Chinese cities: A spatial econometrics approach. J. Clean. Prod. 2017, 165, 323–333. [Google Scholar] [CrossRef]
  26. Han, X.; Li, H.; Liu, Q.; Liu, F.; Arif, A. Analysis of influential factors on air quality from global and local perspectives in China. Environ. Pollut. 2019, 248, 965–979. [Google Scholar] [CrossRef] [PubMed]
  27. Zhan, D.; Kwan, M.; Zhang, W.; Yu, X.; Meng, B.; Liu, Q. The driving factors of air quality index in China. J. Clean. Prod. 2018, 197, 1342–1351. [Google Scholar] [CrossRef]
  28. Chen, Y.; Zhao, L. Exploring the relation between the industrial structure and the eco-environment based on an integrated approach: A case study of Beijing, China. Ecol. Indic. 2019, 103, 83–93. [Google Scholar] [CrossRef]
  29. Ge, M. Dynamic Relationship Between Technology Innovation of Industrial Enterprises and Environmental Pollution: A Case Study of Zhejiang Province, China. Nat. Environ. Pollut. Technol. 2019, 18, 531–536. [Google Scholar]
  30. Gu, G.; Zhu, W. Interaction Effects between Technology-Driven Urbanization and Eco-Environment: Evidence from China’s East Zhejiang Region. Sustainability 2019, 11, 836. [Google Scholar] [CrossRef]
  31. Liu, W.; Jiao, F.; Ren, L.; Xu, X.; Wang, J.; Wang, X. Coupling coordination relationship between urbanization and atmospheric environment security in Jinan City. J. Clean. Prod. 2018, 204, 1–11. [Google Scholar] [CrossRef]
  32. Wang, Y.; Jin, C.; Lu, M.; Lu, Y. Assessing the suitability of regional human settlements environment from a different preferences perspective: A case study of Zhejiang Province, China. Habitat Int. 2017, 70, 1–12. [Google Scholar] [CrossRef]
  33. Lu, Y.-Y.; He, Y.; Wang, B.; Ye, S.-S.; Hua, Y.; Ding, L. Efficiency Evaluation of Atmospheric Pollutants Emission in Zhejiang Province China: A DEA-Malmquist Based Approach. Sustainability 2019, 11, 4544. [Google Scholar] [CrossRef]
  34. Chen, Y.; Zang, L.; Du, W.; Shen, G.; Zhang, Q.; Zou, Q.; Chen, J.; Zhao, M.; Yao, D. Ambient air pollution of particles and gas pollutants, and the predicted health risks from long-term exposure to PM 2.5 in Zhejiang province, China. Environ. Sci. Pollut. Res. 2018, 25, 23833–23844. [Google Scholar] [CrossRef] [PubMed]
  35. Zhejiang Provincial Bureau of Statistics. Zhejiang Statistical Yearbook; China Statistics Press: Beijing, China, 2018.
  36. Zhejiang Provincial Bureau of Statistics. Zhejiang Natural Resources and Environment Statistical Yearbook; China Statistics Press: Beijing, China, 2018.
  37. Zhejiang Provincial Bureau of Statistics. Zhejiang Statistical Yearbook of Science and Technology; Zhejiang University Press: Hangzhou, China, 2018.
  38. Ren, L.J.; Cui, E.Q.; Sun, H.Y. Temporal and spatial variations in the relationship between urbanization and water quality. Environ. Sci. Pollut. Res. 2014, 21, 13646–13655. [Google Scholar] [CrossRef] [PubMed]
  39. Guo, Y.T.; Wang, H.W.; Nijkamp, P.; Xu, J.G. Space-time indicators in interdependent urban-environmental systems: A study on the Huai River Basin in China. Habitat. Int. 2015, 45, 135–146. [Google Scholar] [CrossRef]
  40. Ishizaka, A.; Labib, A. Review of the main developments of the analytic hierarchy process. Expert Syst. Appl. 2011, 39, 14336–14345. [Google Scholar] [CrossRef]
  41. Chen, Y.; Yu, J.; Khan, S. The spatial framework for weight sensitivity analysis in AHP-based multi-criteria decision making. Environ. Model. Softw. 2013, 48, 129–140. [Google Scholar] [CrossRef]
  42. Fang, C.; Luo, K.; Kong, Y.; Lin, H.; Ren, Y. Evaluating Performance and Elucidating the Mechanisms of Collaborative Development within the Beijing–Tianjin–Hebei Region, China. Sustainability 2018, 10, 471. [Google Scholar] [CrossRef]
  43. Jiang, Q.; Liu, Z.; Liu, W.; Li, T.; Cong, W.; Zhang, H.; Shi, J. A principal component analysis based three-dimensional sustainability assessment model to evaluate corporate sustainable performance. J. Clean. Prod. 2018, 187, 625–637. [Google Scholar] [CrossRef]
  44. Tripathi, M.; Singal, S. Use of Principal Component Analysis for parameter selection for development of a novel Water Quality Index: A case study of river Ganga India. Ecol. Indic. 2019, 96, 430–436. [Google Scholar] [CrossRef]
  45. Dai, Q.; Liu, G.; Liu, M.; Wang, B. An evaluation on sustainable development of eco-economic system in small watershed in hilly area of Northeast China. Acta Geogr. Sin. 2005, 60, 210–218. (In Chinese) [Google Scholar]
  46. Li, J.; Heap, A. A review of comparative studies of spatial interpolation methods in environmental sciences: Performance and impact factors. Ecol. Inform. 2011, 6, 228–241. [Google Scholar] [CrossRef]
  47. Liang, L.; Wang, Z.; Fang, C.; Sun, Z. Spatiotemporal differentiation and coordinated development pattern of urbanization and the ecological environment of the Beijing-Tianjin-Hebei urban agglomeration. Acta Ecol. Sin. 2019, 39, 1212–1225. (In Chinese) [Google Scholar]
  48. Liang, X.; Liang, W.; Zhang, L.; Guo, X. Risk assessment for long-distance gas pipelines in coal mine gobs based on structure entropy weight method and multi-step backward cloud transformation algorithm based on sampling with replacement. J. Clean. Prod. 2019, 227, 218–228. [Google Scholar] [CrossRef]
  49. Liu, F.; Zhao, S.; Weng, M.; Liu, Y. Fire risk assessment for large-scale commercial buildings based on structure entropy weight method. Saf. Sci. 2017, 94, 26–40. [Google Scholar] [CrossRef]
  50. Cheng, Q. Structure entropy weight method to confirm the weight of evaluating index. Syst. Eng. Theory Pract. 2010, 30, 1225–1228. [Google Scholar]
  51. Zhao, X.; Guo, H.; Huang, C.; Zhong, J. Teaching evaluation system research based on structure entropy weight method. J. Discrete Math. Sci. Cryptogr. 2017, 20, 179–191. [Google Scholar] [CrossRef]
  52. Mamat, Z.; Yimit, H.; Eziz, M.; Ablimit, A. Analysis of the ecology-economy coordination degree in yanqi basin, Xinjiang, China. Asian J. Chem. 2013, 25, 9034–9040. [Google Scholar] [CrossRef]
  53. Li, Y.; Li, Y.; Zhou, Y.; Shi, Y.; Zhu, X. Investigation of a coupling model of coordination between urbanization and the environment. J. Environ. Manag. 2012, 98, 127–133. [Google Scholar] [CrossRef]
  54. Yang, Q.; Ding, Y.; De Vries, B.; Han, Q.; Ma, H.M. Assessing regional sustainability using a model of coordinated development index: A case study of mainland China. Sustainability 2014, 6, 9282–9304. [Google Scholar] [CrossRef]
  55. Tang, Z. An integrated approach to evaluating the coupling coordination between tourism and the environment. Tour. Manag. 2015, 46, 11–19. [Google Scholar] [CrossRef]
  56. Wu, J.; Wang, X.; Wang, X.; Peng, W. Measurement of system coordination degree of China National Sustainable Communities. Int. J. Sustain. Dev. Plan. 2017, 12, 922–932. [Google Scholar] [CrossRef]
  57. Li, M.; Wang, W.; De, G.; Ji, X.; Tan, Z. Forecasting carbon emissions related to energy consumption in Beijing-Tianjin-Hebei region based on grey prediction theory and extreme learning machine optimized by support vector machine algorithm. Energies 2018, 11, 2475. [Google Scholar] [CrossRef]
  58. Sun, W.; Hou, Y.; Guo, L. Analyzing and Forecasting Energy Consumption in China’s Manufacturing Industry and Its Subindustries. Sustainability 2019, 11, 99. [Google Scholar] [CrossRef]
  59. Wang, Z.X.; Li, Q.; Pei, L.L. A seasonal GM (1, 1) model for forecasting the electricity consumption of the primary economic sectors. Energy 2018, 154, 522–534. [Google Scholar] [CrossRef]
  60. Cao, W.; Li, R.; Chi, X.; Chen, N.; Chen, J.; Zhang, H.; Zhang, F. Island urbanization and its ecological consequences: A case study in the Zhoushan Island, East China. Ecol. Indic. 2017, 76, 1–14. [Google Scholar] [CrossRef]
  61. Wu, A.; Wang, C.; Li, S. Geographical knowledge search, internal R&D intensity and product innovation of clustering firms in Zhejiang, China. Pap. Reg. Sci. 2015, 94, 553–572. [Google Scholar]
  62. Yu, Y.; Deng, Y.; Chen, F. Impact of population aging and industrial structure on CO2 emissions and emissions trend prediction in China. Atmos. Pollut. Res. 2018, 9, 446–454. [Google Scholar] [CrossRef]
  63. Tang, D.; Ma, T.; Li, Z.; Tang, J.; Bethel, B.J. Trend Prediction and Decomposed Driving Factors of Carbon Emissions in Jiangsu Province during 2015–2020. Sustainability 2016, 8, 1018. [Google Scholar] [CrossRef]
  64. Zhang, C.; Zhong, S.; Wang, X.; Shen, L.; Liu, L.; Liu, Y. Land Use Change in Coastal Cities during the Rapid Urbanization Period from 1990 to 2016: A Case Study in Ningbo City, China. Sustainability 2019, 11, 2122. [Google Scholar] [CrossRef]
Figure 1. Indicators of economy, urbanization, and waste gas discharged in the whole of Zhejiang Province in 2006–2017. (Data source: Zhejiang Statistical Yearbook (2007–2018) [35].)
Atmosphere 10 00652 g001
Figure 2. Framework and interaction of three UTA subsystems.
Atmosphere 10 00652 g002
Figure 3. Trends in the urbanization system scores of 11 cities in Zhejiang.
Atmosphere 10 00652 g003
Figure 4. Trends in the technology innovation system scores of 11 cities in Zhejiang.
Atmosphere 10 00652 g004
Figure 5. Trends in the atmospheric environment system scores of 11 cities in Zhejiang.
Atmosphere 10 00652 g005
Figure 6. Radar map of the coordination degree of 11cities in Zhejiang in 2006–2017.
Atmosphere 10 00652 g006
Figure 7. The coordination types of UTA in Zhejiang in 2006–2017.
Atmosphere 10 00652 g007
Table 1. Indicators of urbanization, technology innovation, and atmospheric environment subsystems in UTA.
SubsystemSecond Level IndicatorW1Primary IndicatorW2W3Effect
UrbanizationUrbanization level0.466Percentage of urban population0.3860.180Positive
Area of urban construction land (km2)0.3030.141Positive
Percentage of the tertiary industry0.3110.145Positive
Urbanization efficiency0.534GDP per capita (Yuan)0.2040.109Positive
Number of college students per 10,000 people0.1950.104Positive
Number of health technicians per 10,000 people0.1210.064Positive
Urban residents’ per capita disposable income0.2080.111Positive
Green coverage in built-up areas0.1240.066Positive
Private vehicle ownership0.1480.079Positive
Technology innovationInput in technological innovation0.277proportion of R&D expenditure in GDP0.3950.109Positive
Number of R&D personnel (10,000 people)0.3410.094Positive
Number of R&D projects of industrial enterprises above scale 0.2640.073Positive
Output in technological innovation0.324Number of patent applications granted0.3850.124Positive
Technical contract transaction amount (100 million yuan)0.2280.074Positive
Output value of high-tech industry (100 million yuan)0.3870.126Positive
Benefits of technological innovation0.399Production rate of new product0.5270.210Positive
The added value of high-tech industry accounts for the proportion of industries above scale0.4730.189Positive
Atmospheric environmentAir pollution emission0.307Total volume of waste gas emission (100 million cu. m)0.2570.079Negative
Mass of sulfur dioxide emission (10,000 tons)0.2000.061Negative
Mass of nitrogen oxide emission (ton)0.2520.077Negative
Mass of smoke & dust emission (10,000 tons)0.2920.089Negative
Air pollution control0.253Energy consumption per unit of GDP0.3990.101Negative
Investment in environmental pollution control0.2880.073Positive
Waste gas treatment facilities of unit industrial output0.3140.079Positive
Air quality0.440Sulfur dioxide concentration (μg/m3)0.2160.095Negative
Nitrogen dioxide concentration (μg/m3)0.2240.099Negative
Particulate Matter 10 concentration (μg/m3)0.2790.123Negative
Good air quality rate0.2810.124Positive
Note: W1 and W2 are the calculation results of the structure entropy weight (SEW) method. W3 is the result of W1*W2 in the corresponding index hierarchy. GDP represents the gross domestic product. R&D represents the social research and development.
Table 2. Questionnaire survey of the importance of index rankings.
UTA IndexesNo. of Experts1st Choice2nd Choice3rd Choice4th Choice
Index AE1
E2
E3
Index BE1
E2
E3
Index CE1
E2
E3
Table 3. Five levels of coordinated development index (CDI) for UTA.
Coordinated development index range[0, 0.20](0.20, 0.40](0.40, 0.60](0.60, 0.80](0.80, 1.00]
Coordination
Types
Serious
imbalance
Little
coordination
Basic
coordination
Good
coordination
Excellent
coordination
Source: Adapted from Wu et al. (2017) [53].
Table 4. GM (1,1) error test based on CDI value in 2016–2017.
Error Test20162017Relative ErrorRelational DegreeMean Variance RatioSmall Error Probability
CityActual ValuePrediction ValueActual ValuePrediction Value
Hangzhou0.7570.7260.7730.7550.041 0.674 0.231 1.000
Ningbo0.7690.7520.7600.7860.023 0.681 0.111 1.000
Wenzhou0.6790.6970.7590.7460.021 0.601 0.060 1.000
Jiaxing0.6960.6910.7110.7340.019 0.602 0.069 1.000
Huzhou0.6550.6590.6770.6980.011 0.633 0.061 1.000
Shaoxing0.7040.7030.7330.7420.029 0.738 0.152 1.000
Jinhua0.6560.6540.6580.6940.0210.701 0.113 1.000
Quzhou0.5440.5320.5470.5650.009 0.704 0.072 1.000
Zhoushan0.5130.5180.5460.5390.051 0.727 0.310 0.953
Taizhou0.6460.6460.6680.6760.012 0.600 0.032 1.000
Lishui0.5450.5620.5590.5870.110 0.613 0.161 1.000
Table 5. GM (1,1) prediction results of UTACDI in 11 cities in 2018–2027.
Year2018201920202021202220232024202520262027
Hangzhou0.81450.82360.84630.87920.91350.94900.98601.02441.06431.1058
Ningbo0.82270.86040.89990.94110.98421.02931.07651.12581.17741.2314
Wenzhou0.79910.85540.91570.98031.04941.12341.20261.28741.37821.4753
Jiaxing0.77960.82810.87950.93420.99221.05381.11931.18891.26271.3412
Huzhou0.73960.78320.82930.87820.92990.98471.04281.10421.16931.2382
Shaoxing0.78440.82820.87460.92350.97511.02961.08721.14801.21221.2800
Jinhua0.73870.78520.83470.88730.94321.00261.06571.13281.20421.2801
Quzhou0.60160.64000.68080.72430.77060.81980.87210.92780.98711.0501
Zhoushan0.56090.58310.60620.63030.65520.68120.70820.73630.76550.7958
Taizhou0.70860.74200.77700.81360.85190.89210.93410.97811.02421.0725
Lishui0.70030.78140.87180.97281.08541.21111.35141.50781.68241.8773
Note: The bolded data represent practical and effective prediction results because the theoretical value range of UTACDI is [0,1].

