Urban Aerosol Particle Size Characterization in Eastern Mediterranean Conditions


1
Department of Physics, The University of Jordan, Amman 11942, Jordan
2
Institute for Atmospheric and Earth System Research (INAR), University of Helsinki, PL 64, FI-00014 UHEL Helsinki, Finland
*
Author to whom correspondence should be addressed.
Atmosphere 2019, 10(11), 710; https://doi.org/10.3390/atmos10110710
Submission received: 13 October 2019
/
Revised: 8 November 2019
/
Accepted: 10 November 2019
/
Published: 14 November 2019
(This article belongs to the Special Issue Urban Atmospheric Aerosols: Sources, Analysis and Effects)
Abstract
:Characterization of urban particle number size distribution (PNSD) has been rarely reported/performed in the Middle East. Therefore, we aimed at characterizing the PNSD (0.01–10 µm) in Amman as an example for an urban Middle Eastern environment. The daily mean submicron particle number concentration (PNSub) was 6.5 × 10³–7.7 × 104 cm−3 and the monthly mean coarse mode particle number concentration (PNCoarse) was 0.9–3.8 cm−3 and both had distinguished seasonal variation. The PNSub also had a clear diurnal and weekly cycle with higher concentrations on workdays (Sunday–Thursday; over 3.3 × 104 cm−3) than on weekends (below 2.7 × 104 cm−3). The PNSub constitute of 93% ultrafine fraction (diameter < 100 nm). The mean particle number size distributions was characterized with four well-separated submicron modes (Dpg,I, Ni): nucleation (22 nm, 9.4 × 103 cm−3), Aitken (62 nm, 3.9 × 103 cm−3), accumulation (225 nm, 158 cm−3), and coarse (2.23 µm, 1.2 cm−3) in addition to a mode with small geometric mean diameter (GMD) that represented the early stage of new particle formation (NPF) events. The wind speed and temperature had major impacts on the concentrations. The PNCoarse had a U-shape with respect to wind speed and PNSub decreased with wind speed. The effect of temperature and relative humidity was complex and require further investigations.
1. Introduction
Atmospheric aerosol particles have gained increased attention during recent years due to their effects on the climate and human health [1,2]. While most health studies related to air pollution focus on the mass accumulation of particulate matter (PM), advanced studies have shown the importance of the number size distribution on health. For instance, it has been evident that fine particles are capable of penetrating through the respiratory system and circulating in the bloodstream causing serious health effects in different organs in the human body [3]. While the smallest particles do not contribute significantly to the total measured mass concentration, they constitute the highest fraction of the number concentration of measured particles in various locations, which can be more than 100,000 particles/cm3. Besides that, governmental policies tend to enforce strategies that eradicate the total mass in an attempt of improving visibility and saving human health; at the same time ignoring the effects of the ultrafine particles (UFP, diameter < 0.1 µm), which have rather complex sources and atmospheric processes. For example, fine and UFP are capable of growing to reach sizes where they constitute a fraction of cloud condensation nuclei (CCN); and thus, indirectly affecting the climate [4,5].
The drivers behind aerosol particles vary between natural and anthropogenic as well as primary and secondary. Primary particles are emitted to the atmosphere as particles while secondary particles form in the atmosphere via gas-to-particle transformation, which has been known as new particle formation (NPF) observed in various environments and contributing to a major fraction of the total particle number budget [6,7,8]. Indeed, the complexity of urban aerosols lies in the fact that several sources can contribute in the same particle size range, making it difficult to entangle [9,10]. Although, some studies focusing on the particle number size distribution have been conducted around the East Mediterranean region at both urban and remote sites [11,12,13,14], very few studies can be found regarding the Middle East [15,16,17,18,19,20,21]. In fact, the Middle East and North Africa (MENA) is of extreme interest as it serves as a compilation of aerosol particle sources including natural dust, anthropogenic pollution from petrochemical industry and urbanization, as well as new particle formation.
The aim of this paper is to characterize the aerosol particle number size distribution and explore the drivers behind diurnal and seasonal variability of the number concentrations in Amman, which is an example of Middle Eastern urban conditions. Here we utilized a long-term measurement of particle number size distributions over a wide particle diameter range (0.01–10 µm). We also applied modal structure analysis for the population of aerosols by using the multi-lognormal distribution function. We additionally investigated the effect of local meteorology on the aerosol concentrations.
2. Materials and Methods
2.1. Aerosol Measurements
The long-term aerosol measurement was performed during 1 August 2016–31 Jul, 2017 at the Aerosol Laboratory, which was located on the third floor of the Department of Physics, University of Jordan. The University of Jordan campus was located at an urban background in the north part of Amman, Jordan (Supplementary Material Figure S1). The aerosol measurement consisted of total number concentration and particle number size distribution, described in more detail in the following section.
The particle number size distribution was measured with a scanning mobility particle sizer (NanoScan SMPS 3910, TSI, Minnesota, U.S.) and an optical particle sizer (OPS 3330, TSI, Minnesota, U.S.). Using the NanoScan SMPS (electrical equivalent mobility diameter: 0.01–0.42 µm, 13 channels at dry conditions) and the OPS (optical diameter: 0.3–10 µm, 13 channels at dry conditions) can provide a useful setup to monitor a wide particle diameter range 0.01–10 µm. However, combining the measurement results of these two instruments is challenging as will be pointed out in the next section.
The NanoScan SMPS consists of four main built-in components: (1) a cyclone inlet to remove large particles, (2) unipolar particle charger, (3) a radial differential mobility analyzer (RDMA), and (4) an isopropanol-based condensation particle counter (CPC). The particle number size distribution scan was 60 s (45 s upscan and 15 s downscan). The inlet flow rate was 0.75 lpm (±20%) whereas the sample flow rate was 0.25 lpm (±10%).
The OPS measured the particle number size distribution using the TSI default particle size bins, which consisted of 13 equally sized bins based on a lognormal scale. The dead-time correction was applied in the OPS operation. Sampling time-resolution was 5 min with a flow rate ~1 lpm.
The total number concentration of submicron aerosols was measured with a portable condensation particle counter (CPC 3007-2, TSI, Minnesota, U.S.). The cutoff size of this CPC was 10 nm and it was capable of measuring submicron particle number concentration of aerosols with diameters up to 2 µm. According to the specifications provided by the manufacturer, the maximum detectable concentration was 105 cm−3 with 20% accuracy. The sampling flow rate was 0.1 lpm (inlet flow rate 0.7 lpm).
Each instrument had its own aerosol sampling inlet (~1-m-long and 8 mm inner diameter) which was led through the wall to sample the outdoor aerosols. Each inlet consisted of short Tygon tubes (4 mm inner diameter) connected to a diffusion drier (TSI model 3062-NC). The diffusion drier was used to remove the excess moisture from the aerosol sample.
The aerosol transport efficiency through the aerosol inlet assembly was determined experimentally: ambient aerosol sampling alternatively with and without inlet. The aerosol data was corrected accordingly (Figure S2). The penetration efficiency was ~47% for 10 nm, ~93% for 0.3 µm, and ~40% for 10 µm particles. Accordingly, the particle number size distributions were corrected for losses in the tubing and the diffusion drier.
Based on the hourly mean total number concentrations, the ratio between SMPS (10–420 nm) and the CPC was approximately 0.86 and the relationship between them was linear with an R2 = 0.78 (Figure S3a). The differences can arise from the fact that the CPC measured the full range of the submicron particles (from 10 nm up to a couple of micrometers) whereas the SMPS measurement range was nominally within the diameter range 10–420 nm. In practice, the NanoScan was not able to measure aerosols with diameters larger than 250 nm, which makes it an ultrafine (Dp < 0.1 µm) particle sizer. On the other hand, considering the number concentration within the diameter range 10–1000 nm, which can be obtained by the combined distributions measured with the SMPS and the OPS, revealed that its mean ratio compared to that measured with the CPC was about 1.14 and the relationship between them was linear with an R2 = 0.78 (Figure S3b). This is expected because the CPC data was not corrected for sampling line losses.
2.2. Data Handling
The measurement time-resolution of the SMPS and the CPC was 1 min and of the OPS was 5 min. In order to construct a wide range of the measured particle number size distribution, we performed the following steps: (1) calculated the 5-min average of the SMPS data, (2) omitted the last two channels in the SMPS (i.e., remaining diameter range was 0.01–0.25 µm), (3) omitted the first channel in the OPS (i.e., remaining diameter range was 0.32–10 µm), and (4) merged the two distributions. As such, we obtained a combined particle number size distribution covering the diameter range 0.01–10 µm.
We calculated the particle number concentration (cm−3) within four particle diameter ranges (size-fractionated number concentration): 0.01–0.025 µm (nucleation), 0.025–0.1 µm (Aitken), 0.1–1 µm (accumulation), and 1–10 µm (coarse). Consequently, the total number concentration was obtained as the sum of all these fractions. The size-fractionated number concentrations were obtained by integrating (practically summation) the measured particle number size distribution over the specified particle diameter range
where nN0 = dN/dlog10(Dp) is the measured particle number size distribution and Dp is the particle diameter.
The processed aerosol data (including all size-fractionated data) was then converted to hourly statistical analysis. This hourly averaged data was then used to calculate the daily and monthly statistical values. The statistical analysis included average, standard deviation, median, minimum, maximum, and percentiles (5%, 25%, 75%, and 95%) of valid number of data points, and percentage of valid data points.
2.3. Multi-Lognormal Distribution
A particle number size distribution can be characterized with a multi-lognormal distribution function [22]
where n is the number of individual log-normal modes and Dp is the aerosol particle diameter, and the three log-normal parameters that characterize an individual log-normal mode i are the mode number concentration Ni, the geometric variance σ2g,i, and the geometric mean diameter Dpg,i.
Here we used the DO-FIT algorithm to fit the particle number size distribution. The original DO-FIT algorithm was developed for the submicron particle size fraction [22]; here it was modified to include the coarse mode fraction. We ran the DO-FIT algorithm to fit the particle number size distributions (0.01–10 µm, 5-min resolution) by using a fixed number of modes, which was four.
2.4. Weather Conditions
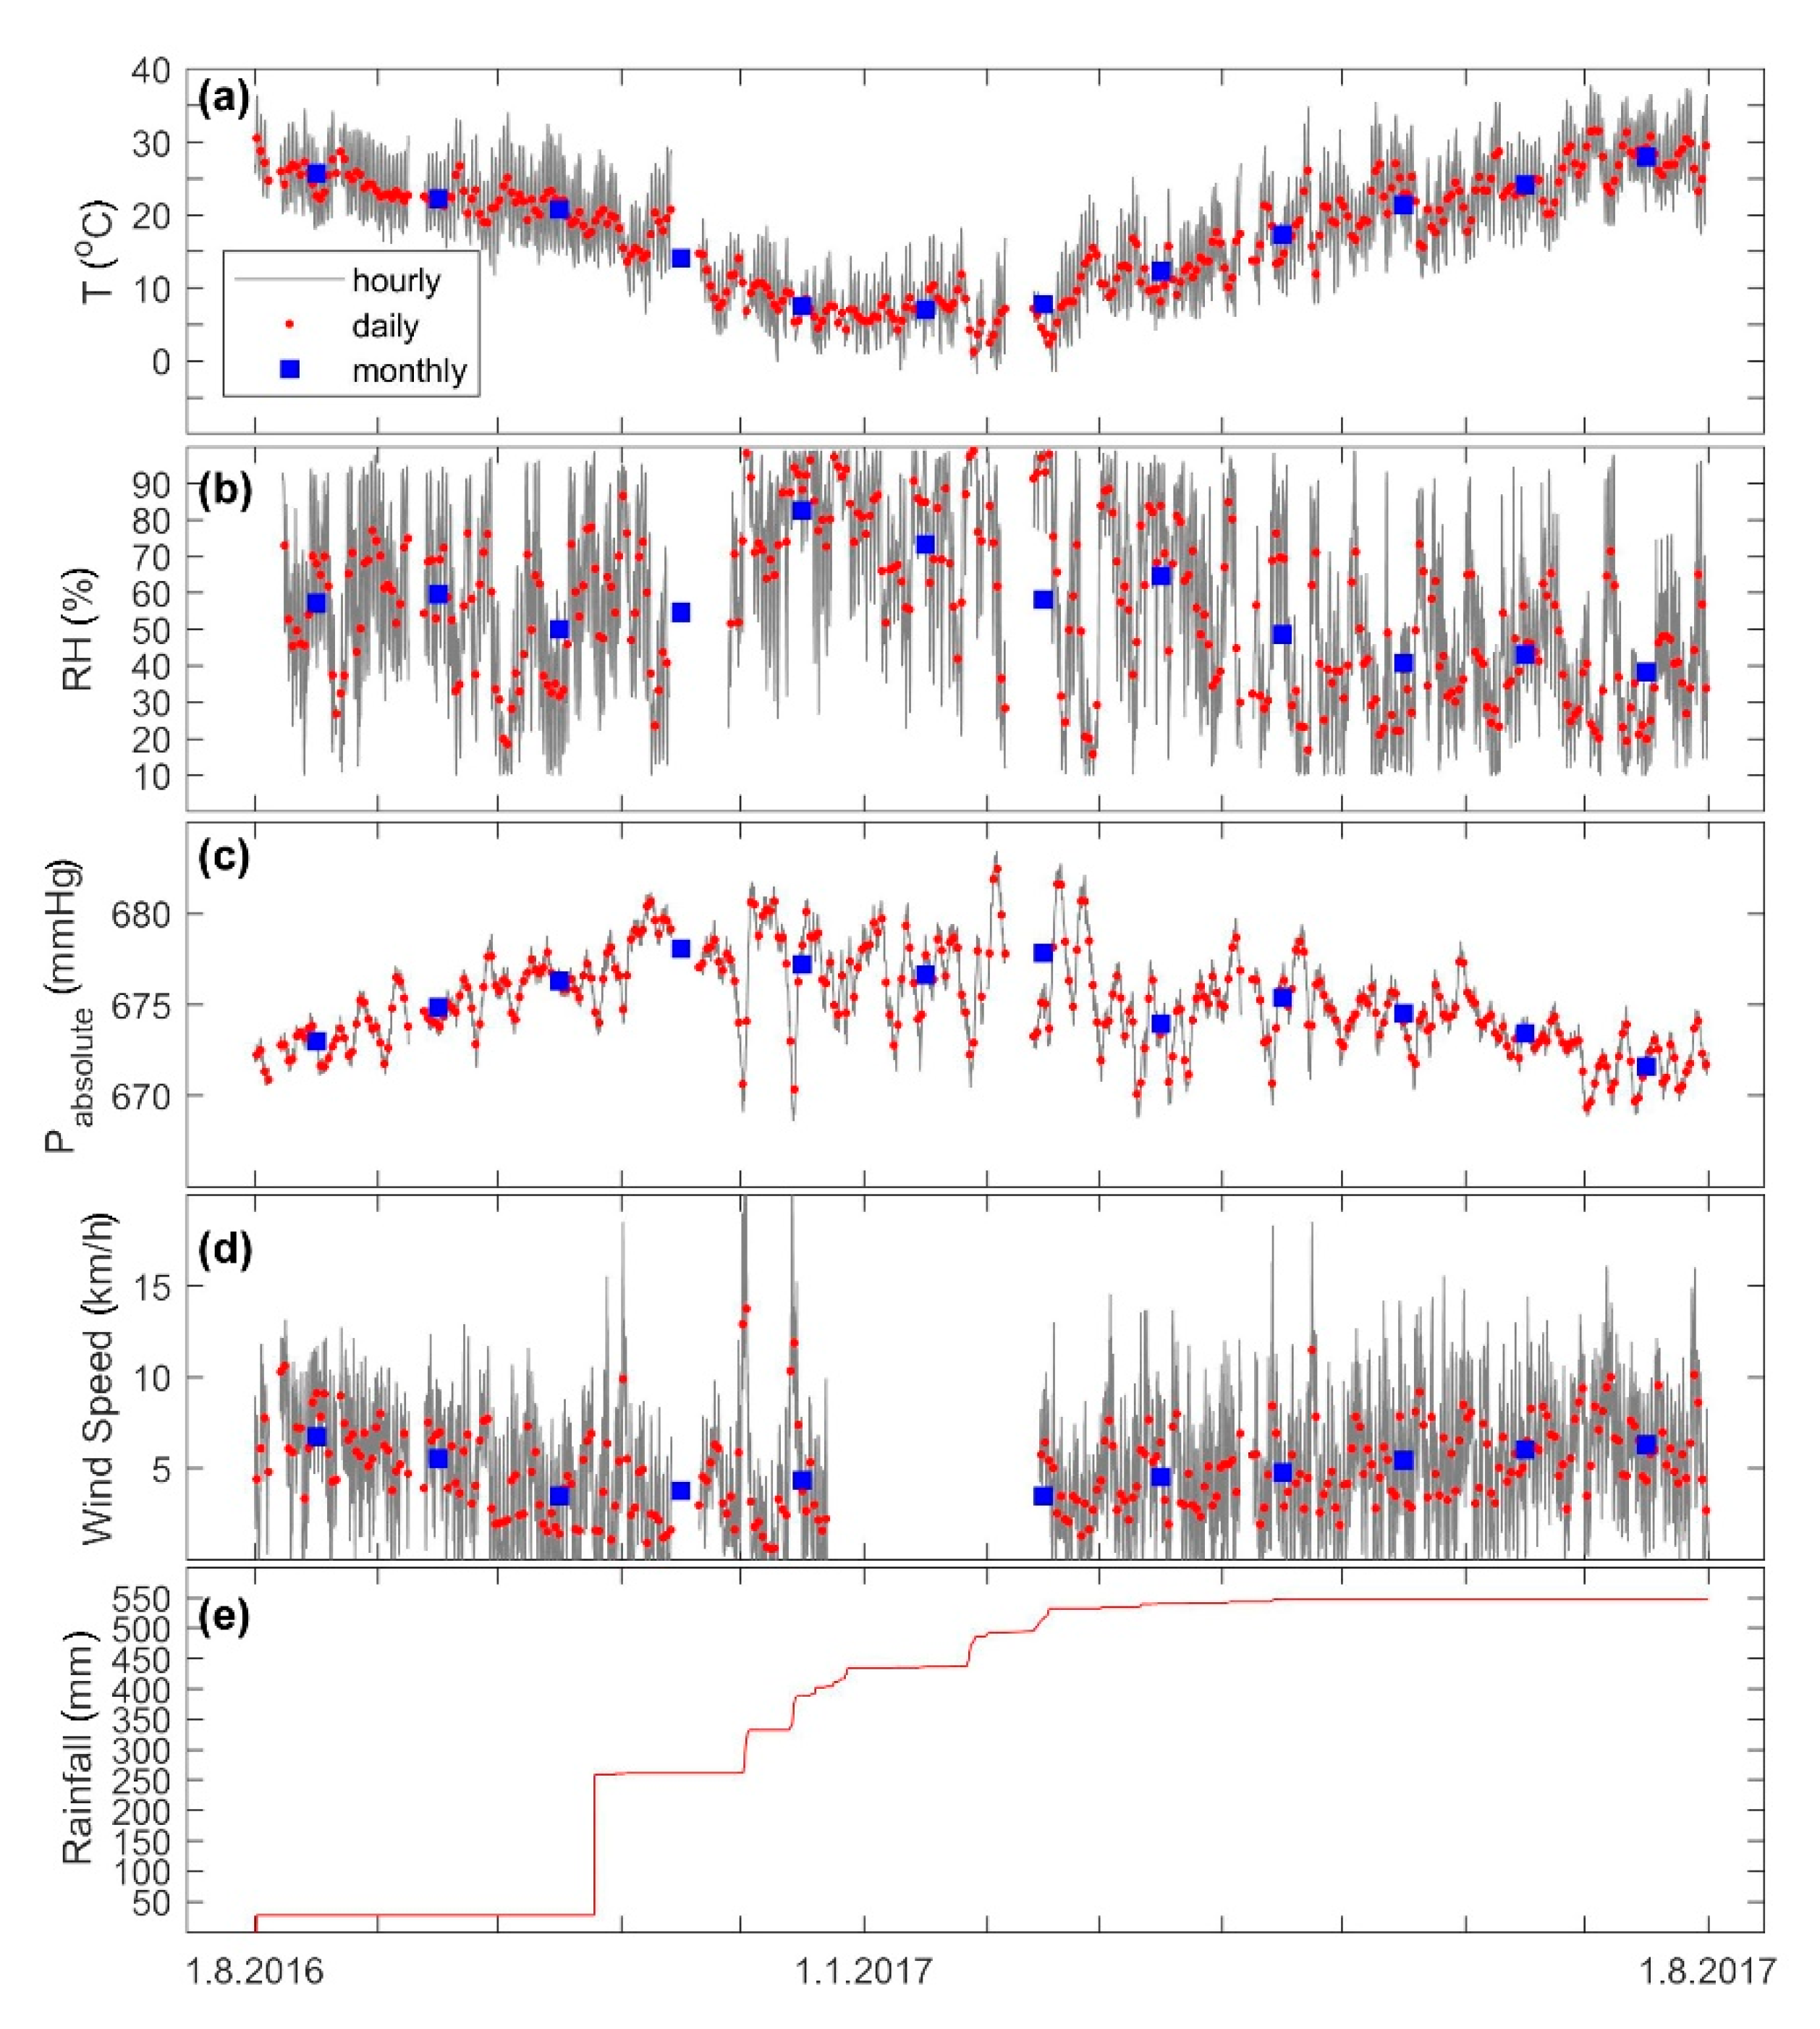
The weather conditions were obtained from the continuous measurement performed on the rooftop of the Department of Physics. In this study, we selected weather data for the same time period as the aerosol measurement (i.e., 1 August 2016–31 July 2017; Figure 1).
The weather measurement was performed with a weather station (WH-1080, Clas Ohlson: Art.no. 36-3242). The time resolution of the measurement was 5 min. The weather data consisted of ambient temperature (−40–65 °C, resolution 0.1 °C), absolute pressure (918.7–1079.9 hPa, resolution 0.3 hPa), relative humidity (10%–99%, resolution 1%), wind speed (1–160 km/h) and direction (divided into 16 wind sectors), and precipitation (0–9999 mm, resolution 0.3 mm below 1000 mm and 1 mm over 1000 mm).
According to the daily mean (Figure 1), the temperature was 1–32 °C (overall mean 18 ± 8 °C) and the absolute pressure was 670–682 mmHg (overall mean 675 ± 3 mmHg). The overall average relative humidity was 53 ± 21% and the mean wind speed was 5 ± 3 km/h. The cumulative rain was about 550 mm.
3. Results and Discussion
3.1. Temporal Variation of the Particle Number Concentrations
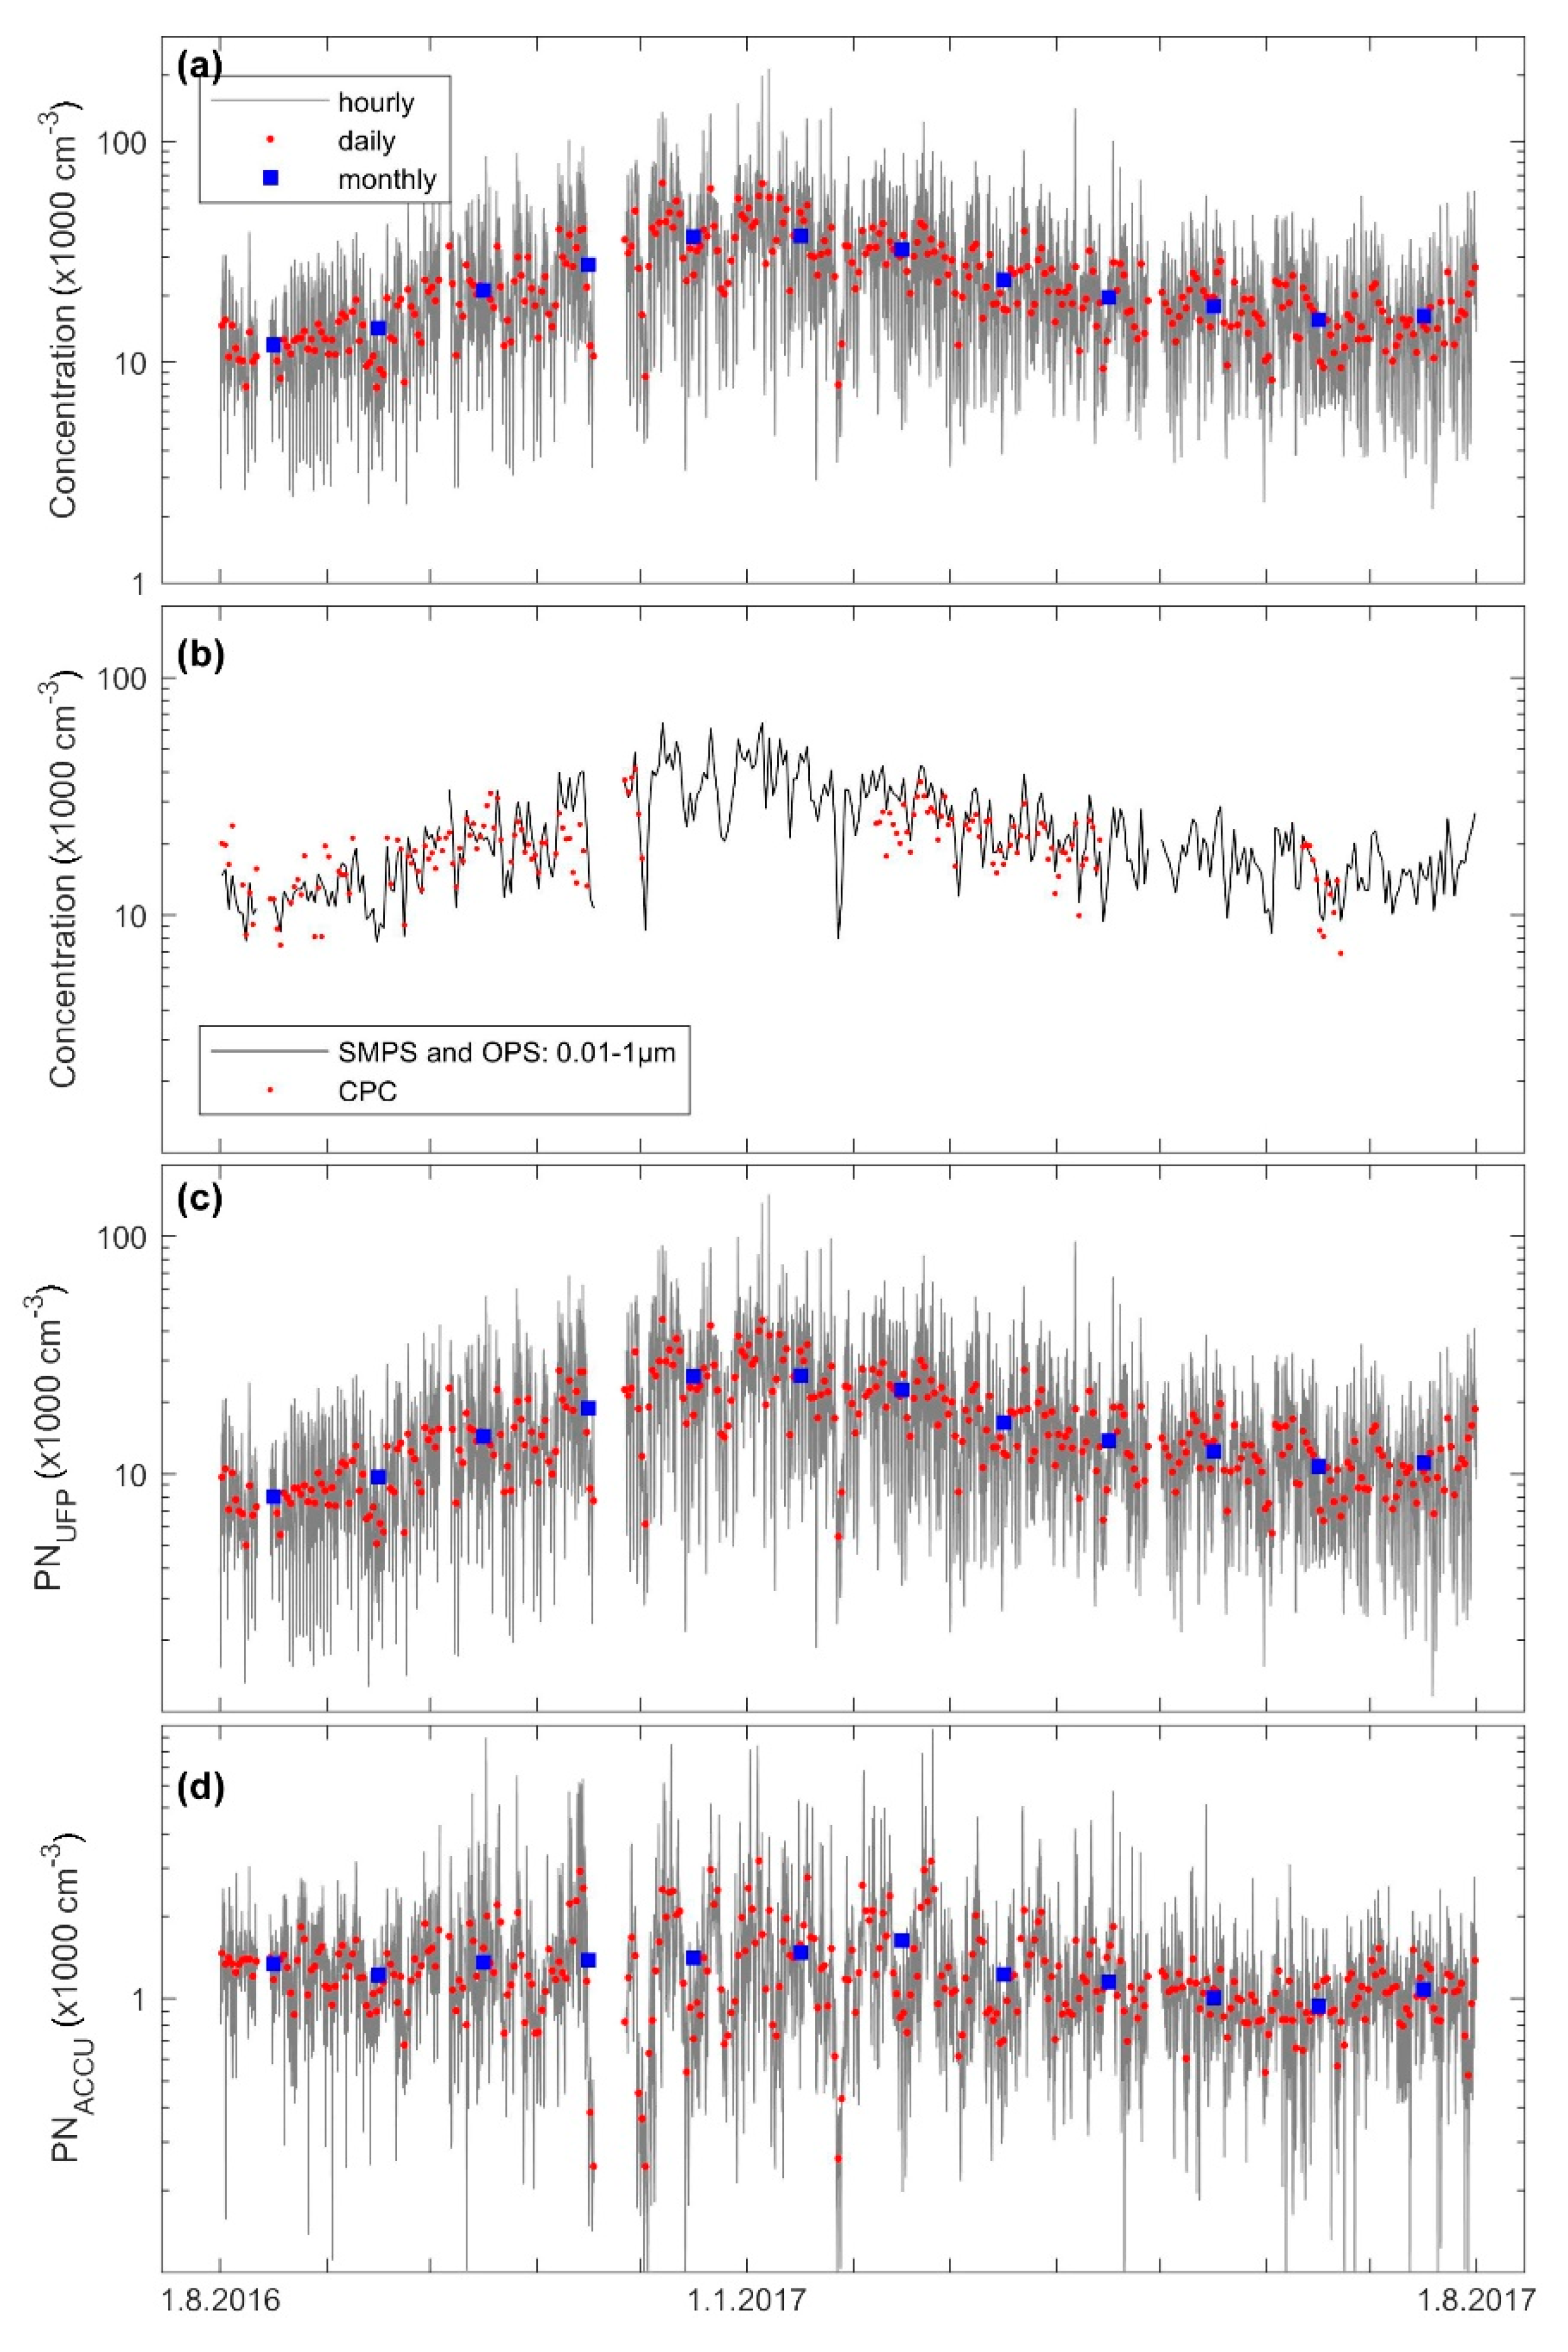
The submicron particle number concentration (PNSub) was higher during the winter than during the summer (Figure 2a), suggesting a seasonal variation of fine aerosol number concentrations. Based on the monthly means, PNSub was in the range 3.3 × 10⁴–3.7 × 104 cm−3 during the winter (December–February) and 1.2 × 10⁴–1.6 × 104 cm−3 during the summer and early autumn (June–September) (Table S1). According to the 24-h mean number concentrations, PNSub was as high as 6.5 × 104 cm−3 and as low as 7.7 × 103 cm−3. According to the hourly means, it was in the range 2.2 × 10³–2.1 × 105 cm−3. This seasonal variation was also confirmed by the CPC observations (Figure 2b).
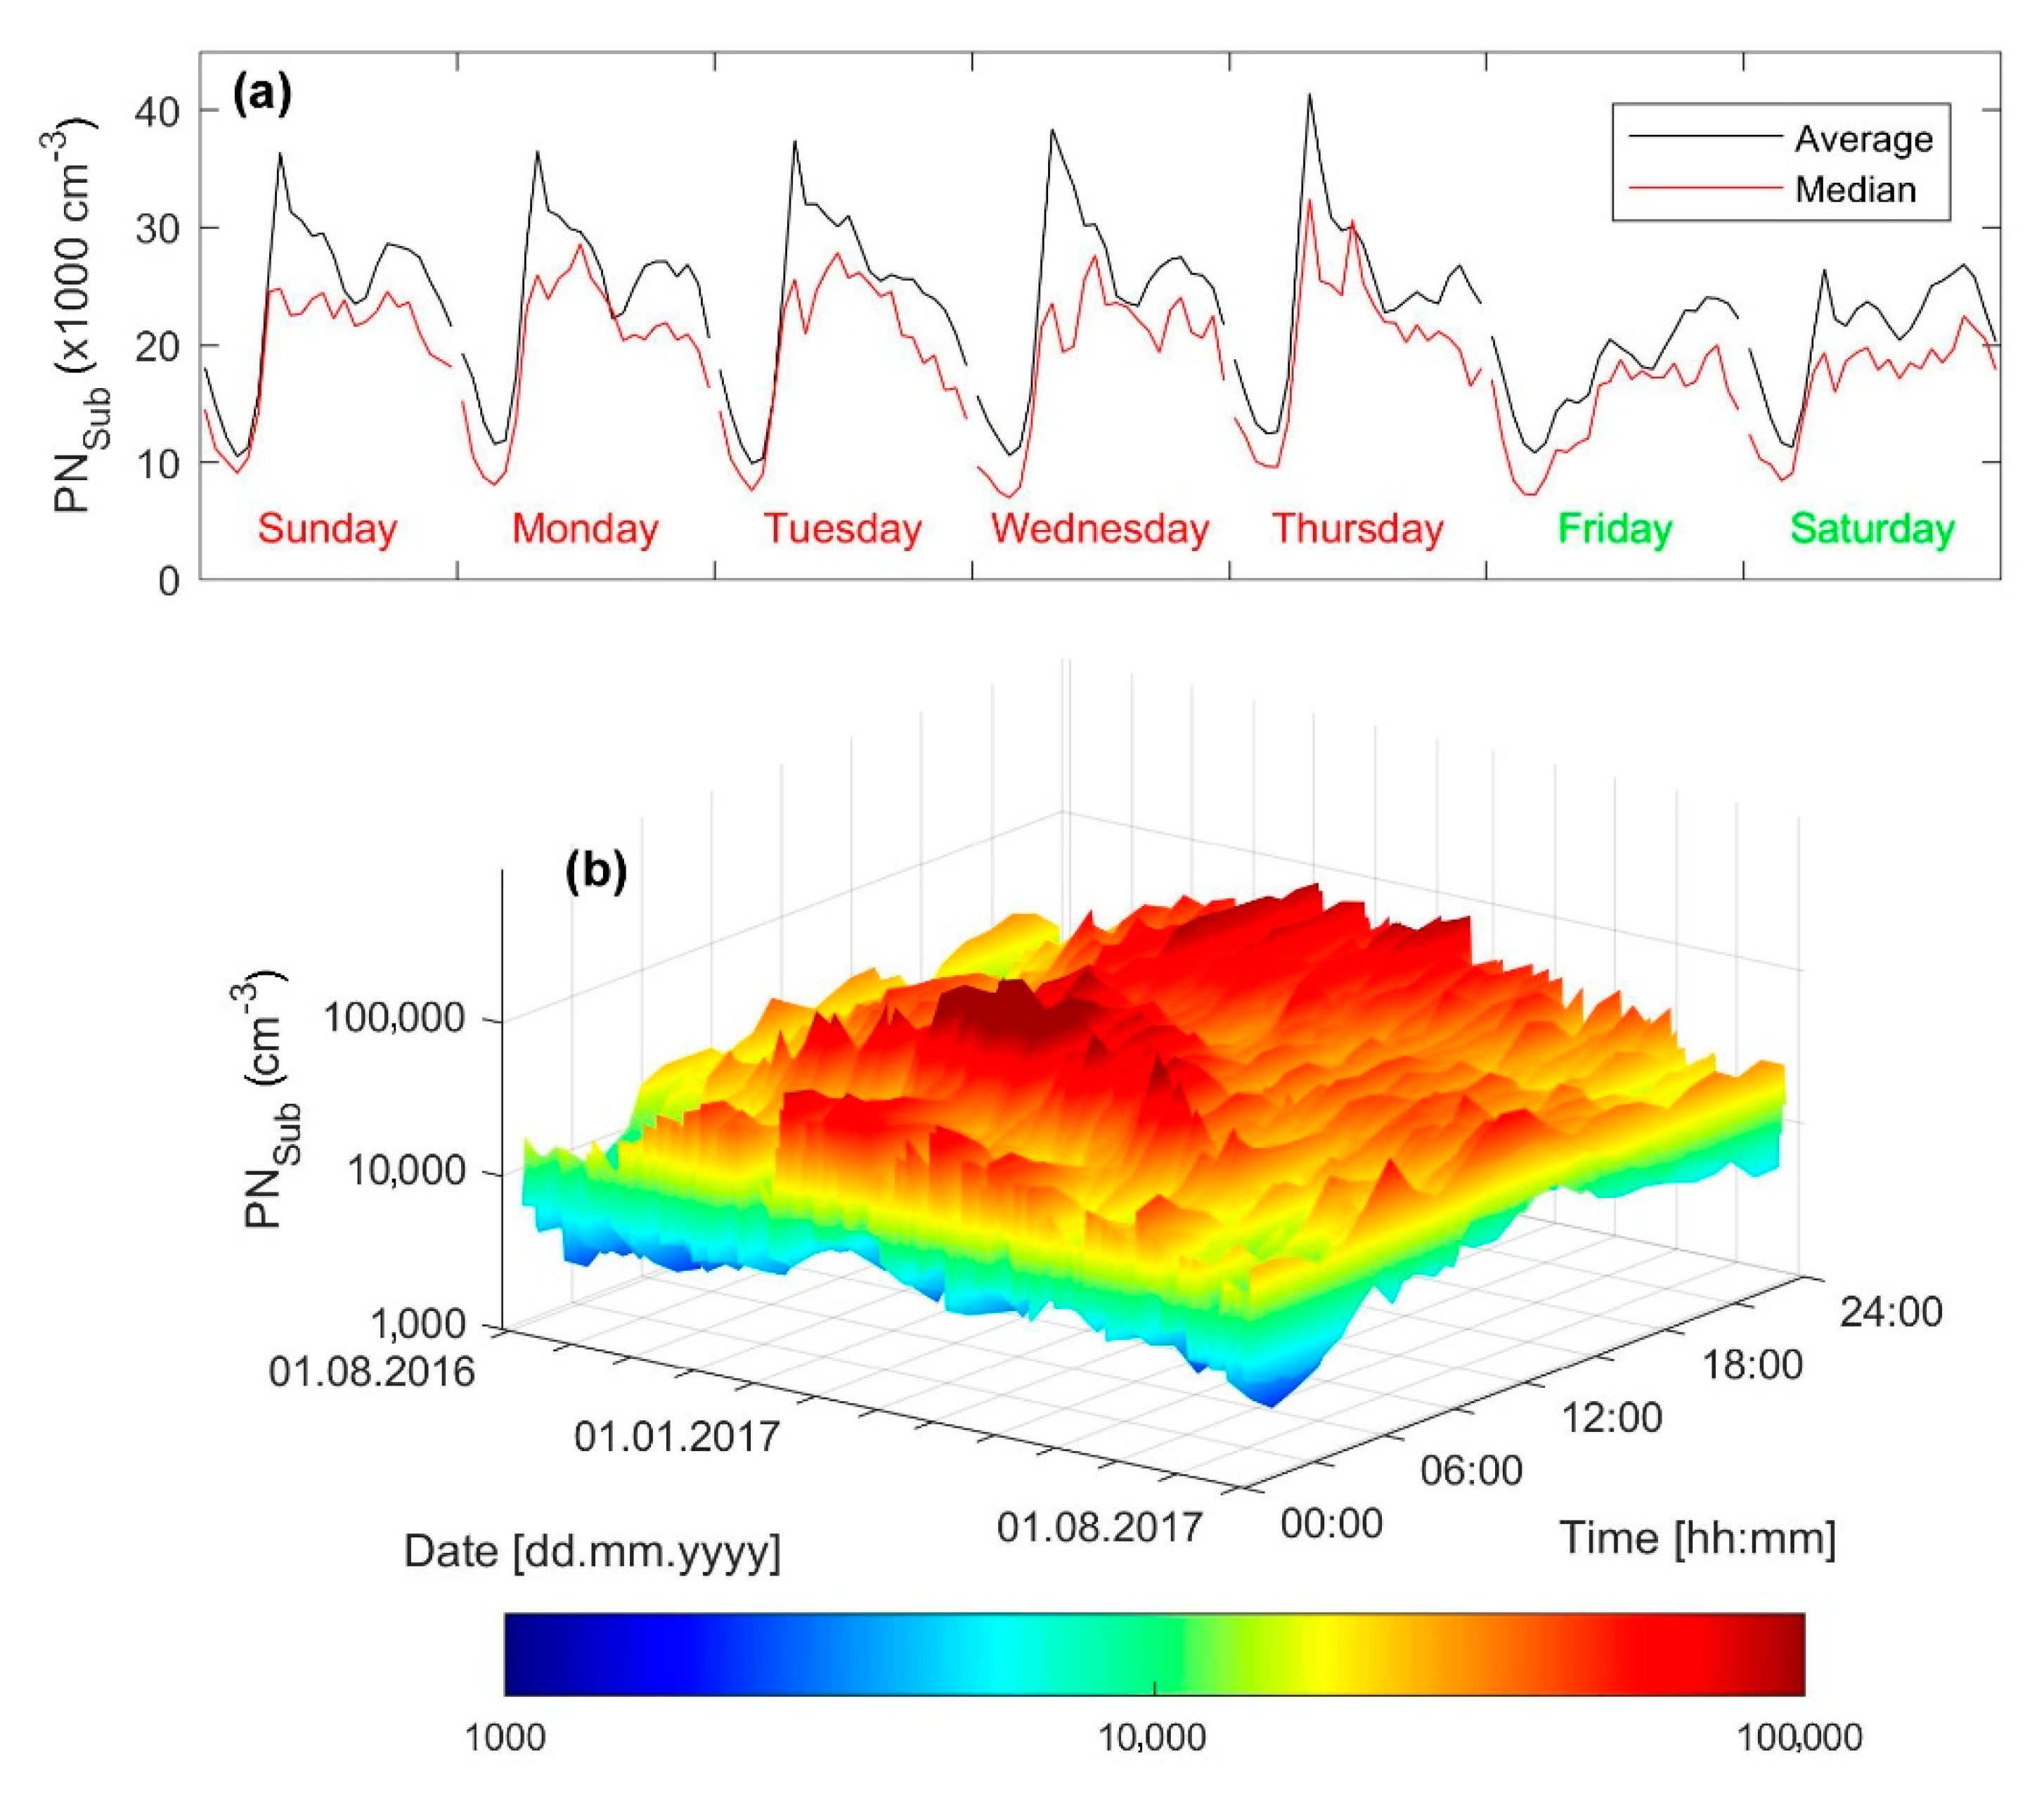
Looking closely at the hourly mean PNSub concentrations, we can clearly see a diurnal pattern that was more pronounced during the winter than during the summer (Figure 3). Basically, during the wintertime, the boundary layer is typically shallower and the aerosol emissions will be more concentrated in the lower atmosphere and their diurnal pattern becomes more pronounced. The main differences between the winter and summer diurnal patterns of the PNSub concentration were observed in the morning and late night, where the concentrations were high due to increased emissions from traffic during commuting hours. Similar to many other urban environments, the diurnal pattern observed in this study reflects the combustion emissions from traffic activity, which is more during the workdays [23,24]. These two peaks are relevant for the morning and afternoon traffic rush hours, which are similar to those noticed in most cities in the other countries [24,25,26,27].
Further analysis on the hourly mean PNSub concentration revealed a clear weekly cycle in the diurnal patterns with higher concentrations during the workdays (Sunday–Thursday) and lower concentrations during the weekend (Friday–Saturday); see Figure 3a. For example, during the weekends, the peak hourly mean PNSub concentration was below 2.7 × 104 cm−3 while during the workdays it was higher than 3.3 × 104 cm−3. On workdays, PNSub diurnal pattern was characterized by a high concentration peak (as high as 4.1 × 104 cm−3) during the morning traffic rush hours and another peak (as high as 2.9 × 104 cm−3) during the afternoon. Regardless of the weekday, the lowest PNSub was below 1.5 × 104 cm−3 (on average as low as 1 × 104 cm−3) and it was observed before the morning, when the traffic activity was at minimum in the city.
3.2. Concentrations of Different Particle Size-Fractions
The ultrafine particle number concentration (PNUFP, diameter < 0.1 µm) fraction was about 93% of PNSub concentration. The accumulation mode particle number concentration (PNACCU, diameter 0.1–1 µm) was about 7% of PNSub. Table S1 lists the monthly statistical values for the main particle size fractions. Typically, the urban/suburban number concentration of fine particles is dominated by ultrafine particles [22,24]. This fact has been confirmed in several studies, both experimentally and theoretically [24,25,26,27,28,29,30,31,32,33,34,35].
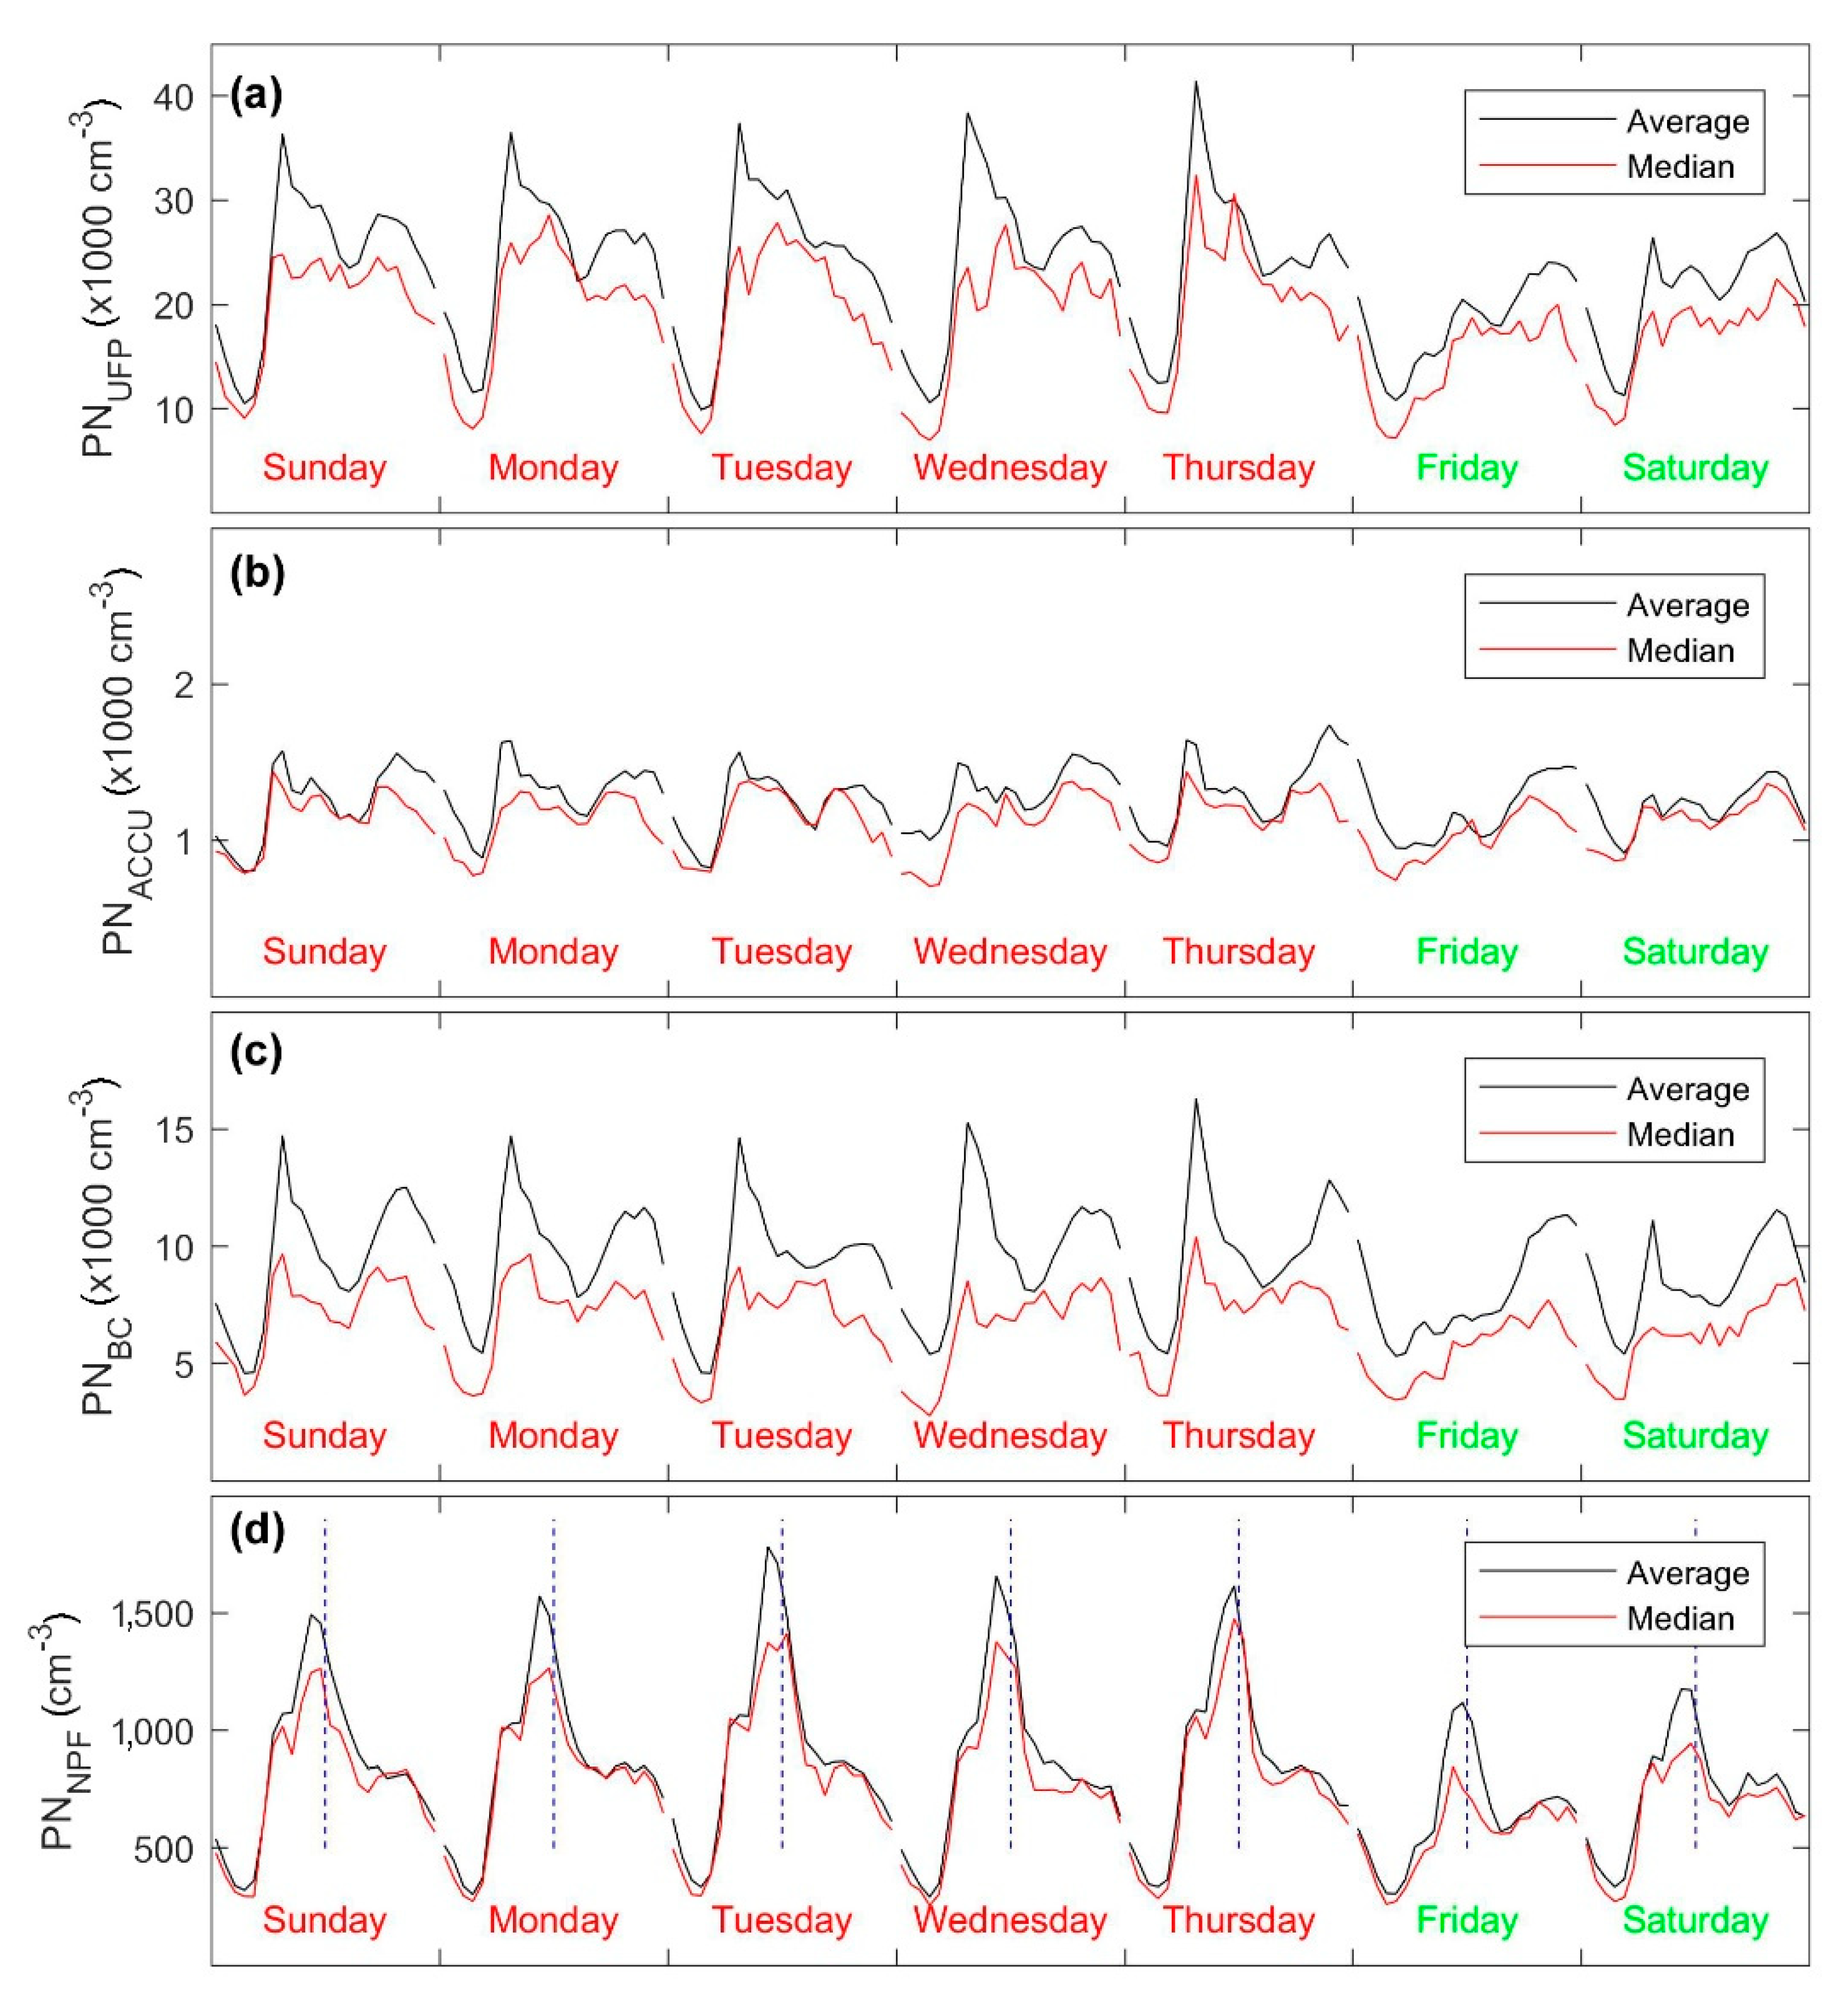
In general, the temporal variation of PNUFP concentration (Figure 2c, Figure 4a and Figure 5a) was very close to that of PNSub concentration; this is true for the seasonal variation, diurnal pattern, and the weekly cycle (Figure 2a and Figure 3a,b). As for the PNACCU concentrations, the weekly cycle also showed distinguished diurnal patterns (Figure 2d and Figure 4b). On workdays, the diurnal pattern was characterized by two main peaks, which had rather similar concentrations as high as 1.8 × 104 cm−3. During the weekends (Friday–Saturday) and Thursday, the PNACCU concentration was exceptionally high during the late evening, possibly due to increased traffic activities during leisure time in the city.
The coarse mode particle number (PNCoarse) concentration had a different seasonal pattern than that of PNSub (Figure 6). According to the monthly average, the PNCoarse was the highest during the autumn and spring (Table S1). For instance, the monthly PNCoarse was about 2.5 and 3.8 cm−3, respectively, in October and November. During March and April, the monthly PNCoarse was about 3.3 cm−3. As previously reported about this particle size fraction in Amman [19], it had a clear seasonal pattern linked to the sand and dust storms, which are often occurring in the spring season, and local dust resuspension, which are usually dominant in the autumn season. In general, the dust episodes lasted from a few hours to several days. Based on the daily average PNCoarse, it was noticed that dust episodes occurred with concentrations that often exceeded 2 cm−3 and concentrations as high as 14.5 cm−3. Based on the hourly average, the dust episodes increased PNCoarse to values as high as 46 cm−3. It is already well known that the black carbon has a well-defined size distribution in the submicron fraction. For instance, the distribution of black carbon in the ambient atmosphere, at road side, and from diesel emissions was found to span over the particle diameter range from around 30 nm up to a couple of hundred nanometers [36,37]. Here, we calculated the number concentrations within the particle diameter range 30–250 nm, which is an indicator of temporal variation of atmospheric black carbon (PNBC). As expected, this size fraction had temporal variations (Figure 4c) very close to those of the total number concentrations but with lower concentrations (Figure 3a). It is important to mention here that what we presented here as PNBC should not be understood as the concentration of black carbon; we only wanted to have an insight into the temporal variation of the black carbon fraction.
Except for Amman [17,18,19,20,21,38,39,40], particle number concentrations and size distributions has never been reported before in urban areas in the Middle East. The previous studies were mainly about some gaseous pollutants; PM mass concentrations, and chemical composition [41,42,43,44,45,46,47,48,49,50,51,52,53,54,55,56]. However, the submicron particle number concentrations in Amman are less than what was reported in megacities but still higher (sometimes comparable) than what was reported in Europe, US, and other parts in the world as will be shown in the next paragraph.
Comparison to observations in other urban locations is not straightforward. However, we can summarize the concentrations levels reported worldwide. Many studies reported number concentration in many urban and suburban environments in the EU, America, Asia, and Oceania [34,57,58,59,60,61,62,63,64,65,66,67,68,69,70,71,72,73]. The concentrations varied between cities, locations within the city, and time of observation reflecting the complex behavior of urban aerosols. The observed concentrations in this study (range 6.5 × 10³–7.7 × 104 cm−3) were comparable to other urban locations in the EU, the US, and Oceania where the reported concentrations were in the range 1 × 10³–6 × 104 cm−3 [34,57,58,59,67,68,69,70,71,72,73,74,75,76,77,78]. We should keep in in mind that concentrations on roads are expected to be significantly higher than what can be observed in the ambient conditions [60,61,62,63,64,65,66]. Megacities exhibit the highest concentrations of air pollution. Here, we recall the results reported for Indian, Chinese, and Colombian cities [79,80,81,82,83]. Apte et al. [80] reported mean UFP concentrations in New Delhi (India) of 2.8 × 105 cm−3, which was about eight times higher than that observed in ambient conditions in India. In Beijing and Xi’an (China), the concentrations are comparable to what can be observed in Delhi [81,82]. In Bogota (Colombia), Betancourt et al. [83] showed that the average fine particle number concentrations was about 2 × 105 cm−3.
Secondary particle formation, which is often referred to as new particle formation (NPF), is an important process affecting particle number concentrations in both remote and urban environments [6,7,8,84]. The secondary particles can have a role in haze formation and influence the urban boundary layer and heat island. The NPF process starts from oxidation of precursor vapors and their clustering in sub-3 nm size range [84], which is outside the size range of the instrumentation used in this study. Therefore, it was not possible to make a constructive conclusion about the characteristics of these secondary aerosols in Amman. However, the first particle channel (diameter 10–15 nm) in the SMPS can be used as an indicator for the concentrations during NPF events, here denoted as PNNPF.
The average diurnal pattern of PNNPF was characterized by high concentrations (0.7 × 10³–1.1 × 103 cm−3) during the daytime and a sharp peak around midday (Figure 4d). The lowest concentration of this particle size fraction was ~320 cm−3 and it was observed between midnight and morning; specifically, between 3 a.m. and 4 a.m.
The most interesting part of the diurnal pattern in this size fraction is the sharp peak around midday. This peak was observed on ~34% of the measurement days (in total 110 days out of 326 days of valid data) and its alternating occurrence can be seen in Figure 5d. The peak was often observed around 11 a.m. with a concentration in the range 1.5 × 10³–1.8 × 103 cm−3 on workdays and ~1.1 × 103 cm−3 on weekend days. The concentration at the edge of the size distribution started to increase around 8 a.m. and the increase was over around 1 p.m. New particle formation characterization requires deep analysis, which is beyond the scope of this study; therefore, we will not explain this phenomenon any further here.
3.3. Modal Structure of the Particle Number Size Distribution
For the purposes of investigating the temporal variation of the particle number concentrations, we focused on two periods representing cold (December–February) and warm (May–August) conditions separately (Figures S4 and S5). During the cold period, the weekly cycle of the diurnal pattern was very distinguished with high mean concentrations on workdays and low mean concentrations on weekends (Figure S4 and Figure 7a–f). On all weekdays, the diurnal pattern was characterized by two peaks: morning and afternoon. The afternoon peak (highest concentration was in the range 3 × 10⁴–3.5 × 104 cm−3) was rather similar on all weekdays; however, the first peak was higher on workdays than on weekend days. Furthermore, the first peak tended to have higher concentrations from Monday (~4.5 × 104 cm−3) through Thursday (~6.5 × 104 cm−3). During this cold period and on all weekdays, the mean particle number size distributions during daytime hours had their peak diameter below 40 nm whereas during the evening it was over 40 nm (Figure S6a,b).
During the warm period, the diurnal pattern was rather similar on all weekdays (Figure S5). The daytime mean total concentration (1 × 10⁴–2 × 104 cm−3) during this warm period was lower than that during the cold period (often higher than 3 × 104 cm−3). The differences are possibly explained by the ambient conditions such as enhanced wind speed, higher temperature, and higher boundary layer during the warm period. The secondary particle formation (i.e., NPF events) was very pronounced during the warm period. NPF events were observed almost every day and, consequently, they can be seen to dominate the mean particle number size distribution (Figure 7g–l). The newly formed aerosols were clearly observed with their distinguished nucleation mode with high concentrations before the noon (specifically between 9 a.m. and noon; Figure 7i,j). These newly formed aerosols displayed growth until 6 p.m., when their geometric mean diameter (GMD) reached ~40 nm.
Contrary to the case during the cold period, the mean particle number size distributions at different times of the day during the warm period had three well-separated submicron modes: nucleation, Aitken, and accumulation, in addition to a mode with small GMD that represented the early stage of NPF events (Figure S6c,d).
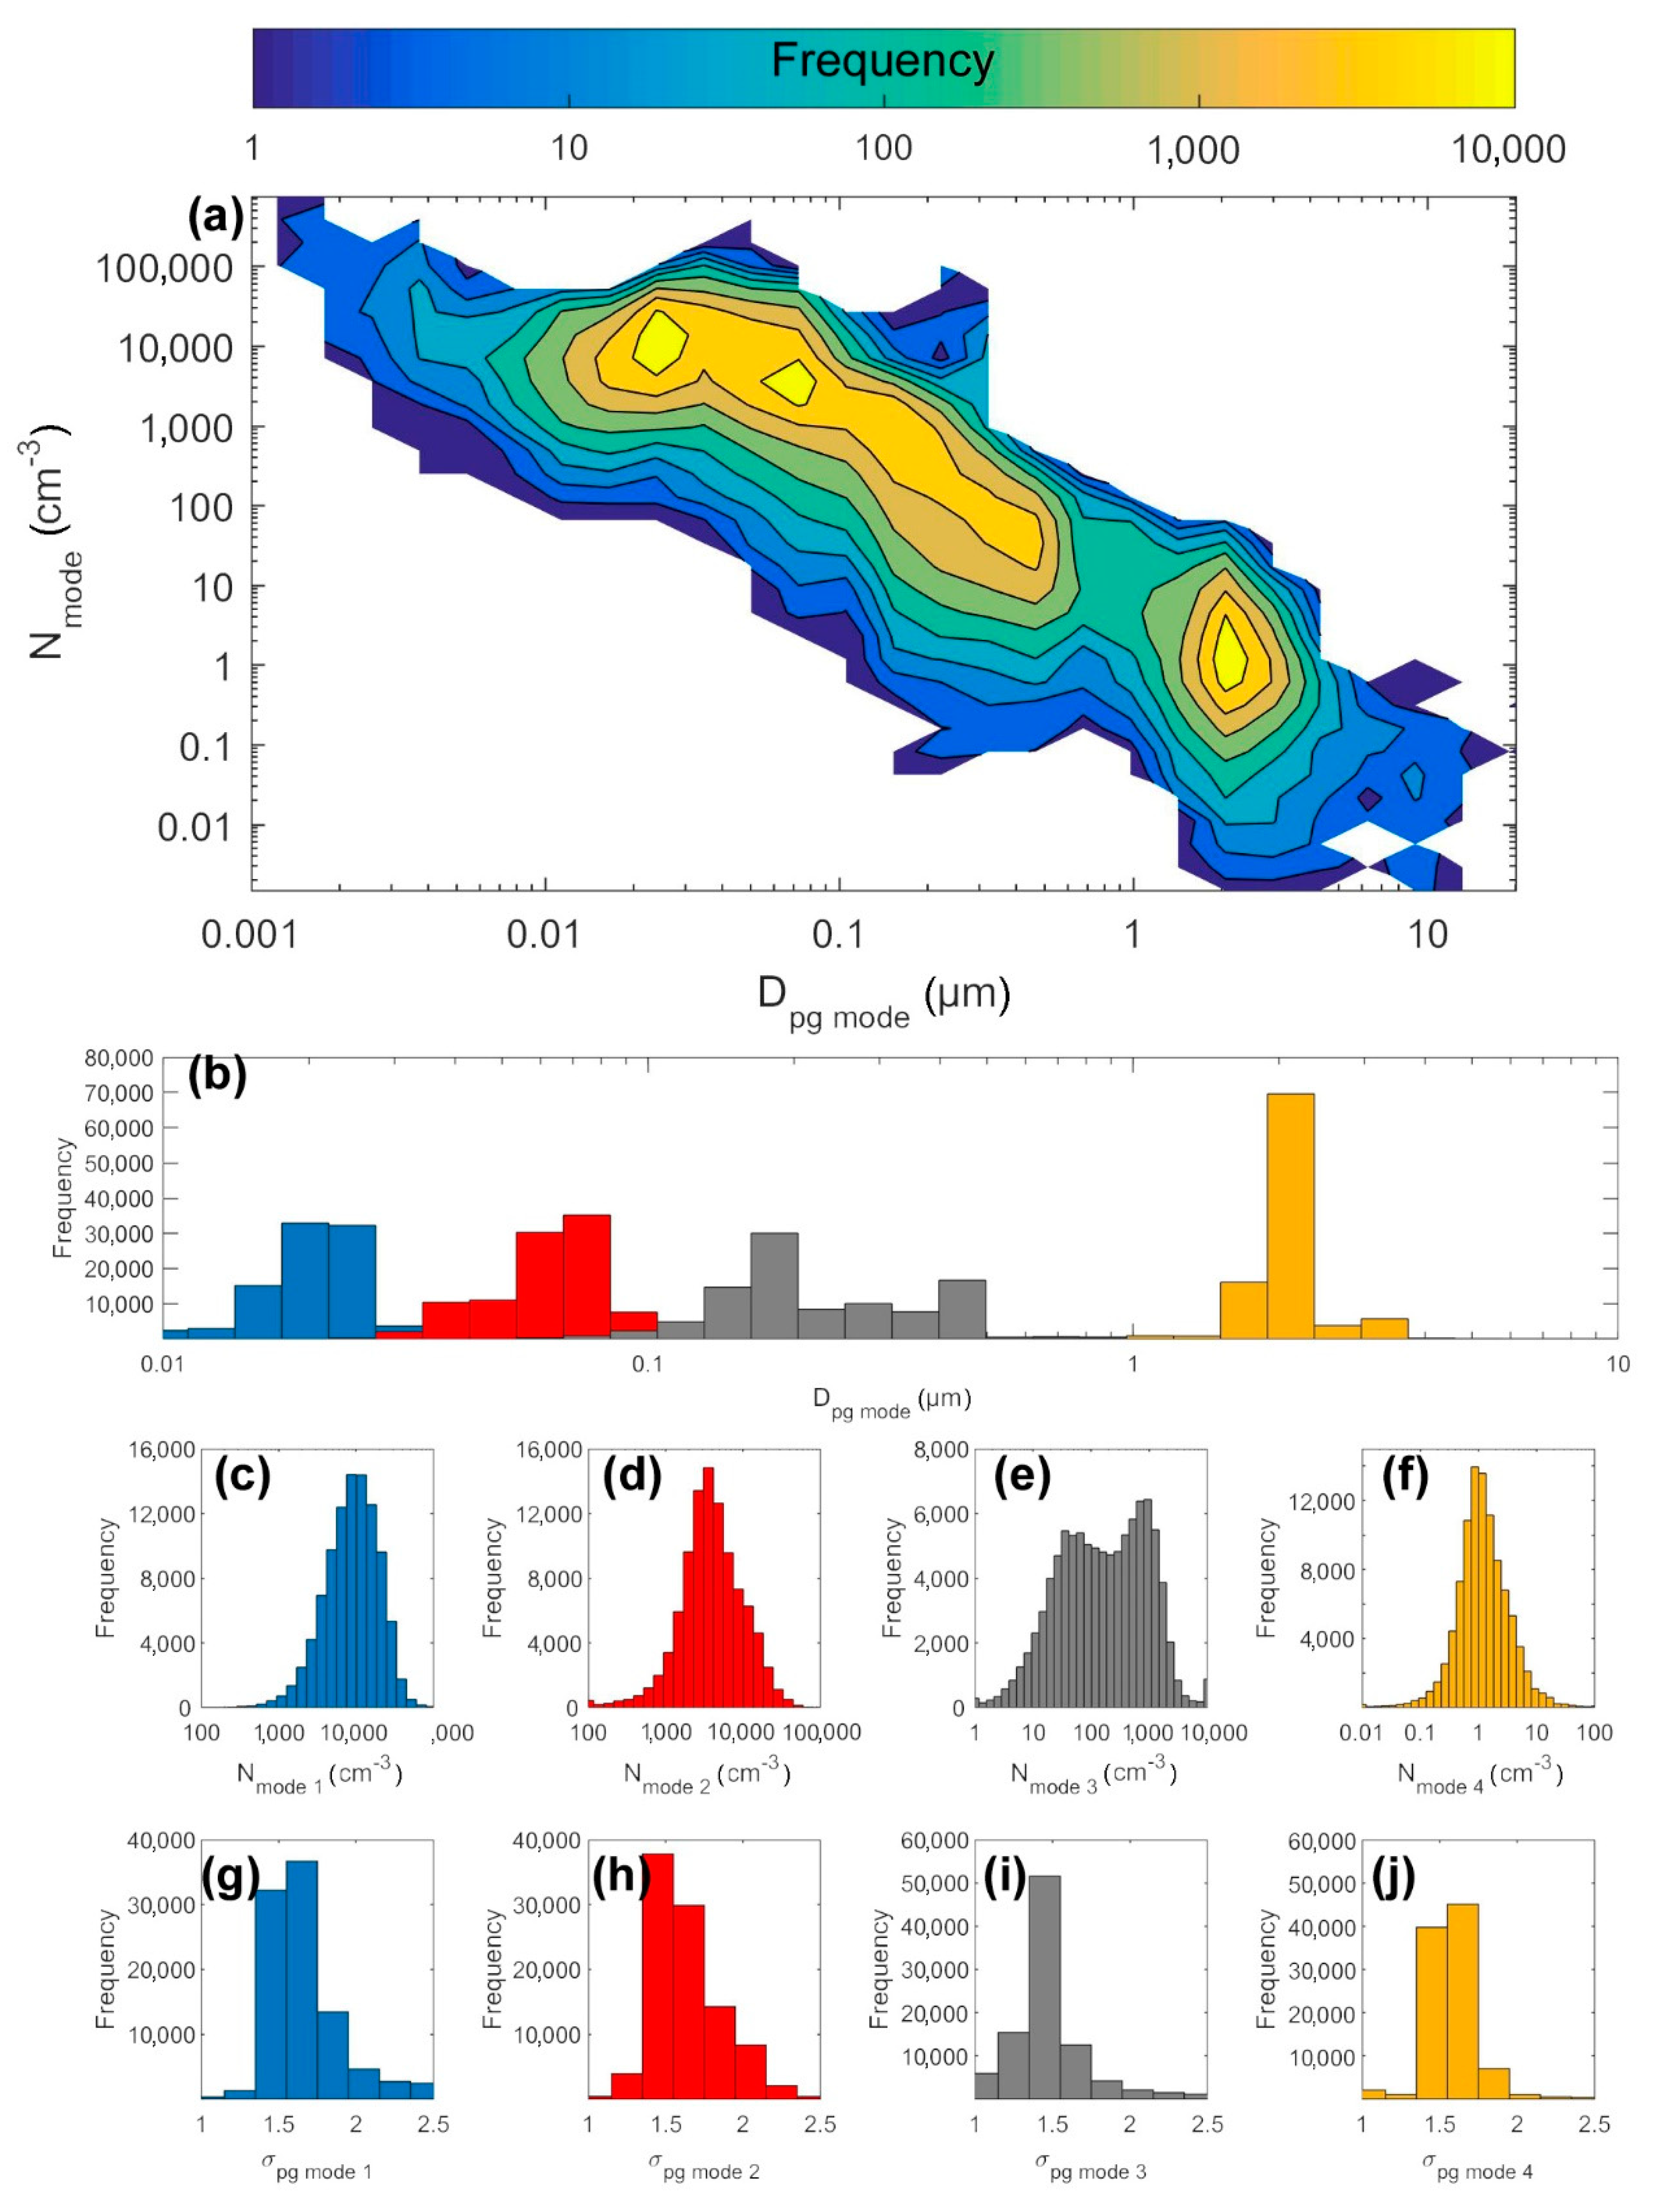
Further analysis of the particle number size distributions with respect to the lognormal fitting (i.e., modal structure) revealed that the mode geometric mean diameter (Dpg,i) was about 22 nm, 62 nm, 225 nm, and 2.23 µm for the nucleation mode, Aitken mode, accumulation mode, and coarse mode, respectively (Figure 8a,b). The corresponding geometric mean values of the mode number concentrations (Ni) were about 9.4 × 10³, 3.9 × 10³, 158, and 1.2 cm−3, respectively (Figure 8c–f). The mode number concentrations of the nucleation, Aitken, and coarse modes were lognormally distributed around their geometric mean values: 22 nm, 62 nm, and 2.3 µm; respectively. However, the accumulation mode number concentration had two distinguished modes with concentrations centered around 50 cm−3 (centered around Dpg = 390 nm) and 790 cm−3 (centered around Dpg = 165 nm); see also Figure 8a. As for the mode geometric variance (σpg,i), the geometric mean value was about 1.73, 1.67, 1.54, and 1.62, respectively for the nucleation mode, Aitken mode, accumulation mode, and coarse mode (Figure 8g–j). Interestingly, and as can be seen from Figure 8a, Dpg of the nucleation mode reached values close to 2 nm, which is well below the cut-off diameter of the SMPS (10 nm). That was basically due to the occurrence of NPF events when a part of the nucleation mode was below the cut-off diameter of the SMPS, which was 10 nm. Furthermore, the smaller the Dpg, the higher the Ni was for the nucleation mode when it occurred below 10 nm.
3.4. Effect of Local Weather Conditions
The meteorological conditions affected the aerosol concentrations in different ways. For example, the submicron particles were affected in a different way than coarse mode particles. Understanding the relationship between urban aerosol concentrations and local meteorological conditions makes it possible to develop predictive models for air pollution [85,86,87,88].
In general, the wind speed had a major influence on the particle number concentration (Figure 9). The PNSub had a decreasing trend with respect to the wind speed (Figure 9a). For instance, the mean PNSub was about 2.8 × 104 cm−3 at stagnant conditions and it reached below 1.2 × 104 cm−3 when the wind speed was above 20 km/h. This indicates that most of the submicron fraction originated from local sources such as combustion processes (e.g., traffic tailpipe emissions). However, during wind speed 10–15 km/h, the PNSub slightly increased to about 1.2 × 104 cm−3 and then decreased again with increasing wind speed.
The PNCoarse concentrations had a U-shaped (centered around 7.5 km/h at about 1.5 cm−3) with respect the wind speed (Figure 9b). Below 7.5 km/h, the PNCoarse concentrations were increasing (reaching about 2.1 cm−3 at stagnant conditions) with decreasing wind speed and above that wind speed the PNCoarse were increasing (reaching about 5.5 cm−3 at wind speed 20 km/h) with increasing wind speed. The left-hand side of the U-shape curve is related to local sources of dust not induced by the wind; i.e., road dust resuspension due to traffic activities. The right-hand side of the U-shape curve is related to local dust resuspension induced by the wind. Another reason for the increased PNCoarse concentration at high wind speed is the sand and dust storm (SDS) via long-range transport. The observed influence of wind speed on PNSub and PNCoarse concentrations in this study is consistent with previous observations in other urban environments [26,87,88,89,90,91,92,93,94,95].
The investigation of the effect of temperature on the aerosol concentrations is very complex as illustrated in Figure 9c,d. The mean PNSub had the highest concentrations (~3 × 104 cm−3) during cold conditions (T < 10 °C) and the lowest concentrations (~1.5 × 104 cm−3) during moderate temperature conditions (T in the range 15–25 °C). The mean PNSub concentrations was proportional to the temperature, when it increased from 25 to 40 °C. The PNCoarse concentrations were proportional to the temperature in the range −5–10 °C and it was rather constant (1–2 cm−3) when the temperature was higher than 10 °C. Our results seem to be in consistent with [96], who found that aerosol concentrations increased with relative humidity during the winter season and decreased with temperature. Additionally, Olivares et al. [26] reported that the increase in particle number concentration with decreasing temperature is different for different particle size, and they also showed a distinct correlation between number concentration and (temperature and relative humidity) with higher concentrations during periods with low temperatures or high relative humidity.
4. Conclusions
In this study we aimed at characterizing the aerosol particle number size distribution. We explored the temporal variability (diurnal, weekly, and seasonal) of the number concentrations in Amman, Jordan. Amman can be considered as an example for Middle Eastern urban conditions. Here we utilized a long-term measurement of particle number size distributions over a wide particle diameter range (0.01–10 µm), which was combined from a Nano-Scanning Mobility Particle Sizer (Nano SMPS) and an Optical Particle Sizer (OPS). We also investigated the modal structure of the aerosol population by using the multi-lognormal distribution function (DO-FIT).
The submicron particle number concentrations (PNSub) and the coarse mode particle number concentration (PNCoarse) had distinguished seasonal variations. Based on the monthly average, PNSub was higher in the winter (3.3 × 10⁴–3.7 × 104 cm−3, December–February) than in the summer and early autumn (1.2 × 10⁴–1.6 × 104 cm−3, June–September). The 24-h mean PNSub was in the range 6.5 × 10³–7.7 × 104 cm−3 and the hourly means was in the range 2.2 × 10³–2.1 × 105 cm−3. According to the monthly average, the PNCoarse was the highest during the autumn (3.8 cm−3, November) and spring (3.3 cm−3, April). The PNCoarse seasonal pattern is most likely linked to the sand and dust storms (often occurring in spring) and local dust resuspension (dominant autumn). It was clear within this study that there is a clear influence of new particle formation (NPF) on the submicron aerosols and Sand and Dust Storm (SDS) on coarse mode aerosols. However, these phenomena require further detailed analysis that will be made in upcoming studies.
The PNSub concentrations was characterized by a diurnal pattern, which was more pronounced during the winter than during the summer. The diurnal pattern was also different between workdays and weekends reflecting a clear weekly cycle: higher concentrations during the workdays (Sunday–Thursday; over 3.3 × 104 cm−3) and lower concentrations during the weekend (Friday–Saturday; below 2.7 × 104 cm−3). On workdays, PNSub diurnal pattern was characterized with a high concentration peak (as high as 4.1 × 104 cm−3) during the morning traffic rush hours and another peak (as high as 2.9 × 104 cm−3) during the afternoon. In general, the seasonal, weekly, and diurnal variation of PNSub is clearly depicting the traffic activities suggesting that traffic emissions are a major contributor to submicron aerosols. The ultrafine particle number concentration (PNUFP, diameter < 0.1 µm) fraction was about 93% of PNSub concentration whereas that of the accumulation mode particle number concentration (PNACCU, diameter 0.1–1 µm) was about 7% of PNSub. The temporal variation of PNUFP and PNACCU concentration was very close to that of PNSub concentration.
We investigated the modal structure of the measured aerosols (0.01–10 mm). During cold conditions (December–February), the mean particle number size distributions during daytime hours had peak diameters smaller than 40 nm whereas during the evening it was larger than 40 nm. During warm conditions (May–August), the mean particle number size distributions at different times of the day had three well-separated submicron modes: nucleation, Aitken, and accumulation in addition to a mode with small GMD that represented the early stage of NPF events. The mode geometric mean diameter (Dpg,i) was about 22 nm, 62 nm, 225 nm, and 2.23 µm for the nucleation mode, Aitken mode, accumulation mode, and coarse mode, respectively. The corresponding mode number concentrations (Ni) were about 9.4 × 10³, 3.9 × 10³, 158, and 1.2 cm−3, respectively. In fact, the accumulation mode number concentration had two distinguished groups with concentrations centered around 50 cm−3 (centered around Dpg = 165 nm) and 790 cm−3 (centered around Dpg = 390 nm). Interestingly, Dpg of the nucleation mode reached values close to 2 nm, which is well below the cut-off diameter of the SMPS (10 nm) but still can be depicted by the DO-FIT algorithm of the multi-lognormal fitting. That was basically due to the occurrence of NPF events.
The local meteorological conditions affected the aerosol concentrations in different ways. The wind speed and temperature had a major impact on the aerosol concentrations. During stagnant conditions, the mean PNSub concentration was ~2.8 × 104 cm−3 and PNCoarse concentration was ~2.1 cm−3. In general, the PNCoarse concentration had a U-shape with respect to wind speed whereas the PNSub concentrations decreased with wind speed. The mean PNSub had the highest concentrations (~3 × 104 cm−3) during cold conditions and the lowest concentrations (~1.5 × 104 cm−3) during moderate temperature conditions. The PNCoarse concentrations were proportional to the temperature in the range −5–10 °C and they were rather constant (1–2 cm−3) when the temperature was higher than 10 °C.
Supplementary Materials
The following are available online at https://www.mdpi.com/2073-4433/10/11/710/s1, Figure S1: (a) A Map of Jordan showing the geographical location of Amman. (b) A Map of Amman showing the campus of the University of Jordan (shaded area) and (c) a detailed map of the campus of the University of Jordan, showing the sampling location (shaded area) in the middle of the campus., Figure S2: Experimental penetration efficiency through the sampling lines (tubing and diffusion drier), Figure S3: Regression between the number concentrations measured with the CPC versus (a) number concentration measured with the SMPS (Dp 0.01–0.42 µm) and (b) number concentration derived from the combined particle number size distribution measurements (SMPS and OPS, Dp 0.01–1 µm), Figure S4: Weekly cycle and the diurnal pattern during a cold period (i.e., winter: December–February): (a) mean particle number size distribution spectra and (b–c) concentrations of different particle size fractions. The color bar represents dN/dlog (Dp) (cm−3), Figure S5: Weekly cycle and the diurnal pattern during a cold period (i.e., summer: May–August): (a) mean particle number size distribution spectra and (b–c) concentrations of different particle size fractions. The color bar represents dN/dlog (Dp) (cm−3), Figure S6: Mean particle number size distributions during (a,b) cold period (i.e., winter: December–February) and (c,d) warm period (i.e., summer: May–August). The mean distributions are shown for different times of the day on workdays (a,c) and weekend days (b,d), Table S1: Monthly statistics for the main particle size fractions (concentrations in units of cm−3).
Author Contributions
Conceptualization, T.H.; methodology, T.H.; validation, T.H.; formal analysis, T.H., S.H. and L.D.; investigation, T.H.; resources, T.H.; data curation, T.H.; writing—original draft preparation, T.H.; writing—review and editing, T.H., L.D., S.H., T.P. and M.K.; visualization, T.H. and L.D.; supervision, T.H.; project administration, T.H.; funding acquisition, T.H., T.P. and M.K.
Funding
This research was funded by the Scientific Research Support Fund (SRF, project number BAS-1-2-2015) at the Jordanian Ministry of Higher Education and the Deanship of Academic Research (DAR, project number 1516) at the University of Jordan. This research was part of a close collaboration between the University of Jordan and the Institute for Atmospheric and Earth System Research (INAR / Physics, University of Helsinki) via ERC advanced grant No. 742206, the European Union’s Horizon 2020 research and innovation program under grant agreement No. 654109, the Academy of Finland Center of Excellence (project No. 272041), ERA-PLANET (www.era-planet.eu), trans-national project SMURBS (www.smurbs.eu, grant agreement n. 689443 funded under the EU Horizon 2020 Framework Programme and Academy of Finland via the Center of Excellence in Atmospheric sciences and NanoBioMass (project number 1307537).
Acknowledgments
This manuscript was written and completed during the sabbatical leave of the first author (Tareq Hussein) that was spent at the University of Helsinki and supported by the University of Jordan during 2019. Open access funding provided by University of Helsinki.
Conflicts of Interest
The authors declare no conflict of interest.
References
- Lelieveld, J.; Evans, J.S.; Fnais, M.; Giannadaki, D.; Pozzer, A. The contribution of outdoor air pollution sources to premature mortality on a global scale. Nature 2015, 525, 367–371. [Google Scholar] [CrossRef] [PubMed]
- IPCC. Climate Change 2013: The Physical Science Basis. Contribution of Working Group I to the Fifth Assessment Report of the Intergovernmental Panel on Climate Change; Cambridge University Press: Cambridge, MA, USA, 2013.
- Oberdörster, G.; Sharp, Z.; Atudorei, V.; Elder, A.; Gelein, R.; Kreyling, W.; Cox, C. Translocation of inhaled ultrafine particles to the brain. Inhal. Toxicol. 2004, 16, 437–445. [Google Scholar] [CrossRef] [PubMed]
- Kerminen, V.M.; Paramonov, M.; Anttila, T.; Riipinen, I.; Fountoukis, C.; Korhonen, H.; Asmi, E.; Laakso, L.; Lihavainen, H.; Swietlicki, E.; et al. Cloud condensation nuclei production associated with atmospheric nucleation: A synthesis based on existing literature and new results. Atmos. Chem. Phys. 2012, 12, 12037–12059. [Google Scholar] [CrossRef]
- Merikanto, J.; Spracklen, D.; Mann, G.; Pickering, S.; Carslaw, K. Impact of nucleation on global CCN. Atmos. Chem. Phys. 2009, 9, 8601–8616. [Google Scholar] [CrossRef]
- Kulmala, M.; Vehkamäki, H.; Petäjä, T.; Dal Maso, M.; Lauri, A.; Kerminen, V.-M.; Birmili, W.; McMurry, P.H. Formation and growth rates of ultrafine atmospheric particles: A review of observations. J. Aerosol Sci. 2004, 35, 143–176. [Google Scholar] [CrossRef]
- Kerminen, V.-M.; Chen, X.; Vakkari, V.; Petäjä, T.; Kulmala, M.; Bianchi, F. Atmospheric new particle formation and growth: Review of field observations. Environ. Res. Lett. 2018, 13, 103003. [Google Scholar] [CrossRef]
- Chu, B.; Kerminen, V.M.; Bianchi, F.; Yan, C.; Petäjä, T.; Kulmala, M. Atmospheric new particle formation in China. Atmos. Chem. Phys. 2019, 19, 115–138. [Google Scholar] [CrossRef]
- Rönkkö, T.; Kuuluvainen, H.; Karjalainen, P.; Keskinen, J.; Hillamo, R.; Niemi, J.V.; Pirjola, L.; Timonen, H.J.; Saarikoski, S.; Saukko, E.; et al. Traffic is a major source of atmospheric nanocluster aerosol. Proc. Natl. Acad. Sci. USA 2017, 114, 7549–7554. [Google Scholar] [CrossRef]
- Dall’Osto, M.; Harrison, R.M. Urban organic aerosols measured by single particle mass spectrometry in the megacity of London. Atmos. Chem. Phys. 2012, 12, 4127–4142. [Google Scholar] [CrossRef]
- Pikridas, M.; Riipinen, I.; Hildebrandt, L.; Kostenidou, E.; Manninen, H.; Mihalopoulos, N.; Kalivitis, N.; Burkhart, J.F.; Stohl, A.; Kulmala, M.; et al. New particle formation at a remote site in the eastern Mediterranean. J. Geophys. Res. Atmos. 2012, 117. [Google Scholar] [CrossRef]
- Ždímal, V.; Smolík, J.; Eleftheriadis, K.; Wagner, Z.; Housiadas, C.; Mihalopoulos, N.; Mikuška, P.; Večeřa, Z.; Kopanakis, I.; Lazaridis, M. Dynamics of atmospheric aerosol number size distributions in the eastern Mediterranean during the “SUB-AERO” Project. Water Air Soil Pollut. 2011, 214, 133–146. [Google Scholar] [CrossRef]
- Reche, C.; Viana, M.; Pandolfi, M.; Alastuey, A.; Moreno, T.; Amato, F.; Ripoll, A.; Querol, X. Urban NH3 levels and sources in a Mediterranean environment. Atmos. Environ. 2012, 57, 153–164. [Google Scholar] [CrossRef]
- Kopanakis, I.; Chatoutsidou, S.; Torseth, K.; Glytsos, T.; Lazaridis, M. Particle number size distribution in the eastern Mediterranean: Formation and growth rates of ultrafine airborne atmospheric particles. Atmos. Environ. 2013, 77, 790–802. [Google Scholar] [CrossRef]
- Lihavainen, H.; Alghamdi, M.A.; Hyvärinen, A.-P.; Hussein, T.; Aaltonen, V.; Abdelmaksoud, A.S.; Al-Jeelani, H.; Almazroui, M.; Almehmadi, F.M.; Al Zawad, F.M.; et al. Aerosols Physical properties at Hada Al Sham, Western Saudi Arabia. Atmos. Environ. 2016, 135, 109–117. [Google Scholar] [CrossRef]
- Hakala, S.; Alghamdi, M.A.; Paasonen, P.; Vakkari, V.; Khoder, M.; Neitola, K.; Dada, L.; Abdelmaksoud, A.S.; Al-Jeelani, H.; Shabbaj, I.I.; et al. New particle formation, growth and apparent shrinkage at a rural background site in western Saudi Arabia. Atmos. Chem. Phys. 2019, 19, 10537–10555. [Google Scholar] [CrossRef]
- Hussein, T.; Boor, B.E.; dos Santos, V.N.; Kangasluoma, J.; Petäjä, T.; Lihavainen, H. Mobile Aerosol Measurement in the Eastern Mediterranean—A Utilization of Portable Instruments. Aerosol Air Qual. Res. 2017, 17, 1875–1886. [Google Scholar] [CrossRef]
- Hussein, T.; Sogacheva, L.; Petäjä, T. Accumulation and Coarse Modes Particle Concentrations during Dew Formation and Precipitation. Aerosol Air Qual. Res. 2018, 18, 2929–2938. [Google Scholar] [CrossRef]
- Hussein, T.; Juwhari, H.; Al Kuisi, M.; Alkattan, H.; Lahlouh, B.; Al-Hunaiti, A. Accumulation and Coarse Modes Aerosols Concentrations and Carbonaceous Contents in the Urban Background Atmosphere in Amman—Jordan. Arab. J. Geosci. 2018, 11, 617. [Google Scholar] [CrossRef]
- Hussein, T.; Saleh, S.S.A.; dos Santos, V.N.; Abdullah, H.; Boor, B.E. Black Carbon and Particulate Matter Concentrations in Eastern Mediterranean Urban Conditions—An Assessment Based on Integrated Stationary and Mobile Observations. Atmosphere 2019, 10, 323. [Google Scholar] [CrossRef]
- Hussein, T.; Betar, A. Size-Fractionated Number and Mass Concentrations in the Urban Background Atmosphere during Spring 2014 in Amman—Jordan. Jordan J. Phys. 2017, 10, 51–60. [Google Scholar]
- Hussein, T.; Dal Maso, M.; Petäjä, T.; Koponen, I.K.; Paatero, P.; Aalto, P.P.; Hämeri, K.; Kulmala, M. Evaluation of an automatic algorithm for fitting the particle number size distributions. Boreal Environ. Res. 2005, 10, 337–355. [Google Scholar]
- Hussein, T.; Hämeri, K.; Kulmala, M. Long-term indoor-outdoor aerosol measurement in Helsinki, Finland. Boreal Environ Res. 2002, 7, 141–150. [Google Scholar]
- Hussein, T.; Puustinen, A.; Aalto, P.P.; Mäkelä, J.M.; Hämeri, K.; Kulmala, M. Urban aerosol number size distributions. Atoms. Chem. Phys. 2004, 4, 391–411. [Google Scholar] [CrossRef]
- Wehner, B.; Wiedensohler, A. Long term measurements of submicrometer urban aerosols: Statistical analysis for correlations with meteorological conditions and trace Gases. Atoms. Chem. Phys. 2003, 3, 867–879. [Google Scholar] [CrossRef]
- Olivares, G.; Johansson, C.; Ström, J.; Hansson, H.C. The role of ambient temperature of particle number concentrations in a street canyon. Atmos. Environ. 2007, 41, 2145–2166. [Google Scholar] [CrossRef]
- Wehner, B.; Wiedensohler, A.; Tuch, T.M.; Wu, Z.J.; Hu, M.; Slanina, J.; Kiang, C.S. Variability of the Aerosol Number Size Distribution in Beijing, China: New Particle Formation, Dust Storms, and High continental Background. Geophys. Res. 2004, 31. [Google Scholar] [CrossRef]
- Wehner, B.; Wiedensohler, A.; Heintzenberg, J. Submicrometer aerosol size distributions and mass concentration of the Millenium fireworks 2000 in Leipzig, Germany. J. Aerosol Sci. 2000, 31, 1489–1493. [Google Scholar] [CrossRef]
- Jung, C.H.; Kim, Y.P.; Lee, K.W. Simulation of the influence of coarse mode particles on the properties of fine mode particles. Aerosol Sci. Technol. 2002, 33, 1201–1216. [Google Scholar] [CrossRef]
- Mönkkönen, P.; Koponen, I.K.; Lehtinen, K.E.J.; Uma, R.; Srinivasan, D.; Hämeri, K.; Kulmala, M. Technical note: Death of nucleation and Aitken mode particles: Observations at extreme atmospheric conditions and their theoretical explanation. J. Aerosol Sci. 2004, 35, 781–787. [Google Scholar] [CrossRef]
- Cheng, T.; Lu, D.; Chen, H.; Xu, Y. Physical characteristics of dust aerosol over Hunshan Dake sandland in Northern China. Atmos. Environ. 2005, 39, 1237–1243. [Google Scholar] [CrossRef]
- Mejıa, J.F.; Morawska, L.; Mengersen, K. Spatial variation in particle number size distributions in a large metropolitan area. Atmos. Chem. Phys. 2008, 8, 1127–1138. [Google Scholar] [CrossRef]
- Wu, Z.; Hu, M.; Lin, P.; Liu, S.; Wehner, B.; Widensohler, A. Particle number size distribution in the urban atmosphere of Beijing, China. Atmos. Environ. 2008, 42, 7967–7980. [Google Scholar] [CrossRef]
- Birmili, W.; Alaviippola, B.; Hinneburg, D.; Knoth, O.; Touch, T.; Borken-Kleefeld, J.; Schacht, A. Dispersion of traffic-related exhaust particles near the Berlin urban motorway—Estimation of fleet emission factors. Atmos. Chem. Phys. 2009, 9, 2355–2374. [Google Scholar] [CrossRef]
- Oliveira, C.; Alves, C.; Pio, C.A. Aerosol particle size distributions at a traffic exposed site and an urban background location in Oporto, Portugal. Quim. Nova 2009, 32, 928–933. [Google Scholar] [CrossRef]
- Ning, Z.; Chan, K.L.; Wong, K.C.; Westerdahl, D.; Močnik, G.; Zhou, J.H.; Cheung, C.S. Black carbon mass size distributions of diesel exhaust and urban aerosols measured using differential mobility analyzer in tandem with Aethalometer. Atmos. Environ. 2013, 80, 31–40. [Google Scholar] [CrossRef]
- Wu, Y.; Wang, X.; Tao, J.; Huang, R.; Tian, P.; Cao, J.; Zhang, L.; Ho, K.-F.; Han, Z.; Zhang, R. Size distribution and source of black carbon aerosol in urban Beijing during winter haze episodes. Atmos. Chem. Phys. 2017, 17, 7965–7975. [Google Scholar] [CrossRef] [Green Version]
- Hussein, T.; Abu Al-Ruz, R.; Petäjä, T.; Junninen, H.; Arafah, D.-E.; Hämeri, K.; Kulmala, M. Local air pollution versus short–range transported dust episodes: A comparative study for submicron particle number concentration. Aerosol Air Qual. Res. 2011, 11, 109–119. [Google Scholar] [CrossRef] [Green Version]
- Hussein, T.; Halayka, M.; Abu Al-Ruz, R.; Abdullah, H.; Mølgaard, B.; Petäjä, T. Fine Particle Number Concentrations in Amman and Zarqa during Spring 2014. Jordan J. Phys. 2016, 9, 31–46. [Google Scholar]
- Saleh, S.S.A.; Shilbayeh, Z.; Alkattan, H.; Al-Refie, M.R.; Jaghbeir, O.; Hussein, T. Temporal Variations of Submicron Particle Number Concentrations at an Urban Background Site in Amman—Jordan. Jordan J. Earth Environ. Sci. 2019, 10, 37–44. [Google Scholar]
- Abi-Esber, L.; El-Fadel, M. Indoor to outdoor air quality associations with self pollution implications inside passenger car cabins. Atoms. Environ. 2013, 81, 450–463. [Google Scholar] [CrossRef]
- Alam, K.; Trautmann, T.; Blaschke, T.; Subhan, F. Changes in aerosol optical properties due to dust storms in the Middle East and Southwest Asia. Remote Sens. Environ. 2014, 143, 216–227. [Google Scholar] [CrossRef]
- Roumie, M.; Chiari, M.; Srour, A.; Sa’adeh, H.; Reslan, A.; Sultan, M.; Ahmad, M.; Calzolai, G.; Nava, S.; Zubaidi, T.; et al. Evaluation and mapping of PM2.5 atmospheric aerosols in Arasia region using PIXE and gravimetric measurements. Nucl. Inst. Meth. Phys. Res. B 2016, 371, 381–386. [Google Scholar] [CrossRef]
- Hussein, T.; Alghamdi, M.A.; Khoder, M.; AbdelMaksoud, A.S.; Al-Jeelani, H.; Goknil, M.K.; Shabbaj, I.I.; Almehmadi, F.M.; Hyvärinen, A.; Lihavainen, H.; et al. Particulate matter and number concentrations of particles larger than 0.25 µm in the urban atmosphere of Jeddah, Saudi Arabia. Aerosol Air Qual. Res. 2014, 14, 1383–1391. [Google Scholar] [CrossRef] [Green Version]
- Alghamdi, M.A.; Khoder, M.; Abdelmaksoud, A.S.; Harrison, R.M.; Hussein, T.; Lihavainen, H.; Al-Jeelani, H.; Goknil, M.H.; Shabbaj, I.I.; Almehmadi, F.M.; et al. Seasonal and diurnal variations of BTEX and their potential for ozone formation in the urban background atmosphere of the coastal city Jeddah, Saudi Arabia. Air Qual. Atmos. Health 2014, 7, 467–480. [Google Scholar] [CrossRef]
- Alghamdi, M.A.; Khoder, M.; Harrison, R.M.; Hyvärinen, A.-P.; Hussein, T.; Al-Jeelani, H.; Abdelmaksoud, A.S.; Goknil, M.H.; Shabbaj, I.I.; Almehmadi, F.M.; et al. Temporal Variations of O3 and NOx in the Urban Background Atmosphere of the Coastal City Jeddah, Saudi Arabia. Atmos. Environ. 2014, 94, 205–214. [Google Scholar] [CrossRef] [Green Version]
- Boman, J.; Shaltout, A.A.; Abozied, A.M.; Hassan, S.K. On the elemental composition of PM2.5 in central Cairo, Egypt. X-ray Spectrom. 2013, 42, 276–283. [Google Scholar] [CrossRef]
- Basha, G.; Phanikumar, D.V.; Kumar, K.N.; Ouarda, T.B.M.J.; Marpu, P.R. Investigation of aerosol optical, physical, and radiative characteristics of a severe dust storm observed over UAE. Remote Sen. Environ. 2015, 169, 404. [Google Scholar] [CrossRef]
- Engelbrecht, J.P.; Jayanty, R.K.M. Assessing sources of airborne mineral dust and other aerosols, in Iraq. Aeol. Res. 2013, 9, 153–160. [Google Scholar] [CrossRef]
- Engelbrecht, J.P.; McDonald, E.V.; Gillies, J.A.; Jayanty, R.K.M.; Casuccio, G.; Gertler, A.W. Characterizing Mineral Dusts and Other Aerosols from the Middle East—Part 1: Ambient Sampling. Inhal. Toxicol. 2009, 21, 297–326. [Google Scholar] [CrossRef]
- Engelbrecht, J.P.; McDonald, E.V.; Gillies, J.A.; Jayanty, R.K.M.; Casuccio, G.; Gertler, A.W. Characterizing Mineral Dusts and Other Aerosols from the Middle East—Part 2: Grab Samples and Re-Suspensions. Inhal. Toxicol. 2009, 21, 327–336. [Google Scholar] [CrossRef]
- Habeebullah, T.M. An Analysis of Air Pollution in Makkah—A View Point of Source Identification. Environ. Asia 2013, 2, 11–17. [Google Scholar]
- Moustafa, M.; Mohamed, A.; Ahmed, A.-R.; Nazmy, H. Mass size distributions of elemental aerosols in industrial area. J. Adv. Res. 2015, 6, 827–832. [Google Scholar] [CrossRef] [PubMed] [Green Version]
- Notaro, M.; Yu, Y.; Kalashnikova, O.V. Regime shift in Arabian dust activity, triggered by persistent Fertile Crescent drought. J. Geophys. Res. Atmos. 2015, 120, 10229–10249. [Google Scholar] [CrossRef]
- Waked, A.; Afif, C.; Brioude, J.; Formenti, P.; Chevaillier, S.; El Haddad, I.; Doussin, J.-F.; Borbon, A.; Seigneur, C. Composition and Source Apportionment of Organic Aerosol in Beirut, Lebanon, During Winter 2012. Aerosol Sci. Technol. 2013, 47, 1258–1266. [Google Scholar] [CrossRef] [Green Version]
- Waked, A.; Seigneur, C.; Couvidat, F.; Kim, Y.; Sartelet, K.; Afif, C.; Borbon, A.; Formenti, P.; Sauvage, S. Modeling air pollution in Lebanon: Evaluation at a suburban site in Beirut during summer. Atmos. Chem. Phys. 2013, 13, 5873–5886. [Google Scholar] [CrossRef] [Green Version]
- Nazelle, A.; Fruin, S.; Westerdahl, D.; Mareinez, D.; Ripoll, A.; Kubesch, N.; Nieuwenhuijsen, M. A travel mode comparison of commuters’ exposures to air pollutants in Barcelona. Atoms. Environ. 2012, 59, 151–159. [Google Scholar] [CrossRef]
- Pérez, N.; Pey, J.; Cusack, M.; Reche, C.; Querol, X.; Alastuey, A.; Viana, M. Variability of Particle Number, Black Carbon, and PM10, PM2.5, and PM1 Levels and Speciation: Influence of Road Traffic Emissions on Urban Air Quality. Aerosol Sci. Technol. 2010, 44, 487–499. [Google Scholar] [CrossRef]
- Okokon, E.O.; Yli-Tuomi, T.; Turunen, A.W.; Taimisto, P.; Pennanen, A.; Vouitsis, I.; Samaras, Z.; Voogt, M.; Keuken, M.; Lanki, T. Particulates and noise exposure during bicycle, bus and car commuting: A study in three European cities. Environ. Res. 2017, 154, 181–189. [Google Scholar] [CrossRef]
- Knibbs, L.D.; Cole-Hunter, T.; Morawska, L. A review of commuter exposure to ultrafine particles and its health effects. Atoms. Environ. 2011, 45, 2611–2622. [Google Scholar] [CrossRef] [Green Version]
- Knibbs, L.D.; de Dear, R.J.; Morawska, L. Effect of cabin ventilation rate on ultrafine particle exposure inside automobiles. Environ. Sci. Technol. 2010, 44, 3546–3551. [Google Scholar] [CrossRef]
- Lim, S.; Dirks, K.N.; Salmond, J.A.; Xie, S. Determinants of spikes in ultrafine particle concentration whilst commuting by bus. Atoms. Environ. 2015, 112, 1–8. [Google Scholar] [CrossRef]
- Both, A.F.; Westerdahl, D.; Fruin, S.; Haryanto, B.; Marshall, J.D. Exposure to carbon monoxide, fine particle mass, and ultrafine particle number in Jakarta, Indonesia: Effect of commute mode. Sci. Total Environ. 2013, 443, 965–972. [Google Scholar] [CrossRef] [PubMed]
- Zhang, Q.; Fischer, H.J.; Weiss, R.E.; Zhu, Y. Ultrafine particle concentrations in and around idling school buses. Atoms. Environ. 2013, 69, 65–75. [Google Scholar] [CrossRef]
- Liu, L.J.S.; Phuleria, H.C.; Webber, W.; Davey, M.; Lawson, D.R.; Ireson, R.G.; Zielinska, B.; Ondov, J.M.; Weaver, C.S.; Lapin, C.A.; et al. Quantification of self pollution from two diesel school buses using three independent methods. Atoms. Environ. 2010, 44, 3422–3431. [Google Scholar]
- Zhang, Q.; Zhu, Y. Measurements of ultrafine particles and other vehicular pollutants inside school buses in South Texas. Atoms. Environ. 2010, 44, 253–261. [Google Scholar] [CrossRef]
- Dingenen, R.A.; Raes, F.; Putaud, J.-P.; Baltensperger, U.; Charron, A.; Facchini, M.-C.; Decesari, S.; Fuzzi, S.; Gehrige, R.; Hansson, H.-C.; et al. A European aerosol phenomenology—1: Physical characteristics of particulate matter at kerbside, urban, rural and background sites in Europe. Atmos. Environ. 2004, 38, 2561–2577. [Google Scholar] [CrossRef]
- Salma, I.; Borsos, T.; Weidinger, T.; Alato, P.; Hussein, T.; Dal Maso, M.; Kulmala, M. Production, growth and properties of ultrafine atmospheric aerosol particles in an urban environment. Atmos. Chem. Phys. 2011, 11, 1339–1353. [Google Scholar] [CrossRef] [Green Version]
- Ruuskanen, J.; Tuch, T.; Brink, H.T.; Peters, A.; Khlystov, A.; Mirme, A.; Kos, G.P.A.; Brunekreef, B.; Wichmann, H.E.; Buzorius, G.; et al. Concentrations of ultrafine, fine and PM2.5 particles in three European cities. Atmos. Environ. 2001, 35, 3729–3738. [Google Scholar] [CrossRef]
- Reche, C.; Querol, X.; Alastuey, A.; Viana, M.; Pey, J.; Moreno, T.; Rodriguez, S.; Gonzalez, Y.; Fernandez-Camacho, R.; de la Campa, A.M.S.; et al. New considerations for PM, Black Carbon and particle number concentration for air quality monitoring across different European cities. Atmos. Chem. Phys. 2011, 11, 6207–6227. [Google Scholar] [CrossRef] [Green Version]
- Kumar, P.; Rivas, I.; Sachdeva, L. Exposure of in-pram babies to airborne particles during morning drop-in and afternoon pick-up of school children. Environ. Pollut. 2017, 224, 407–420. [Google Scholar] [CrossRef]
- Ragettli, M.S.; Corradi, E.; Braun-Fahrländer, C.; Schindler, C.; de Nazelle, A.; Jerrett, M.; Ducret-Stich, R.E.; Künzli, N.; Phuleria, H.C. Commuter exposure to ultrafine particles in different urban locations, transportation modes and routes. Atoms. Environ. 2013, 77, 376–384. [Google Scholar] [CrossRef]
- Panis, I.L.; de Geus, B.; Vandenbulcke, G.; Willems, H.; Degraeuwe, B.; Bleux, N.; Mishra, V.; Thomas, I.; Meeusen, R. Exposure to particulate matter in traffic: A comparison of cyclists and car passengers. Atoms. Environ. 2010, 44, 2263–2270. [Google Scholar] [CrossRef]
- Quiros, D.C.; Lee, E.S.; Wang, R.; Zhu, Y. Ultrafine particle exposures while walking, cycling, and driving along an urban residential roadway. Atoms. Environ. 2013, 73, 185–194. [Google Scholar] [CrossRef]
- Ham, W.; Vijayan, A.; Schulte, N.; Herner, J.D. Commuter exposure to PM2.5, BC, and UFP in six common transport microenvironments in Sacramento, California. Atoms. Environ. 2017, 167, 335–345. [Google Scholar] [CrossRef]
- Boarnet, M.G.; Houston, D.; Edwards, R.; Princevac, M.; Ferguson, G.; Pan, H.; Bartolome, C. Fine particulate concentrations on sidewalks in five Southern California cities. Atoms. Environ. 2011, 45, 4025–4033. [Google Scholar] [CrossRef]
- Hankey, S.; Marshall, J.D. On-bicycle exposure to particulate air pollution: Particle number, black carbon, PM2.5, and particle size. Atoms. Environ. 2015, 122, 65–73. [Google Scholar] [CrossRef]
- Pattinson, W.; Longley, I.; Kingham, S. Using mobile monitoring to visualise diurnal variation of traffic pollutants across two near-highway neighbourhoods. Atoms. Environ. 2014, 94, 782–792. [Google Scholar] [CrossRef]
- Goel, R.; Gani, S.; Guttikunda, S.K.; Wilson, D.; Tiwari, G. On-road PM2.5 pollution exposure in multiple transport microenvironments in Delhi. Atoms. Environ. 2015, 123, 129–138. [Google Scholar] [CrossRef]
- Apte, J.S.; Kirchstetter, T.W.; Reich, A.H.; Deshpande, S.J.; Kaushik, G.; Chel, A.; Marshall, J.D.; Nazaroff, W.W. Concentrations of fine, ultrafine, and black carbon particles in auto-rickshaws in New Delhi, India. Atoms. Environ. 2011, 45, 4470–4480. [Google Scholar] [CrossRef]
- Qiu, Z.; Xu, X.; Song, J.; Luo, Y.; Zhao, R.; Zhou, B.X.W.; Hao, X.L.I.Y. Pedestrian exposure to traffic PM on different types of urban roads: A case study of Xi’an, China. Sustain. Cities Soc. 2017, 32, 475–485. [Google Scholar] [CrossRef]
- Huang, J.; Deng, F.; Wu, S.; Guo, X. Comparisons of personal exposure to PM2.5 and CO by different commuting modes in Beijing, China. Sci. Total Environ. 2012, 425, 52–59. [Google Scholar] [CrossRef] [PubMed]
- Betancourt, R.M.; Galvis, B.; Balachandran, S.; Ramos-Bonilla, J.P.; Sarmiento, O.L.; Gallo-Murcia, S.M.; Contreras, Y. Exposure to fine particulate, black carbon, and particle number concentration in transportation microenvironments. Atoms. Environ. 2017, 157, 135–145. [Google Scholar] [CrossRef]
- Kulmala, M.; Kontkanen, J.; Junninen, H.; Lehtipalo, K.; Manninen, H.E.; Nieminen, T.; Petaja, T.; Sipila, M.; Schobesberger, S.; Rantala, P.; et al. Direct Observations of Atmospheric Aerosol Nucleation. Science 2013, 339, 943–946. [Google Scholar] [CrossRef] [PubMed]
- Mølgaard, B.; Hussein, T.; Corander, J.; Hämeri, K. Forecasting Size-Fractionated Particle Number Concentrations in the Urban Atmosphere. Atmos. Environ. 2012, 46, 155–163. [Google Scholar] [CrossRef]
- Mølgaard, B.; Birmili, W.; Clifford, S.; Massling, A.; Eleftheriadis, K.; Norman, M.; Vratolis, S.; Wehner, B.; Corander, J.; Hämeri, K.; et al. Evaluation of a statistical forecast model for size-fractionated urban particle number concentrations using data from five European cities. J. Aerosol Sci. 2013, 66, 96–110. [Google Scholar] [CrossRef]
- Hussein, T.; Karppinen, A.; Kukkonen, J.; Härkonen, J.; Aalto, P.P.; Hämeri, K.; Kerminen, V.M.; Kulmala, M. Meteorological dependence of size fractionated number concentrations of urban aerosol particles. Atmos. Environ. 2006, 40, 1427–1440. [Google Scholar] [CrossRef]
- Hussein, T.; Kukkonen, J.; Korhonen, H.; Pohjola, M.; Pirjola, L.; Wriath, D.; Härkönen, J.; Teinilä, K.; Koponen, I.K.; Karppinen, A.; et al. Evaluation and modeling of the size fractionated aerosol particle number concentration measurements nearby a major road in Helsinki—Part II: Aerosol measurements within the SAPPHIRE project. Atmos. Chem. Phys. 2007, 7, 4081–4094. [Google Scholar] [CrossRef] [Green Version]
- Harrison, R.; Yin, J. Particulate matter in the atmosphere: Which particle properties are important for its effects on health? Sci. Total Environ. 2000, 249, 85–101. [Google Scholar] [CrossRef]
- Harrison, R.M.; Jones, A.M.; Barrowcliffe, R. Field study of the influence of meteorological factors and traffic volumes upon suspended particle mass at urban roadside sites of differing geometries. Atmos. Environ. 2004, 38, 6361–6369. [Google Scholar] [CrossRef]
- Charron, A.; Harrison, R.M. Primary particle formation from vehicle emissions during exhaust dilution in the roadside atmosphere. Atmos. Environ. 2003, 37, 4109–4119. [Google Scholar] [CrossRef]
- Gidhagen, L.; Johansson, C.; Langner, J.; Olivares, G. Simulation of NOx and ultrafine particles in a street canyon in Stockholm, Sweden. Atmos. Environ. 2004, 38, 2029–2044. [Google Scholar] [CrossRef]
- Hosiokangas, J.; Vallius, M.; Ruuskanen, J.; Mirme, A.; Pekkanen, J. Resuspended dust episodes as an urban air-quality problem in subarctic regions. Scand. J. Work Environ. Health 2004, 30 (Suppl. 2), S28–S35. [Google Scholar]
- Järvi, L.; Hannuniemi, H.; Hussein, T.; Junninen, H.; Aalto, P.P.; Hillamo, R.; Mäkelä, T.; Keronen, P.; Siivola, E.; Vesala, T.; et al. The urban measurement station SMEAR III: Continuous monitoring of air pollution and surface-atmosphere interactions in Helsinki, Finland. Boreal Environ. Res. 2009, 14 (Suppl. A), 86–109. [Google Scholar]
- Krecl, P.; Ström, J.; Johansson, C. Diurnal variation of atmospheric aerosol during the wood combustion season in Northern Sweden. Atmos. Environ. 2008, 42, 4113–4125. [Google Scholar] [CrossRef]
- Singh, A.K.; Rai, J.; Niwas, S. Variations of aerosols in relation to some meteorological parameters during different weather conditions. Atmósfera 2000, 13, 177–184. [Google Scholar]
Figure 1.
Time series of weather conditions during the measurement period (August 1 2016–July 31 2017) presented as hourly, daily, and monthly means for (a) ambient temperature, (b) relative humidity, (c) absolute pressure, and (d) wind speed. (e) The rainfall is presented as hourly cumulative precipitation.

Figure 2.
Time series of the (a) submicron particle number concentration, (b) comparison between the condensation particle counter (CPC) and scanning mobility particle sizer (SMPS) + optical particle sizer (OPS) particle number concentrations, and (c,d) the main particle size fraction concentrations of ultrafine particles (Dp < 0.1 µm) and accumulation mode particles (Dp 0.1–1 µm).

Figure 3.
(a) Diurnal pattern of the submicron particle number concentration (0.01–1 µm) and (b) date-time spectrum showing the day-to-day and hour-to-hour variation of the number concentration; the color bar scales the number concentration (cm−3).
Figure 3.
(a) Diurnal pattern of the submicron particle number concentration (0.01–1 µm) and (b) date-time spectrum showing the day-to-day and hour-to-hour variation of the number concentration; the color bar scales the number concentration (cm−3).

Figure 4.
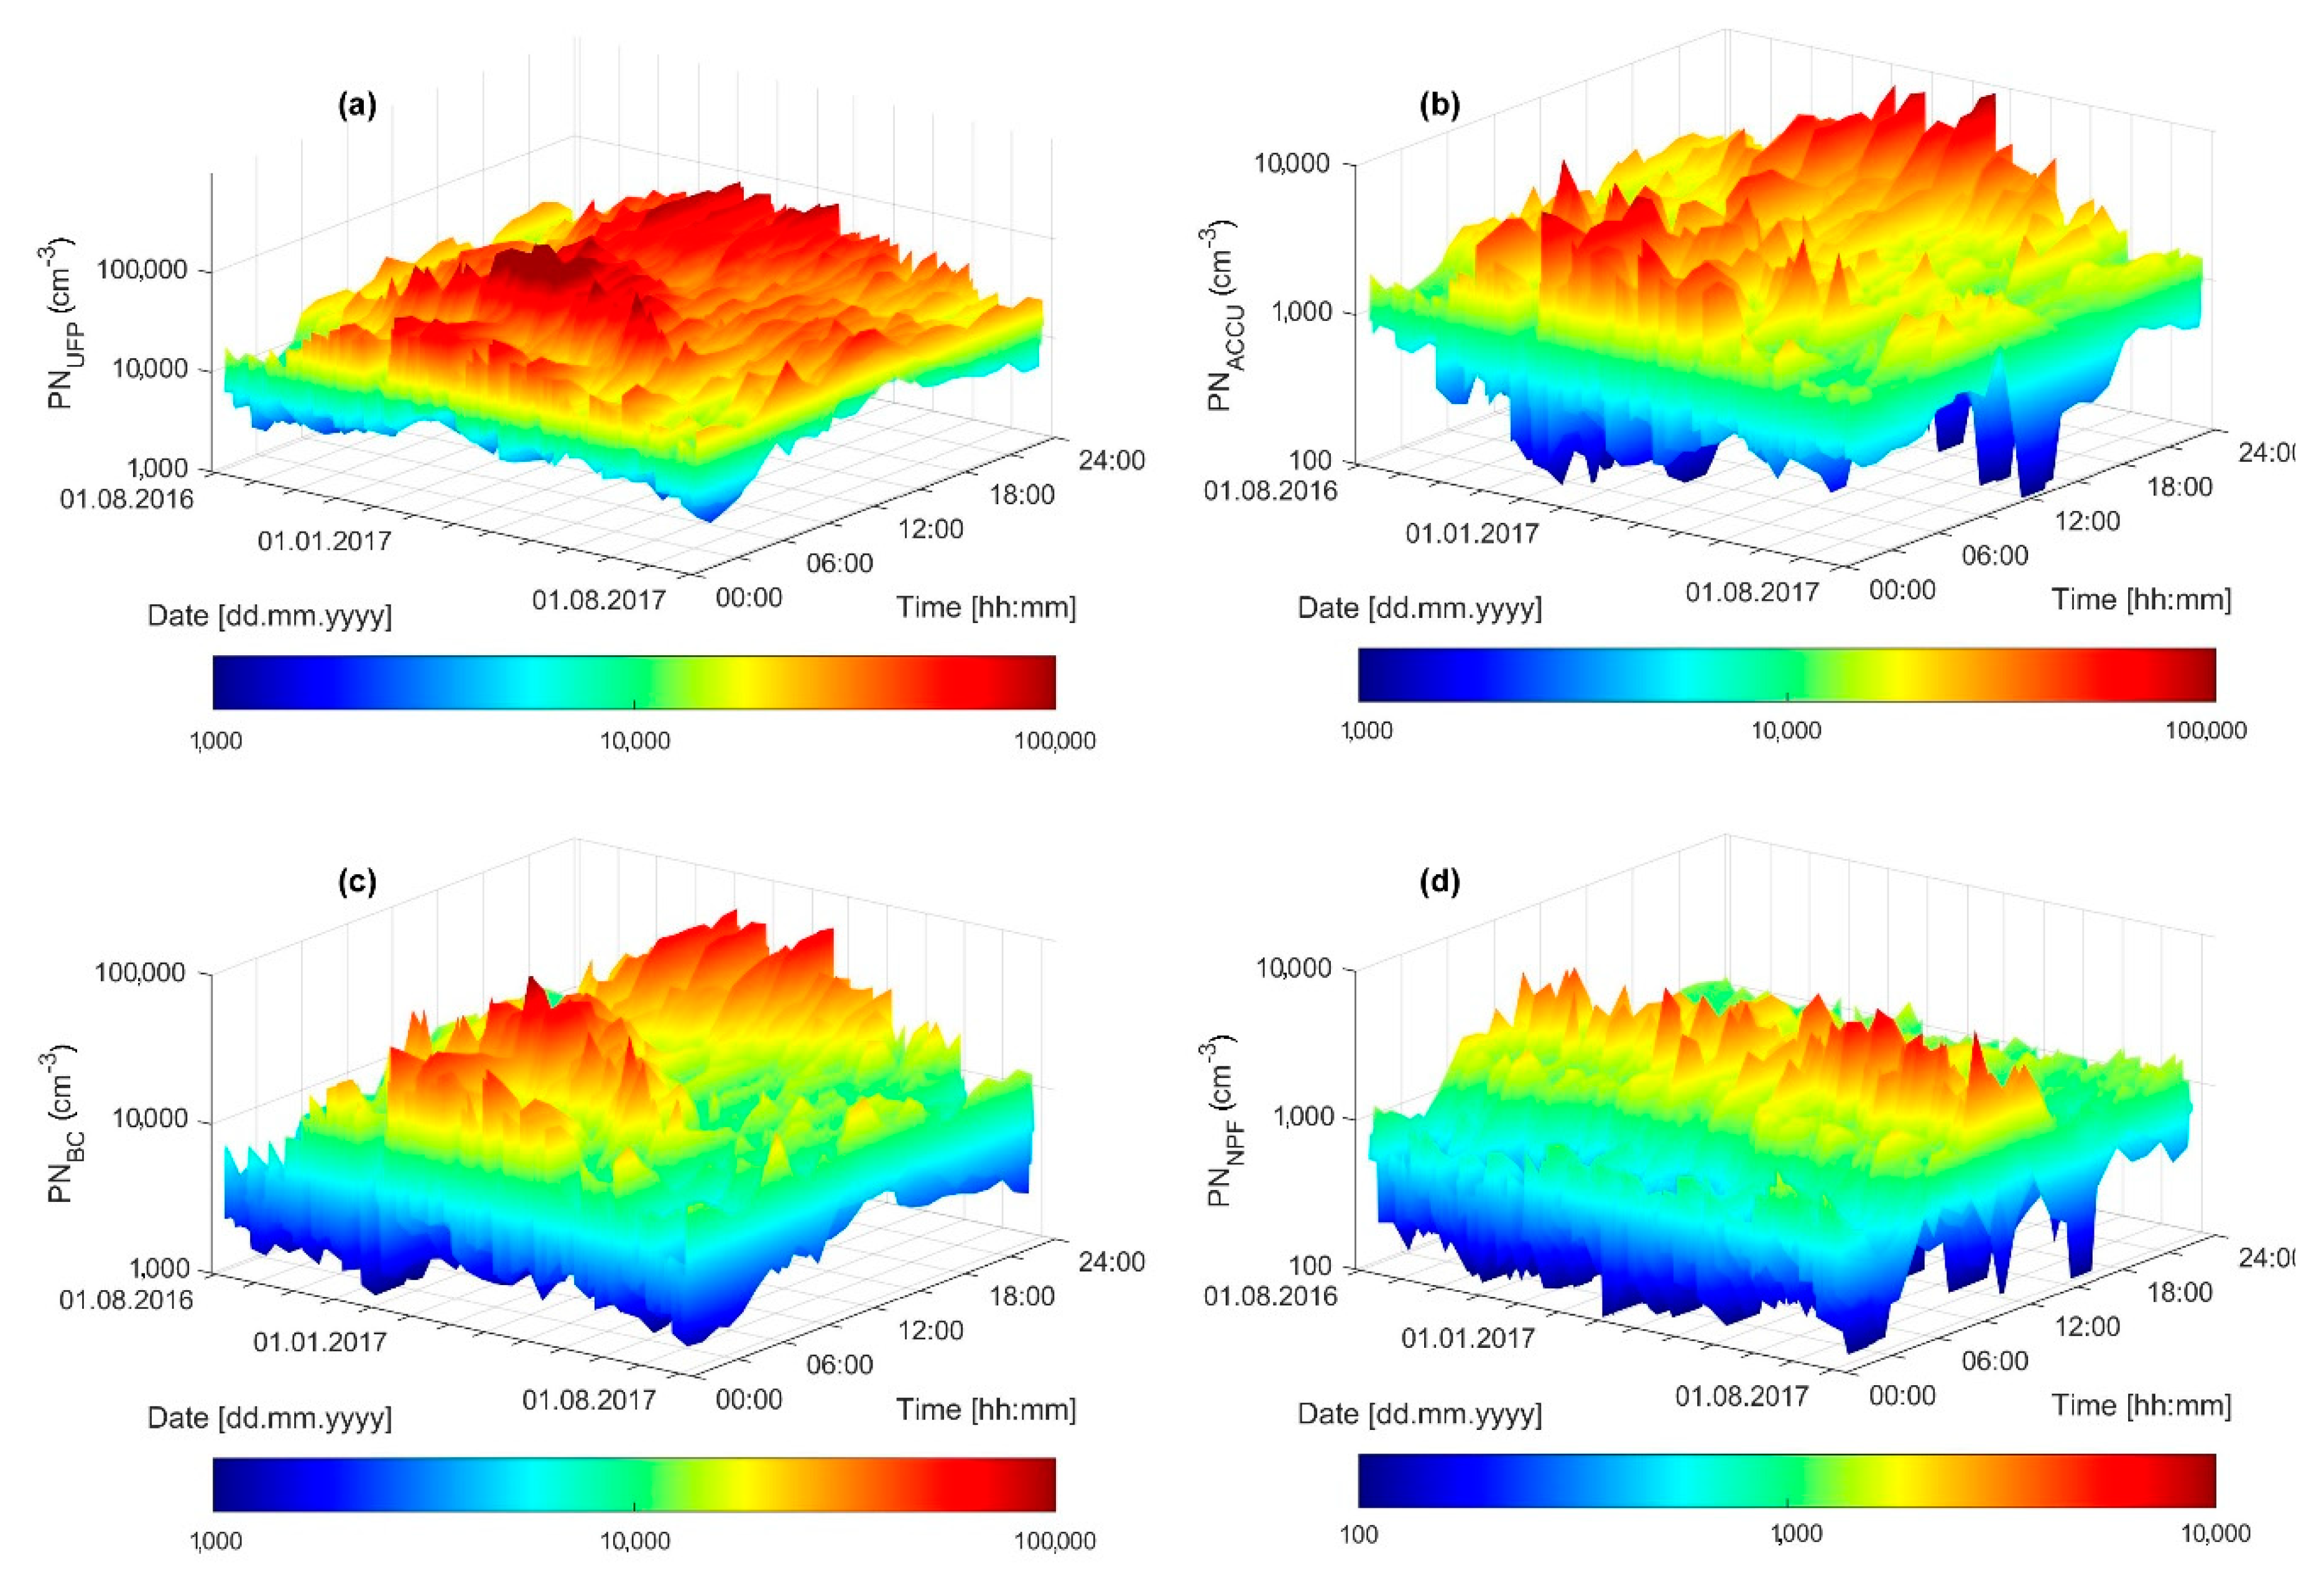
Diurnal pattern of the (a) ultrafine particle number concentration (UFP, diameter < 0.1 µm), (b) accumulation mode particle number concentration (diameter 0.1–1 µm), (c) an indicator for the temporal variation of black carbon fraction (diameter 0.03–0.25 nm), and (d) number concentration in the first channel (diameter 10–15 nm) measured with SMPS; the vertical dashed lines are aligned with the noon time.
Figure 4.
Diurnal pattern of the (a) ultrafine particle number concentration (UFP, diameter < 0.1 µm), (b) accumulation mode particle number concentration (diameter 0.1–1 µm), (c) an indicator for the temporal variation of black carbon fraction (diameter 0.03–0.25 nm), and (d) number concentration in the first channel (diameter 10–15 nm) measured with SMPS; the vertical dashed lines are aligned with the noon time.

Figure 5.
Date-time spectra showing the day-to-day and hour-to-hour variation of (a) ultrafine particle number concentration (UFP, diameter < 0.1 µm), (b) accumulation mode particle number concentration (diameter 0.1–1 µm), (c) an indicator for the temporal variation of black carbon fraction (diameter 0.03–0.25 nm), (d) number concentration in the first channel (diameter 10–15 nm) measured with SMPS. The color bar scales the number concentration (cm−3).

Figure 6.
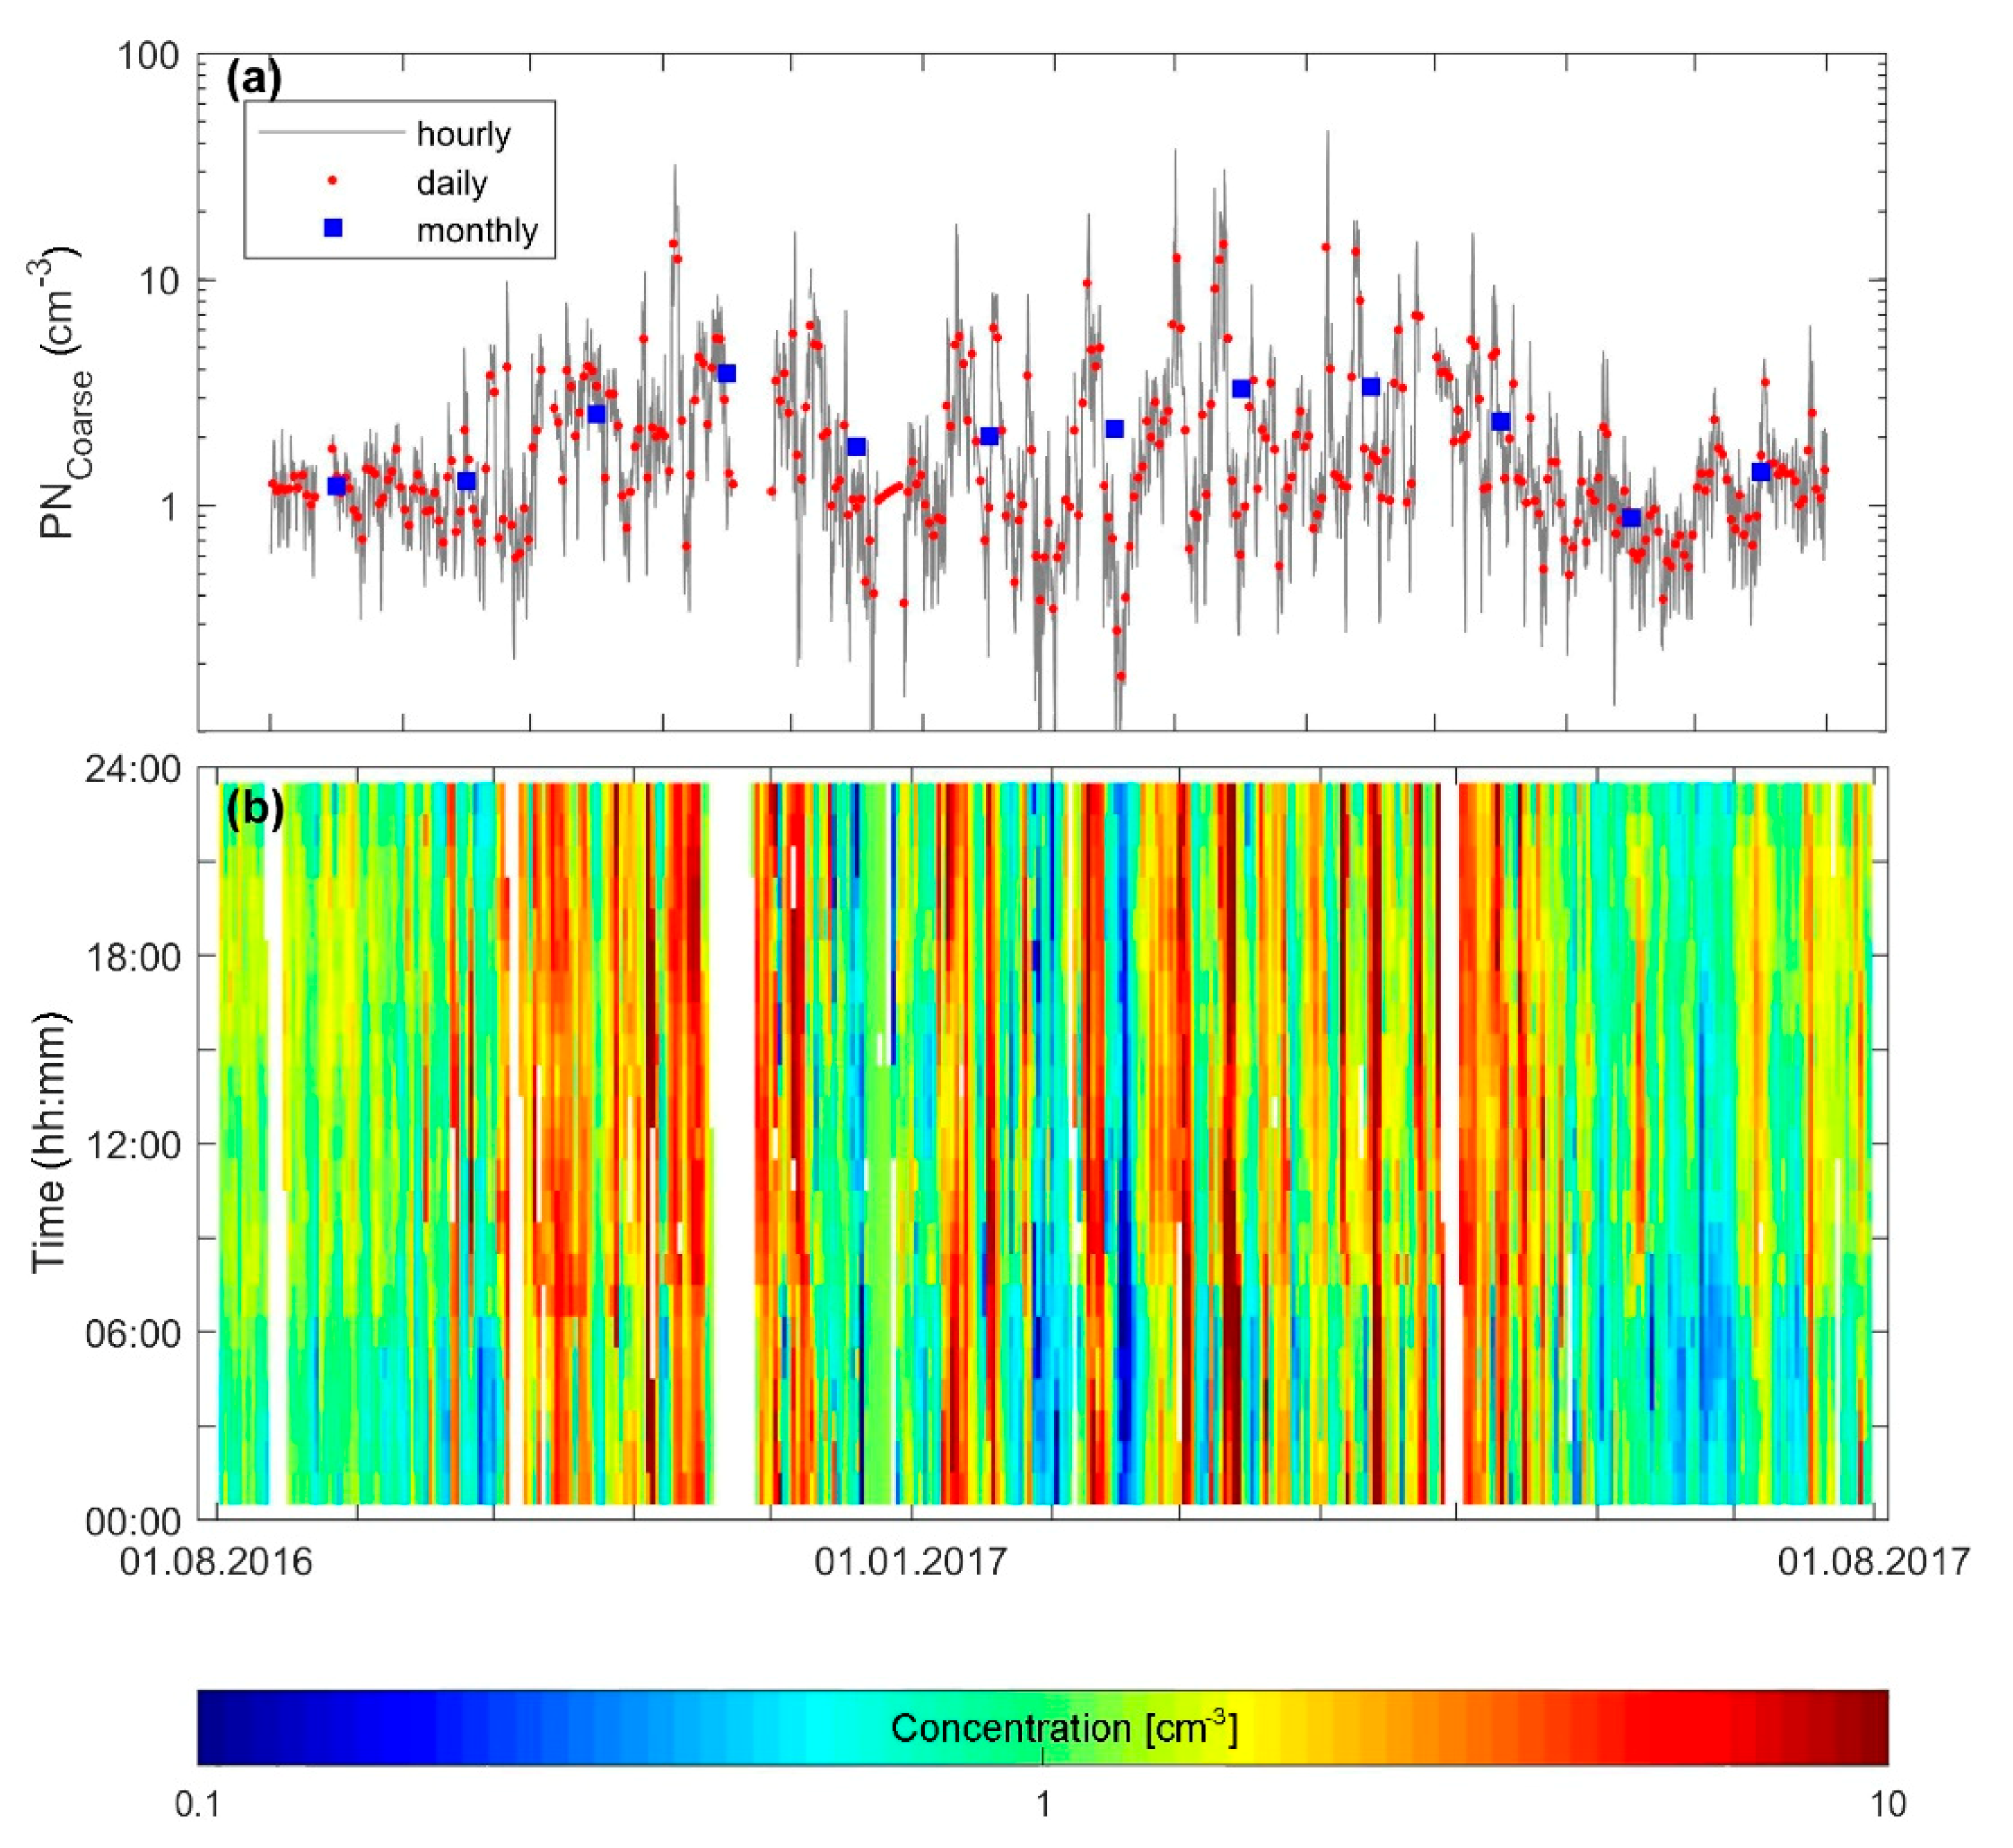
(a) Time series of the coarse mode (diameter 1–10 µm) particle number concentration and (b) date-time spectrum showing the day-to-day and hour-to-hour variation of the number concentration; the color bar scales the number concentration (cm−3).
Figure 6.
(a) Time series of the coarse mode (diameter 1–10 µm) particle number concentration and (b) date-time spectrum showing the day-to-day and hour-to-hour variation of the number concentration; the color bar scales the number concentration (cm−3).

Figure 7.
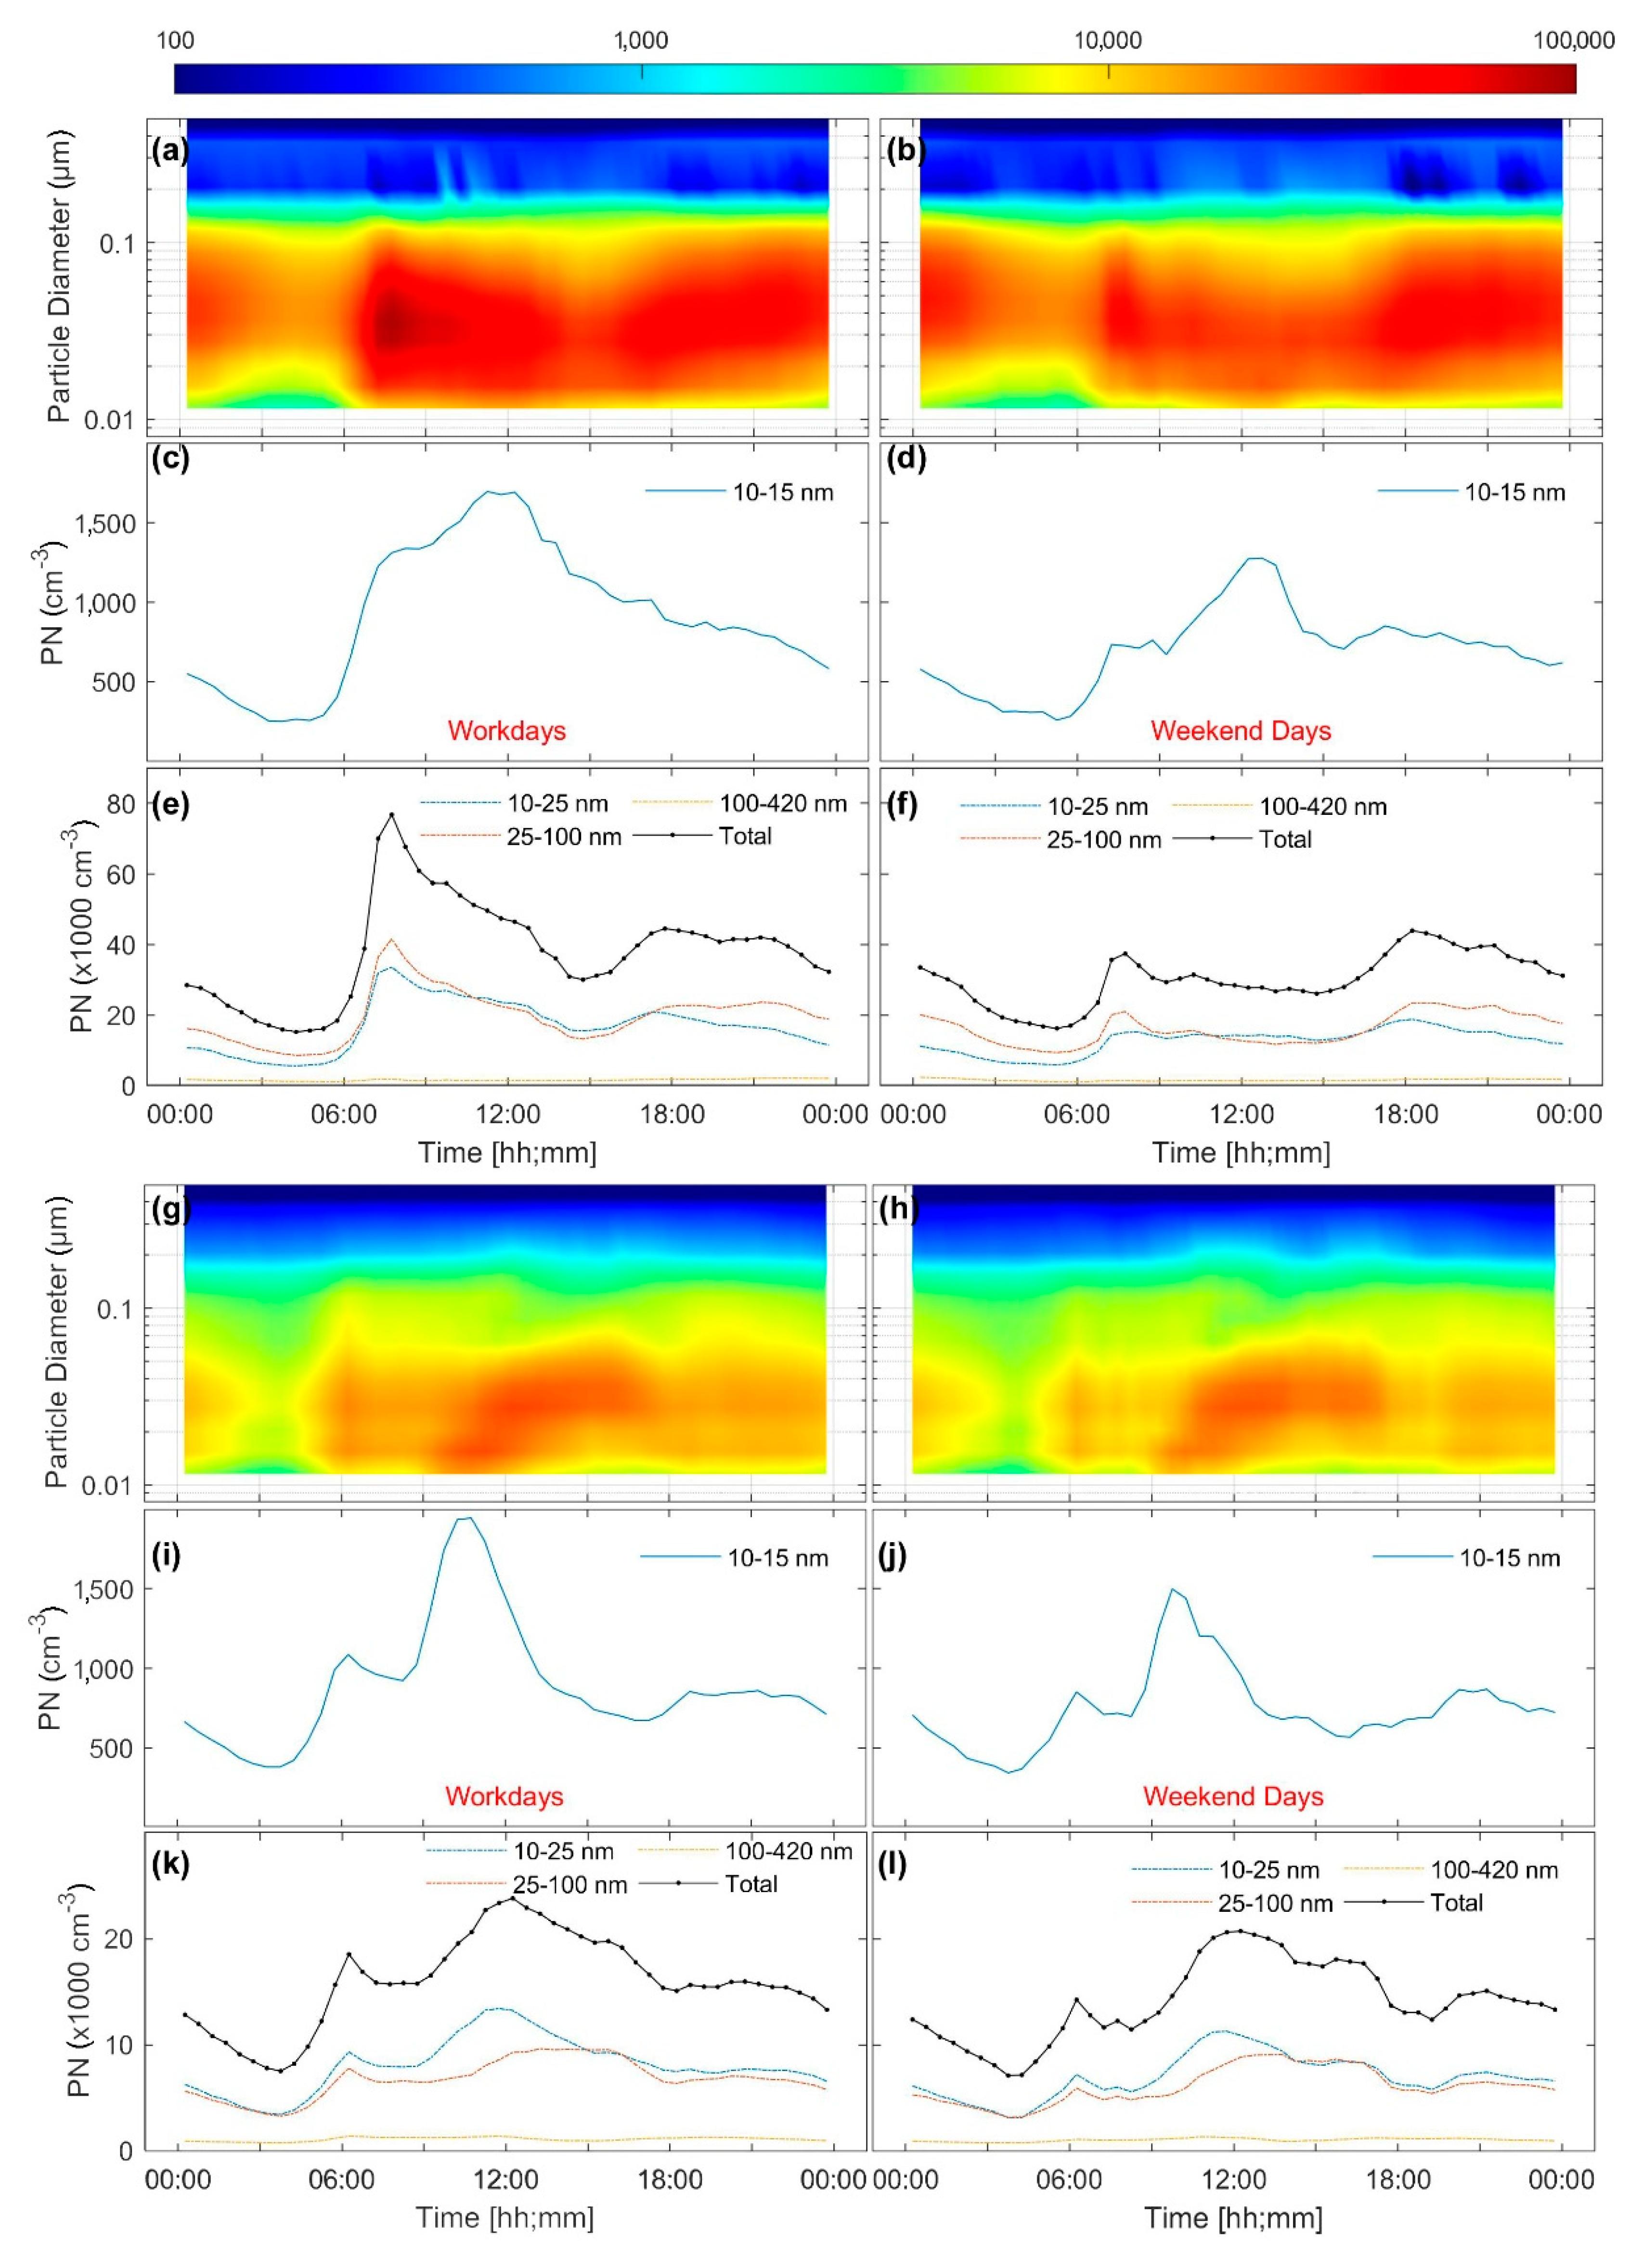
Mean diurnal patterns during (a–f) a cold period (i.e., December–February) and (g–l) warm period (i.e., May–August). Here the color subfigures (a,b,g,h) show the mean particle number size distribution spectra (color bar represents dN/dlog(Dp) (cm−3)) and below them are plots for different particle size fractions.
Figure 7.
Mean diurnal patterns during (a–f) a cold period (i.e., December–February) and (g–l) warm period (i.e., May–August). Here the color subfigures (a,b,g,h) show the mean particle number size distribution spectra (color bar represents dN/dlog(Dp) (cm−3)) and below them are plots for different particle size fractions.

Figure 8.
Modal structure of the particle number size distribution derived from the multi-lognormal fitting (5-min average). (a) Modal structure spectrum showing the dominant modes (nucleation, Aitken, accumulation, and coarse modes). Distributions of (b) mode geometric mean diameter (Dpg), (c–f) mode number concentration (N), and (g–j) mode geometric variance (σpg).

Figure 9.
Particle number concentration dependence on the local weather conditions: (a) submicron particles (diameter < 1 µm) with respect to wind speed, (b) coarse mode particles (1–10 µm) with respect to wind speed, (c) submicron particles with respect to temperature, and (d) coarse mode particles with respect to temperature. The red squares are the median concentrations with respect to temperature intervals on the x-axis and the error bars are the 25% and 75%. In (c,d), the color codes the relative humidity and the circle size is proportional to the wind speed.

© 2019 by the authors. Licensee MDPI, Basel, Switzerland. This article is an open access article distributed under the terms and conditions of the Creative Commons Attribution (CC BY) license (http://creativecommons.org/licenses/by/4.0/).
Share and Cite
MDPI and ACS Style
Hussein, T.; Dada, L.; Hakala, S.; Petäjä, T.; Kulmala, M. Urban Aerosol Particle Size Characterization in Eastern Mediterranean Conditions. Atmosphere 2019, 10, 710. https://doi.org/10.3390/atmos10110710
AMA Style
Hussein T, Dada L, Hakala S, Petäjä T, Kulmala M. Urban Aerosol Particle Size Characterization in Eastern Mediterranean Conditions. Atmosphere. 2019; 10(11):710. https://doi.org/10.3390/atmos10110710
Chicago/Turabian StyleHussein, Tareq, Lubna Dada, Simo Hakala, Tuukka Petäjä, and Markku Kulmala. 2019. "Urban Aerosol Particle Size Characterization in Eastern Mediterranean Conditions" Atmosphere 10, no. 11: 710. https://doi.org/10.3390/atmos10110710
Note that from the first issue of 2016, this journal uses article numbers instead of page numbers. See further details here.