Article

Modelling Daily Mean Surface Air Temperature Calculated from Different Methods and Its Impact on Urban-Related Warming Evaluations over Guangzhou and Shenzhen Using the WRF Model

1
CAS Key Laboratory of Regional Climate-Environment for Temperate East Asia, Institute of Atmospheric Physics, Chinese Academy of Sciences, Beijing 100029, China
2
Department of Atmospheric Science, Yunnan University, Kunming 650091, China
*
Author to whom correspondence should be addressed.
Atmosphere 2019, 10(2), 48; https://doi.org/10.3390/atmos10020048
Submission received: 26 December 2018 / Revised: 19 January 2019 / Accepted: 21 January 2019 / Published: 27 January 2019
(This article belongs to the Special Issue Urban Climate)

Abstract

:
The impacts of urban surface expansion, based on satellite-derived data displaying urban surface expansion in China at different spatial scales from 1980 to 2016, were investigated using nested dynamical downscaling methods with the Weather Research and Forecasting (WRF) regional climate model at a 3.3-km resolution over a city and city cluster scale. Urban-related warming, based on daily mean surface air temperature at 2 m (SAT), calculated from the averages of four time records each day (00, 06, 12, and 18 h UTC, T4) and averages of SAT maximum (Tmax) and minimum (Tmin) (Txn), was evaluated. Differences in urban-related warming contributions calculated using T4 and Txn were small, whereas annual mean SAT and trends calculated using Txn were respectively and significantly larger and smaller than those calculated using T4 over Guangzhou and Shenzhen, excluding the trends over middle-northern Shenzhen. The differences in annual mean SAT calculated using T4 and Txn are attributed to nonlinear or asymmetric variations with time for the diurnal cycle of SAT. Meanwhile, differences in trends between T4 and Txn are interpreted as a strong trend for Tmin and a weak one for Tmax, which mitigated the trend for Txn. The impacts on the evaluations of urban-related warming contributions calculated from different methods were the largest over the areas classified as urban surfaces in both time periods (U2U), especially during intense urban-surface-expansion periods between 2000 and 2016. The subregional performances in the changes in annual mean SAT, trends, and urban-related warming are attributed to urban-surface-expansion, which induced varied changes in the diurnal cycle due to asymmetric warming during the daytime and nighttime over different subregions.

1. Introduction

Surface air temperature at 2 m (SAT) plays a primary role in the climatic systems, and has been widely regarded as an important climatic indictor in daily human life. The frequencies and intensities of extreme climatic events relating to SAT, such as heat waves and low temperatures that act as meteorological disasters and influence human health [1,2,3], have increased in recent decades. Increasingly more people are being aggregated in cities, where the urban heat island (UHI) has been widely observed over areas with intense urban surface expansion and human activities [4,5,6]. The UHI effect is primarily attributed to the conversion of land surfaces from non-urban to urban surfaces (N2U), for which the warming over the N2U areas is generally larger than that over areas classified as urban surfaces in both time periods (U2U) and areas with unchanged land use categories [7,8]. To objectively evaluate urban-related warming and the corresponding contributions to regional warming over different land surface characteristics, SAT, as a direct indicator, should be comprehensively observed and calculated.
However, despite the scarcity of the observed SAT and other meteorological observation records, such as the SAT maximum (Tmax) and minimum (Tmin) during the past several decades, the records for three time records each day (00, 06, and 12 h UTC), four time records each day (00, 06, 12, and 18 h UTC), and continuous values within a 24-h period, have been applied. The variation in the methods used to calculate daily mean SAT results in differences in the evaluated annual mean SAT and trends. Values calculated using the 24-h continuous records (Tc) should represent the most direct and concise method for representing daily mean SAT [9]; however, the values calculated using the averages of SAT maximum and minimum records (Txn) [10], averages of three times each day, or averages of four times each day (T4) [11], are usually adopted as the representative ‘actual’ values of daily mean SAT. This difference could impact the evaluations of urban-related warming and corresponding contributions to regional warming. Furthermore, the diurnal cycle of SAT displays nonlinear or asymmetric variations with time, which might induce SAT errors among the values calculated using T4, Txn, or Tc [12]. Therefore, a comparison of the daily mean SAT calculated from various methods should be conducted, which can provide a basis for evaluating urban-related warming.
To quantitatively reveal the urban-related warming contributions calculated using T4, Txn, or Tc, a time series of observed-based SAT calculated using these methods is necessary. A long-term Txn time series might be available based on observed Tmax and Tmin [13,14]; however, long-term T4 time series are less available because observation records with three times daily records were adopted for a certain period and then replaced by the four times daily observations [10]. Long-term Tc time series are only available from when the automatic meteorological observation station appeared, which has only been adopted for the most recent decades. Therefore, comparing long-term SAT time series calculated using different methods is difficult due to the scarcity of long-term time series of observed SAT with different observational rules.
Urban-related warming and the corresponding contributions have been generally evaluated using SAT differences between the observation minus reanalysis (OMR) [15] or the SAT differences between urban and rural meteorological stations (UMR) [16,17,18], which depend on meteorological station observation data. For the OMR method, errors result from the coarse resolution of both the station-based observation and re-analysis data, for which the spatial resolution might range between 0.75 degree and 2.5 degree and the temporal resolution is usually four times daily. For the UMR method, due to the large spatial heterogeneity in the UHI, the urban-related warming might vary, depending on the stations selected as the urban and rural meteorological stations. With rapid economic development and human activities, rural meteorological stations can be more or less affected [4,19], which implies that a ‘real’ rural station is difficult to identify. Finding pure rural stations is an even bigger problem in China due to the massive urban development, and these have been overgrown during the past several decades, whereas this is not such a massive problem, for example, in the United States or in Europe. Therefore, SAT data with a fine spatial and temporal resolution will be beneficial to evaluating urban-related warming.
Numerical simulations provide an alternative approach for urbanization climate effect studies [20,21]. Long-term integrations using the Weather Research and Forecasting (WRF) [22] regional climate model with fine-resolution spatio-temporal land use data, which approximately represent urban surface expansion during the past several decades [23,24], were adopted to study the impacts on SAT due to urban surface expansion. To more concisely reproduce urban surface expansion in the model, especially at the city scale, nested simulations were adopted at 30-10-3.3 km resolutions, in which a 3.3 km resolution was adopted for three city clusters displaying marked urban surface expansion over the past several decades: Beijing-Tianjin-Hebei (BTH), Yangtze River Delta (YRD), and Pearl River Delta (PRD). Two cities (Guangzhou and Shenzhen), closely located within the PRD areas over southern China and with similar climatic backgrounds but different degrees of urban-surface-expansion during the past several decades, were chosen to compare the daily mean SAT calculated using different methods. Simulated SAT values were used to study the differences in the long-term time series of daily mean SAT calculated using T4, Txn, and Tc. Then, the impacts of differing SAT records on evaluating urban-related warming over Guangzhou and Shenzhen were investigated. The differences in annual mean SAT, trends, and urban-related warming contributions calculated using T4, Txn, and Tc, both in spatial and long-term times series, are discussed.

2. Experiments

The experimental design and data used here are similar to those in [8]; however, the former study concentrated on urban-related warming in Beijing and only the simulated values for eight times daily were adopted in calculating daily mean SAT. Detailed information on the experimental design and data are provided in Sections S1–S3 of the Supplementary Materials.

2.1. Data

The numerical experiments were driven by the National Centers for Environmental Prediction (NCEP)—the Department of Energy (DOE) Atmospheric Model Intercomparison Project (AMIP-II) reanalysis data (1979–2016) [25]. Annual land use data from 1980 to 2016 were reconstructed based on five satellite-retrieved images from 1980, 1990, 2000, 2010, and 2016 [23,24], which represent urban surface expansion during the last 37 years. The two datasets used here are similar to those in [8].

2.2. Experimental Design

Based on previous results, daily mean SAT values calculated using different methods were compared and their impacts on urban-related warming evaluations explored. This analysis remedies the scarcity of observed spatio-temporal meteorological station-based data and provides a basis for climate change studies.
The simulated domain covers most of East Asia with a 30 km resolution (D1). As urban-surface-expansion is mainly located over eastern China, accompanying rapid economic development, the first nested domain covers most of eastern China (D2). The three second-nested-domains cover three city clusters (D3: BTH, D4: YRD, and D5: PRD) displaying the largest proportion of gross domestic product and intense human activity. The terrain elevation over the simulated domain, the PRD region (including Guangzhou and Shenzhen city), and two cities are displayed in Figure 1a–d.
Two numerical experiments, which share similar integrated backgrounds with the exception of land use data (for urban surface distributions only), were performed using the WRF model. The land use data, including urban surface distributions in the 1980s, were used in the first experiment (EX1), whereas annual land use data revealing urban-surface-expansion were adopted in the second experiment (EX2), in which the reconstructed annual land use data from 1980 to 2016 were used. The model was integrated for 18 months for each year individually from 1 July in the previous year and for the whole year in the current year. Then, the simulated results covering the whole period of the current year were analyzed. The impacts of urban-surface-expansion are represented by differences between the simulated results from EX1 and EX2 (EX2 minus EX1). The impacts on urban-related warming are explored in detail using the daily mean SAT calculated using T4, Txn, and Tc.
The experimental design, data, and abbreviations used here are summarized in Table 1. The performance of the model in the SAT simulation has been previously explored and evaluated in [7,8], so is not discussed here.

3. Results

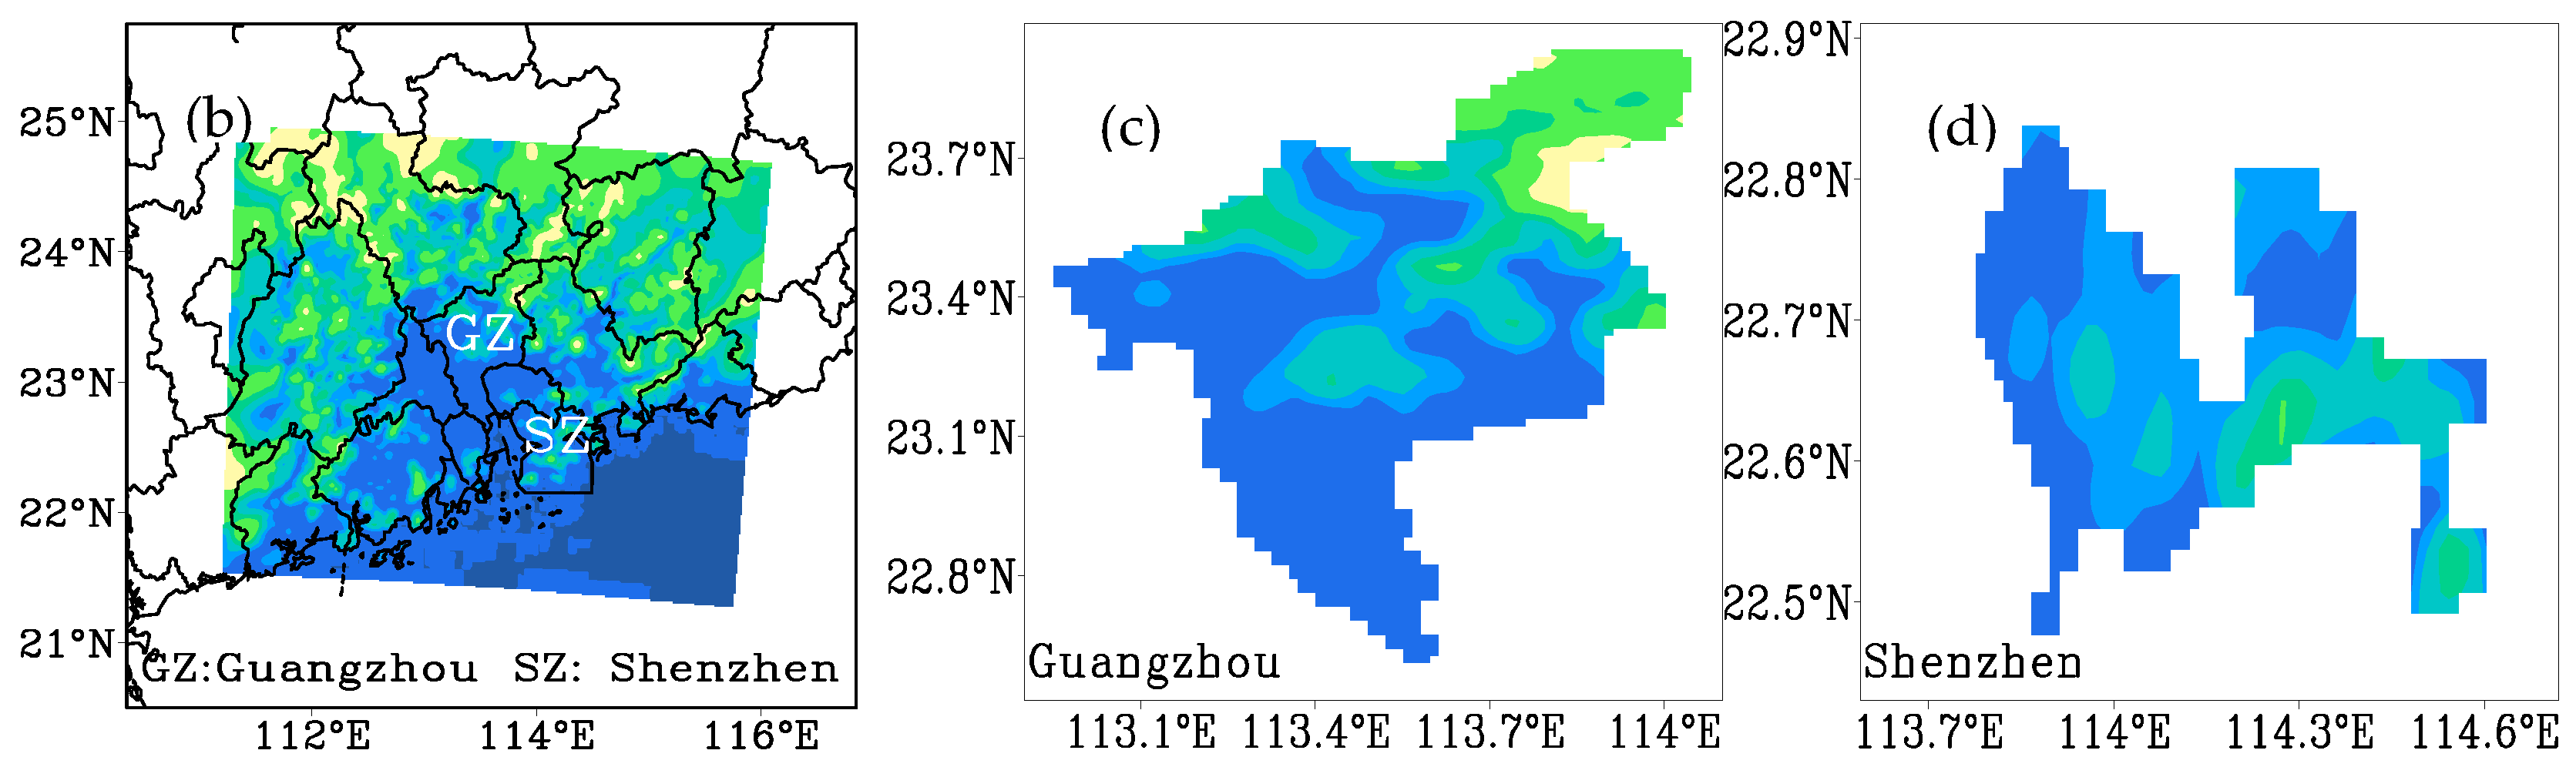
3.1. Urban Surface Expansion over Guangzhou and Shenzhen

Five satellite-detrieved images displaying the urban surface distributuion for the years between 1980 and 2016 over Guangzhou and Shenzhen are shown in Figure 2.
For Guangzhou, terrain height is high in the northeast and low in the southwest (Figure 1c). Urban surfaces were only located in metropolitan areas over the southwestern part in 1980, whereas forests occupied the majority of areas of the northeastern part. Urban surface expansion mainly occurred over the southwestern part from 1980 to 2016.
For Shenzhen, terrain height is high in the southeast and low in the northwest (Figure 1d). No urban grid cell was detected because it was a small village in 1980. However, urban grid cells increased considerably due to rapid urban surface expansion across the entire area, with the exception of the southeastern part, for which it was mostly covered by forests.

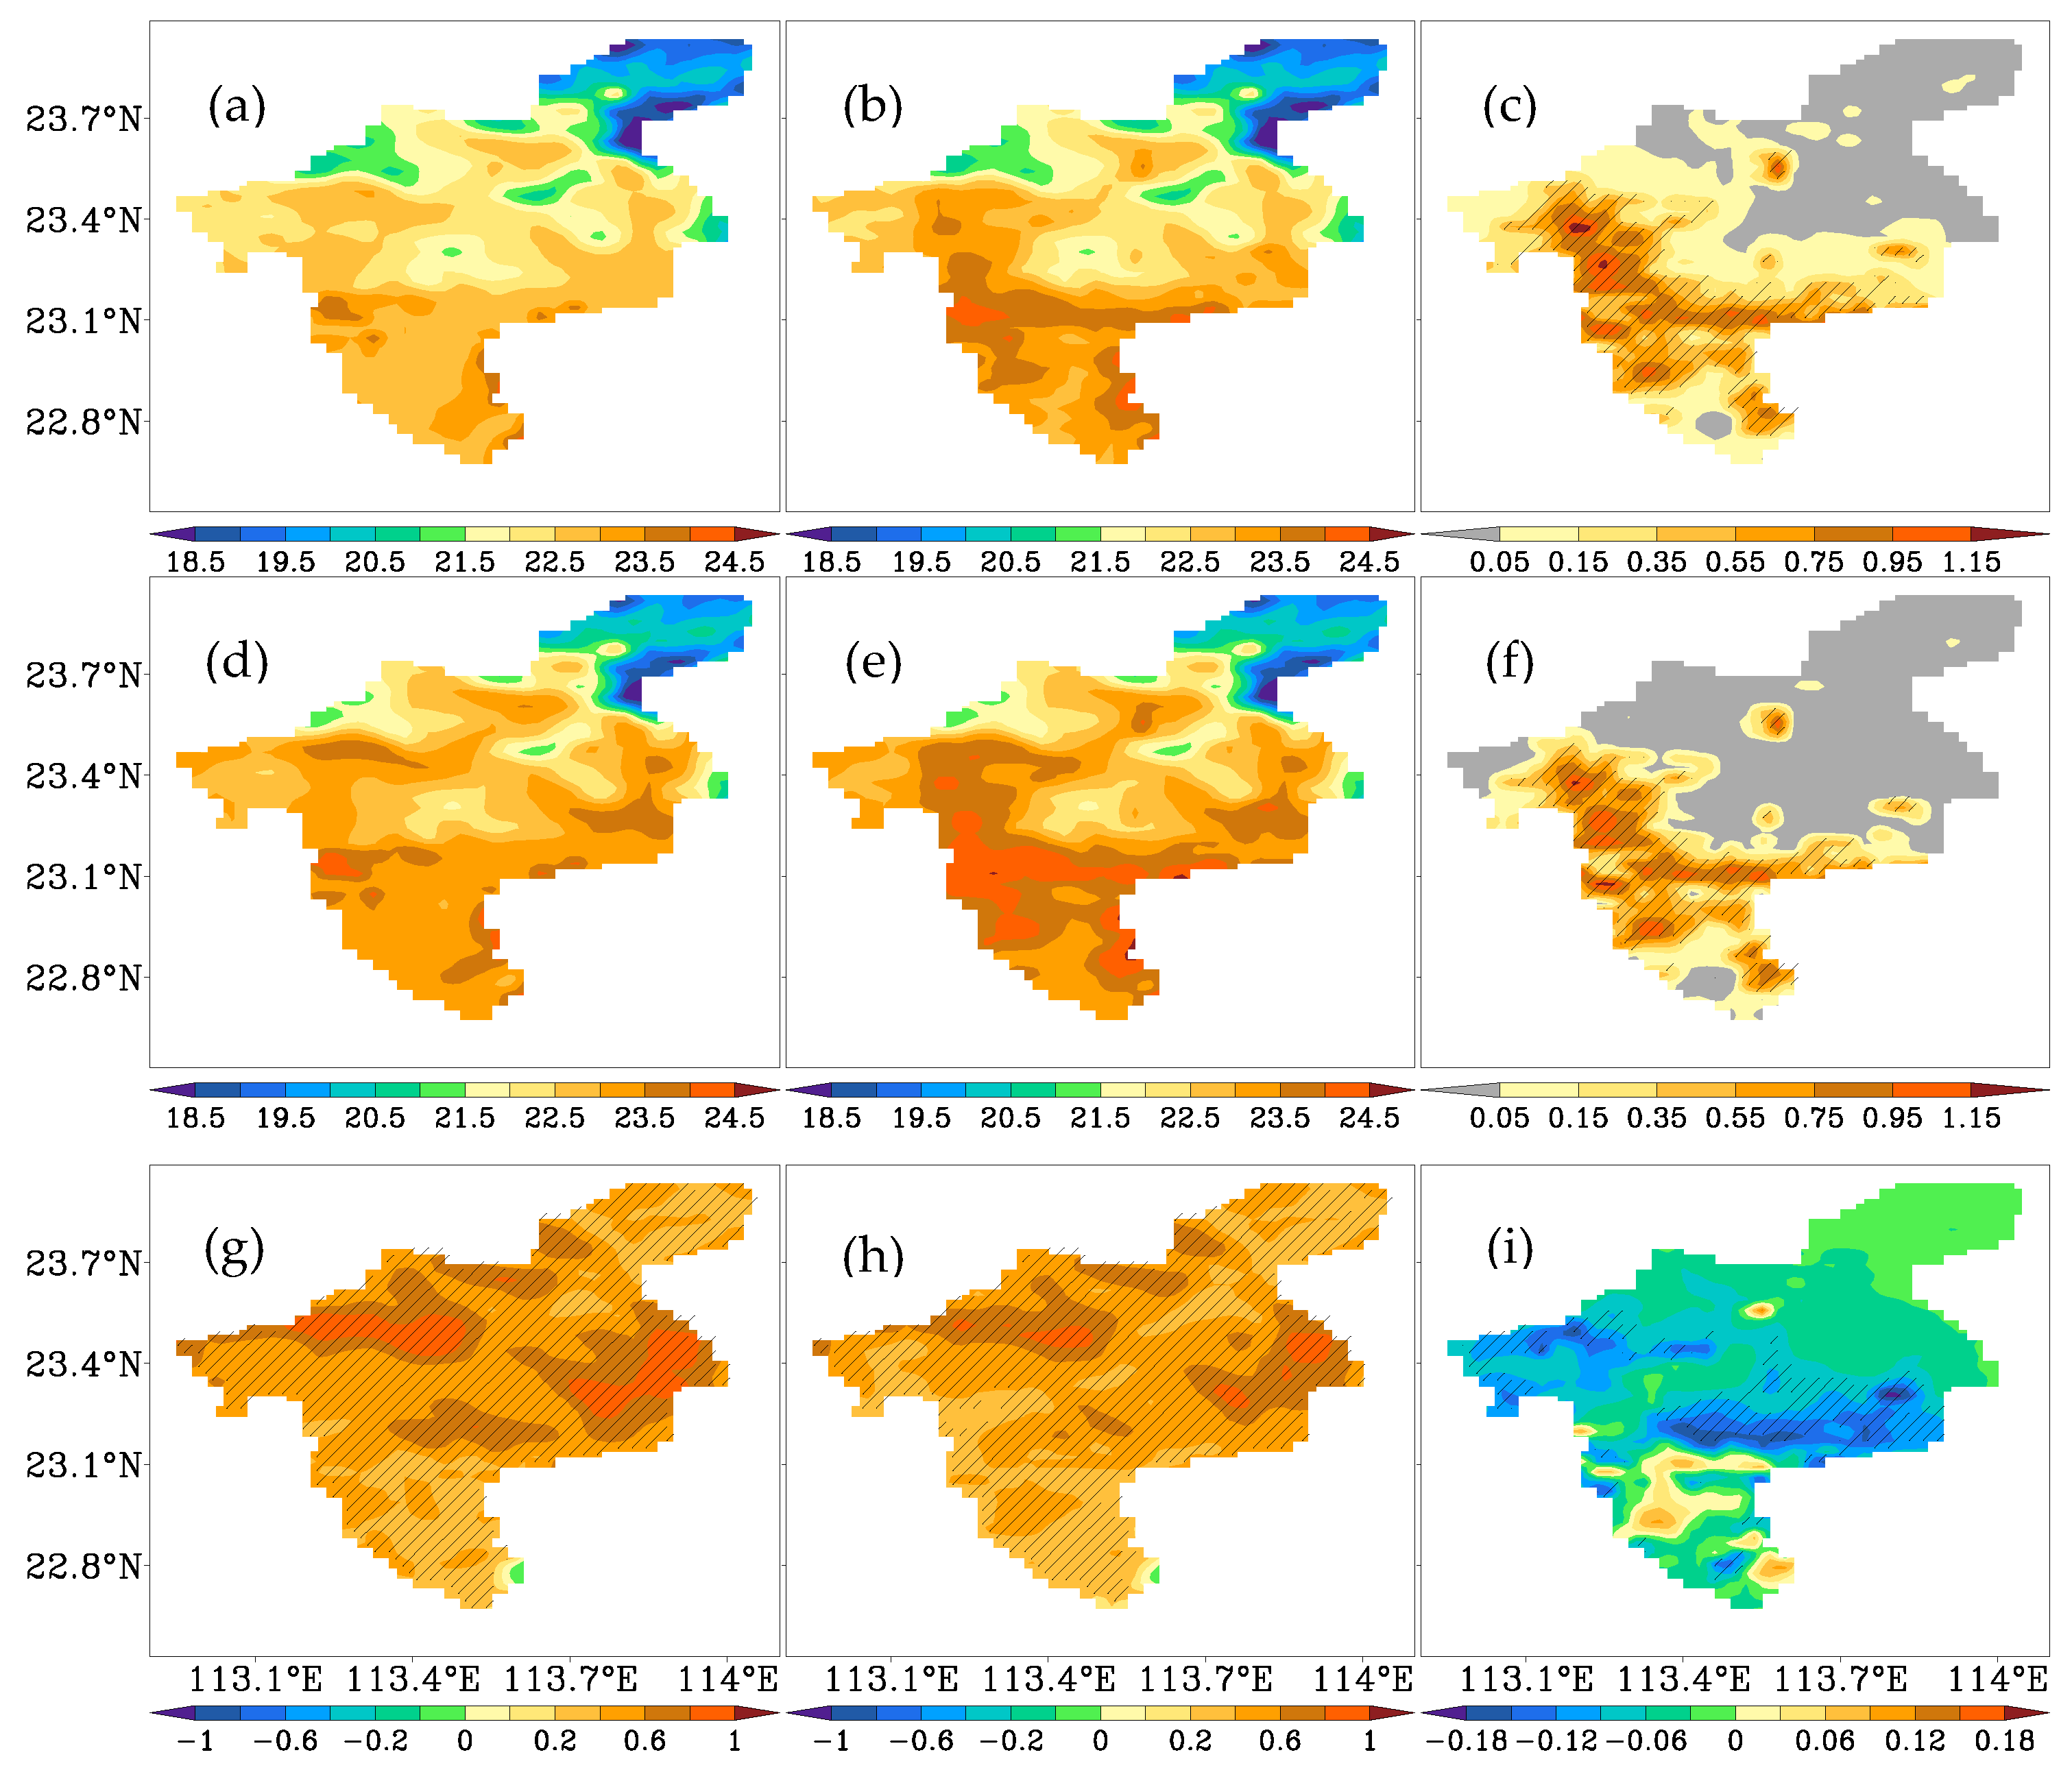
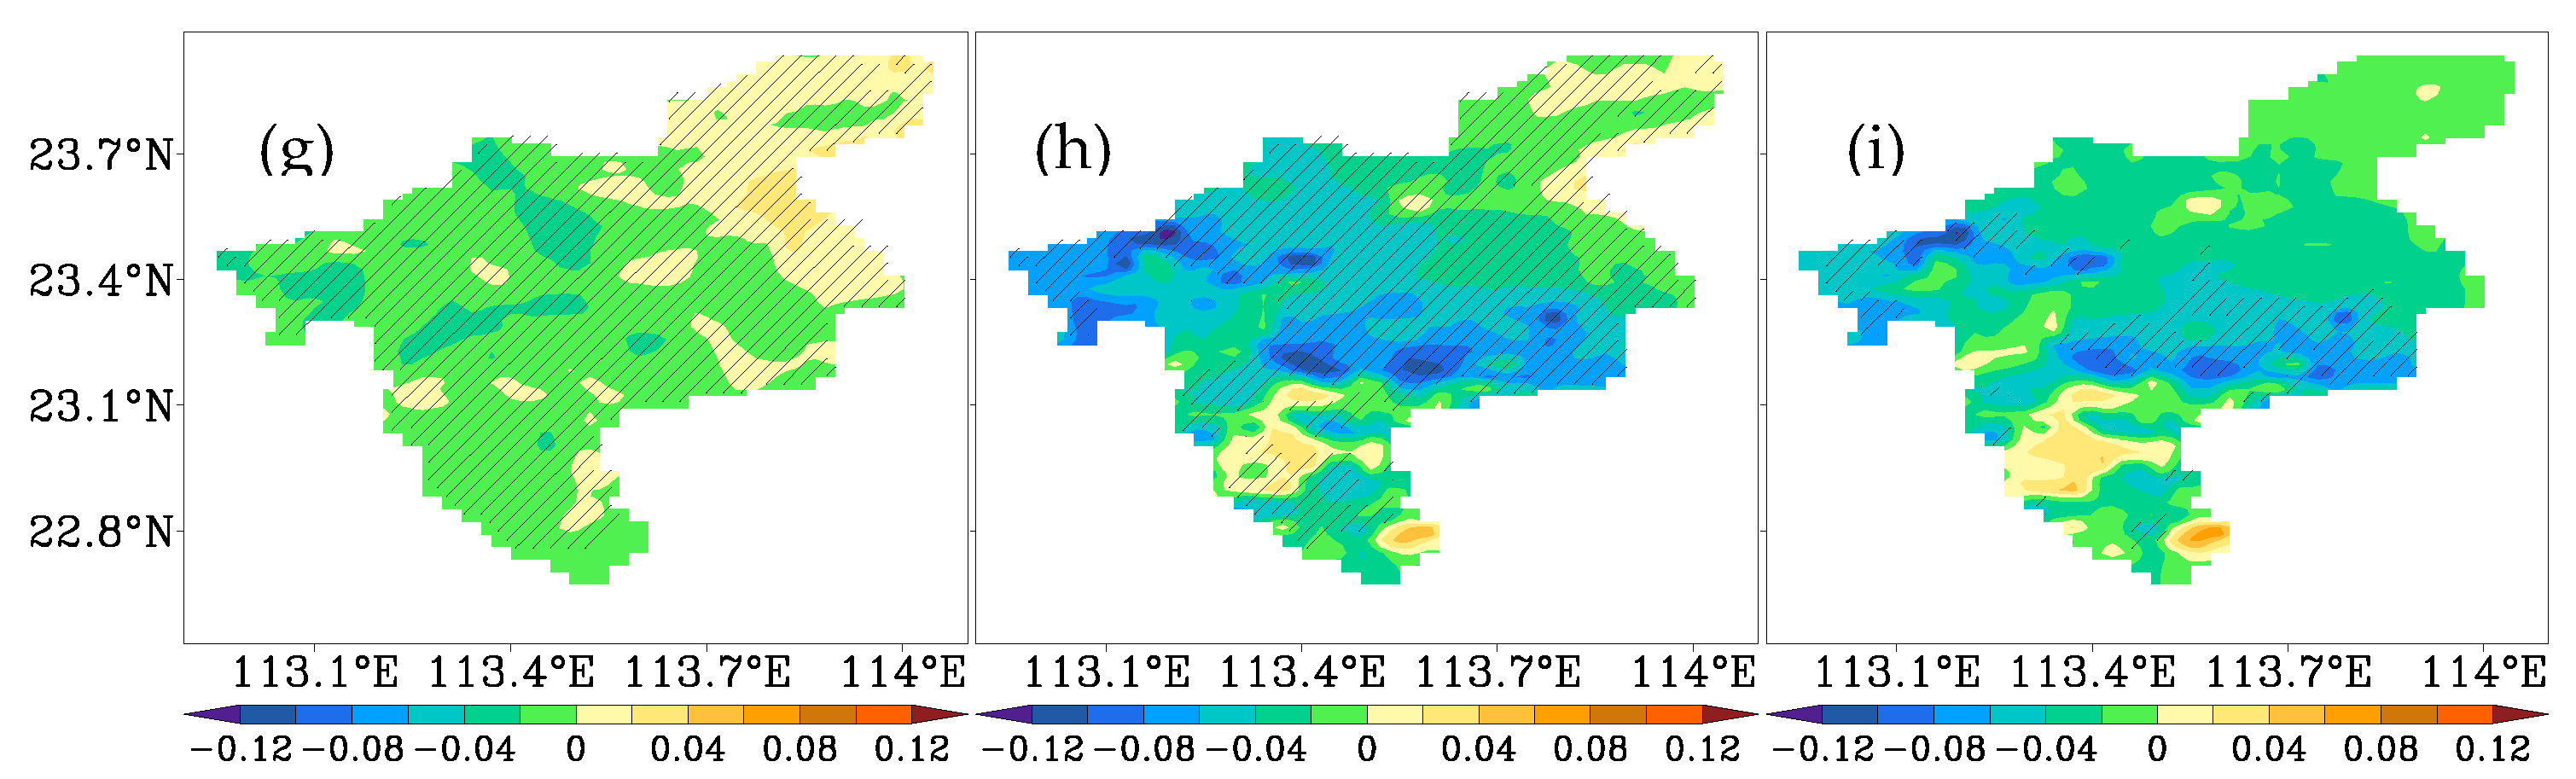
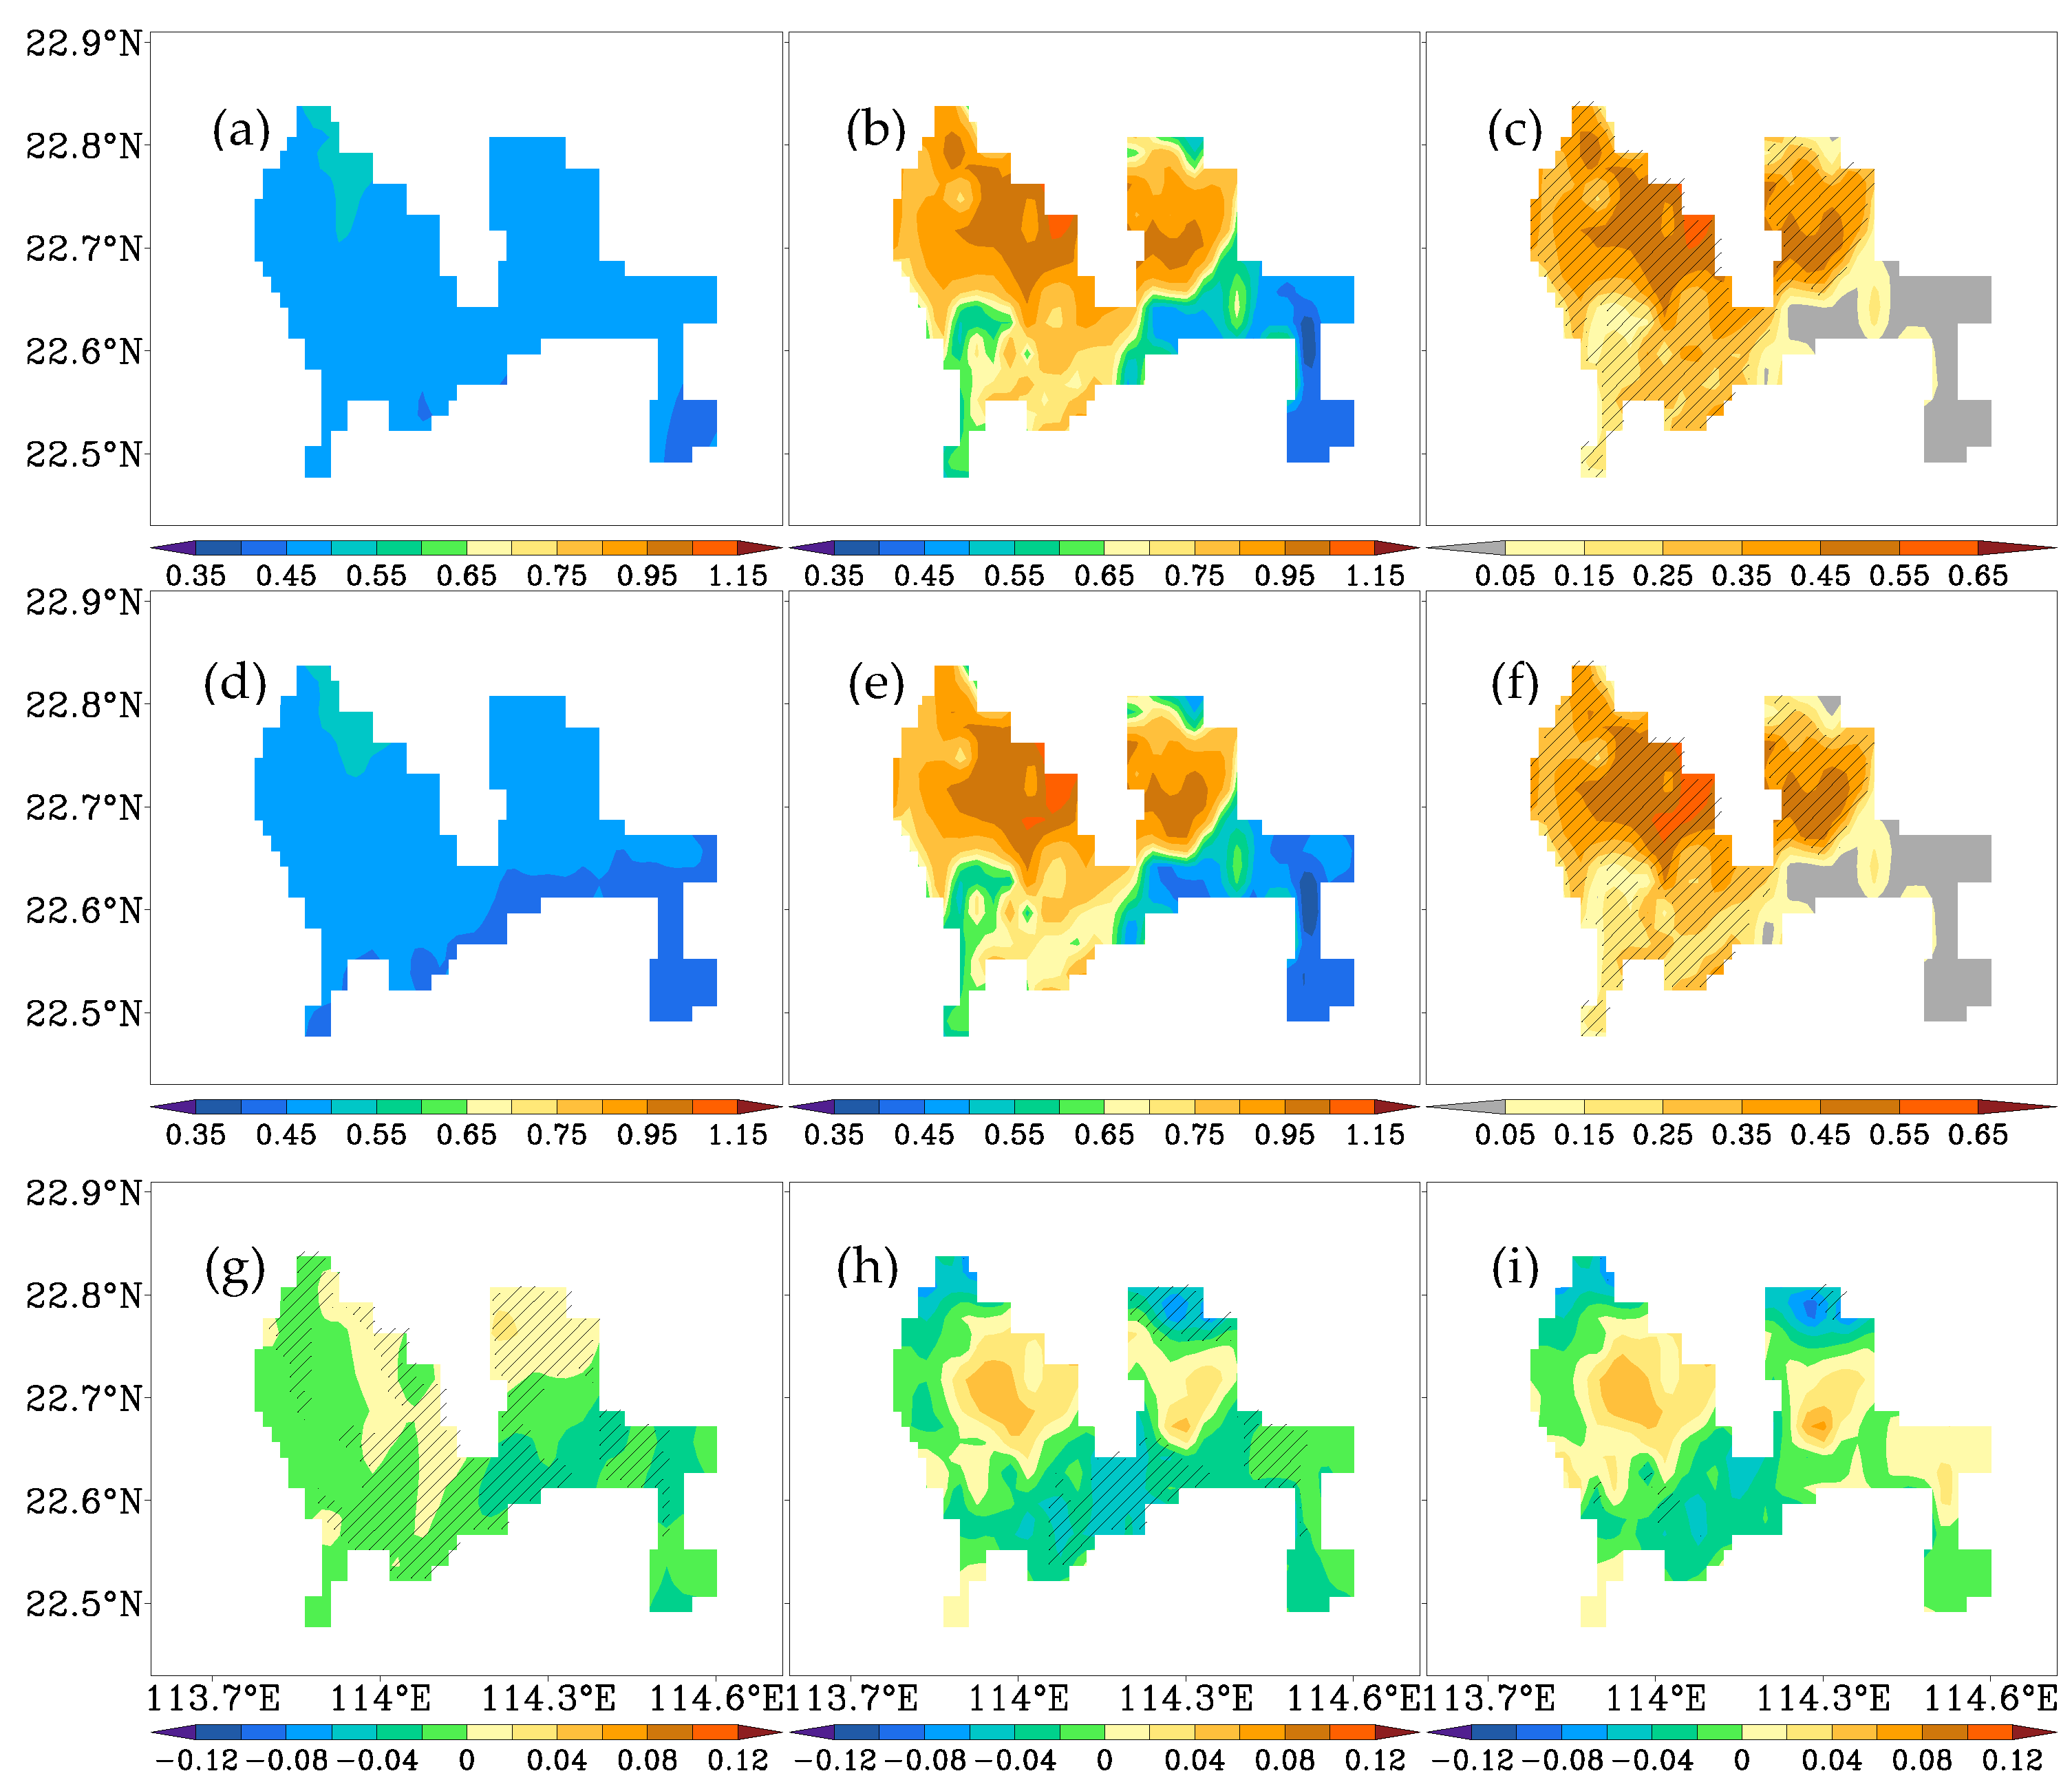
3.2. Spatial Differences and Trends in Annual Mean SAT

Annual mean SAT, differing trends under EX1 and EX2, and corresponding differences (EX2 minus EX1) calculated using different methods (T4, Txn, and Tc) for 1980 and 2016 over Guangzhou/Shenzhen show similar spatial distributions (Figure 3, Figure 4, Figure 5 and Figure 6 and Figures S1–S4). Among these results, the values calculated using T4 and Tc are closer. The weak differences between the values calculated using Tc and T4 (T4 minus Tc) are clearly shown in Figures S1–S4. The differences in annual mean SAT between Tc and T4 under EX1 and EX2, and the warming differences between EX1 and EX2, as well as the corresponding values for the trends under EX1 and EX2, and the differences for the urban-related warming contributions between EX1 and EX2, do not pass the 90% confidence level significance t-tests. Therefore, only the annual mean SAT, the trends calculated using T4 and Txn for 1980 and 2016, and their corresponding differences are discussed in detail.

3.2.1. Annual Mean SAT

Spatial distributions of annual mean SAT under EX1 (Figure 3a and Figure 4a) and EX2 (Figure 3b and Figure 4b) for 1980 and 2016 and the warming between EX1 and EX2 (Figure 3c and Figure 4c) calculated using T4 are similar to those calculated using Txn (Figure 3d–f and Figure 4d–f) over both Guangzhou (Figure 3) and Shenzhen (Figure 4). Of these, only the warming mainly located over the southwestern part of Guangzhou passes the 90% confidence level significance t-tests (Figure 3c,f), whereas the warming occurs across nearly the entire Shenzhen area (Figure 4c,f), excluding the areas over the southeastern past of Shenzhen. Annual mean SAT values calculated using Txn are larger than those calculated using T4 (Txn minus T4) under EX1 (Figure 3g and Figure 4g) and EX2 (Figure 3h and Figure 4h) across the entire Guangzhou (Figure 3g–h) and Shenzhen (Figure 4g–h) areas, excluding the northwestern areas under EX2 over Shenzhen. In comparison, the 37-year averaged warming calculated using T4 is weaker than that calculated using Txn over Guangzhou (Figure 3i) and Shenzhen (Figure 4i), excluding over the middle-northern areas of Shenzhen, whereas significant differences only appear in southeastern and northwestern Guangzhou.

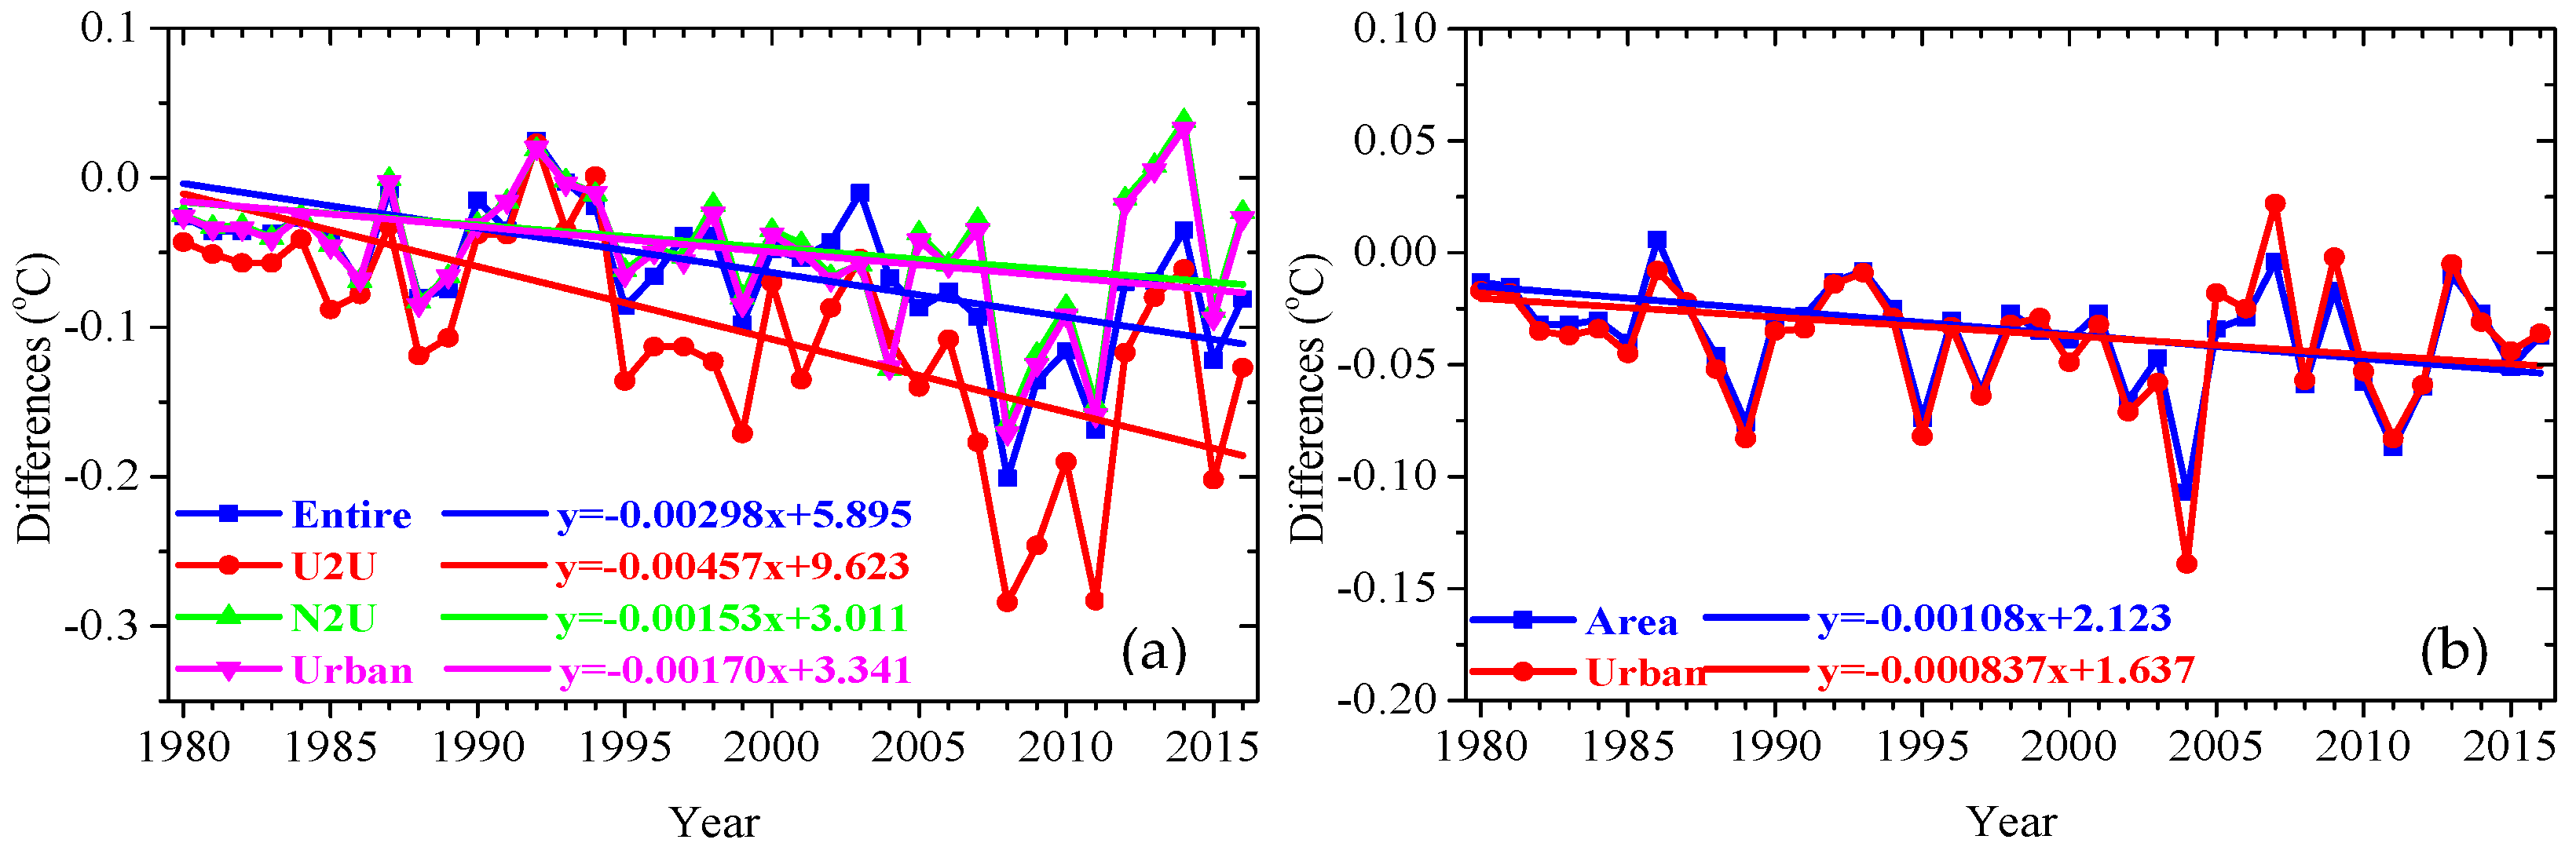
3.2.2. Trends in Annual Mean SAT

Spatial distributions of the trends under EX1 (Figure 5a and Figure 6a) and EX2 (Figure 5b and Figure 6b) for 1980 and 2016, and the urban-related warming contributions between EX1 and EX2 (Figure 5c and Figure 6c) calculated using T4, are similar to those calculated using Txn (Figure 5d–f and Figure 6d–f) over both Guangzhou (Figure 5) and Shenzhen (Figure 6). The urban-related warming is mainly located over southwestern Guangzhou (passing the 90% confidence level significance t-tests, Figure 5c,f), whereas the urban-related warming covers the entirety of Shenzhen, excluding the southeastern part (Figure 6c,f). The trends calculated using Txn are generally smaller than those calculated using T4 across the entire Guangzhou (Figure 5g–h) and Shenzhen (Figure 6g–h) areas under EX1 (Figure 5g and Figure 6g), excluding areas in northeastern Guangzhou, and EX2 (Figure 5h and Figure 6h), excluding middle-northern areas of Shenzhen. The urban-related warming contributions calculated using Txn are generally weaker than those calculated using T4 over both Guangzhou (Figure 5i) and Shenzhen (Figure 6i), excluding the middle-northern areas over Shenzhen.

3.3. Time Series Differences in Annual Mean SAT and Trends

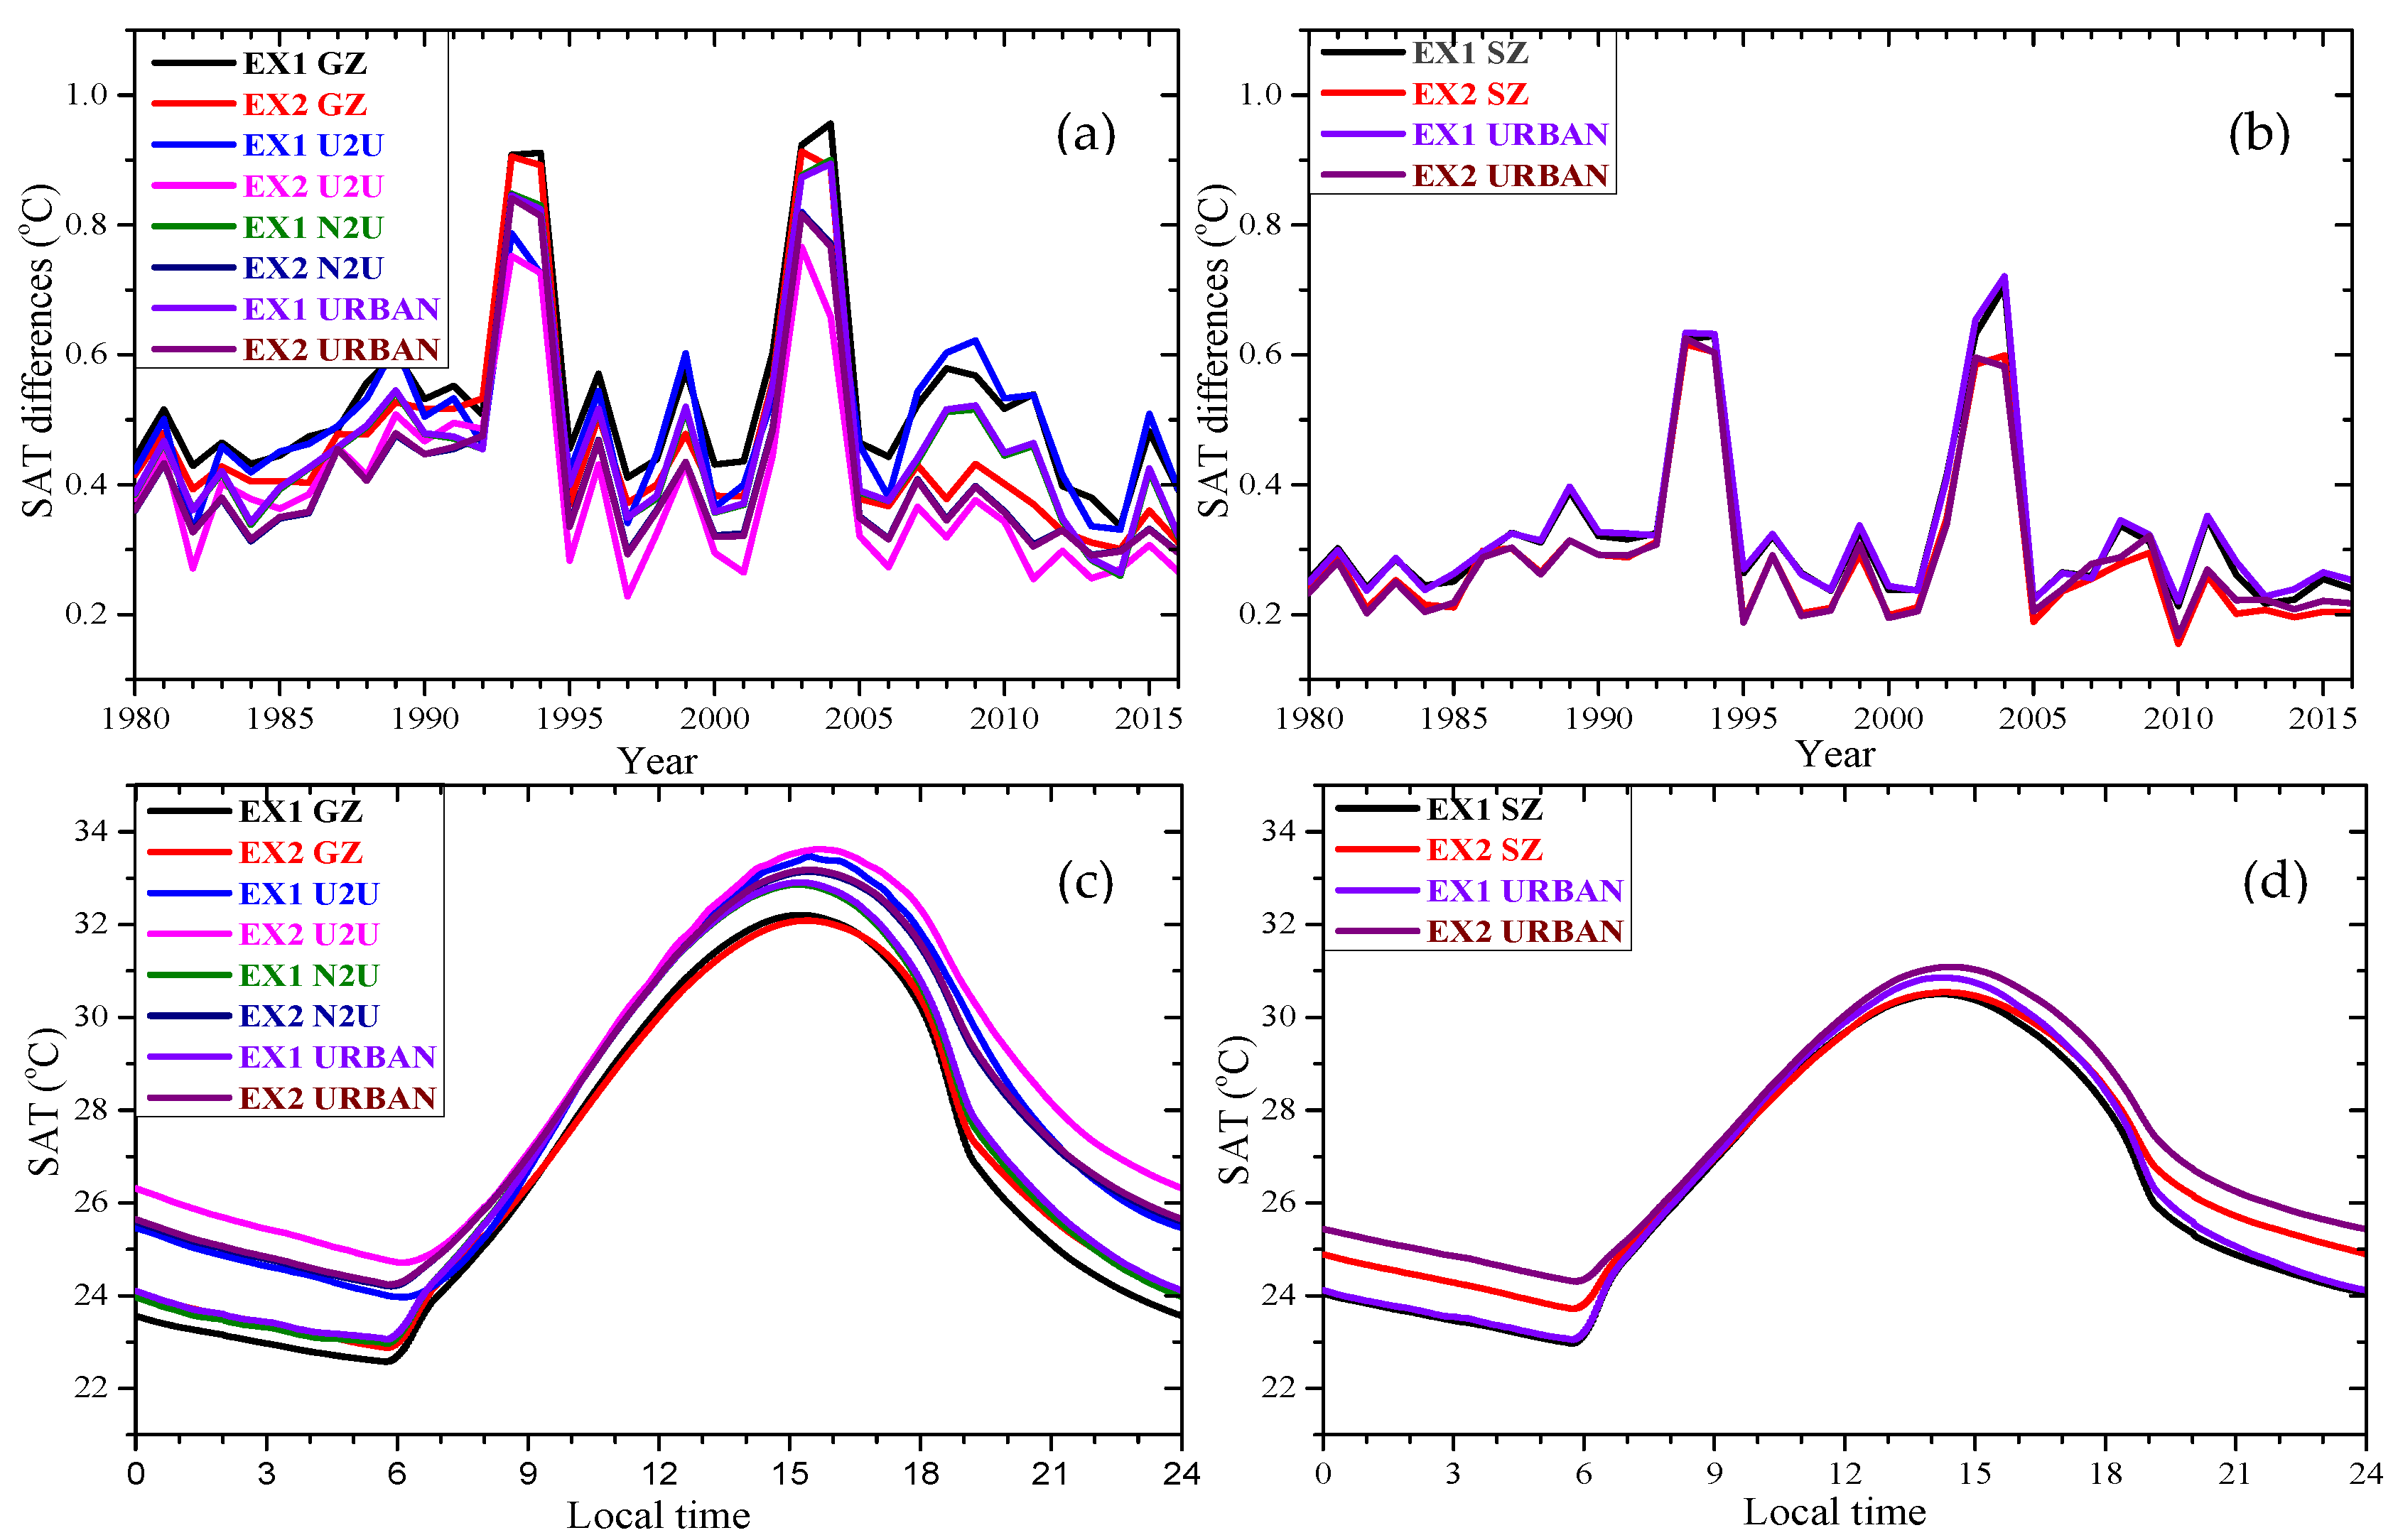
3.3.1. Annual Mean SAT

Differences in annual mean SAT calculated using T4, Txn, and Tc under EX1 and EX2, and the warming differences over subregions of Guangzhou and Shenzhen, are provided in Table 2. Differences in 37-year annual mean SAT calculated using T4 and Txn that run between 0.41~0.53 °C under EX1 and EX2 over the subregions of Guangzhou (the entire, U2U, N2U, and urban areas), and between 0.29~0.34 °C under EX1 and EX2 over the subregions of Shenzhen (the entire and urban areas), generally pass the 99% confidence level significance t-tests. The exceptions are over the N2U areas of Guangzhou under EX2 and the entire areas of Shenzhen under EX2 (passing the 95% confidence level significance t-tests). The corresponding differences calculated using Tc and T4 are quite small (only passing the 80% confidence level significance t-tests over the U2U areas of Guangzhou under EX1). The warming differences calculated using T4 and Txn, Tc, and T4 were also quite small.

3.3.2. Trends in Annual Mean SAT

The trends in annual mean SAT calculated using T4, Txn, and Tc for EX1 and EX2, and the urban-related warming contributions over the subregions of Guangzhou and Shenzhen, are provided in Table 3. The urban-related warming contributions calculated using T4, Txn, and Tc generally pass the 99% confidence level significance t-tests over the N2U and urban areas of Guangzhou and the entire (excluding using Txn) and urban areas of Shenzhen. In comparison, the urban-related warming contributions only pass the 95% confidence level significance t-tests over the U2U areas of Guangzhou (excluding using Txn) or 80% confidence level significance t-tests over the entire and U2U (Txn only) areas of Guangzhou. The differences over the U2U areas are largest over different subregions of Guangzhou.

Trends and Urban-Related Warming Between T4, Txn, and Tc

For the entire and urban areas of Shenzhen, and the N2U and urban areas of Guangzhou, the trends under EX1 calculated using T4, Txn, and Tc are close, whereas the corresponding values under EX2 calculated using Tc are larger than those calculated using T4 and Txn, which induce the largest values for urban-related warming contributions calculated using Tc. However, the trends under EX1 calculated using T4 are smaller than those calculated using Tc over the entire and U2U areas of Guangzhou. The changing trends under EX2 calculated using T4 are larger than those calculated using Tc, which results in larger values for the urban-related warming contributions calculated using T4.
Comparing the trends and urban-related warming contributions indicates that performances are similar over the N2U and urban areas of Guangzhou, and the entire and urban areas of Shenzhen. The largest trend values are found under both EX1 and EX2 and the urban-related warming contributions calculated using Tc, while the smallest values result from using Txn. For the entire and U2U areas of Guangzhou, the smallest values for the trends under both EX1 and EX2 and the corresponding urban-related warming contributions appear when calculated using Txn. However, the trends under EX1 calculated using Tc are larger than those calculated using T4, whereas the trends under EX2 calculated using Tc are smaller than those calculated using T4, which results in the largest urban-related warming contributions calculated using T4. The trends and urban-related warming calculated using T4 and Txn are discussed in detail in the following.

Comparison of T4 and Txn: Trends and Urban-Related Warming

Trends in annual mean SAT calculated using Txn are generally smaller than those calculated using T4 under both EX1 and EX2 over different subregions of Guangzhou/Shenzhen. Urban-related warming contributions calculated using Txn are also smaller than those calculated using T4, which is consistent with the negative values for differences in trends under EX1 and EX2 and the differences in urban-related warming contributions calculated using T4 and Txn (Figure 5 and Figure 6). The trends under EX1 and EX2 and urban-related warming contributions over the entire/U2U areas and N2U/ urban areas of Guangzhou were close; of these, marked differences are identified between the former and latter. However, the trends under EX1 and EX2 and urban-related warming contributions are close over the entire and urban areas of Shenzhen due to rapid urban surface expansion from a small village to a metropolis (Figure 2f–j). For the results calculated using T4 and Txn, the evaluated urban-related warming contributions are close over different subregions of Guangzhou and Shenzhen, excluding over the entire and U2U areas of Guangzhou.
Larger differences in urban-related warming contributions over the U2U areas of Guangzhou are further interpreted using the time series of differences in urban-related warming between T4 and Txn and the corresponding trends over different subregions of Guangzhou (Figure 7a). Differences are identified in annual mean SAT calculated using T4 and Txn; however, the largest differences are found over the U2U areas in different subregions of Guangzhou, which indicates that the differences in urban-related warming between T4 and Txn over the U2U areas are larger than those over other subregions of Guangzhou, especially during intense urban-surface-expansion periods between 2000 and 2016. Differences are also detected in annual mean SAT calculated using T4 and Txn over different subregions of Shenzhen (Figure 7b), whereas the differences over the urban areas are similar to those over the entire areas of Shenzhen for the whole time series.
Notably, the time series of differences in urban-related warming and the corresponding trends over the subregions of Guangzhou and Shenzhen calculated using T4 and Txn (Figure 7) display the largest trend (−0.0457 °C/decade) over the U2U areas of Guangzhou, whereas there are smaller values over subregions of Shenzhen and other subregions of Guangzhou. These results show that the differences in urban-related warming contributions over Guangzhou and Shenzhen with daily mean SAT calculated using different methods are primarily over the U2U areas, whereas the differences are much smaller over areas with urban-surface-expansion influenced areas.

3.4. Differences in Trends of Tmax and Tmin

3.4.1. Comparing Trends for Tmax and Tmin

The trends for Tmax and Tmin under EX1 and EX2, and the corresponding differences for Tmax, Tmin, and daily temperature range (DTR) over the subregions of Guangzhou/Shenzhen, are shown in Table 4. While the trends in Tmax are larger than those of Tmin under EX1, the trends in Tmax are smaller than those of Tmin under EX2. These characteristics result in differences between EX1 and EX2 for Tmax that are much smaller than those of Tmin, which is expressed by the negative differences for the changing trends of DTR between EX1 and EX2 (figures omitted).
The differences in trends for Tmax between EX1 and EX2 (less than 0.064 °C/decade) are smaller than those of Tmin (0.18–0.79 °C/decade) over different subregions of Guangzhou and Shenzhen. The differences in trends for Tmin over the entire and urban areas of Shenzhen are close (0.51 and 0.73 °C/decade, respectively), because the region experienced intense urban surface expansion from a small village with nearly no urban surface in the 1980s to the present city. In comparison, differences in trends for Tmin over the entire (0.18 °C/decade) and U2U (0.23 °C/decade) areas of Guangzhou were much smaller than those over the corresponding N2U (0.79 °C/decade) and urban (0.77 °C/decade) areas. Marked differences in the trends between entire/U2U and N2U/urban areas are identified and indicate that the impacts of different urban-surface-expansion on the diurnal cycle of SAT might play an important role in the varying trends over different subregions, especially during intense urban-surface-expansion periods.

3.4.2. Tmax Trends

The time series of annual mean Tmax under EX1 and EX2 and corresponding trends are shown in Figures S5 and S6. The trends for EX1 are in agreement between different subregions; of which, urban-related warming accounted for 0.64%, 4.9%, 0.84%, and −2.5% over the entire, U2U, N2U, and urban areas of Guangzhou, and 1.2% and 0.0% of total warming over the entire and urban areas of Shenzhen, respectively. The contributions were negative and quite small.

3.4.3. Tmin Trends

Time series of annual mean Tmin for EX1 and EX2 and the corresponding trends are shown in Figures S5 and S6. As shown, the trends for EX1 are in agreement between different subregions. The trends for EX2 are much larger over the N2U (1.28 °C/decade) and urban (1.26 °C/decade) areas than those over the entire (0.65 °C/decade) and U2U (0.69 °C/decade) areas of Guangzhou. In comparison, the corresponding values over the entire (0.93 °C/decade) and urban (1.15 °C/decade) areas of Shenzhen are in better agreement. These distributions contributed to a trend of 0.18~0.79 °C/decade over the subregions of Guangzhou and 0.51~0.73 °C/decade over the subregions of Shenzhen. Of these, the urban-related warming accounted for 27.2%, 32.7%, 61.9%, and 55.1% of total warming for the former, while 61.0% and 63.8% of total warming for the latter.

4. Discussions

Differences in annual mean SAT and urban-related warming between T4 and Txn, and the corresponding trends, are further interpreted in Figure 8. The differences in annual mean SAT between T4 and Txn under EX1 are generally larger than those under EX2 over different subregions of Guangzhou, among which the values under EX1 and EX2 over the U2U areas are the largest, especially during periods with intense urban-surface-expansion between 2000 and 2016 (Figure 8a). These distributions result in a larger negative value for the trend differences between T4 and Txn over the U2U areas. The distances for annual mean SAT differences from T4 and Txn between EX1 and EX2 increase due to urban surface expansion, especially over the U2U areas of Guangzhou. The differences in annual mean SAT between T4 and Txn under EX1 are close to those under EX2 over different subregions of Shenzhen due to rapid urban surface expansion from a small village to a metropolis (Figure 8b). The differences in annual mean SAT calculated using T4 and Txn are attributed to nonlinear or asymmetric variations with time for the diurnal cycle of SAT [27,28]. The varied performance in the changes in annual mean SAT over different subregions is further expressed by urban-surface-expansion-induced changes in the diurnal cycle due to the asymmetric warming (Figure 8c,d).

5. Conclusions

Daily mean SATs calculated using different methods and their impacts on evaluating urban-related warming were explored using the nested WRF regional climate model at a 30-10-3.3 km spatial resolution. The 3.3 km resolution was adopted for the three city clusters (BTH, YRD, and PRD) over eastern China. Two numerical experiments were performed based on the fixed-in-time land use data in the 1980 (EX1) and reconstructed annual land use data displaying urban surface expansion during 1980 and 2016 (EX2), respectively. Two cities in the PRD area, Guangzhou and Shenzhen, which display different urban-surface-expansion and similar climate contexts, were selected to compare annual mean SAT and trends calculated using T4 and Txn for both spatial distributions and time series.
For the entire areas of Guangzhou and Shenzhen between 1980 and 2016, similar spatial distributions were found for annual mean SAT calculated using different methods. However, the 37-year averaged SAT under EX1 and EX2 calculated using Txn was larger than that calculated using T4, for which the differences in annual mean SAT between T4 and Txn over the entire and subregions of Guangzhou (between 0.41 and 0.53 °C) were larger than those over the entire and urban areas of Shenzhen (between 0.29 and 0.34 °C). The 37-year averaged warming calculated using Txn was smaller than that calculated using T4 over Guangzhou, whereas the averaged warming calculated using Txn was not consistently smaller than that calculated using T4 over Shenzhen. The differences in annual mean SAT calculated using T4 and Txn are attributed to nonlinear or asymmetric variations with time for the diurnal cycle of SAT.
The trends of annual mean SAT under EX1 and EX2, and the urban-related warming calculated using Txn, were generally smaller than those calculated using T4 over the entire areas and subregions of Guangzhou and Shenzhen. Differences in trends between T4 and Txn are interpreted as a strong trend for Tmin and a weak one for Tmax, which is also shown by the negative differences for the trends of DTR between EX1 and EX2 and then mitigated the trend for Txn.
Due to the rapid urban surface expansion, differences in annual mean SAT and urban-related warming contributions between T4 and Txn were small over the entire and urban areas of Shenzhen, and the N2U and urban areas of Guangzhou. However, the differences over the entire and U2U areas of Guangzhou were larger, especially for U2U areas during periods with intense urban surface expansion between 2000 and 2016. The larger differences in annual mean SAT, trends, and urban-related warming over U2U areas of Guangzhou are interpreted as urban-surface-expansion-induced varied changes in the diurnal cycle due to asymmetric warming during the daytime and nighttime over different subregions.
While differences in urban-related warming contributions might be small over Guangzhou and Shenzhen, annual mean SAT and trends calculated using different methods significantly varied, representing an effect that should be studied during future climate change investigations. Furthermore, errors between the observed values and simulated results due to systematic errors from both the model and driving data are sure to impact urban-related warming evaluations. Therefore, more investigations are warranted to address this shortcoming.

Supplementary Materials

The following are available online at https://www.mdpi.com/2073-4433/10/2/48/s1, Figure S1: Spatial distributions of (a–c) annual mean SAT (units: °C) and (d–f) the changing trends (units: °C/decade) calculated using Tc under (a,d) EX1 and (b,e) EX2, and (c,f) the corresponding differences (EX2 minus EX1) over Guangzhou. (Oblique line denotes passing the 90% confidence level significance t-tests), Figure S2: Spatial distributions of (a–c) annual mean SAT (units: °C) and (d–f) the changing trends (units: °C/decade) calculated using Tc under (a,d) EX1 and (b,e) EX2, and (c,f) the corresponding differences (EX2 minus EX1) over Shenzhen. (Oblique line denotes passing the 90% confidence level significance t-tests), Figure S3: Spatial distributions of the differences for (a–c) annual mean SAT (units: °C) and (d,f) urban-related warming contributions (units: °C/decade) calculated using Tc and T4 (T4 minus Tc) under (a,d) EX1, (b,e) EX2, and (c,f) the corresponding differences (EX2 minus EX1) over Guangzhou. (Oblique line denotes passing the 90% confidence level significance t-tests), Figure S4: Spatial distributions of the differences for (a–c) annual mean SAT (units: °C) and (d,f) urban-related warming contributions (units: °C/decade) calculated using Tc and T4 (T4 minus Tc) under (a,d) EX1, (b,e) EX2, and (c,f) the corresponding differences (EX2 minus EX1) over Shenzhen. (Oblique line denotes passing the 90% confidence level significance t-tests), Figure S5: Time series of annual mean (a,c,e,g) Tmax and Tmin, and the changing trends over the subregions of Guangzhou (a,b: the entire areas; c,d: U2U areas; e,f: N2U areas; g,h: urban areas) for EX1 and EX2, Figure S6: Time series of annual mean (a,c) Tmax and (b,d) Tmin, and trends over different subregions of Shenzhen (a,b: the entire areas, c,d: urban areas) for EX1 and EX2.

Author Contributions

Conceptualization, D.Z; Methodology, D.Z and J.W.; Data curation, D.Z.; Writing—original draft preparation, D.Z.; Writing—review and editing, D.Z and J.W.; Visualization, D.Z.

Funding

This research was funded by the National Key R&D Program of China under grant no. 2018YFA0606004; the National Natural Science Foundation of China under grant no. 41775087, 41675149, and 41530532; the Chinese Academy of Sciences Strategic Priority Program under grant no. XDA05090206; the National Key Basic Research Program on Global Change under grant no. 2011CB952003; and the Jiangsu Collaborative Innovation Center for Climatic Change. The authors thank the reviewers for their numerous valuable comments to improve the manuscript.

Conflicts of Interest

The authors declare no conflict of interest. The funders had no role in the design of the study; in the collection, analyses, or interpretation of data; in the writing of the manuscript, or in the decision to publish the results.

References

  1. Zhou, B.Z.; Gu, L.H.; Ding, Y.H.; Shao, L.; Wu, Z.M.; Yang, X.S.; Li, C.Z.; Li, Z.C.; Wang, X.M.; Cao, Y.H.; et al. The great 2008 Chinese ice storm: Its socioeconomic-ecological impact and sustainability lessons learned. Bull. Am. Meteorol. Soc. 2011, 92, 47–60. [Google Scholar] [CrossRef]
  2. Qian, X.; Miao, Q.L.; Zhai, P.M.; Chen, Y. Cold-wet spells in mainland China during 1951–2011. Nat. Hazards 2014, 74, 931–946. [Google Scholar] [CrossRef]
  3. Zhao, Y.C.; Zhao, X.F.; Liu, L.L. Spatial pattern analysis on human health risk of heatwave in Xiamen City. J. Geo-Info. Sci. 2016, 18, 1094–1102. [Google Scholar]
  4. Karl, T.R.; Diaz, H.F.; Kukla, G. Urbanization: Its detection and effect in the United States climate record. J. Clim. 1988, 1, 1099–1123. [Google Scholar] [CrossRef]
  5. Arnfield, A.J. Two decades of urban climate research: A review of turbulence, exchanges of energy and water, and the urban heat island. Int. J Climatol. 2003, 23, 1–26. [Google Scholar] [CrossRef]
  6. Ren, G.Y.; Zhou, Y.; Chu, Z.; Zhou, J.; Zhang, A.; Guo, J.; Liu, X. Urbanization effects on observed surface air temperature trends in north China. Nisam sigurna da je ovo dobra skracenica, ali nisam ni nasla drugu 2008, 21, 1333–1348. [Google Scholar] [CrossRef]
  7. Zhao, D.M.; Wu, J. The Influence of urban surface expansion in China on regional climate. J. Clim. 2017, 30, 1061–1080. [Google Scholar] [CrossRef]
  8. Zhao, D.M.; Wu, J. Contribution of urban surface expansion to regional warming in Beijing, China. J. Appl. Meteorol. Climatol. 2017, 56, 1551–1559. [Google Scholar] [CrossRef]
  9. Miller, A.A. Climatology, 8th ed.; Methuen and Co. Ltd.: London, UK, 1953; 318p. [Google Scholar]
  10. Pielke, R.A.; Davey, C.A.; Niyogi, D.; Fall, S.; Steinweg-Woods, J.; Hubbard, K.; Lin, X.; Cai, M.; Lim, Y.K.; Li, H. Unresolved issues with the assessment of multidecadal global land surface temperature trends. J. Geophys. Res. Atmos. 2007, 112, D16113. [Google Scholar] [CrossRef]
  11. China Meteorological Administration. Specifications for Surface Meteorological Observation Part 6: Measurement of Air Temperature and Humidity; QX/T 50-2007; China Meteorol. Press: Beijing, China, 2007; 14p. (In Chinese) [Google Scholar]
  12. Wang, K.C. Sampling biases in datasets of historical mean air temperature over land. Sci. Rep. 2014, 4, 4637. [Google Scholar] [CrossRef]
  13. Austin, J.F.; McConnell, A. James Six F.R.S. Two Hundred years of the six’s self-registering thermometer. Notes Rec. R. Soc. 1980, 35, 49–65. [Google Scholar]
  14. Vose, R.S.; Easterling, D.R.; Gleason, B. Maximum and minimum temperature trends for the globe: an update through 2004. Geophys. Res. Lett. 2005, 32, L23822. [Google Scholar] [CrossRef]
  15. Kalnay, E.; Cai, M. Impact of urbanization and land use change on climate. Nature 2003, 423, 528–531. [Google Scholar] [CrossRef] [PubMed]
  16. Howard, L. Climate of London deduced from meteorological observation. Harvey Darton 1833, 1, 1–24. [Google Scholar]
  17. Duckworth, F.A.; Sandberg, J.S. The effect of cities upon horizontal and vertical temperature gradients. Bull. Am. Meteorol. Soc. 1954, 35, 198–207. [Google Scholar] [CrossRef]
  18. Oke, T.R. Boundary Layer Climate; Great Britain at the University Press: Cambridge, UK, 1987; pp. 1–3. [Google Scholar]
  19. Yan, Z.W.; Wang, J.; Xia, J.J.; Feng, J.M. Review of recent studies of the climatic effects of urbanization in China. Adv. Clim. Change Res. 2016, 7, 154–168. [Google Scholar] [CrossRef]
  20. Masson, V. Urban surface modeling and the meso-scale impact of cities. Theor. Appl. Climatol. 2006, 84, 35–45. [Google Scholar] [CrossRef]
  21. Ooka, R. Recent development of assessment tools for urban climate and heat island investigation especially based on experience in Japan. Int. J. Climatol. 2007, 27, 1919–1930. [Google Scholar] [CrossRef]
  22. Skamarock, W.C.; Klemp, J.B.; Dudhia, J.; Gill, D.O.; Barker, D.M.; Duda, M.G.; Huang, X.Y.; Wang, W.; Powers, J.G. A Description of the advanced research WRF version 3. NCAR Tech. Note 2008. NCAR/TN–475+STR. [Google Scholar] [CrossRef]
  23. Jia, G.; Xu, R.; Hu, Y.; He, Y. Multi-scale remote sensing estimates of urban fractions and road widths for regional models. Clim. Chang. 2014, 129, 543–554. [Google Scholar] [CrossRef]
  24. Hu, Y.; Jia, G.; Pohl, C.; Feng, Q.; He, Y.; Gao, H.; Xu, R.; van Genderen, J.; Feng, J. Improved monitoring of urbanization processes in China for regional climate impact assessment. Environ. Earth Sci. 2015, 73, 8387–8404. [Google Scholar] [CrossRef]
  25. Kanamitsu, M.; Ebisuzaki, W.; Woollen, J.; Yang, S.-K.; Hnilo, J.J.; Fiorino, M.; Potter, G.L. NCEP-DOE AMIP-II Reanalysis (R-2). Bull. Am. Meteorol. Soc. 2002, 83, 1631–1643. [Google Scholar] [CrossRef]
  26. Zhao, D.M.; Zha, J.L.; Wu, J. Comparisons of urban-related warming for Shenzhen and Guangzhou. Atmos. Ocean. Sci. Lett. 2018, 11, 330–337. [Google Scholar] [CrossRef]
  27. Oke, T.R.; Spronken-Smith, R.A.; Jáuregui, E.; Grimmond, C.S.B. The energy balance of central Mexico City during the dry season. Atmos. Environ. 1999, 33, 3919–3930. [Google Scholar] [CrossRef]
  28. Roth, M.; Oke, T.R.; Emery, W.J. Satellite-derived urban heat islands from three coastal cities and the utilization of such data in urban climatology. Int. J. Remote Sens. 1989, 10, 1699–1720. [Google Scholar] [CrossRef]
Figure 1. (a) Model domain and (bd) terrain height distributions over (a) the simulated domain (D1), (b) PRD (D5), and (c) Guangzhou and (d) Shenzhen cities (units: m).
Atmosphere 10 00048 g001aAtmosphere 10 00048 g001b
Figure 2. Spatial distributions of different land-use categories in (ae) Guangzhou and (fj) Shenzhen in the years of (a,f) 1980, (b,g) 1990, (c,h) 2000, (d,i) 2010, and (e,j) 2016, where red denotes urban surface grid cells. Land use categories are: (1) evergreen needleleaf forest, (2) evergreen broadleaf forest, (3) deciduous broadleaf forest, (4) mixed forests, (5) closed shrublands, (6) open shrublands, (7) woody savannas, (8) grasslands, (9) permanent wetlands, (10) croplands, (11) urban and built-up areas, (12) cropland/natural vegetation mosaic, (13) barren or sparsely vegetated areas, and (14) water. Source: [26].
Atmosphere 10 00048 g002
Figure 3. Spatial distributions of (a,b) T4 and (d,e) Txn, and (g,h) the corresponding differences (Txn minus T4) under (a,d,g) EX1 and (b,e,h) EX2 for 1980 and 2016. (c,f) The 37-year averaged warming for (c) T4 and (f) Txn, and (i) the corresponding differences over Guangzhou (oblique line denotes passing the 90% confidence level significance t-tests, units: °C).
Atmosphere 10 00048 g003
Figure 4. Spatial distributions of (a,b) T4 and (d,e) Txn, and (g,h) the corresponding differences (Txn minus T4) under (a,d,g) EX1 and (b,e,h) EX2 for 1980 and 2016. (c,f) The 37-year averaged warming for (c) T4 and (f) Txn, and (i) the corresponding differences over Shenzhen (oblique line denotes passing the 90% confidence level significance t-tests, units: °C).
Atmosphere 10 00048 g004aAtmosphere 10 00048 g004b
Figure 5. Trends in (a,b) T4 and (d,e) Txn, and (g,h) the corresponding differences (Txn minus T4) under (a,d,g) EX1 and (b,e,h) EX2 for 1980 and 2016. (c,f) The urban-related warming contributions for (c) T4 and (f) Txn, and (i) the corresponding differences over Guangzhou (oblique line denotes passing the 90% confidence level significance t-tests, units: °C/decade).
Atmosphere 10 00048 g005aAtmosphere 10 00048 g005b
Figure 6. Trends in (a,b) T4 and (d,e) Txn, and (g,h) the corresponding differences (Txn minus T4) under (a,d,g) EX1 and (b,e,h) EX2 for 1980 and 2016. (c,f) The urban-related warming contributions for (c) T4 and (f) Txn, and (i) the corresponding differences over Shenzhen (oblique line denotes passing the 90% confidence level significance t-tests, units: °C/decade).
Atmosphere 10 00048 g006
Figure 7. Time series of the differences in urban-related warming between T4 and Txn (Txn minus T4) and the corresponding trends over different subregions (i.e., the whole area, U2U, N2U, and urban areas) of (a) Guangzhou and (b) Shenzhen.
Atmosphere 10 00048 g007
Figure 8. Time series of differences in annual mean SAT under EX1 and EX2 over the subregions of (a) Guangzhou and (b) Shenzhen between T4 and Txn (Txn minus T4).
Atmosphere 10 00048 g008
Table 1. Summary of experimental design, data, and abbreviations used in the integrations.
CaptionNumerical ExperimentsEX1EX2
Experimental DesignIntegration periodsA series of restarts for individual years starting from 1 July in the previous year were performed for the years between 1980 and 2016, for which only the simulated results for the present year were analyzed.
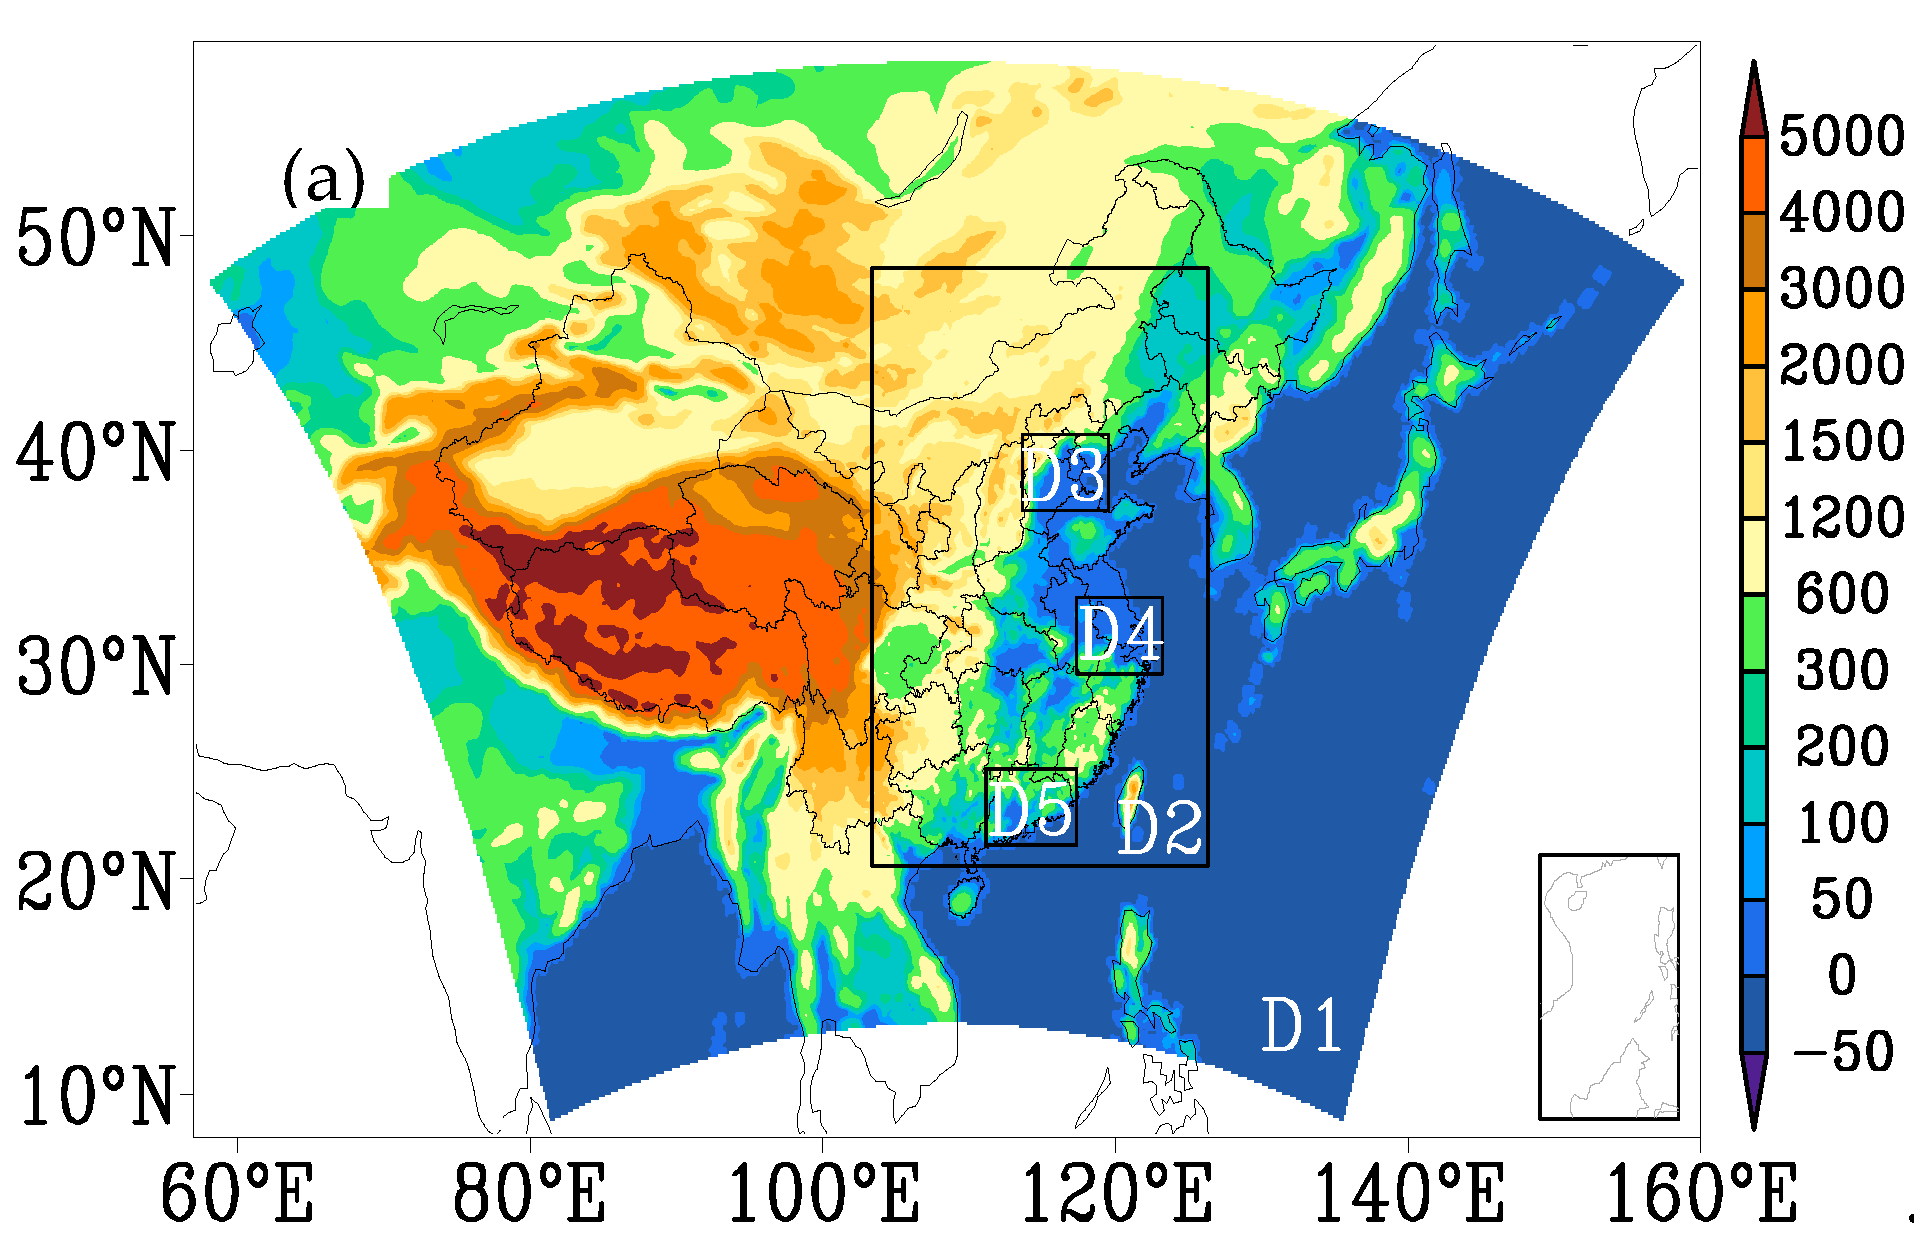
DomainsThe central latitude and longitude of the simulated domain are 35° and 108.5° E. The coarse mesh (D1) covers most of East Asia with a 30 km resolution. The first nested domain (D2) covers most of eastern China with a 10 km resolution. The second nested domains (D3–D5) cover the three city clusters (BTH, YRD, PRD) with a 3.3 km resolution.
Physical parameterization schemesThe unified Noah land-surface model including urban canopy model; the WRF single-moment 6 class graupel microphysics scheme; the Community Atmosphere Model shortwave and longwave radiation schemes; the Yonsei University boundary-layer scheme; the Grell 3D ensemble cumulus scheme (for 30 and 10 km resolution only).
DataDriving dataThe NCEP-DOE reanalysis data from 1979 and 2016
Land use dataLand use data with fixed-in-time urban surface distributions in 1980Annual urban surface distributions showing urban surface expansion from 1980 to 2016 were reconstructed using satellite-derived images in the years of 1980, 1990, 2000, 2010, and 2016, based on which the increase in fractional urban surface areas was assumed to increase linearly during each time period.
AbbreviationsSAT averagesTxn: the averages of SAT maximum (Tmax) and minimum (Tmin) records; T4: the averages calculated using four time records each day; Tc: the averages calculated using the 24-h continuous records.
U2UUrban surfaceUrban surface
N2UNon-urban surfaceUrban surface
Table 2. The differences in 37-year annual mean SAT calculated using T4, Txn, and Tc under EX1 and EX2, and the corresponding differences (EX2 minus EX1) over the subregions of Guangzhou (the entire, U2U, N2U, and urban areas) and Shenzhen (the entire and urban areas).
Txn minus T4T4 minus Tc
EX1/EX2DifferenceEX1/EX2Difference
GuangzhouEntire0.53 ****/0.48 ****−0.052−0.071/−0.093−0.022
U2U0.51 ****/0.41 ****−0.092−0.14 */−0.130.018
N2U0.48 ****/0.42 ***−0.053−0.075/−0.11−0.033
Urban0.49 ****/0.42 ****−0.072−0.063/−0.11−0.042
ShenzhenEntire0.33 ****/0.29 ***−0.034−0.053/−0.086−0.033
Urban0.34 ****/0.30 ****−0.035−0.062/−0.097−0.035
*, ***, and **** denote passing the 80, 95, and 99% confidence level significance t-tests, respectively. Units: °C.
Table 3. Trends (units: °C/decade) in annual mean SAT calculated using T4, Txn, and Tc for EX1 and EX2, and the urban-related warming contributions (units: %) over the subregions of Guangzhou (the entire, U2U, N2U, and urban areas) and Shenzhen (the entire and urban areas).
T4TxnTc
EX1/EX2ContributionEX1/EX2ContributionEX1/EX2Contribution
GuangzhouEntire17.7 *0.55/0.6414.0 *0.56/0.6716.7 *
U2U25.3 ***0.52/0.6519.6 *0.53/0.6822.2 ***
N2U42.9 ****0.54/0.9442.5 ****0.56/0.9843.5 ****
Urban42.3 ****0.54/0.9341.7 ****0.55/0.9742.8 ****
ShenzhenEntire35.2 ****0.47/0.7234.6 ***0.48/0.7435.8 ****
Urban43.9 ****0.48/0.8443.5 ****0.480/0.8744.8 ****
*, ***, and **** denote passing the 80, 95, and 99% confidence level significance t-tests, respectively.
Table 4. The changing trends of Tmax and Tmin for EX1 and EX2, and the corresponding differences for Tmax, Tmin, and DTR over the subregions of Guangzhou/Shenzhen (the entire, U2U, N2U, and urban areas).
Tmax
EX1/EX2/EX2-EX1
Tmin
EX1/EX2/EX2-EX1
DTR
EX2-EX1
GuangzhouEntire0.63/0.63/0.00400.47/0.65/0.18 **−0.14 **
U2U0.58/0.61/0.0290.46/0.69/0.23 ***−0.17 ***
N2U0.59/0.60/0.00520.49/1.28/0.79 ****−0.75 ****
Urban0.59/0.60/0.0640.49/1.26/0.77 ****−0.72 ****
ShenzhenEntire0.53/0.51/−0.0130.42/0.93/0.51 ****−0.53 ****
Urban0.54/0.54/0.000560.42/1.15/0.74 ****−0.73 ****
**, ***, and **** denote passing the 90, 95, and 99% confidence level significance t-tests, respectively. Units: °C/decade.

