Article

Precipitation Evolution over Belgium by 2100 and Sensitivity to Convective Schemes Using the Regional Climate Model MAR

1
Laboratory of Climatology, Department of Geography, UR SPHERES, University of Liège, 4000 Liège, Belgium
2
Institut Scientifique de Service Public de Wallonie, 200 rue du Chéra, 4000 Liège, Belgium
3
AGROPTIMIZE, 185 Avenue de Longwy, 6700 Arlon, Belgium
*
Author to whom correspondence should be addressed.
Atmosphere 2019, 10(6), 321; https://doi.org/10.3390/atmos10060321
Submission received: 20 May 2019 / Revised: 6 June 2019 / Accepted: 8 June 2019 / Published: 12 June 2019
(This article belongs to the Special Issue Precipitation and Climate Change: Accomplishments and Challenges)

Abstract

:
The first aim of this study is to determine if changes in precipitation and more specifically in convective precipitation are projected in a warmer climate over Belgium. The second aim is to evaluate if these changes are dependent on the convective scheme used. For this purpose, the regional climate model Modèle Atmosphérique Régional (MAR) was forced by two general circulation models (NorESM1-M and MIROC5) with five convective schemes (namely: two versions of the Bechtold schemes, the Betts–Miller–Janjić scheme, the Kain–Fritsch scheme, and the modified Tiedtke scheme) in order to assess changes in future precipitation quantities/distributions and associated uncertainties. In a warmer climate (using RCP8.5), our model simulates a small increase of convective precipitation, but lower than the anomalies and the interannual variability over the current climate, since all MAR experiments simulate a stronger warming in the upper troposphere than in the lower atmospheric layers, favoring more stable conditions. No change is also projected in extreme precipitation nor in the ratio of convective precipitation. While MAR is more sensitive to the convective scheme when forced by GCMs than when forced by ERA-Interim over the current climate, projected changes from all MAR experiments compare well.

1. Introduction

Due to the warming of the troposphere, its water vapor content is expected to increase over the next few decades, leading to changes in clouds and precipitation [1,2,3]. Some regions are projected to experience an increase in precipitation, while others might be subject to precipitation declines [3,4].
For instance, an increase in annual precipitation is expected in the northern part of Europe, while the opposite is projected for the southern part and particularly for the Mediterranean Basin [3,5,6]. Furthermore, precipitation should increase in winter and decrease in summer over a significant part of the European territory [3,6].
Belgium is located in the transition zone between wetter and driers areas as projected by IPCC [3,7]. Consequently, the evolution of precipitation over Belgium highlights the uncertainties and complexities related to climate projections although it could deeply impact ecosystems [8,9] since the seasonal variability of precipitation could also change [6,10,11,12].
However, all the aforementioned studies were based on the total precipitation amounts without distinguishing between convective and stratiform precipitation (we refer to [13] for more details about these two types of precipitation). In a warmer climate, convection processes are expected to intensify [14,15], especially near moisture sources such as the seas [2,16], potentially leading to higher precipitation intensities, thunderstorms and major material damages.
In Belgium, the work in [17] showed that an ensemble of General Circulation Model (GCM) outputs under different future scenarios simulates an amplification in the intensity of precipitation extremes for 2100 with uncertainties following the GCM used and the greenhouse gas scenario used [18]. Nevertheless, GCM results are limited by their coarse spatial resolution and the approximations made in the microphysics and convective schemes, but can be partially improved through downscaling approaches with a Regional Climate Model (RCM) [6]. As both GCMs and RCMs do not represent convective precipitation explicitly since the spatial scale of convective systems is significantly smaller than their spatial resolutions, parameterized methods have to be employed in order to represent the statistical effects of an ensemble of convective processes inside an air column of the model.
As highlighted in [19] where the regional model MAR (for “Modèle Atmosphérique Régional”) has been used at a resolution of 10 km over Belgium, the simulated precipitation showed the same changes over the present climate, but could significantly differ locally depending on the convective scheme used. Regarding the uncertainties linked to the geographical position of Belgium mentioned above and the diversity of GCM-based future scenarios and convective schemes available for modeling precipitation in RCMs, the evolution of (convective) precipitation remains an open challenging question.
The aim of this study is to expand the work of [19] by forcing MAR with two GCMs (NorESM1-M and MIROC5 from the Coupled Models Inter-comparison Project Phase 5 “CMIP5”) in order to assess the future precipitation changes projected under the RCP8.5 scenario and their sensitivities to the convective scheme used. The projected changes are quantified with respect to the historical experiments representing the average climate over the last decades of the 20th century.
The area of interest, the models, and the convective schemes used are described in Section 2. Section 3 presents the results (precipitation amounts, extreme precipitation, convective precipitation ratio, and dry days, both annually and during summer) of MAR over the present period (1987–2017), used here as the reference, and over a future warmer period (2070–2100). Section 4 discusses the results before concluding in Section 5.

2. Models and Methods

The studied area, including Belgium and the nearby regions (Figure 1), is subjected to precipitation all year round with an average annual precipitation amount ranging from 700 mm/year in the lowlands to more than 1400 mm/year over the upper summits [20]. The convective events occur mainly between April and September and are most frequent in the highlands [21]. Three orographic zones are defined in Belgium: low Belgium (0 m–100 m), medium Belgium (101 m–300 m), and high Belgium (301 m–694 m).
The RCM used in this study was Version 3.9 of MAR. It is a hydrostatic primitive equation model initially developed for Polar regions [22] such as the Greenland ice sheet (e.g., [23,24]) or the Antarctic region (e.g., [25,26]). However, MAR has successfully been adapted for Western European temperate regions [27,28,29,30,31] and has also been chosen to be part of the European branch of the international COordinated Regional climate Downscaling EXperiment (EURO-CORDEX) project thanks to the Belgian CORDEX.be project [32]. For more details about the physical parameterization of the MAR model used here, we refer to [19].
In this study, MAR simulations were performed at a horizontal resolution of 10 km over a domain of 800 km × 750 km centered over Belgium as in [19]. The model was constrained every 6 h at its lateral boundary (by temperature, pressure, wind, specific humidity at each of its vertical level, and by sea surface temperature over the ocean provided by reanalysis or GCM). The reanalysis and GCMs used here as forcing fields were:
  • the ERA-Interim reanalysis (ERA; [33]), available at a spatial resolution of 0.75° × 0.75° as in [19].
  • the MIROC5 GCM (MIR; [34]) from CMIP5 available at a spatial resolution of 1.4° × 1.4°.
  • the NorESM-1-M GCM (NOR; [35]) from CMIP5 available at a spatial resolution of 1.89° × 2.5°.
The selection of these two GCMs was made after evaluation of their abilities to represent the current (1976–2005) average climate over Europe on the basis of the skill score methodology used by [36]. About 30 GCMs from the CMIP5 project were classified by skill scores for six climate variables, and both NorESM1-M and MIROC5 performed significantly better than the other models [37]. In addition, these two GCMs were also successfully used by [24,38] to force MAR over different domains of the North Atlantic region.
In the following, two periods will be discussed. The first period 1987–2017 (called “present”) is represented by the ERA-Interim reanalysis from 1987–2017 or by the historical scenario over 1987–2005 and extended by the RCP8.5 scenario from 2006–2017 for the GCM-based forcing. The second period, 2070–2100 (called “future”), is exclusively represented by both GCMs using the RCP8.5 scenario.
To assess the sensitivity of the convective precipitation in warmer climates over Belgium, five different experiments have been performed: each of them used one of the following convective schemes in MAR as done in [19]:
  • the mass flux scheme of Bechtold [39], which is the Standard convective scheme in MAR (STD)⁠;
  • an updated version of the convective scheme of Bechtold (MES) with different optimization and parameter adjustments compared to STD. It is the version used in Version 5.3.1. of the RCM MESOscale Non-Hydrostatic model (MESO-NH) [40]⁠;
  • the adjustment convective scheme of Betts–Miller–Janjić [41,42] (BMJ). This convective scheme comes from the Weather and Research Forecast model Version 3.9.1.1. from 28 August 2017 (WRF; [43]);
  • the mass flux Kain–Fritsch Scheme [44] (KFS). This convective scheme also comes from the WRF model;
  • the modified Tiedtke mass flux scheme [45,46] (hereafter called NTK), which also comes from the WRF model.
The performance of each convective scheme for representing convective precipitation over Belgium by using ERA-Interim as forcing over 1987–2017 was discussed in [19].
For readability purposes, each experiment is named as follows: MAR-CCC-FFF with CCC the acronym of the Convective scheme and FFF the acronym of the Forcing model. The acronyms are the same as defined in the previous section. Sometimes MAR-CCC or MAR-FFF is used to refer to all the experiments using the same convective scheme or the same forcing model, respectively.
The analyzed weather variables were the total precipitation amounts, the extreme precipitation amounts, which correspond to the 95th percentile of daily precipitation, the rate of convective precipitation, which corresponds to the ratio between convective precipitation and total precipitation, and finally, the yearly dry day sums, which correspond to the number of days with a total precipitation amount less than 0.1 mm/day (this threshold corresponds to the numerical precision in the MAR outputs for precipitation).
The anomalies simulated by MAR forced by a GCM over the present period with respect to MAR-ERA were considered as being significant if the differences between MAR forced by the GCM and MAR-ERA were larger than one standard deviation (i.e., interannual variability) of MAR-ERA. The projected changes simulated by MAR forced by a GCM over the future period were considered as being significant when the difference with regard to MAR forced by the same GCM over the present period was larger than one standard deviation of MAR forced by this GCM over the present period.
Before analyzing the projected changes, the ability of each experiment (e.g., MAR forced by a GCM with one of the five convective schemes) to simulate the present climate over Belgium was evaluated in order to estimate its relevance to perform projections.

3. Results

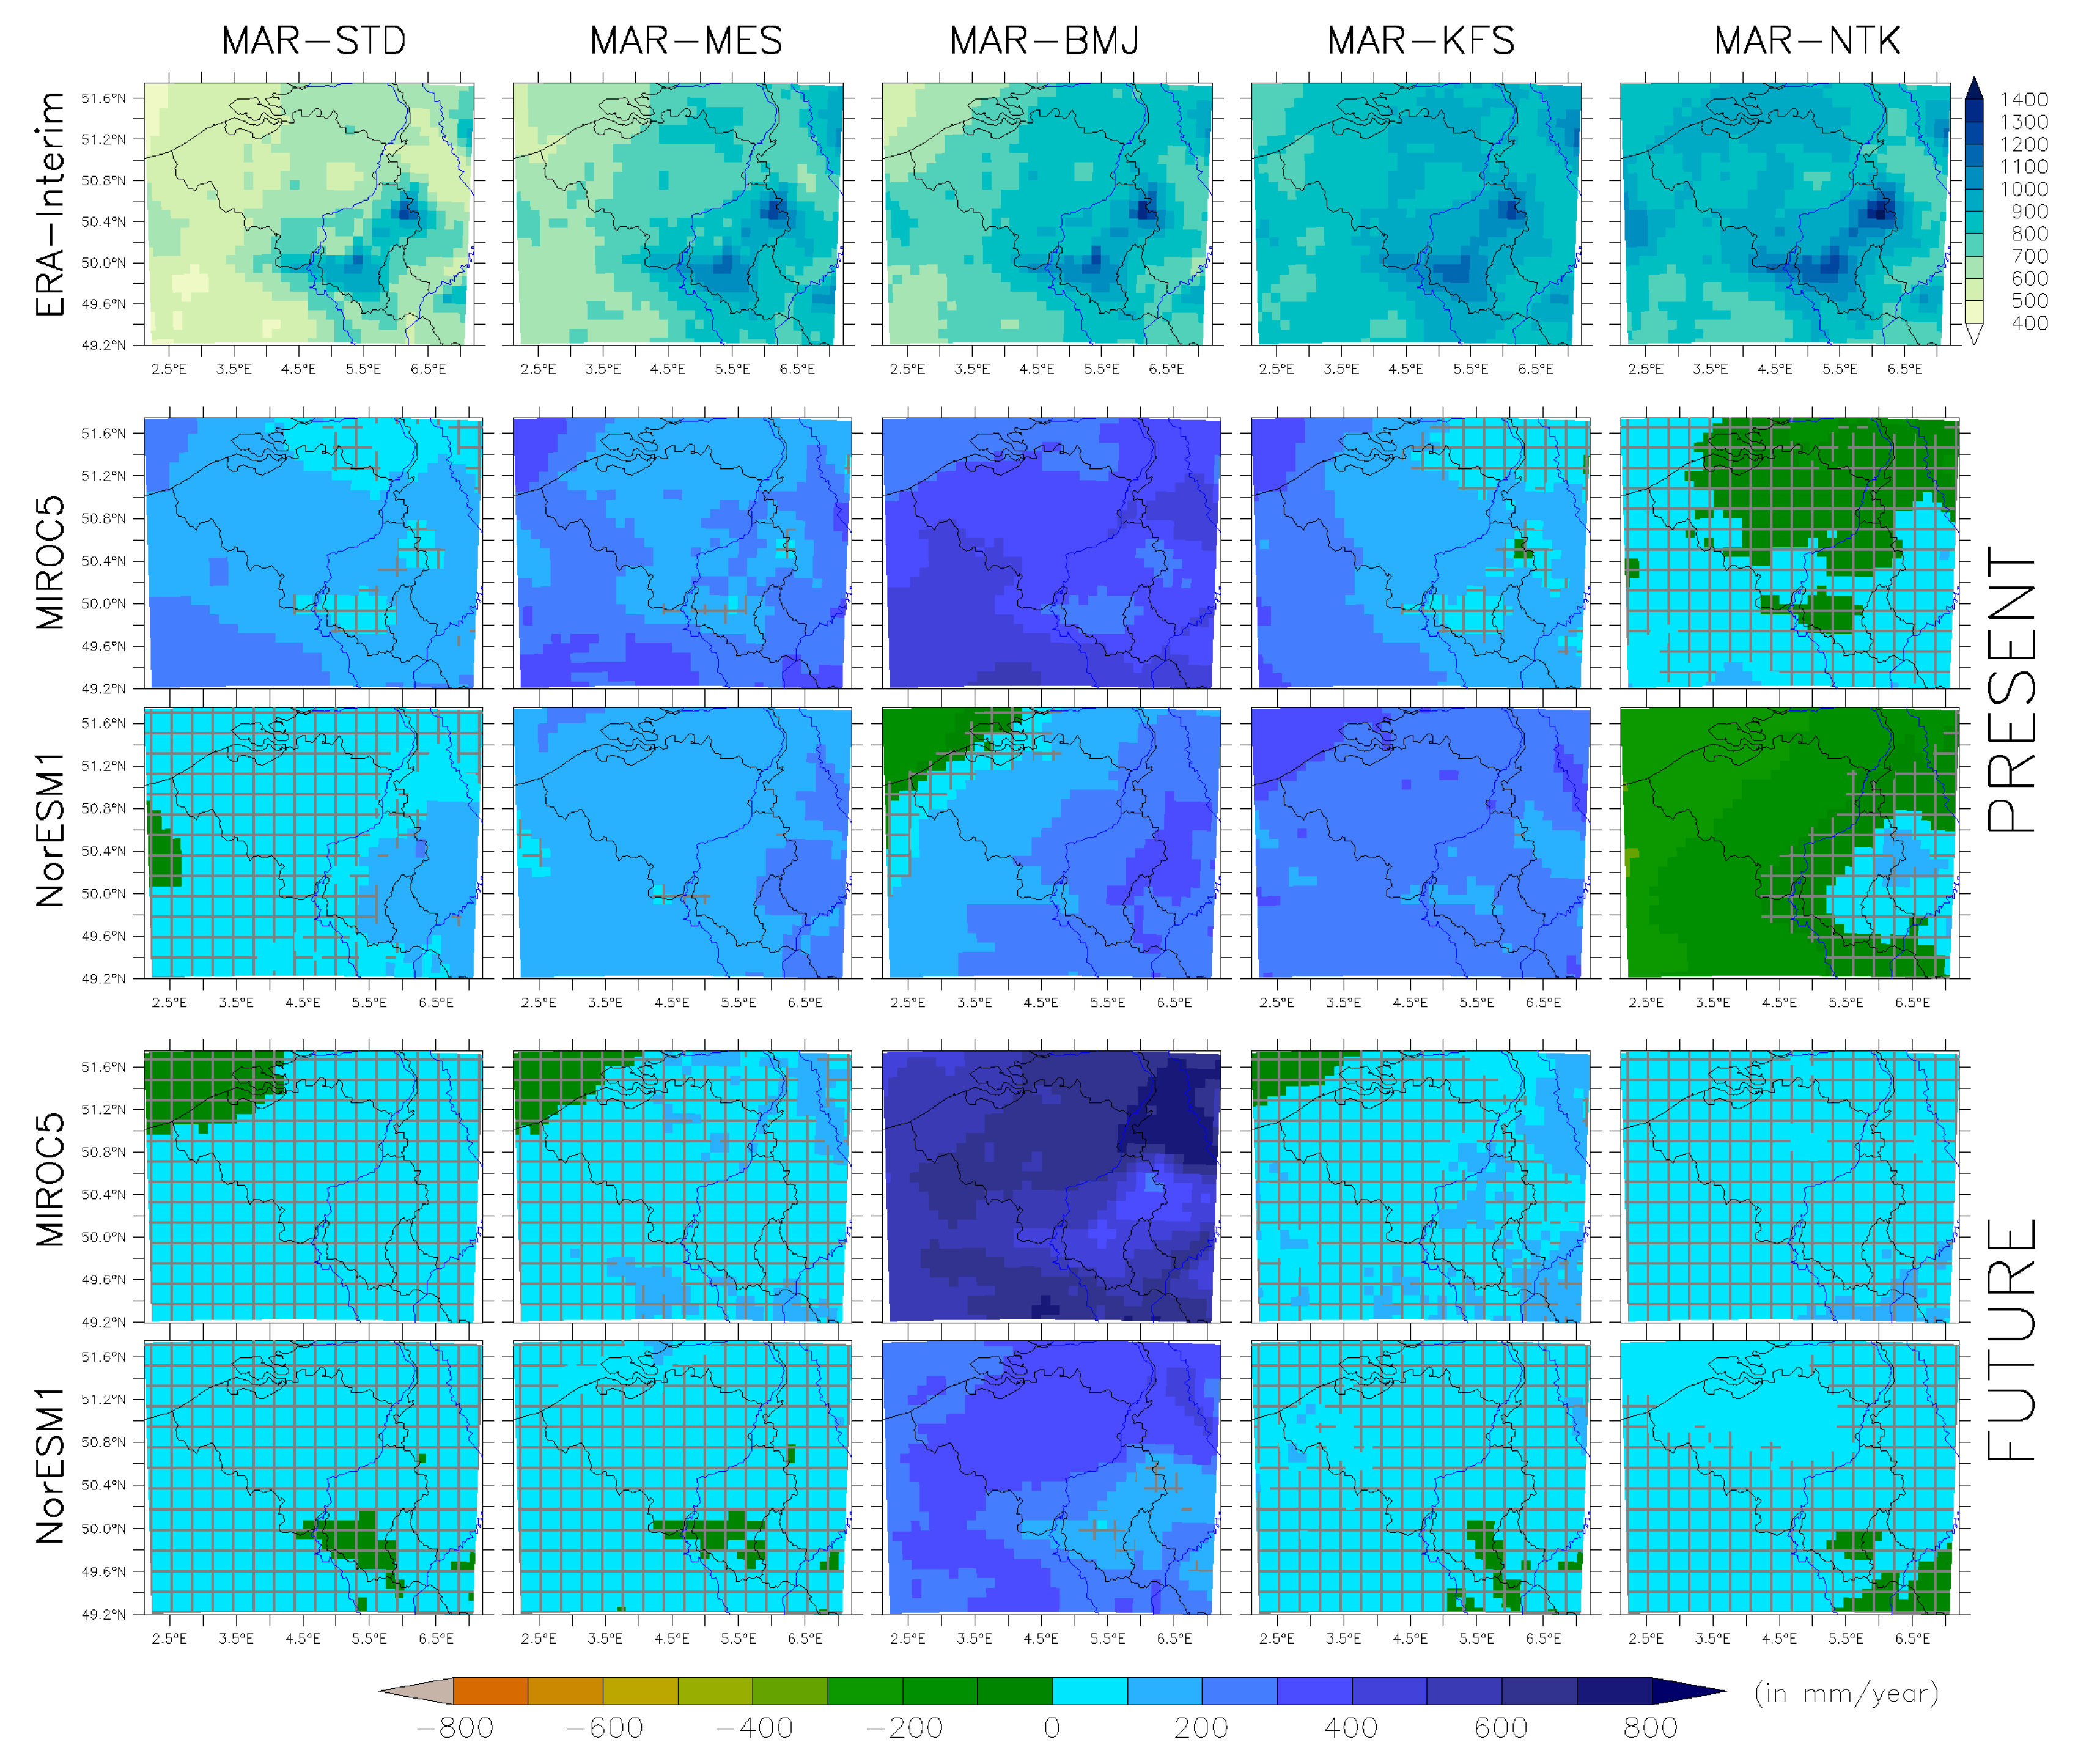
3.1. Total Precipitation

MAR-MIR and MAR-NOR mostly overestimated precipitation compared to MAR-ERA over 1987–2017 whatever the convective scheme used (Figure 2). The only exceptions were MAR-NTK-MIR, which simulated insignificant anomalies over Belgium, and MAR-NTK-NOR, which significantly underestimated precipitation over low and medium Belgium, while it overestimated it over high Belgium. MAR-BMJ-MIR and MAR-BMJ-NOR showed the highest anomalies (on average, +350 mm/year compared to MAR-BMJ-ERA), respectively, over the whole of Belgium and over high Belgium. Figure S1 (in the Supplementary Materials) shows the same anomalies for summer except for MAR-NTK-NOR and MAR-KFS-MIR, which respectively underestimated and overestimated precipitation significantly over the whole domain.
Regarding the future, only MAR-BMJ projected significant positive changes in mean annual precipitation (+600 mm/year for MAR-BMJ-MIR and +300 mm/year for MAR-BMJ-NOR) compared to the other experiments, but these results remain questionable and will be discussed in Section 4. The other experiments did not show any significant changes in a warmer climate, and even though significant changes were simulated in some limited areas, they remained lower than the anomalies between MAR forced by the two GCMs and MAR-ERA over the current climate. It should be noted nevertheless that MAR-NTK-NOR projected an increase in the precipitation amount of about 70 mm/year for the northern part of low Belgium in a warmer climate, while it showed a negative anomaly over the present period. Similar conclusions can be drawn for summer from Figure S1.
The standard deviations of daily precipitation of MAR-MIR (Figure S2) were also overestimated compared to MAR-ERA. Regarding MAR-NOR, only MAR-NOR-BMJ and MAR-NOR-NTK showed significant anomalies compared to MAR-ERA over 1987–2017. Regarding the future, there were some local increases of the daily standard deviation, but globally, no significant changes for both the year and summer time scale.

3.2. Extreme Precipitation

Over 1987–2017, MAR-STD-MIR and MAR-MES-MIR slightly overestimated extreme precipitation (Figure 3) as defined in [19] (i.e., the 95th percentile of daily precipitation), but significantly overestimated extreme summer precipitation (Figure S3). MAR-BMJ largely overestimated extreme precipitation compared to MAR-ERA. As for the mean annual precipitation, MAR-NTK-NOR underestimated extreme precipitation over low and medium Belgium (and over the whole domain in summer). All the other experiments exhibited insignificant anomalies.
In a warmer climate, all experiments presented either no significant changes or changes lower than the anomalies over the present period, except MAR-BMJ, which still projected positive significant changes, but significantly overestimated extreme precipitation over the present period. However, as the expected changes in the future were lower than or of the same order as the model anomalies over the present period, no robust conclusions can be drawn about the value of these changes. Finally, a similar analysis can be made for summer in Figure S3.

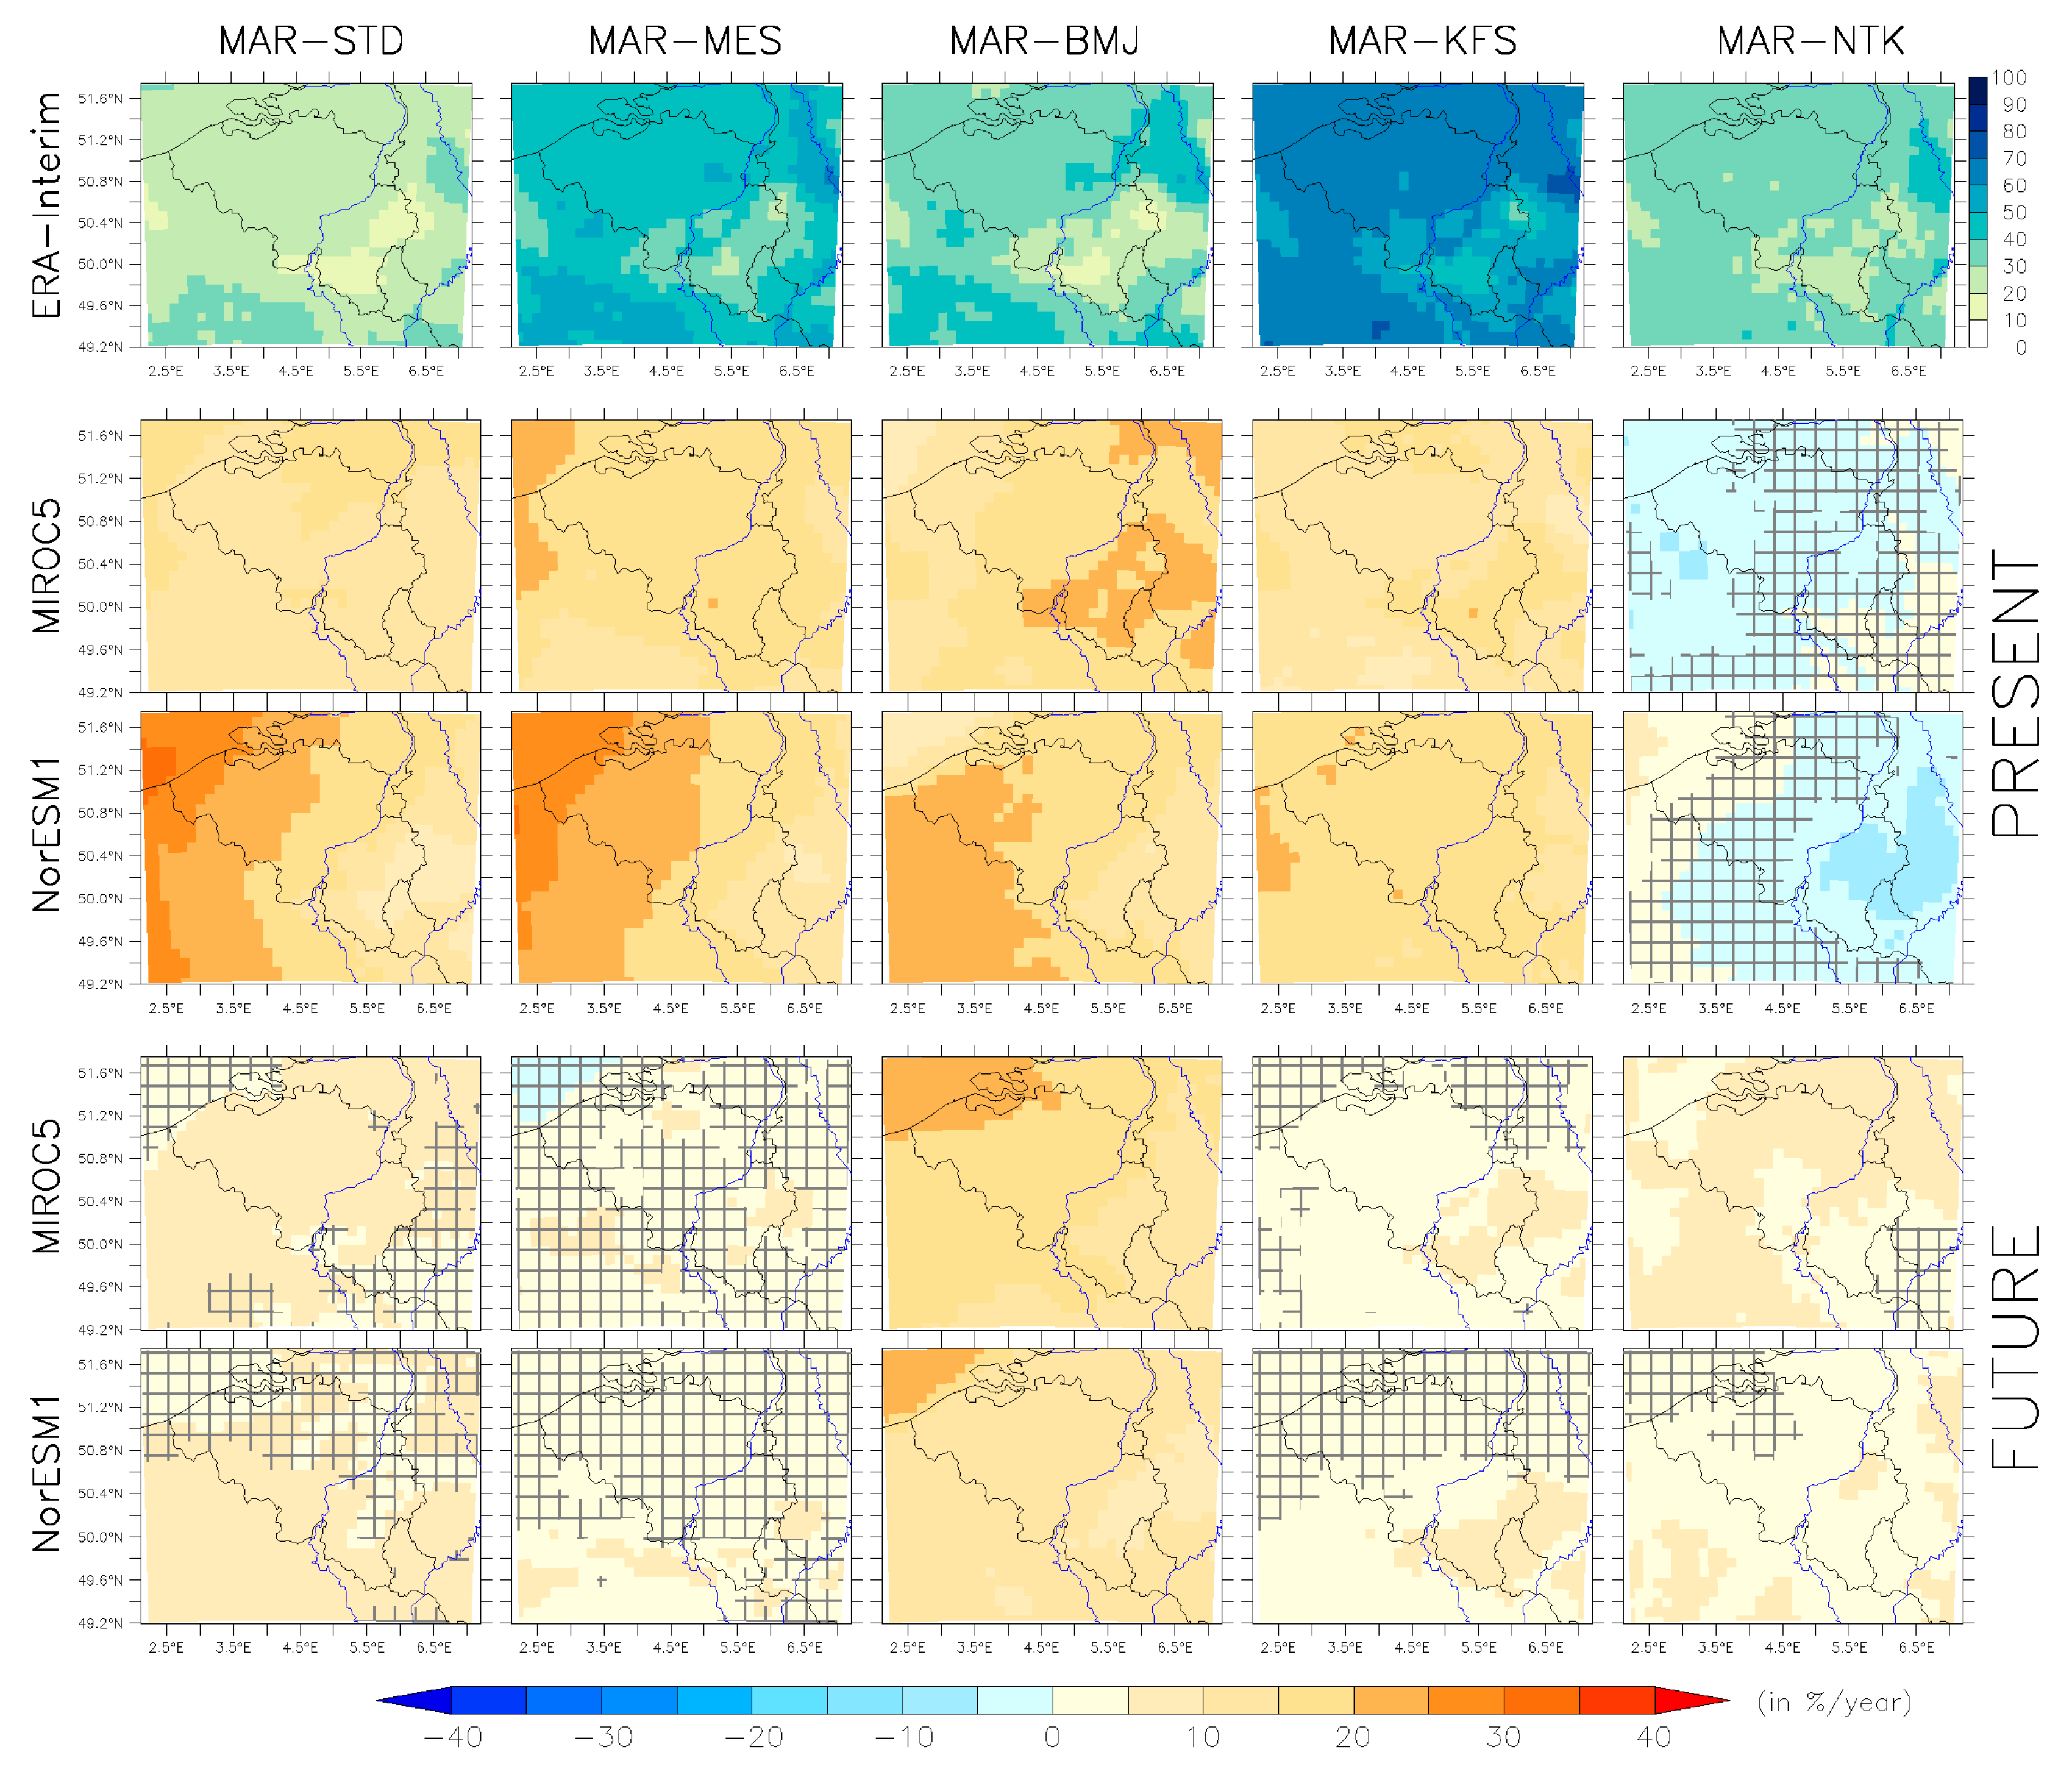
3.3. Convective Precipitation

Compared to MAR-ERA, MAR-MIR and MAR-NOR overestimated by ~20% the ratio between convective precipitation and total precipitation over 1987–2017, except MAR-NTK, which showed negative or insignificant anomalies (Figure 4).
In a warmer climate, MAR-BMJ tended to increase significantly the ratio of convective precipitation, but as for the mean annual precipitation and extreme precipitation, MAR-BMJ stood out from the pack and must be discussed separately. The other experiments project slight significant positive changes (+5%/year–+10%/year), but lower than or of the same order as the anomalies over the present climate.
In summer (Figure S4), all GCM forced experiments overestimated by 10–40% the ratio between convective precipitation and total precipitation compared to MAR-ERA over the present period, except for MAR-NTK, which simulated no significant anomalies. MAR-STD-NOR and MAR-NTK-NOR projected a significant increase of this ratio over high Belgium, but only MAR-NTK-NOR was larger than the present anomalies. The other MAR experiments did not suggest any significant changes for summer in a warmer climate, except MAR-BMJ for a reason discussed later.

3.4. Dry Days

Figure 5 presents the annual mean number of dry days (i.e., a day with a precipitation amount smaller than 0.1 mm/day) by year. Except MAR-BMJ-NOR and MAR-NTK-NOR, which significantly overestimated the mean number of dry days by year for 1987–2017 over the northern half part of Belgium, all other GCM forced simulations underestimated it.
In a warmer climate, MAR-STD, MAR-MES, and MAR-KFS projected a significant increase in the number of dry days over northwest Belgium and over the North Sea. However, these significant increases were smaller than the anomalies over the present period. The projected changes were statistically insignificant over the rest of the domain.
Regarding summer, Figure S5 indicates that the summer mean number of dry days tended to be significantly underestimated for 1987–2017 whatever the experiment, except MAR-NTK, for which anomalies were insignificant. Nevertheless, there was no significant change in a warmer climate, except for MAR-NTK, which projected a significant increase over the whole domain, and for MAR-MES, MAR-STD-NOR, and MAR-KFS-NOR, which showed a significant increase in the number of dry days near and above the North Sea.

4. Discussion

Three main statements can be drawn from our results.
Firstly, MAR forced by MIROC5 and NorESM1-M overestimated the annual mean precipitation amount compared to MAR-ERA over 1987–2017, as well as the extreme precipitation amount. In a warmer climate, MAR-MIR and MAR-NOR projected slight precipitation increases, but they were weaker than the anomalies compared to MAR-ERA over 1987–2017. Figure 6 sustains these results by showing that future differences were clearly lesser (no higher than 150 mm/year) than present anomalies (comprised between −300 and 400 mm/year), except for MAR-BMJ, which had as large (and abnormal) present anomalies as future differences. MAR-GCM-BMJ was distinctly out of the range of the other simulations.
The work in [47,48] showed that GCM uncertainties of precipitation over the present climate were also higher than projected changes in warmer climates and especially for Belgium and neighboring regions. In addition, the GCMs used by [48] did not agree on an increase or a decrease in precipitation in the area of Belgium, which might be related to the fact that Belgium is situated between the northern part of Europe where most of the models projected an increase of precipitation and the southern part of Europe where precipitation was projected to decrease. Moreover, an ensemble of several RCMs forced by different GCMs projected an annual precipitation increase of 5–15% over Belgium with the RCP8.5 scenario and a heavy summer precipitation increase of ~10% [6], which is in the same order as our results.
To corroborate our results and to make sure that our MAR simulations were consistent with their forcing GCM forcing-based fields, changes in annual precipitation from MIROC5 and NorESM1-M are compared to our MAR results in Figure 7. As for the MAR simulations, the forcing GCM did not project a significant increase of precipitation.
Secondly, as MAR-MIR and MAR-NOR mostly projected an increase of the mean annual number of dry days, as well as extreme precipitation, this suggests that precipitation is projected to become less frequent, but more intense in our simulations. However, this conclusion is nuanced because the projected future changes were smaller than present day anomalies. The authors of [6,49,50] worked with different sets of GCMs and RCMs over Western Europe and concluded that for the 90th percentile, intensities and heavy precipitation tended to increase over 2070–2100, but again the statistical significance was debatable. A similar conclusion can be drawn for summer when no significant change was detectable in a warmer climate.
Furthermore, even if most of our results presented insignificant changes, they were consistent with an increase in extreme precipitation, convective precipitation, and dry days in the northern part of Belgium in a warmer climate. This type of change is in line with other studies. For instance, the work in [51] reported a future increase (decrease) in extreme precipitation over the north (south) of Belgium simulated by a Convective Permitting Scale (CPS) model, while non-CPS models did not corroborate this geographical pattern. The work in [12,52] also indicated an increase in extreme precipitation (and in dry days for [52]) over Belgian in a warmer climate.
Thirdly, MAR experiments using different convective schemes gave different changes when forced by GCMs in contrast to [19], who showed that MAR forced by ERA with the same different convective schemes gave similar trends in sign and in order of value over 1987–2017. In our study, MAR-BMJ and to a lesser extent MAR-NTK reacted differently compared to the other MAR experiments. The MAR-BMJ experiments significantly overestimated precipitation quantities, while MAR-NTK experiments were the only ones showing negative anomalies over 1987–2017. Temperature (Figure 8) and humidity (Figure S6) profiles can be useful to explain these discrepancies between both of these convective schemes.
The vertical temperature profiles of the MAR-BMJ experiments (Figure 8) showed atmospheric temperatures systematically lower below 5000 m compared to MAR-STD (and also to MAR-MES and MAR-KFS). As the temperature profiles of MAR-BMJ had the same behavior of the MAR without a convective scheme, this probably means that the BMJ convective scheme did not correctly play its role: the temperature profile always remained unstable without enough reheating coming from the convective scheme. Moreover, the specific humidity profiles showed wetter conditions for MAR-BMJ (and MAR without convective scheme) than for MAR-STD (as shown in Figure S6).
These two elements explain the overestimation of precipitation in the MAR-BMJ experiments, especially since MAR-BMJ-MIR and MAR-BMJ-NOR temperature profiles were consequently lower than MAR-BMJ-ERA and led thus to more precipitation. It should also be noted that BMJ was the only adjustment convective scheme type depending on some reference profiles, which were probably not adapted to GCM forcing conditions.
The MAR-NTK experiments reacted differently: In Figure 8, MAR-NTK was colder than MAR-STD below 1000 m and also between 1800 m (2200 m for MAR-ERA) and 4000 m, while they were warmer between 1000 m and 1800 m and also above 4000 m. This corresponds to a stable air temperature profile in the lower layers. The NTK convective scheme seemed to work only around 1600–2000 m, where it heated the layer and removed humidity (see Figure S6), but precipitation evaporated before reaching the surface, leading to a smaller precipitation amount than the other MAR experiments.
The two other convective schemes, MAR-MES and MAR-KFS, were clearly warmer below 4000 m than MAR-STD, but the resulting precipitation and convective precipitation were in the same order as MAR-STD, as shown in Figure 1, Figure 2 and Figure 3.
In a warmer climate, the mean annual vertical temperature profiles of MAR-MIR and MAR-NOR showed a stronger increase of temperature in the upper levels (+6 °C) than in the lower levels (+4°) over Belgium (Figure 9A,C). This result is consistent with [3], who indicated a stronger warming of zonal average atmospheric temperature around 400 hPa than around 1000 hPa at 50°N. This should imply a general stabilization of the troposphere, and thus, this mainly leads to a decrease in atmospheric conditions favorable to convective precipitation.
In addition, Figure 9B,D show that the changes in specific humidity in a warmer climate were less important for MAR-NTK even if the future changes in temperature of this experiment were of the same order of magnitude as the other experiments. A warmer temperature profile and a dryer humidity profile of MAR-NTK confirmed the explanation of the underestimation of the precipitation amount for this experiment with respect to the other schemes.

5. Conclusions

This study comes within the scope of a previous work, where [19] assessed the sensitivity of MAR forced with the ERA-Interim reanalysis to different convective schemes and determined precipitation trends over 1987–2017 in Belgium. The aim of the current study was to determine whether trends in the evolution of precipitation and more specifically convective precipitation were projected in a warmer climate (RCP8.5 scenario) over Belgium. For this purpose, MARv3.9. was forced by two GCMs (NorESM1-M and MIROC5 from CMIP5) with the same five convective schemes as in the previous study (namely: the two Bechtold schemes, the Betts–Miller–Janjić scheme, the Kain–Fritsch scheme and the modified Tiedtke scheme) in order to assess the changes in future precipitation quantities and associated uncertainties. The main findings can be summarized as follows:
  • At both the annual and summer time scales, MAR forced by the GCMs MIROC5 and NorESM1-M overestimated mean precipitation, as well as extreme precipitation amounts compared to MAR-ERA over 1987–2017. In a warmer climate, MAR-MIR and MAR-NOR projected slightly positive precipitation changes, but they were weaker than the anomalies over the current climate with respect to MAR-ERA. This result was corroborated by the precipitation changes projected by the forcing GCMs without MAR downscaling.
  • MAR-MIR and MAR-NOR seemed to produce less frequent, but more intense precipitation over the present and future periods and thus reinforced a bit the convective nature of precipitation. During summer, over the present period, the frequency of convective precipitation seemed to increase in the MAR experiments. Nevertheless, the relevance of the increase remained questionable as the projected changes were smaller than the present day anomalies.
  • MAR-BMJ and MAR-NTK experiments diverged from the other experiments, either through projecting opposed changes or by showing a significant overestimation of precipitation over the current climate. We assume that these results were due to these convection schemes, because the latter did not react properly or they were unsuitable for this kind of simulation.
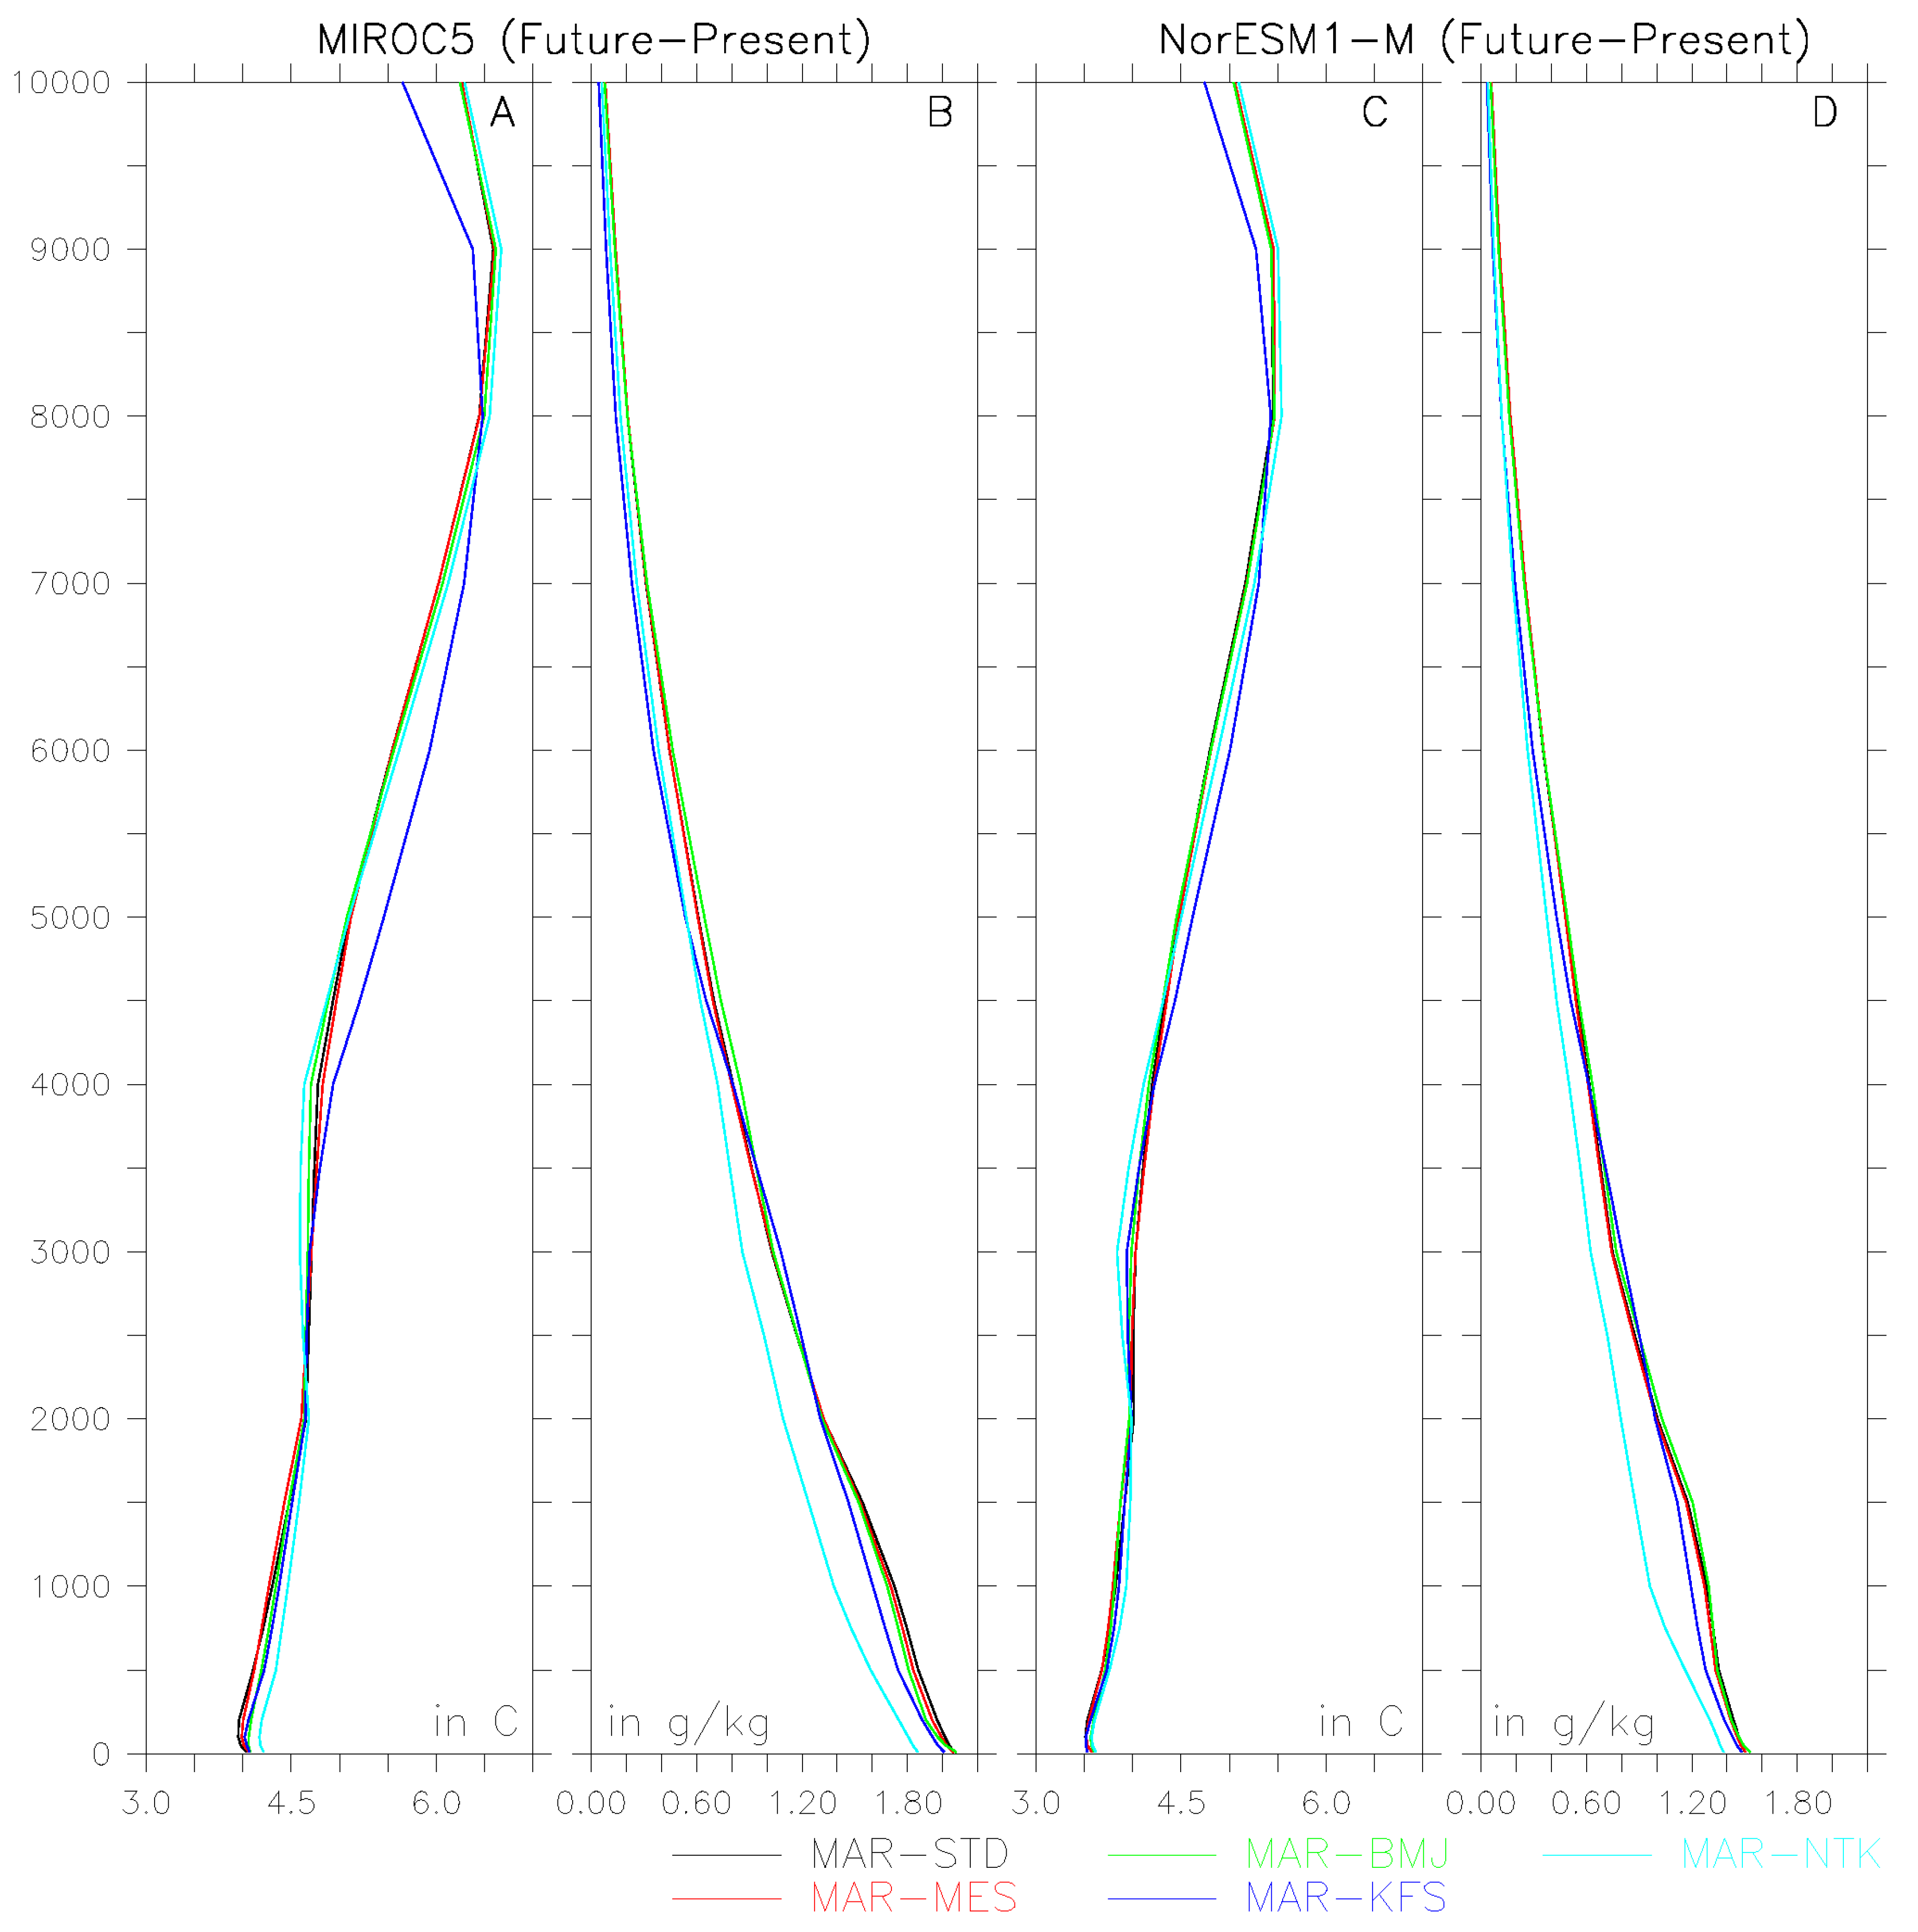
  • All MAR experiments seemed to indicate a stronger warming in the upper troposphere than in the lower atmospheric layers. This could indicate a generalized stabilization of the air column and therefore a weakening of the instability, leading to atmospheric conditions less favorable to convection.
At this stage, the general conclusion is that MAR forced by MIROC5 and NorESM1-M did not indicate a significant change, neither in annual/summer precipitation, nor in extreme precipitation, nor in the ratio of convective precipitation. The next step is now to use the new future scenarios from CMIP6 to assess the relevance of these MAR-based projected changes.

Supplementary Materials

The following are available online at https://www.mdpi.com/2073-4433/10/6/321/s1: Figure S1: ERA-Interim: Mean summer (JJA) precipitation (in mm/summer) over 1987–2017 simulated by MAR forced by ERA-Interim for each experiment. PRESENT: Anomalies (in mm/summer) between the mean summer precipitation over 1987–2017 simulated by MAR forced by MIROC5 and NorESM1-M compared to MAR-ERA for each convective scheme. FUTURE: Future changes (in mm/summer) between the mean summer precipitation over 2070–2100 simulated by MAR forced by MIROC5 and by NorESM1-M with RCP8.5 scenario compared to MAR forced by MIROC5 and by NorESM1-M over 1987–2017 for each convective scheme. Cross-hatched pixels indicate that values are statistically insignificant.; Figure S2: Same as Figure S1, but for the standard deviation of daily precipitation in mm/day; Figure S3: Same as Figure S1, but for the 95th percentile of daily precipitation in mm/day.; Figure S4: Same as Figure S1, but for the ratio between convective precipitation and total precipitation in %/summer.; Figure S5: Same as Figure S1, but for the summer mean of dry days (days with none precipitation) in days/summer.; Figure S6: Anomalies of annual mean specific humidity profiles (in g/kg) between all MAR experiments and the MAR-STD experiment between the surface and a 7000-m height.

Author Contributions

Conceptualization, S.D. and X.F.; data curation, C.K.; formal analysis, S.D.; funding acquisition, M.E. and X.F.; investigation, S.D.; methodology, S.D. and X.F.; project administration, M.E. and X.F.; software, S.D. and C.K.; supervision, M.E. and X.F.; validation, S.D.; visualization, S.D.; writing, original draft, S.D.; writing, review and editing, C.K., C.W., A.B., C.A., and X.F.

Funding

This research received no external funding

Acknowledgments

The ERA-Interim reanalyses used in this study were obtained from the ECMWF data server: http://apps.ecmwf.int/datasets. Computational resources have been provided by the “Consortium des Équipements de Calculs Intensifs” (CECI), funded by the “Fonds de la Recherche Scientifique de Belgique” (FRS-FNRS) under Grant No. 2.5020.11 and by the Walloon Region and by the high performance computing massively parallel cluster (NIC3) of the University of Liège. We acknowledge the World Climate Research Programme’s Working Group on Coupled Modelling, which is responsible for CMIP, and we also thank the climate modelling groups for producing and delivering their model outputs.

Conflicts of Interest

The authors declare no conflict of interest.

References

  1. Richter, I.; Xie, S.P. Muted precipitation increase in global warming simulations: A surface evaporation perspective. J. Geophys. Res. 2008, 113, D24118. [Google Scholar] [CrossRef]
  2. Trenberth, K. Changes in precipitation with climate change. Clim. Res. 2011, 47, 123–138. [Google Scholar] [CrossRef] [Green Version]
  3. Collins, M.; Arblaster, J.; Dufresne, J.L.; Fichefet, L.; Friedlingstein, P.; Gao, X.; Gutowski, W.J.J.; Johns, T.; Krinner, G.; Shongwe, M.; et al. Long-term Climate Change: Projections, Commitments and Irreversibility. In Climate Change 2013: The Physical Science Basis. Contribution of Working Group I to the Fifth Assessment Report of the Intergovernmental Panel on Climate Change; Cambridge University Press: Cambridge, UK; New York, NY, USA, 2013; pp. 1029–1136. ISBN 9781107415324. [Google Scholar]
  4. Pfahl, S.; O’Gorman, P.A.; Fischer, E.M. Understanding the regional pattern of projected future changes in extreme precipitation. Nat. Clim. Chang. 2017, 7, 423–427. [Google Scholar] [CrossRef]
  5. Giorgi, F.; Lionello, P. Climate change projections for the Mediterranean region. Glob. Planet. Chang. 2008, 63, 90–104. [Google Scholar] [CrossRef]
  6. Jacob, D.; Petersen, J.; Eggert, B.; Alias, A.; Christensen, O.B.; Bouwer, L.M.; Braun, A.; Colette, A.; Déqué, M.; Georgievski, G.; et al. EURO-CORDEX: New high-resolution climate change projections for European impact research. Reg. Environ. Chang. 2014, 14, 563–578. [Google Scholar] [CrossRef]
  7. Stocker, T.F.; Qin, D.; Plattner, G.; Alexander, L.; Allen, S.; Bindoff, N.; Bréon, F.; Church, J.; Cubasch, U.; Emori, S.; et al. Technical Summary. In Climate Change 2013: The Physical Science Basis. Contribution of Working Group I; Combridge University Press: Cambridge, UK; New York, NY, USA, 2013. [Google Scholar]
  8. Lindner, M.; Maroschek, M.; Netherer, S.; Kremer, A.; Barbati, A.; Garcia-Gonzalo, J.; Seidl, R.; Delzon, S.; Corona, P.; Kolström, M.; et al. Climate change impacts, adaptive capacity, and vulnerability of European forest ecosystems. For. Ecol. Manag. 2010, 259, 698–709. [Google Scholar] [CrossRef]
  9. Olesen, J.E.; Carter, T.R.; Díaz-Ambrona, C.H.; Fronzek, S.; Heidmann, T.; Hickler, T.; Holt, T.; Minguez, M.I.; Morales, P.; Palutikof, J.P.; et al. Uncertainties in projected impacts of climate change on European agriculture and terrestrial ecosystems based on scenarios from regional climate models. Clim. Chang. 2007, 81, 123–143. [Google Scholar] [CrossRef]
  10. Baguis, P.; Roulin, E.; Willems, P.; Ntegeka, V. Climate change scenarios for precipitation and potential evapotranspiration over central Belgium. Theor. Appl. Climatol. 2010, 99, 273–286. [Google Scholar] [CrossRef]
  11. Tabari, H.; Taye, M.T.; Willems, P. Water availability change in central Belgium for the late 21st century. Glob. Planet. Chang. 2015, 131, 115–123. [Google Scholar] [CrossRef]
  12. Vanden Broucke, S.; Wouters, H.; Demuzere, M.; van Lipzig, N.P.M. The influence of convection-permitting regional climate modeling on future projections of extreme precipitation: Dependency on topography and timescale. Clim. Dyn. 2018, 1–22. [Google Scholar] [CrossRef]
  13. Anagnostou, E.N. A convective/stratiform precipitation classification algorithm for volume scanning weather radar observations. Meteorol. Appl. 2004, 11, 291–300. [Google Scholar] [CrossRef]
  14. Chou, C.; Neelin, J.D. Mechanisms of Global Warming Impacts on Regional Tropical Precipitation. J. Clim. 2004, 17, 2688–2701. [Google Scholar] [CrossRef]
  15. Berg, P.; Moseley, C.; Haerter, J.O. Strong increase in convective precipitation in response to higher temperatures. Nat. Geosci. 2013, 6, 181–185. [Google Scholar] [CrossRef]
  16. Daniels, E.E.; Lenderink, G.; Hutjes, R.W.A.; Holtslag, A.A.M. Spatial precipitation patterns and trends in The Netherlands during 1951–2009. Int. J. Climatol. 2014, 34, 1773–1784. [Google Scholar] [CrossRef]
  17. Hosseinzadehtalaei, P.; Tabari, H.; Willems, P. Uncertainty assessment for climate change impact on intense precipitation: How many model runs do we need? Int. J. Climatol. 2017, 37, 1105–1117. [Google Scholar] [CrossRef]
  18. Van Uytven, E.; Willems, P. Greenhouse gas scenario sensitivity and uncertainties in precipitation projections for central Belgium. J. Hydrol. 2018, 558, 9–19. [Google Scholar] [CrossRef]
  19. Doutreloup, S.; Wyard, C.; Amory, C.; Kittel, C.; Erpicum, M.; Fettweis, X. Sensitivity to Convective Schemes on Precipitation Simulated by the Regional Climate Model MAR over Belgium (1987–2017). Atmosphere 2019, 10, 34. [Google Scholar] [CrossRef]
  20. Erpicum, M.; Nouri, M.; Demoulin, A. The climate of Belgium and Luxembourg. In Landscapes and Landforms of Belgium and Luxembourg; Springer International Publishing AG: Cham, Switzerland, 2018; pp. 35–41. [Google Scholar] [CrossRef]
  21. Poelman, D.R. A 10-Year Study on the Characteristics of Thunderstorms in Belgium Based on Cloud-to-Ground Lightning Data. Mon. Weather Rev. 2014, 142, 4839–4849. [Google Scholar] [CrossRef]
  22. Gallée, H.; Schayes, G. Development of a Three-Dimensional Meso-γ Primitive Equation Model: Katabatic Winds Simulation in the Area of Terra Nova Bay, Antarctica. Mon. Weather Rev. 1994, 122, 671–685. [Google Scholar] [CrossRef]
  23. Fettweis, X.; Box, J.E.; Agosta, C.; Amory, C.; Kittel, C.; Lang, C.; van As, D.; Machguth, H.; Gallée, H. Reconstructions of the 1900–2015 Greenland ice sheet surface mass balance using the regional climate MAR model. Cryosphere 2017, 11, 1015–1033. [Google Scholar] [CrossRef]
  24. Fettweis, X.; Franco, B.; Tedesco, M.; van Angelen, J.H.; Lenaerts, J.T.M.; van den Broeke, M.R.; Gallée, H. Estimating the Greenland ice sheet surface mass balance contribution to future sea level rise using the regional atmospheric climate model MAR. Cryosphere 2013, 7, 469–489. [Google Scholar] [CrossRef] [Green Version]
  25. Kittel, C.; Amory, C.; Agosta, C.; Delhasse, A.; Doutreloup, S.; Huot, P.-V.; Wyard, C.; Fichefet, T.; Fettweis, X. Sensitivity of the current Antarctic surface mass balance to sea surface conditions using MAR. Cryosphere 2018, 12, 3827–3839. [Google Scholar] [CrossRef] [Green Version]
  26. Agosta, C.; Amory, C.; Kittel, C.; Orsi, A.; Favier, V.; Gallée, H.; van den Broeke, M.R.; Lenaerts, J.T.M.; van Wessem, J.M.; van de Berg, W.J.; et al. Estimation of the Antarctic surface mass balance using the regional climate model MAR (1979–2015) and identification of dominant processes. Cryosphere 2019, 13, 281–296. [Google Scholar] [CrossRef]
  27. Wyard, C.; Scholzen, C.; Fettweis, X.; Van Campenhout, J.; François, L. Decrease in climatic conditions favouring floods in the south-east of Belgium over 1959–2010 using the regional climate model MAR. Int. J. Climatol. 2017, 37, 2782–2796. [Google Scholar] [CrossRef]
  28. Wyard, C.; Doutreloup, S.; Belleflamme, A.; Wild, M.; Fettweis, X. Global Radiative Flux and Cloudiness Variability for the Period 1959–2010 in Belgium: A Comparison between Reanalyses and the Regional Climate Model MAR. Atmosphere 2018, 9, 262. [Google Scholar] [CrossRef]
  29. Brasseur, O. Development and Application of a Physical Approach to Estimating Wind Gusts. Mon. Weather Rev. 2001, 129, 5–25. [Google Scholar] [CrossRef]
  30. Brasseur, O.; Gallée, H.; Creutin, J.-D.; Lebel, T.; Marbaix, P. High Resolution Simulations of Precipitation over the Alps with the Perspective of Coupling to Hydrological Models; Springer: Dordrecht, Netherlands, 2002; pp. 75–99. [Google Scholar]
  31. Fettweis, X.; Wyard, C.; Doutreloup, S.; Belleflamme, A. Noël 2010 En Belgique: Neige En Flandre Et Pluie En Haute-Ardenne. Bull. la Société Géographique Liège 2017, 68, 97–107. [Google Scholar]
  32. Termonia, P.; Van Schaeybroeck, B.; De Cruz, L.; De Troch, R.; Caluwaerts, S.; Giot, O.; Hamdi, R.; Vannitsem, S.; Duchêne, F.; Willems, P.; et al. The CORDEX.be initiative as a foundation for climate services in Belgium. Clim. Serv. 2018. [Google Scholar] [CrossRef]
  33. Dee, D.P.; Uppala, S.M.; Simmons, A.J.; Berrisford, P.; Poli, P.; Kobayashi, S.; Andrae, U.; Balmaseda, M.A.; Balsamo, G.; Bauer, P.; et al. The ERA-Interim reanalysis: Configuration and performance of the data assimilation system. Q. J. R. Meteorol. Soc. 2011, 137, 553–597. [Google Scholar] [CrossRef]
  34. Watanabe, M.; Suzuki, T.; O’ishi, R.; Komuro, Y.; Watanabe, S.; Emori, S.; Takemura, T.; Chikira, M.; Ogura, T.; Sekiguchi, M.; et al. Improved Climate Simulation by MIROC5: Mean States, Variability, and Climate Sensitivity. J. Clim. 2010, 23, 6312–6335. [Google Scholar] [CrossRef]
  35. Bentsen, M.; Bethke, I.; Debernard, J.B.; Iversen, T.; Kirkevåg, A.; Seland, Ø.; Drange, H.; Roelandt, C.; Seierstad, I.A.; Hoose, C.; et al. The Norwegian Earth System Model, NorESM1-M—Part 1: Description and basic evaluation of the physical climate. Geosci. Model Dev. 2013, 6, 687–720. [Google Scholar] [CrossRef]
  36. Connolley, W.M.; Bracegirdle, T.J. An Antarctic assessment of IPCC AR4 coupled models. Geophys. Res. Lett. 2007, 34, L22505. [Google Scholar] [CrossRef]
  37. Wyard, C. Climate change in Belgium: Recent and Future Evolution of Global Radiation and Hydroclimatic Conditions Favouring Floods Using the Regional Climate Model MAR. Ph.D. Thesis, University of Liège, Liège, Belgium, 3 December 2018. [Google Scholar] [CrossRef]
  38. Lang, C.; Fettweis, X.; Erpicum, M. Future climate and surface mass balance of Svalbard glaciers in an RCP8.5 climate scenario: A study with the regional climate model MAR forced by MIROC5. Cryosphere 2015, 9, 945–956. [Google Scholar] [CrossRef]
  39. Bechtold, P.; Bazile, E.; Guichard, F.; Mascart, P.; Richard, E. A mass-flux convection scheme for regional and global models. Q. J. R. Meteorol. Soc. 2001, 127, 869–886. [Google Scholar] [CrossRef]
  40. Lac, C.; Chaboureau, J.-P.; Masson, V.; Pinty, J.-P.; Tulet, P.; Escobar, J.; Leriche, M.; Barthe, C.; Aouizerats, B.; Augros, C.; et al. Overview of the Meso-NH model version 5.4 and its applications. Geosci. Model Dev. Discuss. 2018, 1–66. [Google Scholar] [CrossRef]
  41. Betts, A.K.; Miller, M.J. A new convective adjustment scheme. Part II: Single column tests using GATE wave, BOMEX, ATEX and arctic air-mass data sets. Q. J. R. Meteorol. Soc. 1986, 112, 693–709. [Google Scholar] [CrossRef]
  42. Janjić, Z.I. The Step-Mountain Eta Coordinate Model: Further Developments of the Convection, Viscous Sublayer, and Turbulence Closure Schemes. Mon. Weather Rev. 1994, 122, 927–945. [Google Scholar] [CrossRef] [Green Version]
  43. Skamarock, C.; Klemp, B.; Dudhia, J.; Gill, O.; Barker, D.; Duda, G.; Huang, X.; Wang, W.; Powers, G. A Description of the Advanced Research WRF Version 3; NCAR Technical Note NCAR/TN-475+STR; Mesoscale and Microscale Meteorology Division, National Center for Atmospheric Research: Boulder, CO, USA, 2008. [Google Scholar] [CrossRef]
  44. Kain, J.S. The Kain–Fritsch Convective Parameterization: An Update. J. Appl. Meteorol. 2004, 43, 170–181. [Google Scholar] [CrossRef]
  45. Zhang, C.; Wang, Y.; Hamilton, K. Improved Representation of Boundary Layer Clouds over the Southeast Pacific in ARW-WRF Using a Modified Tiedtke Cumulus Parameterization Scheme. Mon. Weather Rev. 2011, 139, 3489–3513. [Google Scholar] [CrossRef]
  46. Tiedtke, M. A Comprehensive Mass Flux Scheme for Cumulus Parameterization in Large-Scale Models. Mon. Weather Rev. 1989, 117, 1779–1800. [Google Scholar] [CrossRef] [Green Version]
  47. Hawkins, E.; Sutton, R. The potential to narrow uncertainty in projections of regional precipitation change. Clim. Dyn. 2011, 37, 407–418. [Google Scholar] [CrossRef]
  48. Belleflamme, A.; Fettweis, X.; Erpicum, M. Do global warming-induced circulation pattern changes affect temperature and precipitation over Europe during summer? Int. J. Climatol. 2015, 35, 1484–1499. [Google Scholar] [CrossRef]
  49. Rajczak, J.; Pall, P.; Schär, C. Projections of extreme precipitation events in regional climate simulations for Europe and the Alpine Region. J. Geophys. Res. Atmos. 2013, 118, 3610–3626. [Google Scholar] [CrossRef]
  50. Nikulin, G.; Kjellströ, M.E.; Hansson, U.; Strandberg, G.; Ullerstig, A. Evaluation and future projections of temperature, precipitation and wind extremes over Europe in an ensemble of regional climate simulations. Tellus A Dyn. Meteorol. Oceanogr. 2011, 63, 41–55. [Google Scholar] [CrossRef] [Green Version]
  51. Saeed, S.; Brisson, E.; Demuzere, M.; Tabari, H.; Willems, P.; Van Lipzig, N.P.M.; Saeed, S. Multidecadal convection permitting climate simulations over Belgium: Sensitivity of future precipitation extremes. Atmospjeric Sci. Lett. 2017, 18, 29–36. [Google Scholar] [CrossRef]
  52. Brouwers, J.; Peeters, B.; Van Steertegem, M.; van Lipzig, N.; Wouters, H.; Beullens, J.; Demuzere, M.; Willems, P.; De Ridder, K.; Maiheu, B.; et al. MIRA Climate Report 2015, about Observed and Future Climate Changes in Flanders and Belgium; Flanders Environment Agency: Aalst, Belgium, 2015. [Google Scholar]
Figure 1. Model elevation of the study area (in meters). The dotted black lines represent the 100-m and 300-m elevation; the blue lines represent the main rivers in our studied area, and the country (in red letters) borders are shown by solid black lines.
Atmosphere 10 00321 g001
Figure 2. (Top) ERA-Interim: Mean annual precipitation (in mm/year) over 1987–2017 simulated by Modèle Atmosphérique Régional (MAR) forced by ERA-Interim for the five convective schemes. (Middle) PRESENT: Anomalies (in mm/year) between the mean annual precipitation over 1987–2017 simulated by MAR forced by MIROC5 and NorESM1-M compared to MAR-ERA for the five convective schemes. (Bottom) FUTURE: Future changes (in mm/year) between the mean annual precipitation over 2070–2100 simulated by MAR forced by MIROC5 and by NorESM1-M compared to MAR forced by MIROC5 and by NorESM1-M over 1987–2017 for the five convective schemes. Cross-hatched pixels indicate that anomalies are statistically insignificant with respect to the interannual variability of the reference field. MAR-STD represents the results of MAR using the standard version of the convective scheme (based on the former version of the MESO-NH model); MAR-MES uses a new version of the convective scheme from the MESO-NH model; MAR-BMJ uses the Betts–Miller–Janjić convective scheme; MAR-KFS uses the Kain–Fritsch convective scheme while MAR-NTK uses the modified Tiedtke convective scheme.
Atmosphere 10 00321 g002
Figure 3. Same as Figure 2, but for the 95th percentile of daily precipitation in mm/day.
Atmosphere 10 00321 g003
Figure 4. Same as Figure 2, but for the ratio between convective precipitation and total precipitation in %/year.
Atmosphere 10 00321 g004
Figure 5. Same as Figure 2, but for the annual mean number of dry days (days without precipitation) in days/year.
Atmosphere 10 00321 g005
Figure 6. Mean present anomalies (Histo-ERA-Interim) of annual precipitation (mm/year) versus future differences (RCP8.5-Histo) of annual precipitation (mm/year) for each pixel of the Belgian domain of MAR forced by the GCMs MIROC5 (left) and NorESM1-M (right). Each color represents the MAR version depending on the convection scheme used. “Histo” and “ERA-Interim” correspond to the present-day simulation period (1987–2017) when MAR is forced by both GCMs based Historical scenarios or by the ERA-Interim reanalysis.
Atmosphere 10 00321 g006
Figure 7. Annual precipitation anomalies (in mm/year) between the future period 2070–2100 and the present period 1987–2017 from MIROC5 (left) and NorESM1-M (right). Cross-hatched pixels indicate that values are statistically insignificant.
Atmosphere 10 00321 g007
Figure 8. Anomalies of annual mean vertical temperature profiles (in °C) between all MAR experiments and the MAR-STD experiment between the surface and 7000 m above the surface. The vertical profiles are here averaged over Belgium.
Atmosphere 10 00321 g008
Figure 9. Projected evolution (2070–2100) of the mean annual temperature profiles for MIROC5 (A) and NorESM1-M (C) in °C and of the specific humidity profile for MIROC5 (B) and NorESM1-M (D) in g/kg with regard to the present climate (1987–2017) and averaged over the study domain.
Atmosphere 10 00321 g009

