Article

Decarbonizing Space and Water Heating in Temperate Climates: The Case for Electrification

1
Department of Environmental Sciences, Western Washington University, Bellingham, WA 98225, USA
2
Energy and Resources Group, University of California, Berkeley, Berkeley, CA 94720, USA
*
Author to whom correspondence should be addressed.
Atmosphere 2019, 10(8), 435; https://doi.org/10.3390/atmos10080435
Submission received: 2 June 2019 / Revised: 15 July 2019 / Accepted: 18 July 2019 / Published: 27 July 2019

Abstract

:
In order to meet ambitious carbon reduction goals, direct combustion of fossil fuels in homes will need to largely cease. The largest portion of this reduction will likely come from energy efficiency, but efficiency alone will not be sufficient. In this paper we look specifically at California and build the case for why energy efficiency with electrification of heating is the most likely path to achieve the large carbon emission reduction needed from this sector. We examine alternative decarbonization strategies, such as solar thermal, biogas, synthetic natural gas and electrification and show why electrification is the most promising path. We evaluate these options across the dimensions of scale, cost, and suitability. We find that, while electrification has the potential to serve all heating loads, the other low-carbon options may serve only 2–70% of loads. We also expect that electrification could reduce emissions from this sector at a cost 25–90+% less than other options.

1. Introduction

California has an ambitious goal of reducing carbon emissions 80% below 1990 levels by 2050 [1], and in order to meet this goal all aspects of the energy system will need significant changes. Impressive progress already has been made: a rapidly expanding share of renewables in electricity generation and almost 40 years of pioneering energy efficiency policy. Senate Bill 100, signed in 2018, also mandates that electricity be carbon free by 2045. Decreasing costs of wind and solar and gaining market shares of these resources will impact how we decarbonize other sectors, such as heating [2,3].
Technical potential studies show that meeting such aggressive 2050 emission reduction goals is possible in California, the US, and Europe—but these studies consistently include substantially reducing or eliminating direct emissions from residential space and water heating as a necessary measure [4,5,6,7,8,9]. In order to achieve a goal of emissions getting to 80% below 1990 levels by 2050, it is likely that emissions from buildings will need to decrease by even more than 80% as other sectors may be more difficult than buildings to decarbonize. The Deep Decarbonization study [6] found that in order for the US to reduce emissions 80% below 1990 levels by 2050, the emissions from buildings would need to decrease by even more. They consider four scenarios which reduce emissions by 87% relative to a baseline 2050 case and 86% below 2014 emissions. Much larger reductions come from the residential sector, with reductions ranging from 89–98%, depending on the scenario [6]. Reductions in other sectors like air travel, trucking and industry may be more difficult and costly than decarbonizing buildings.
There has been little progress so far in reducing emissions from direction combustion in the residential and commercial buildings sector and current trends suggest that, without policy intervention, emissions reductions in the buildings sector will not be met. Figure 1 shows how much gas the residential and commercial sectors have used in California [10]. The 2050 points show what an 80% reduction from 1990 levels would look like in 2050. Energy efficiency potentially could make up part of this reduction but after almost 45 years of energy efficiency programs [11] total California gas consumption trends are not declining quickly enough.
Historically, the residential space and water heating sector has received little attention in climate policy relative to larger emissions sources like electricity generation and transportation [4]. While this sector represents a much smaller share of total emissions, the complexity of achieving the necessary changes is profound: it requires changes on the long timescales of building stock turnover and it requires an understanding of how consumers adopt new technologies. These complexities suggest that policymakers need to devote attention to this sector soon.
Changing how we heat space and water requires decisions with lasting consequences. For example, investing in decarbonized gas infrastructure might lock us in to that pathway for decades, while moving away from gas would impact investments in natural gas infrastructure and force us to rethink subsidies for gas-efficient appliances. As customers electrify heating and less gas is sold, the delivery cost of each unit of gas would increase to cover the fixed costs of maintaining gas infrastructure. Greater electricity consumption, particularly if new heating loads are flexible, could increase load factors of electricity infrastructure leading to lower electricity prices. Widespread fuel switching could potentially lead to a death spiral in which retail gas prices rise, electricity prices fall and customers continue to switch away from gas.
Political and institutional barriers exist that will make the energy system slow to change. Gas utilities, particularly those that are separate from electric utilities, would strongly resist policies that reduce their earnings. Customers surely would also resist either being disconnected from a gas supply or having to pay exorbitant rates to cover infrastructure costs. Choosing another path, such as decarbonized gas, would require large infrastructure investments in facilities that can produce biogas or synthetic methane. If such investments are made, they may encourage continued gas use for space and water heating. We need to decide which path is better—though different optimal paths may exist in different locations. Since the building stock is slow to change, policies need to be put in place soon. In order to avoid stranded investments, maximize cumulative emissions reductions and achieve carbon reductions at the lowest cost, policy and planning is required now to drive investment in lower carbon alternatives and to plan for infrastructure changes.
In this paper, we compare different strategies that could achieve emissions reductions in the residential sector. Utilities, analysts and policymakers still debate which path is best [12,13,14,15,16]. Given this uncertainty, we take a deeper look at the options available.
In 2014 about 5% of total US greenhouse gas (GHG) emissions, or 345.1 million metric tons of CO2-equivalent, came from combustion of fossil fuels in the residential sector [17], with about 69% of this coming from space heating and 22% from water heating [18]. In California, a similar fraction of statewide GHG emissions (6%) is the result of direct combustion of fossil fuels in the residential sector [19].
In 2009, approximately 80% of households served by five major utilities in California used natural gas as the primary fuel for space heating and water heating and those households used an average of 354 therms (37 GJ) of natural gas per year for all uses [20]. Natural gas heating dominates today in California because of the relative prices of retail electricity and natural gas and because of the additional capital costs that come with solar water heating, heat pumps or decarbonized pipeline gas infrastructure.
Space and water heating are not the only uses of natural gas in the residential sector, with clothes drying, pools, cooking and other miscellaneous uses accounting for about 14 percent of residential gas consumption as shown in Figure 2. While small amounts of gas are used in these sectors, a thoughtful decarbonization strategy would need to take these uses into account.
This paper evaluates the options and concludes that electrification of heating, with improved energy efficiency, will be the preferred path to meet emission reductions goals of the residential space and water heating sector in California or similar climates. Strategies for other regions are also discussed.

2. Materials and Methods

There are four broad strategies by which an economy can decarbonize: energy efficiency, low carbon electricity, decarbonized fuels and fuel-switching [7].
Taking these options and mapping them to our options for decarbonizing residential space and water heating, we see four similar choices: Energy efficiency, Solar thermal (capturing solar radiation to heat a fluid that is used to heat space or water), Decarbonized pipeline gas (injecting biogas, synthetic methane and/or hydrogen produced from renewable electricity into the natural gas system) and Electrification (switching from gas furnaces and boilers to heat pumps—or potentially electric resistance heat in limited cases—that use low carbon electricity). These options come with different services, costs, speeds, scales and implications for market participants.
As will be made clear in this analysis, the heat pump is the key piece of the residential heating decarbonization puzzle. If consumers are offered a reliable, durable, affordable and high-performing heat pump then electrification is the clear path to decarbonize space and water heating because of the triple efficiency gain compared to resistance heating. Without heat pumps, decarbonization goals will be more difficult to achieve and will rely on solar water heating or decarbonized gas, with existing forced air systems being served by decarbonized gas and hot water heating served by solar water heaters.
We treat the energy efficiency option differently, as any decarbonization strategy will benefit from first reducing the amount of energy needed. We simply point out that energy efficiency alone will be insufficient to meet decarbonization goals. With the exception of energy efficiency, we evaluate each decarbonization option by asking three basic questions:
  • Is there enough?
  • How much would it cost?
  • What is the best end use of this resource?

3. Results

3.1. Energy Efficiency

Energy efficiency has long been considered the “cheapest, cleanest, fastest” energy resource [21]. Efficiency can take many forms, such as more efficient appliances, changes to industrial processes, deep retrofits of existing buildings and weatherization. Energy efficiency is important because it can reduce the total cost of other decarbonization options and it typically has the lowest environmental impact compare to supply side resources.
Energy efficiency alone will be insufficient to reduce emissions in the buildings sector by more than 80% by 2050. Efficiency improvements in the buildings sector are capital and labor intensive and it is impossible to retrofit the large existing building stock overnight. Reaching this emissions target with efficiency alone would require an absolute reduction of emissions of about 5% per year. Even a 2% per year reduction in energy use would be far greater than we have seen in the recent past, yet would reduce emissions by only 50% over the next 35 years. Nadel et al. estimate that a reduction of energy use by 40–60% by 2050 could be cost effective through more efficient equipment, zero net energy buildings, industrial improvements, deep building retrofits and advanced vehicles [22]. Wei et al. estimate that energy efficiency could lead to a 43% emission reduction in California [4]. Reaching such improvements in energy efficiency would require sustained improvements in energy efficiency that yield 1.5% reductions in energy use every year. Loftus et al. reviewed 17 decarbonization scenarios in the literature, which included reductions of energy intensity in the range of 1.6–3.4%. They also point out that since 1970 global energy intensity has improved greater than 1.5% only a few times [23]. Total energy use may increase as energy intensity decreases because energy intensity is based on economic activity. In order to save energy in absolute terms, energy intensity will need to come down at a rate greater than economic growth. The most aggressive decarbonization scenario included in the Loftus et al. study estimated a reduction in energy use (not intensity) of 3.6%/year [24]. Even if those aggressive savings targets are achieved, they will be insufficient to meet deep decarbonization goals on their own.
In summary, the rate at which we need to reduce energy use is far greater than what we have achieved in the past and far greater than what many experts think is possible. The total reduction in emission that will come from efficiency alone will only get us about halfway to our goal. Therefore, we need to investigate other possibilities for decarbonizing the buildings sector.

3.2. Solar Water Heating

Solar thermal options like solar water heating (SWH) or even passive solar design for space heating are similar to energy efficiency measures because they simply reduce demand for other fuels to provide an energy service. Solar water heating works by running water or some other heat transfer fluid through collectors. If another fluid is used, the heat is exchanged to heat up water. This hot water is stored in a tank and either used directly or, if not hot enough, heated with an electric or gas water heater.
  • Is there enough? A typical solar fraction of solar water heating is in the 0.5 to 0.7 range which means that 30–50% of another fuel is used after installing a solar hot water system [25]. Of course, it is possible that a larger system could be installed that would increase the solar fraction but such a system would be uneconomic because it would produce unusable heat at certain times of year or cause overheating of the system. At some point, the marginal unit of heat produced would come at a price far higher than producing that heat from electricity or natural gas. If all buildings could be suitable for SWH installations, we might assume that 70% of emissions could be reduced. Unfortunately, not all buildings will have space available for unshaded, well-oriented solar collectors. Together with efficiency, SWH could provide the 80+% savings that may be necessary to meet emission reduction goals but it is unlikely the most cost-effective path.
  • How much would it cost? A 2009 Itron study found an average levelized cost of saved energy of $2.52/therm ($23.86/GJ) for systems that displace gas, assuming a 25-year life with no additional maintenance issues over the life of the system [25]. However, in practice SWH systems require periodic inspections and maintenance. With a price premium of saved energy of about $1.20/therm over the retail price of natural gas (assuming a retail natural gas price of about $1.30/therm), that would be equivalent to a carbon tax of $200 per ton of CO2. The Itron study also compared these installed costs with other market data in Hawaii, Oregon, Northern Europe, China and India. Capital costs in all regions other than China and India were similar (within about $1000). Costs in China and India were found to be less than one tenth the cost in California. This may be due to smaller systems and lower labor costs. If these large cost reductions for SWH are possible in California (and they outpace cost reductions in photovoltaic systems) then SWH may play an important role in decarbonization. But today, as we show later in this section, the economics clearly favor solar photovoltaics with heat pump water heating in California.
  • What is the best end use for this resource? The resources that SWH uses are rooftops and dollars. At the current state of technology, photovoltaics are a better use of both. While SWH has higher thermal efficiencies compared to solar photovoltaic (PV) panels (40% vs 15% efficient) and matches supply and end uses in energy quality [26], it is not currently the best use of rooftops and dollars. Though it is a relatively low-tech solution that potentially is also low cost, given technology advancements and major cost reductions in PV, the present case for SWH is weak as we will illustrate later in this section. Furthermore, the efficiency difference between PV and SWH is somewhat misleading, since they deliver different forms of energy. Electricity is far more valuable than heat. The electricity that a PV system could produce can be used in a heat pump water heater (HPWH). A heat pump could have a coefficient of performance (COP) of 3 or more, tripling the system efficiency and putting the PV on par with SWH in terms of total system efficiency (solar energy converted into heat). COP refers to the efficiency of a heat pump (the amount of heat delivered divided by the energy input). COP can be higher than 1 (or 100%) because it is not converting energy into heat but rather it is using energy to move heat from one place to another.
    Consider a few scenarios to further clarify our pessimistic assessment of the potential of SWH for decarbonization. First, if the consumer has an electric resistance hot water heater, they could switch to a heat pump and gain about the same energy savings at half the cost, with the average installed cost of a HPWH being around $3000. If they already have a HPWH, the value of the energy savings that would come from a SWH would be cut by a factor of 2 or more—leading to a cost of saved electricity twice as much as what was found in the Itron study. If a heat pump was already installed, the economics of adding solar water heating would not be favorable, as the cost of saved energy would be far higher than the cost of energy. On the other hand, if SWH were installed first, the economics of switching from a resistance to a heat pump would not be favorable. The order of events matters.
The biggest drawback of SWH is that they simply do not reduce emissions enough. If the goal is to eliminate residential emissions from natural gas combustion, then cutting only two thirds of those emissions from water heating still leaves us far from our goal. Policymakers should be cognizant of the impact that SWH could have in the future. While SWH might reduce emissions today, choosing SWH could lock remaining emissions in further into the future by changing the future economics of electrification. Instead of spending $6000 on a SWH system, a homeowner could choose to spend $3000 on a HPWH and $3000 on a 1 kW PV system [3]. This assumes a $3/W installed PV cost. The total installed cost of a residential PV systems in 2015 was $4/W on average in the US and $1.7/W in Germany. That PV system could produce 1555 kWh/year in San Francisco [27], or 159 therms (17 GJ) of heat delivered with a COP of 3. The average Pacific Gas and Electric customer used 183 therms (19 GJ) for water heating, which, assuming an 80% efficient hot water heater, is 146 therms (15 GJ) of delivered water heating energy. In other words, the $6000 spent on a HPWH+PV system would be net zero energy, while the SWH would cut energy only by about 2/3. Choosing the HPWH+PV would therefore provide a greater climate benefit. While HPWH+PV might be zero net energy, it would not necessarily be zero emissions since not all consumption would come directly from the PV and the energy sold back to the grid might displace lower emission generation than the energy that would be bought from the grid. This analysis compares the costs of systems at the household level to give a sense of the economics of SWH and PV.
Despite challenging economics for SWH, in some scenarios it could be a part of the mix. Solar fraction (the fraction of total annual water heating energy use that is supplied by the SWH system) can vary widely between northern and southern California, ranging from 0.55 to greater than 0.85 [28]. SWH in areas with very high solar fractions could be a part of a smart decarbonization strategy, particularly with cost reductions—though those areas also will have more productive PV systems.
A variety of decarbonization options, like SWH, will be important to hedge risk of other strategies not delivering on their potential to decarbonize the water heating sector. SWH are an old, proven technology and can deliver emissions reductions. Because of their high cost, they should not be the first choice for decarbonizing water heating. For space heating, SWH could be useful in buildings that use hot water to distribute heat and it could also be useful in new construction with hydronic heating systems, but the transition cost of existing buildings would be cost prohibitive.
Photovoltaic thermal hybrid solar collectors (PVT) generate both electricity and heat. The system efficiency is higher because the PV can operate more efficiently when cooler and some energy that is not converted to electricity is captured as heat. With cost reductions, PVT systems could also potentially decarbonize heating more cheaply than PV + HPWH. Further research, development and deployment is needed to drive costs down.
In summary, SWH come at a high capital cost and still require another energy resource for backup. If that other energy resource is natural gas, then we cannot decarbonize with SWH alone. If that other resource is electricity, then we would be better off from both a financial and emissions point of view by using the rooftop to produce electricity.

3.3. Decarbonized Pipeline Gas

Another decarbonization option is to leave heating systems in the building stock alone but distribute fuels that have lower lifecycle carbon emissions. The biggest advantage of this strategy is that it requires no action on the part of consumers. Motivating consumers to take action when it comes to energy use has been challenging and well documented in the energy efficiency gap literature. Transitioning to SWH or electric heating would be another case in which a large number of consumers would need to take coordinated actions to reduce carbon emissions. Experience with energy efficiency investments show that consumers are hesitant to respond, have high hurdle rates to make efficiency investment, only invest with very short paybacks—and often do not get the expected savings [29,30,31,32]. Decarbonized pipeline gas overcomes these barriers and of the four strategies to decarbonize space and water heating, only decarbonizing pipeline gas can be achieved through central planning. Along with this potential benefit, decarbonizing pipeline gas would also be preferable for natural gas utilities because it would allow their business to survive while meeting deep decarbonization goals. Decarbonizing pipeline gas makes it easy for consumers and avoids resistance from the natural gas industry.
Three main options fall into this category of fuel: biogas, hydrogen and synthetic methane. We discuss these options in greater detail in this section.

3.3.1. Biogas

If decarbonized gas were used to reduce emission from space and water heating end uses in California, it would most likely come predominantly from biogas. A recent study of the costs of decarbonizing using an electric-only or mixed case (which included decarbonized gas) found that costs were comparable for both options [15]. This study relied on California receiving a population-weighted share of all biomass produced in the United States in a best-case scenario of biomass production [33]. The other environmental impacts of such a high level of biomass production were not taken into account. This study along with several other studies funded by the natural gas industry have concluded that “renewable gas” is a realistic path to decarbonize residential gas end uses. Biomass can be considered to be decarbonized since there are low net emissions when it is combusted. While combustion still releases CO2, there are avoided emissions that would have occurred had the biomass decomposed.
Biogas could come from either anaerobic digestion or thermochemical processes that take animal waste, energy crops, wastewater, municipal solid waste or wood and agricultural residues as inputs. The environmental impacts of these feedstocks vary widely. On one hand, combusting methane that is being produced anyway, such as landfill gas, could have a positive impact. On the other hand, production of other dedicated energy feedstocks might have other negative environmental impacts and land use change impacts. Directing some feedstocks to energy uses might have net negative impacts, such as the higher emissions in the near term and a reduction of organic material available for composting [34].
  • Is there enough? The simple answer is no, there is not enough biogas to serve all current natural gas uses. Even with very aggressive growth in biomass production, it will be challenging to replace our current use of fossil fuels. The total consumption of natural gas in 2016 was 28.5 quadrillion BTUs. Today biomass makes up about 5% of total primary energy consumption in the United States [35] or about 4.95 quadrillion BTUs out of 97.4 quadrillion BTUs in 2016. If we assume that a dry ton of biomass is equivalent to 16 million BTUs of primary energy, as was done in a recent United States Department of Energy (DOE) report [33], then that assumes about 309 million dry tons of biomass were used in 2016. Perlack et al.’s 2012 estimate of biomass use was 214 million dry tons in the Billion Ton Study. Either the 2012 estimate was low, the EIA counts biomass uses that were not included in the Billion Ton Study or the energy content of biomass is greater than 16 million BTU per dry ton. For the purposes of this analysis, this difference is noted but it is small relative to the potential increase in biomass production. Depending on the scenario, Perlack et al. find that 2030 biomass production could range from 1094 to 1633 million dry tons [33]. However, since we are interested in examining the potential of biomass to replace fossil fuels, the energy content of this resource needs to be derated. The conversion efficiency of biomass to biogas may range from 62–81% and the efficiency of converting biomass to ethanol ranges from 46–56% [36]. Depending on the type of generator, conversion of biomass to electricity is likely less efficient than coal or gas plants, with a heat rate of 13,000 BTU per kWh rather than typical heat rates of 10,000 BTU/kWh for coal steam generators and 7600 BTU/kWh for combined cycle gas generators [37]. While biomass may contain on average 16,000 BTU per dry ton, this energy is less usable than other fossil energy resources. In order to have a fair comparison with fossil fuels, we conservatively derate the energy potential of biomass by 25% in Figure 3.
    We find that, relative to all fossil fuels currently used, aggressive biomass production above current biomass consumption use could replace 19% of current fossil fuel consumption or provide a total of about 19 quads of primary energy annually. Other renewable generation will likely reduce some of this future demand for fossil fuels but biomass is nowhere close to meeting all of our energy needs. Two other studies by the natural gas industry, one by National Grid and another by the American Gas Foundation examined the potential for “renewable gas” in the the Northeast and US respectively. National Grid found that the technical potential of renewable gas could serve 16% of existing gas demand in MA, NY, NH and RI [38]. A broader nationwide study by the American Gas Foundation found that renewable gas could serve 1–2.5 quadrillion BTUs per year, with a technical potential of up to 9.5 quadrillion BTUs [39]. Studies consistently show that biomass alone can provide only 1–20% of our primary energy needs.
  • How much would it cost? The mature market price of biogas is highly uncertain. However, with the assumption that the biomass resources would cost $60/ton [33] and that ton would produce about 90 therms [15], the per therm price of the feedstock alone would be 66 cents per therm, which is about double current Henry Hub gas prices [40]. Recent biogas prices have been double the projected feedstock price or four times the natural gas market price [41]. If we assume that biogas has a price premium of $1.80/therm, that would be equivalent to a carbon tax of $295 per metric ton of CO2 (assuming a carbon intensity of natural gas of 13.446 lbs/therm [42]).
  • What is the best end use for this resource? If our broad goal is to decarbonize and reduce the use of fossil fuels, biomass will be able to play a larger role than it currently does. But as shown above, it is not large enough alone. Given that the biomass supply will be constrained (particularly if we want to avoid the worst environmental side effects of increased biomass production) there certainly will be better uses for it than space and water heating in California or temperate climates. Some existing end uses, like industrial process heat, heavy duty vehicles and aviation will be more challenging to decarbonize, so biomass resources would have a bigger impact for those end uses.
    In addition to these end uses, using biomass for electricity generation would be more effective than residential heating. A ton of biomass can be converted to about 9.5 GJ of biogas or 6.5 GJ of electricity through combustion [15]. Combustion of biomass for electricity generation provides three benefits relative to conversion of biomass to biogas. First, 6.5 GJ of electricity is more valuable for heating than 9.5 GJ of biogas. When used in a heat pump, a GJ of electricity delivers 2–3 GJ of heat. One GJ of biogas on the other hand might deliver only 0.95 GJ of heat. While the efficiency of the conversion of biomass to biogas is higher than the efficiency of the conversion of biomass to electricity, the system efficiency is lower when we look at whole system of biomass to heat. A ton of biomass might provide 9 GJ of heat through the biogas pathway, while it could provide 19 GJ of heat through the electrification pathway. Second, combustion of biomass is about a third of the cost per ton compared to conversion to biogas. So, you derive 1.5–2 times as much heat per ton of biomass at a third the cost. Finally, combustion of biomass, together with carbon capture and storage allows for negative net emissions.
    Higher priority uses of biomass could be as fuels in difficult to decarbonize sectors. If it is used for heating in California, it could be used far more efficiently by first converting it to electricity and electrifying heating systems. But what about the use of biomass in other parts of the country? If biogas were indeed produced for residential heating, colder climates should be given priority for this resource before California. Electrifying heating systems in temperate climates would not require large expansion of electricity infrastructure, but this would not necessarily be the case in very cold climates where power systems would need to be much larger to support electric heating systems. Biogas could have a much bigger net impact per dollar in very cold climates than in temperate climates.
Finally, using decarbonized gas does make it easy (on the demand side) to decarbonize gas end uses but there are consequences. Leaking gas infrastructure can have a major environmental impact. While natural gas has been regarded as a bridge fuel from coal to renewables, some suggest that when accounting for leakage, it may not have any emissions benefit [43]. Combustion in distributed furnaces and water heaters makes carbon capture impossible.

3.3.2. Hydrogen and Synthetic Natural Gas

Another way to reduce emissions of residential natural gas combustion is to replace natural gas with synthetic methane or hydrogen that has been produced with low-carbon electricity. This process is known as power to gas (P2G). Similar to biogas, hydrogen or synthetic methane could be a direct replacement for natural gas in existing infrastructure. Hydrogen can be produced using excess renewable electricity to electrolyze water to generate hydrogen. This hydrogen can then be mixed in to the natural gas system at fractions up to 10% or put through a methanation process to create synthetic methane [44]. Generating hydrogen or synthetic methane from excess renewable electricity production could be a flexible load that could be used to deal with variability of wind and solar generation. It would also have the potential to seasonally store energy from renewables in the natural gas infrastructure both directly and by displacing other fossil gas usage by varying amounts over the year. Rather than curtailing renewables during times of overproduction, this energy could be used to produce other fuels.
As in the previous section, we ask three fundamental questions about this option.
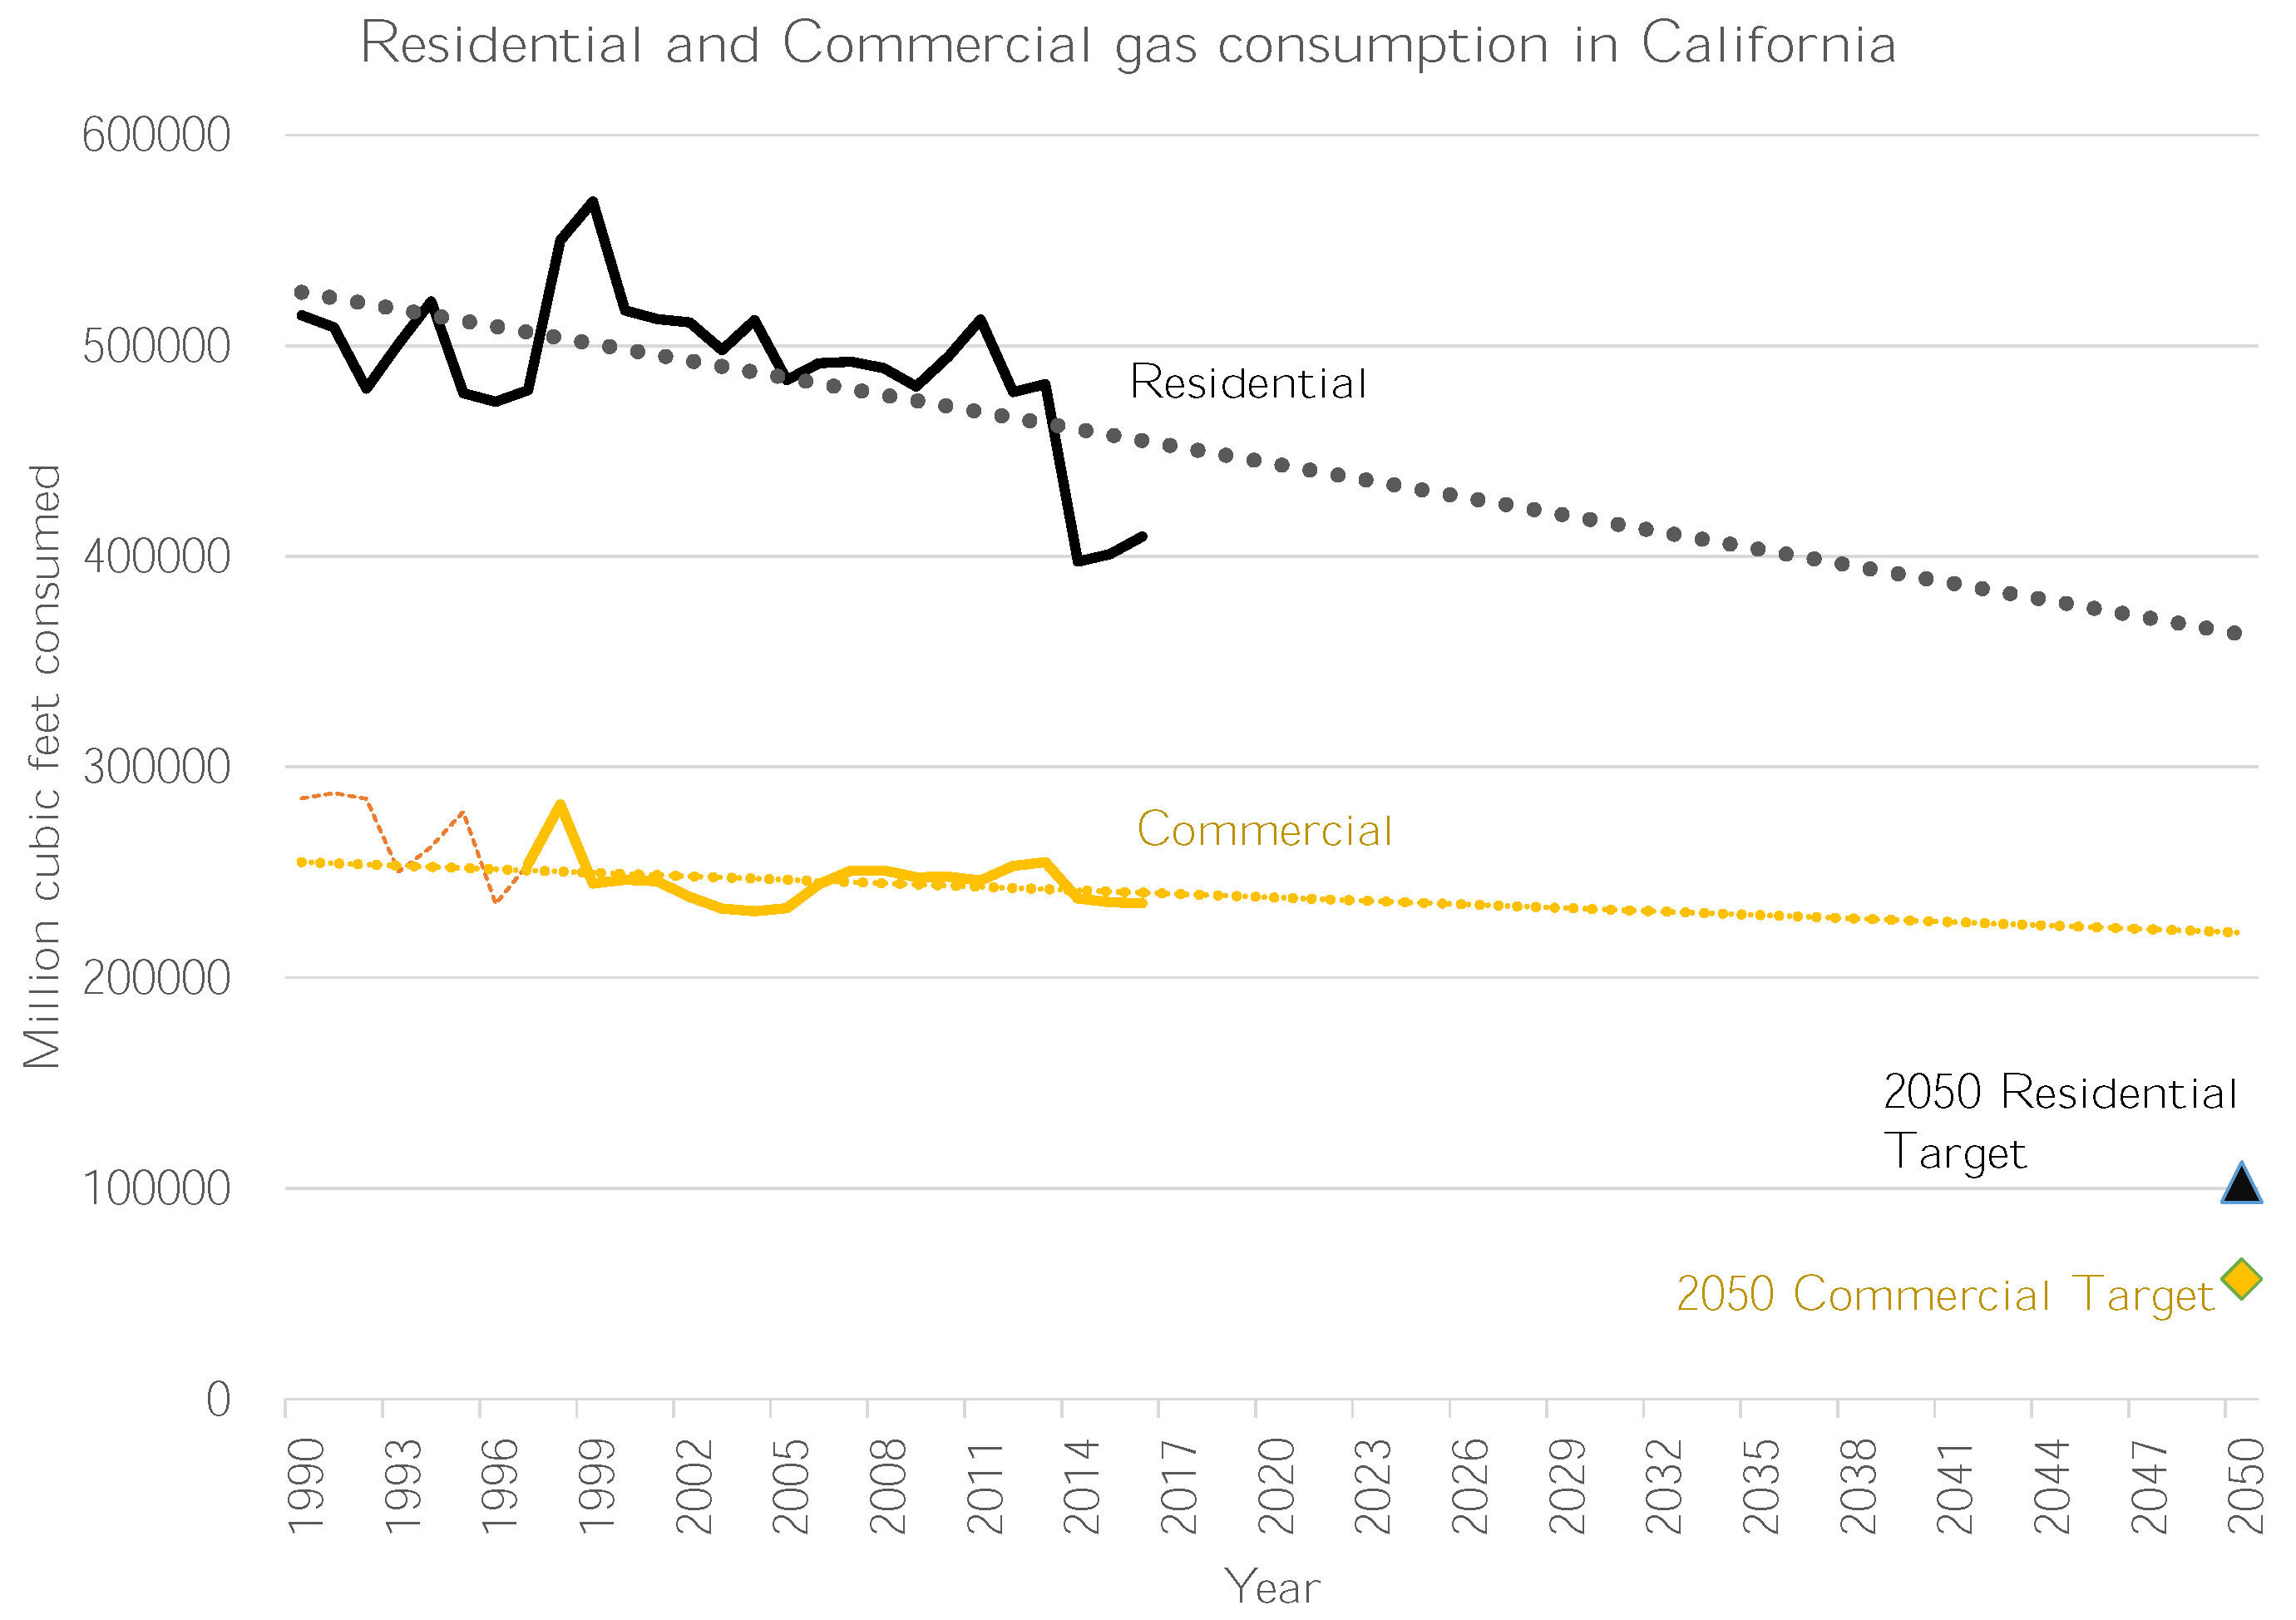
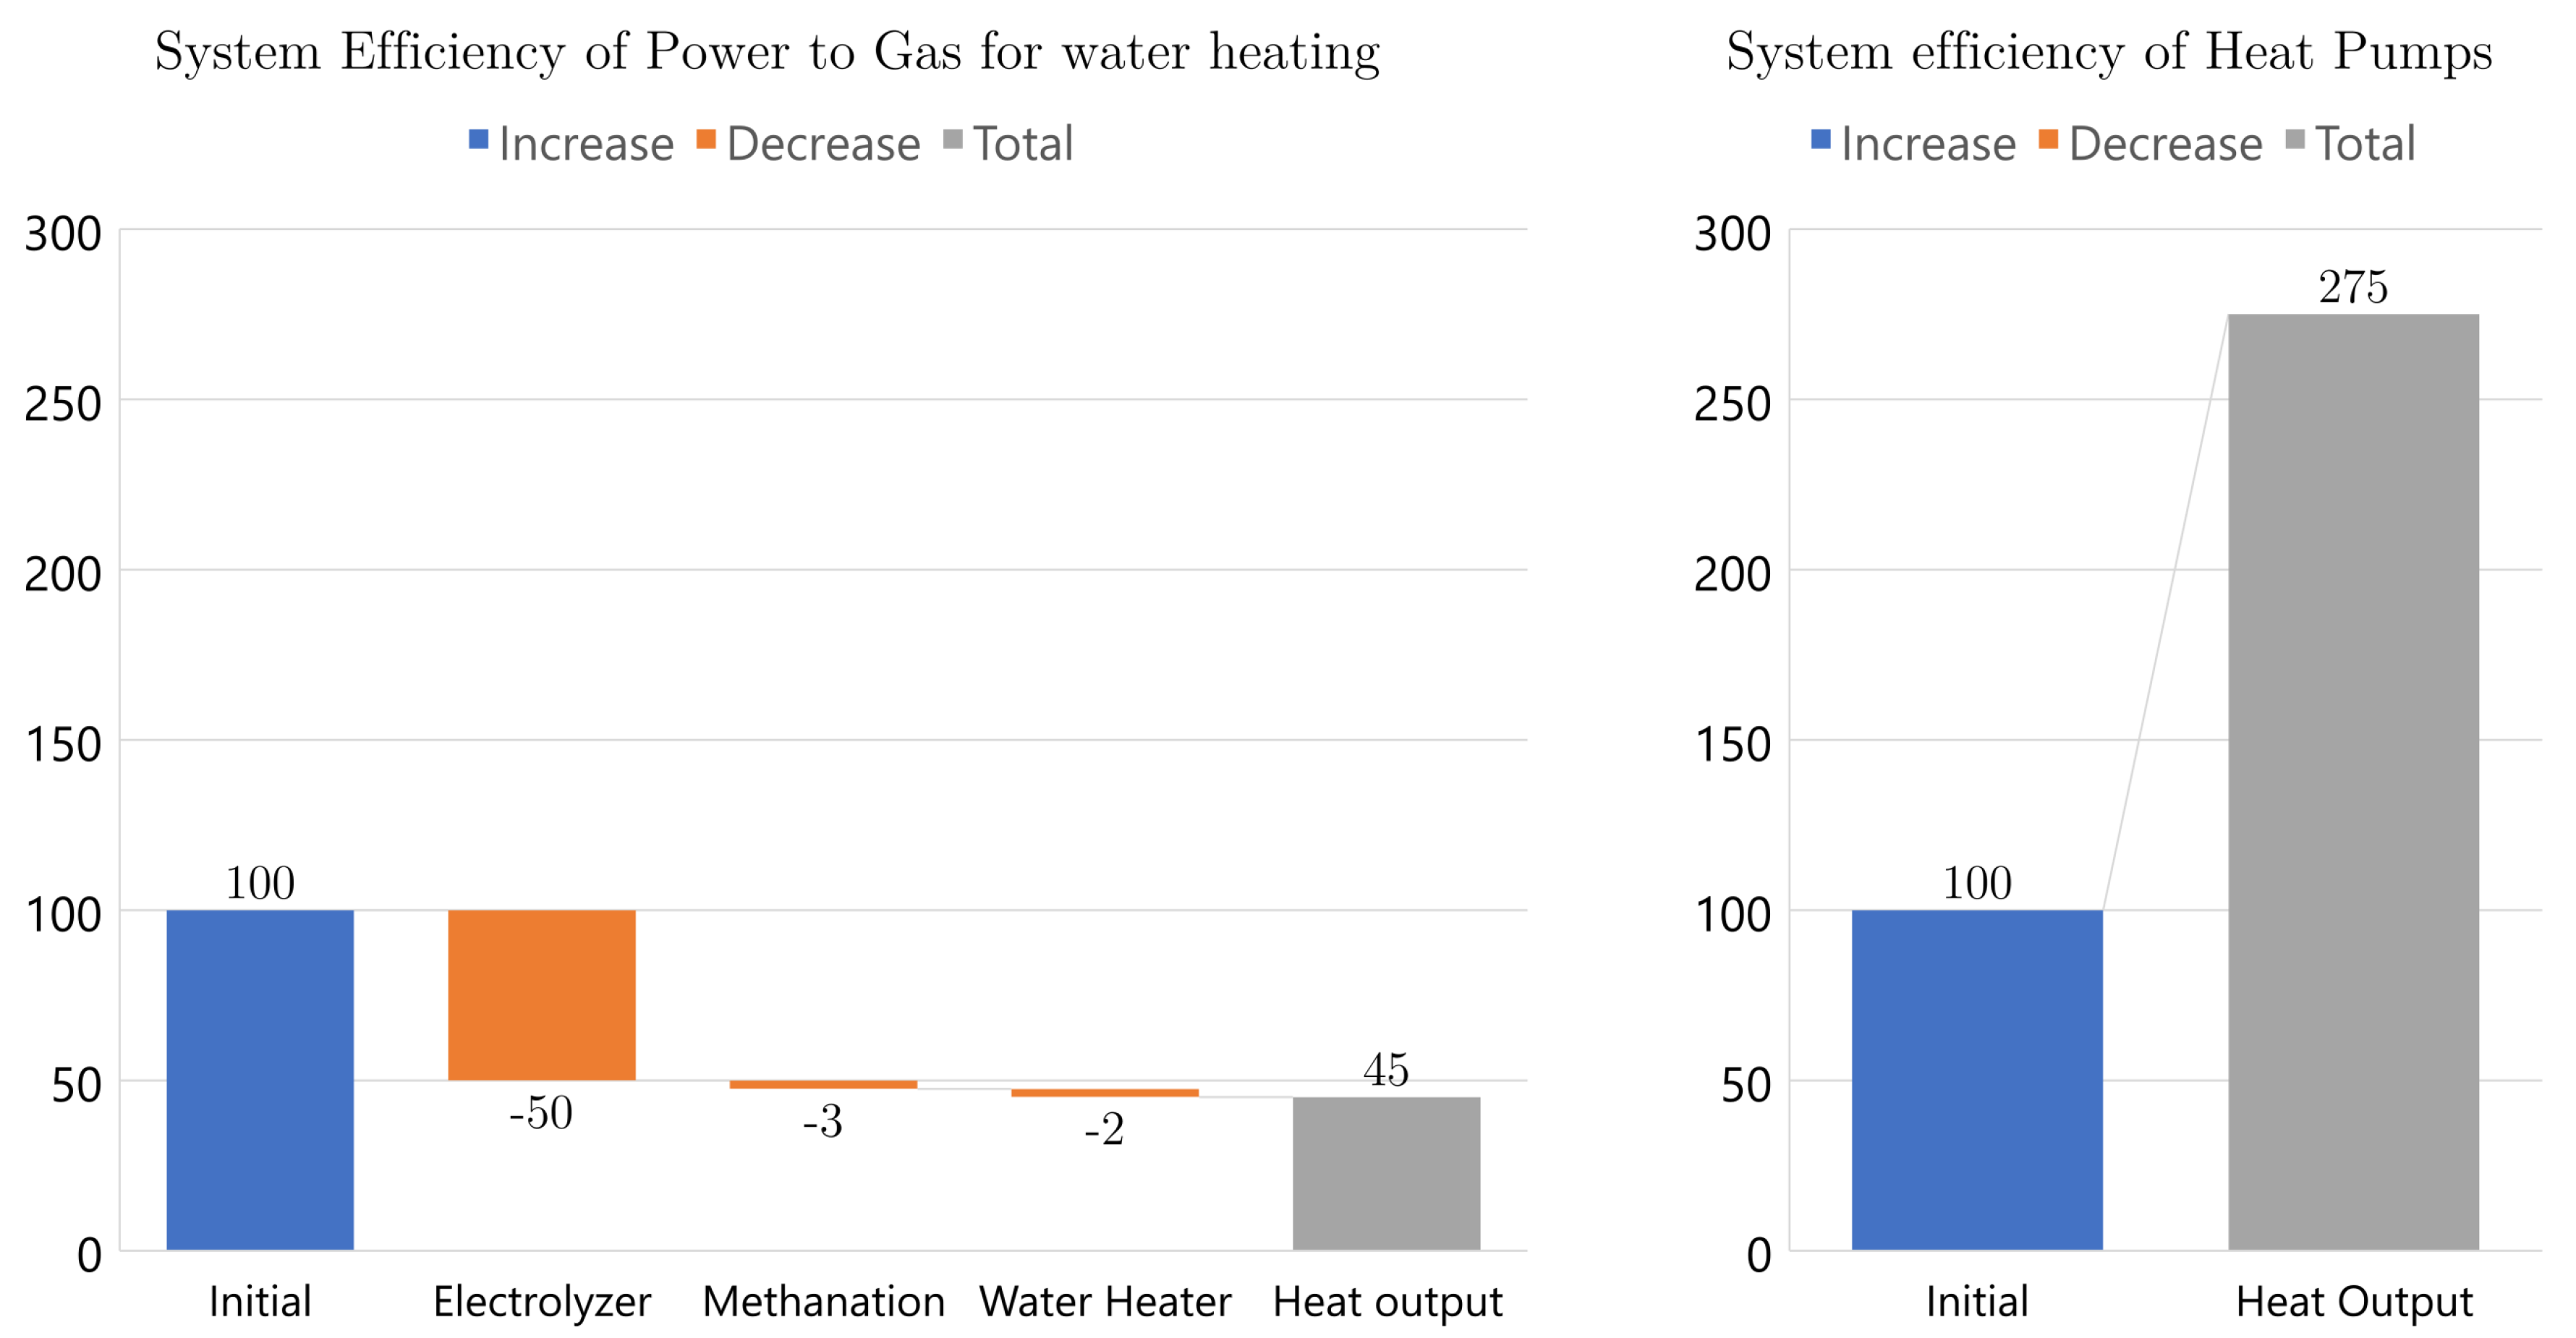
  • Is there enough? In theory, the potential to produce hydrogen or synthetic methane is limited only by the amount of renewable generation and electrolyzer capacity that we choose to install. So, the answer to this question is tightly coupled to the following question about the economics. We assume that this resource will be constrained to use only excess renewable generation capacity. Energy + Environmental Economics estimates that with a 50% Renewable Portfolio Standard and diverse resources, there would be 1300 hours of overgeneration in a year, generating 5400 GWh of excess energy in California [45]. As a point of comparison, in 2015 2.3 trillion cubic feet of natural gas were consumed in California (670 TWh), 0.6 (180 TWh) of which was delivered to residential and commercial customers [10]. The energy potential of overgeneration is less than 1% of total gas demand and less than 3% of residential and commercial gas demand. After we consider the efficiency losses of converting excess electricity into synthetic natural gas, these potentials are even smaller.
    As seen in Figure 4 below, for every 100 units of electricity in, a power to gas conversion pathway would create about 45 units of heat. However, those same 100 units could create 275 units of heat when used directly in a heat pump. Power to gas does have the advantage of storing energy—potentially very large amounts, over long seasonal timescales—so that generation and consumption do not have to happen at the same time. But a factor of six difference in system efficiency will be hard to overcome.
    Unfortunately, the system efficiency of synthetic methane production is very low, particularly when we compare it to other options. Converting electricity to hydrogen is 50–70% efficient, with methanation of that hydrogen (converting H2 to CH4) reducing efficiency by a few more percent. Some hydrogen could potentially be mixed directly into natural gas networks, though it is uncertain what the allowable fraction would be or how much leakage of small H2 molecules would occur [44]. The system efficiency of the path from electricity to gas to heat looks particularly low when we compare it with using electricity directly through a heat pump. It will be for policy makers to decide if the behavioral and political benefits of this strategy outweigh the system efficiency penalty and costs.
  • How much would it cost? As we see in Figure 4, when electricity is available for heating, it would be far more efficient to use it directly. The benefit of P2G is that it avoids replacing gas appliances and that it can utilize unused clean electricity generation and store that energy for future use. Unfortunately the cost of this conversion is very high. The main cost of producing synthetic methane or hydrogen comes from the electrolyzers which may range from 850–3200 $/kW (electric) with additional costs on the order of 150–400 $/kW if methanation is included [46,47,48]. Note that the electrolyzer cost is a function of the capacity (power) of the electrolyzer. Relying only on excess generation hours is not feasible because it would lead to low utilization of expensive electrolyzers. In the Energy + Environmental Economics study mentioned above there were only 1300 hours of overgeneration, so an electrolyzer that operated for all of those hours would have a capacity factor of only 15%. While the number of hours of overgeneration will likely grow as renewables make up a larger fraction of generation, if there are many hours of overproduction, other flexible demands such as electric vehicles, thermostatically controlled loads and other forms of energy storage would likely step in to use the free or very cheap electricity. A 70% efficient electrolyzer with a 15-year life operating 15% of the time would produce synthetic natural gas at a cost of $1.80–7/therm with no discounting. The $0.70–6.30/therm price premium over natural gas would equate to about $115–1000/ton CO2 without methanation. In reality the capacity factor would be even lower, since not all capacity would be used in all hours of overgeneration. A DOE study investigated the production price for hydrogen using either wind power and grid electricity and found a cost of production in the range of $3.74–5.86 per kg of hydrogen [49]. On an energy basis, a kilogram of H2 is about equal to 1.2 therms, so the price premium (and required carbon tax for cost effectiveness) is in the range we calculated.
  • What is the best end use for this resource? We might also consider how electrolyzers and synthetic methane would be used, if we made the decision to invest in electrolyzers. If the value of synthetic methane or hydrogen were high enough, they might operate even during hours that would not have been curtailed. It it also certainly possible that hydrogen or synthetic methane would not be used for decarbonizing space and water heating since other uses value it more. Hydrogen may have higher value uses than combustion for space or water heating. Instead, it could be used in more difficult to decarbonize sectors that are reliant on natural gas today. Producing synthetic methane also requires a pure CO2 “resource” in order to methanize hydrogen. This means that methanation has a potential opportunity cost of lost carbon capture and storage (CCS).
    The seasonal storage benefit of renewable electricity through hydrogen or synthetic natural gas might be real but we can potentially separate this benefit from the decision of whether to electrify residential space and water heating. If the economics were favorable for seasonal storage we could still save that energy as gas and then use it in a fuel cell or generator and use electricity in a heat pump and come out ahead in terms of total system efficiency. While electrification of space and water heating has the potential for energy storage on short time scales (hours), it does not have the same seasonal storage attributes of synthetic methane. Such seasonal storage may be cost effective at high levels of renewables penetration.
Decarbonized gas can play a role in future energy systems. Hydrogen and synthetic methane production allows for long term storage of intermittent resources and diversifies energy carriers. These are real benefits that should not be ignored. However, for the specific case of decarbonizing residential space and water heating, decarbonized gas has severe limitations. Biogas, hydrogen and synthetic methane cannot be produced at a large enough scale to serve anything but a small fraction of our current natural gas demands. While diversifying our decarbonization strategies might lower risk, diversifying with P2G with high/uncertain costs and uncertain biomass availability might be higher risk overall. Efforts by the natural gas industry to show the potential of decarbonizing natural gas should not distract us from focusing on more feasible pathways of decarbonization, such as electrification.

3.4. Electrification

Electrification of the residential space and water heating sector would mean transitioning existing natural gas furnaces, boilers and water heaters to electric resistance or heat pump systems. Resistance water heaters are much less efficient but much lower cost. It is possible that in some niche space heating applications with very few hours of operation these would be suitable. But in most cases heat pump systems would be more economical, particularly in areas with higher electricity costs.
  • Is there enough? Unlike the options above, there is no hard constraint on electrification since more renewable generation capacity could theoretically be installed. However, the cost of that additional renewable energy could be high if the marginal units operate at very low capacity factors. Some electrification could even be done without additional infrastructure in cooling-dominated climates that have a peak demand for electricity in the summer, though better utilization of existing generation would likely mean greater use of dispatchable fossil generation. Continuing to meet an RPS in this scenario would still require additional investment in renewable resources.
  • How much would it cost? The cost of electrification depends on the relative prices of gas and electric appliances and the relative costs of gas and electricity. Currently, in Pacific Gas and Electric territory, the relative costs of gas and electricity favor gas heating on an operational basis. The capital costs of efficient heat pumps are also higher than most gas furnaces and water heaters and there can be significant transitions costs to replace a gas heating system with an electric one. In the case of water heating, after accounting for the additional capital cost for heat pump water heaters and a transition cost of adding electric service, the approximate carbon price would be in the range of $100–150/ton CO2 in order to incentivize electrification of water heating, though this is highly dependent on assumptions [50]. This range assumes that an RPS is between 75% and 95% in 2050, with the balance of electricity coming from a 45% efficient natural gas plant.
  • What is the best end use of this resource? Using electricity for heating has long been considered inefficient and natural gas has the reputation of being the more efficient heating option. With the advent of efficient heat pumps, however, using electricity is a suitable use of the resource [13]. The potential for new renewable electricity generation is far greater than what we would actually need; the power from solar radiation striking the earth is at least four orders of magnitude larger than the average power that we use. If we choose the electrification path, we will not hit a hard supply limit but we may hit an economic one.

4. Discussion

4.1. Emissions Impacts of Alternatives

The emissions impacts of the different decarbonization options will vary and not all should be considered free of emissions. Biogas and aggressively expanded biomass production would have environmental and emissions impacts from land use change and leakage of methane. Synthetic methane produced from electricity other than excess renewables would have emissions related to the production, operation, maintenance and end of life of the generation capacity. Synthetic methane also may have emissions related to leakage. Accounting for these emissions would increase our cost per ton estimates above and prevent these options from being completely carbon free. The true emissions impact of biogas, hydrogen and synthetic methane are outside the scope of this paper. The emissions from energy efficiency and the solar fraction of solar water heating can be considered negligible.
We can evaluate in greater depth the emissions that would result from electrification. Encouraging electrification prematurely could have negative consequences if the electric grid is not yet clean enough. When the marginal generator during times of space/water heating is above a 32% efficient natural gas generator, we would be better off switching to a heat pump with an energy factor (EF) of 3 versus a 96% efficient natural gas furnace. While electrification delivers lower emissions with cleaner generation, the emissions attributable to the new electric load are not zero.
Understanding the emissions impact of electrification requires a better understanding of what emissions would reasonably be attributable to a new electric appliance. Depending on the time frame of study, one could reasonably come up with widely different answers. Over the very short term, if one were to add a new electric load that the utility had not forecasted, the most likely outcome would be that, if one were in California, a natural gas plant (or a collection of them) would consume slightly more fuel and have slightly higher emissions. These plants that increase their output are probably higher in the loading order, more expensive to operate and less efficient. The emissions over this time frame would be the short-run operational marginal emissions. Depending on location, time of day, season and existing load the short-run operational marginal emissions can vary widely. A host of recent papers estimated historic marginal emissions rates across the United States [51,52,53]. These papers are in general agreement that Midwestern marginal rates are among the highest in the country (roughly 900 kg CO2/MWh) and the West and California in particular are among the lowest (in the 300–400 kg CO2/MWh range).
Over a slightly longer time horizon, after these new electric loads have been observed for many days, the utility or system operator might now expect these loads to use electricity at certain times. If these loads are forecasted, then different generators may be dispatched to serve them. These would probably be cheaper to operate and possibly cleaner. The emissions impact over this time frame could be considered the long-run, operational marginal emissions.
As we think about a time frame at which generation capacity is planned and constructed, new electric loads from space and water heating could lead to a different decisions about what generation capacity to install. Over this time scale, the emissions impact of electrification is related to both the decisions that were made about what generators to construct and how all generators operate. Over this time scale, the “build” marginal emissions rate is a more meaningful measure of the emissions impact of new load. The short-run operational marginal emissions are not a good measure because some of those plants would be on the margin even if load was much higher. The metric that policymakers should consider is the change in emissions that would result from a long-term change in load. Hawkes et al. studied the marginal emissions of new loads in the UK and found that, under a carbon tax or carbon constraint policy, the marginal emissions fell to approximately zero over time [54].
While estimating the specific marginal emissions of a particular new load over the coming decades is outside of the scope of this study, in Figure 5 we do show the range of emissions (y-axis) that would result from various generator types operating on the margin (x-axis). We find that, heat pump water heaters would have lower emissions than efficient, tankless condensing gas water heaters and are approximately equal to gas heat pumps running on 10% zero-carbon synthetic methane using the WECC marginal emissions found by Graff Zivin et al. [52]. California has marginal emissions of 406 kg/MWh and average emissions of 267 kg/MWh in the 2010–2012 time period. Over time, the trend will be a shift to the left, if the generation mix shifts toward renewables. The emission rates for different gas plant types are based on a 30–45% efficient gas generator, with the renewable range being made up by a 45% generator providing the remaining generation. Gas generator efficiencies are based on average tested heat rates of gas turbines and combined cycle generators from 2015. Coal generator emissions are based on coal steam plant average efficiency in 2015 using EIA emissions coefficients [37,55]. In theory, more efficient plants are possible; both Siemens and GE offer combined cycle generators that are over 60% efficient [56,57], which would be equivalent to about 300 kg CO2/MWh in Figure 5.
The climate benefits that electrification provides are real and increasing as more renewables are added to the electricity mix. In states with a Renewable Portfolio Standard (RPS), we can assume that new loads would have to be served by at least the RPS percentage of renewables. Without knowing precisely the type of remaining generators, we can safely assume that electrifying loads will reduce emissions immediately as long as generation is not coming from coal. Since electricity is going to become cleaner over the coming decades because of the RPS, the emissions benefit will increase. An electric heat pump installed today will have lower emissions year over year. Choosing a more efficient gas water heater or furnace will have the same benefit year after year unless the gas supply is decarbonized, but choosing to electrify will create a larger and larger emissions reduction each year as the generation mix becomes cleaner. Such accelerating carbon reductions are what we need to meet aggressive long-term goals. Efficiency increases of gas water heaters and furnaces are also bounded by quickly approaching thermodynamic limits and the potential savings that could result from those appliance-level efficiency gains are nowhere close to the level of savings that we would need to meet aggressive emission reduction goals. While heat pumps also have efficiency limits, the potential savings are far greater. With enough clean electricity, practically all emissions from space and water heating could be eliminated. Being reliant solely on variable renewable resources will also require energy storage, though that is outside the scope of this work. Money spent on more efficient gas appliances may be better spent on electrification. Similarly, the environmental benefit of an additional PV system on the grid will decrease over time, as the electricity that it is displacing gets cleaner and cleaner. However, the benefit of electrification increases. You can see this graphically in Figure 5. As you move to the left, the difference between the blue and green lines stays constant while the difference between the blue and orange lines increases. Electrification delivers increasing emission reductions over time.

4.2. Challenges and Potential Unintended Consequences of Electrification

The electrification of heating loads holds great promise, though we must also recognize the challenges or unintended consequences of this transition. Today, air conditioning systems use refrigerants with very high global warming potential (GWP). One common refrigerant, R-410a, has a GWP of over 2000. A typical central air conditioning unit might have 5 kg of refrigerant. If we assume that a central heat pump space heater has a similar quantity of refrigerant and that all of this refrigerant escapes over the 15-year life of the unit, then the climate impact from refrigerant leakage alone would be 70% of the CO2 emissions from burning natural gas, even if the heat pump is using only clean electricity. This calculation assumes that 200 therms (21 GJ) of natural gas are used for space heating annually and produce emissions of 5 kg CO2/therm, resulting in 1000 kg CO2/year with natural gas heating. The emissions from leakage of 0.34 kg/year of R-410a, with a GWP of 2088, would result in the equivalent emissions of 710 kg CO2/year. This could be considered close to the upper limit for the impact that refrigerant leakage might have. Most home air conditioners/heat pumps would contain less than 5 kg of refrigerant. Additionally, heat pump water heaters contain far less refrigerant (<1/2 kg) and are factory sealed, lowering the chance of leakage. If the electricity used in a heat pump is not emission-free, then the total emissions from electrification using a heat pump could lead to higher emissions when leakage is accounted for. Natural gas leakage is also an important issue and is not accounted for in this calculation above. Transitions to low-GWP refrigerants and monitoring/maintenance/takeback programs will be important to avoid unintended consequences of electrification programs. Without paying attention to refrigerant leakage, most of the potential benefit of electrified heating could be lost. New heat pump technologies are becoming commercialized that use CO2 as the refrigerant, however these systems are still expensive.
Other concerns regarding heat pumps are that they perform worse at colder outdoor temperatures. New cold-climate space conditioning heat pumps are emerging that have COPs well over 2 even at below freezing temperatures [58]. Some models perform with COPs up to 2.9 even when the outside temperature is −15 °C. Heat pump water heaters also are noisier than other water heaters and are generally located inside the house so noise may be more of an issue than with split space conditioning systems. Very quiet split heat pumps water heaters are also on the market. There is also some transition cost for some houses if an upgrade to the electrical service is required. This upgrade should be coordinated with other activities, such as installing electric vehicle charging.
While space and water heating make up the bulk of current residential natural gas use in California, other uses such as clothes drying and cooking also need to be addressed. Gas dryers can be replaced by electric resistance dryers—and eventually even those would be lower emissions than gas dryers. Heat pump dryers come with about a $1000 premium over electric resistance dryers and without substantial cost reductions, these would not be cost effective. Transitioning to electric dryers may require additional electric service if it does not already exist. Emerging ultrasonic clothes dryers, while still in the lab, could potentially reduce drying energy use by 70% [59].
A potentially bigger point of resistance may be transitioning to electric cooking appliances like induction cooktops. People have strong attachments to gas cooktops and strongly prefer them to electric resistance because of the instant heat and finer control. While induction cooktops provide some of these same benefits and high efficiency, they have a small market share and require particular cookware to work. Costs of induction cooktops are dropping quickly, so there may be some promise. Tackling cooking will be important if consumers ever consider disconnecting from the gas utility entirely. If other larger loads like space and water heating are electrified, the cost of providing gas for remaining end uses will likely increase in order to cover the fixed costs of gas infrastructure. We would expect that if the cost of providing gas for only cooking were to rise high enough then customers would defect either to bottled gas for cooking or transition to new induction cooktops.

5. Conclusions

In order to decarbonize the residential space and water heating sector in temperate climates like California, electrification appears to be the most promising path forward. Table 1 shows how the different decarbonization options compare along different dimensions.
Electrification provides both the cheapest decarbonization option and can potentially decarbonize all emissions from space heating if electricity is clean enough. Both synthetic methane from excess renewables or biogas suffer from low potentials and high costs. Solar thermal does provide immediate decarbonization for a large fraction of the emissions but it is less cost effective than electrification, even when the cost of renewables are accounted for. This is largely due to the decrease in cost of PV systems and persistent high cost of solar water heating systems. Biogas is infeasible on a nationwide basis, simply because the potential biomass resource is not large enough. The resource that does exist would be put to better use to decarbonize other end uses. Finally, synthetic natural gas comes with a high cost and large system efficiency penalty relative to electrification.
This paper aimed to outline why electrification is the most promising path to decarbonize and to provide motivation for future work to better understand the implications of heating electrification. Electrification also comes with several challenges. While more feasible and less expensive than the other options, it is more expensive than business as usual and does require actions from millions of building owners. May the best fuel win.

Author Contributions

Conceptualization, I.S. and D.C.; methodology, I.S.; formal analysis, I.S.; writing—original draft preparation, I.S.; writing—review and editing, I.S. and D.C.; supervision, D.C.; funding acquisition, I.S. and D.C.

Funding

This research has been supported by a grant from the U.S. Environmental Protection Agency’s Science to Achieve Results (STAR) program.

Conflicts of Interest

The authors declare no conflict of interest. The funders had no role in the design of the study; in the collection, analyses, or interpretation of data; in the writing of the manuscript, or in the decision to publish the results.

References

  1. Brown, E.G. Executive Order S-03-05. Available online: http://static1.squarespace.com/static/549885d4e4b0ba0bff5dc695/t/54d7f1e0e4b0f0798cee3010/1423438304744/California+Executive+Order+S-3-05+(June+2005).pdf (accessed on 1 June 2005).
  2. Wiser, R.H.; Bolinger, M. 2017 Wind Technologies Market Report; Lawrence Berkeley National Laboratory: Berkeley, CA, USA, 2018.
  3. Barbose, G.L.; Darghouth, N.R. Tracking the Sun IX: The Installed Price of Residential and Non-Residential Photovoltaic Systems in the United States; LBNL-1006036; Lawrence Berkeley National Laboratory: Berkeley, CA, USA, 2016.
  4. Wei, M.; Nelson, J.H.; Greenblatt, J.B.; Mileva, A.; Johnston, J.; Ting, M.; Yang, C.; Jones, C.; McMahon, J.E.; Kammen, D.M. Deep carbon reductions in California require electrification and integration across economic sectors. Environ. Res. Lett. 2013, 8, 014038. [Google Scholar] [CrossRef]
  5. Williams, J.H.; DeBenedictis, A.; Ghanadan, R.; Mahone, A.; Moore, J.; Morrow, W.R.; Price, S.; Torn, M.S. The Technology Path to Deep Greenhouse Gas Emissions Cuts by 2050: The Pivotal Role of Electricity. Science 2012, 335, 53–59. [Google Scholar] [CrossRef] [PubMed] [Green Version]
  6. Williams, J.; Haley, B.; Kahrl, F.; Jones, A.; Torn, M.; McJeon, H. Pathways to Deep Decarbonization in the United States; The US Report of the Deep Decarbonization Pathways Project of the Sustainable Development Solutions Network; Institute for Sustainable Development and International Relations: New York, NY, USA; Paris, France, 2014. [Google Scholar]
  7. Long, J.; John, M.; Greenblatt, J.; Wei, M.; Yang, C.; Richter, B.; Hannegan, B.; Youngs, H. California’s Energy Future—The View to 2050; California Council on Science and Technology: Sacramento, CA, USA, 2011. [Google Scholar]
  8. Jacobson, M.Z.; Delucchi, M.A.; Ingraffea, A.R.; Howarth, R.W.; Bazouin, G.; Bridgeland, B.; Burkart, K.; Chang, M.; Chowdhury, N.; Cook, R.; et al. A roadmap for repowering California for all purposes with wind, water, and sunlight. Energy 2014, 73, 875–889. [Google Scholar] [CrossRef]
  9. European Climate Foundation. Roadmap 2050: A Practical Guide to a Prosperous, Low-Carbon Europe; Technical Report; European Climate Foundation: Paris, France, 2010. [Google Scholar]
  10. EIA. Natural Gas Consumption by End Use; U.S. Energy Information Administration: Washington, DC, USA, 2017.
  11. Rosenfeld, A.H. The art of energy efficiency: Protecting the environment with better technology. Annu. Rev. Energy Environ. 1999, 24, 33–82. [Google Scholar] [CrossRef]
  12. Hochschild, D.; Ferron, M. California’s Next Frontier: Clean Electricity for Everything. San Francisco Chronicle, 20 May 2016. [Google Scholar]
  13. Meier, A. Editorial: Revisiting Electrification. Home Energy Magazine, 1 May 2015. [Google Scholar]
  14. Southern California Gas Company. SoCalGas and University of California Irvine Demonstrate Power-to-Gas Technology Can Dramatically Increase the Use of Renewable Energy; Southern California Gas Company: Los Angeles, CA, USA, 2017. [Google Scholar]
  15. Energy+Environmental Economics. Decarbonizing Pipeline Gas to Help Meet California’s 2050 Greenhouse Gas Reduction Goal; Technical Report; Energy+Environmental Economics: San Francisco, CA, USA, 2015. [Google Scholar]
  16. American Gas Association. Natural Gas: Moving our Nation Forward; Technical Report; American Gas Association: Washington, DC, USA, 2017. [Google Scholar]
  17. EPA. Inventory of U.S. Greenhouse Gas Emissions and Sinks: 1990–2014; U.S. Environmental Protection Agency: Washington, DC, USA, 2016.
  18. DOE. 2011 Building Energy Data Book; Technical Report; U.S. Department of Energy: Washington, DC, USA, 2012.
  19. California Air Resources Board. California Greenhouse Gas Inventory for 2000–2013; Technical Report; California Air Resources Board: Sacramento, CA, USA, 2015.
  20. KEMA. 2009 California Residential Appliance Saturation Study; Technical Report, CEC-200-2010-004-ES; KEMA: Oakland, CA, USA, 2010. [Google Scholar]
  21. Obama for America. Barack Obama and Joe Biden: New Energy for America; Obama for America: Washington, DC, USA, 2008. [Google Scholar]
  22. Nadel, S.; Elliott, N.; Langer, T. Energy Efficiency in the United States: 35 Years and Counting; Technical Report, Report E1502; American Council for an Energy-Efficient Economy (ACEEE): Washington, DC, USA, 2015. [Google Scholar]
  23. Loftus, P.J.; Cohen, A.M.; Long, J.C.S.; Jenkins, J.D. A critical review of global decarbonization scenarios: what do they tell us about feasibility? A critical review of global decarbonization scenarios. Wiley Interdiscip. Rev. Clim. Chang. 2015, 6, 93–112. [Google Scholar] [CrossRef]
  24. Delucchi, M.A.; Jacobson, M.Z. Providing all global energy with wind, water, and solar power, Part II: Reliability, system and transmission costs, and policies. Energy Policy 2011, 39, 1170–1190. [Google Scholar] [CrossRef]
  25. Itron. California Center for Sustainable Energy Solar Water Heating Pilot Program: Interim Evaluation Report; Itron: Vancouver, WA, USA, 2009. [Google Scholar]
  26. Lovins, A. Energy strategy: The road not taken. Foreign Aff. 1976, 55, 65. [Google Scholar] [CrossRef]
  27. National Renewable Energy Laboratory. PVWatts Calculator; National Renewable Energy Laboratory: Golden, CO, USA, 2017.
  28. Cassard, H.; Denholm, P.; Ong, S. Break-Even Cost for Residential Solar Water Heating in the United States: Key Drivers and Sensitivities; National Renewable Energy Lab: Golden, CO, USA, 2011; Volume 303, pp. 275–3000.
  29. Jaffe, A.B.; Stavins, R.N. The energy-efficiency gap: What does it mean? Energy Policy 1994, 22, 804–810. [Google Scholar] [CrossRef]
  30. Allcott, H.; Greenstone, M. Is There an Energy Efficiency Gap? Technical Report; National Bureau of Economic Research: Cambridge, MA, USA, 2012. [Google Scholar]
  31. Gillingham, K.; Newell, R.G.; Palmer, K. Energy Efficiency Economics and Policy. Annu. Rev. Resour. Econ. 2009, 1, 597–620. [Google Scholar] [CrossRef]
  32. Fowlie, M.; Greenstone, M.; Wolfram, C. Do Energy Efficiency Investments Deliver? Evidence from the Weatherization Assistance Program; Technical Report; National Bureau of Economic Research: Cambridge, MA, USA, 2015. [Google Scholar]
  33. Perlack, R.D.; Eaton, L.M.; Turhollow, A.F., Jr.; Langholtz, M.H.; Brandt, C.C.; Downing, M.E.; Graham, R.L.; Wright, L.L.; Kavkewitz, J.M.; Shamey, A.M.; et al. US Billion-ton Update: Biomass Supply for a Bioenergy and Bioproducts Industry; Office of Energy Efficiency & Renewable Energy: Washington, DC, USA, 2011.
  34. Yassa, S. Think Wood Pellets Are Green? Think Again; Issue Brief IB:15-05-A; Natural Resources Defense Council: New York, NY, USA, 2015. [Google Scholar]
  35. EIA. Monthly Energy Review; U.S. Energy Information Administration: Washington, DC, USA, 2017.
  36. Huang, W.D.; Zhang, Y.H.P. Energy Efficiency Analysis: Biomass-to-Wheel Efficiency Related with Biofuels Production, Fuel Distribution, and Powertrain Systems. PLoS ONE 2011, 6, e22113. [Google Scholar] [CrossRef] [PubMed]
  37. EIA. Electric Power Annual; U.S. Energy Information Administration: Washington, DC, USA, 2015.
  38. National Grid. Renewable Gas: Vision for a Sustainable Gas Network; Technical Report; National Grid: London, UK, 2010. [Google Scholar]
  39. Gas Technology Institute. The Pontential for Renewable Gas: Biogas Derived from Biommas Feedstocks and Upgraded to Pipeline Quality; Technical Report; American Gas Foundation: Washington, DC, USA, 2011. [Google Scholar]
  40. EIA. Henry Hub Natural Gas Spot Price (Dollars per Million Btu); U.S. Energy Information Administration: Washington, DC, USA, 2017.
  41. Southern California Gas Company. Biogas and Biomethane; Southern California Gas Company: Los Angeles, CA, USA, 2017. [Google Scholar]
  42. Pacific Gas and Electric Company. Carbon Footprint Calculator Assumptions; Pacific Gas and Electric Company: San Francisco, CA, USA, 2006. [Google Scholar]
  43. Brandt, A.R.; Heath, G.A.; Kort, E.A.; O’Sullivan, F.; Petron, G.; Jordaan, S.M.; Tans, P.; Wilcox, J.; Gopstein, A.M.; Arent, D.; et al. Methane Leaks from North American Natural Gas Systems. Science 2014, 343, 733–735. [Google Scholar] [CrossRef] [PubMed] [Green Version]
  44. Melaina, M.W.; Antonia, O.; Penev, M. Blending hydrogen into natural gas pipeline networks: A review of key issues. Contract 2013, 303, 275–3000. [Google Scholar]
  45. Energy+Environmental Economics. Investigating a Higher Renewables Portfolio Standard in California; Technical Report; Energy+Environmental Economics: San Francisco, CA, USA, 2014. [Google Scholar]
  46. Götz, M.; Lefebvre, J.; Mörs, F.; McDaniel Koch, A.; Graf, F.; Bajohr, S.; Reimert, R.; Kolb, T. Renewable Power-to-Gas: A technological and economic review. Renew. Energy 2016, 85, 1371–1390. [Google Scholar] [CrossRef] [Green Version]
  47. Baumann, C.; Schuster, R.; Moser, A. Economic potential of power-to-gas energy storages. In Proceedings of the 2013 10th International Conference on the European Energy Market (EEM), Stockholm, Sweden, 27–31 May 2013; pp. 1–6. [Google Scholar]
  48. Gahleitner, G. Hydrogen from renewable electricity: An international review of power-to-gas pilot plants for stationary applications. Int. J. Hydr. Energy 2013, 38, 2039–2061. [Google Scholar] [CrossRef]
  49. Saur, G.; Ainscough, C. US Geographic Analysis of the Cost of Hydrogen from Electrolysis. Contract 2011, 303, 275–3000. [Google Scholar]
  50. Sheikh, I.A. Decarbonization of residential space and water heating in California. Ph.D. Thesis, University of California, Berkeley, CA, USA, 2017. [Google Scholar]
  51. Siler-Evans, K.; Azevedo, I.L.; Morgan, M.G. Marginal Emissions Factors for the U.S. Electricity System. Environ. Sci. Technol. 2012, 46, 4742–4748. [Google Scholar] [CrossRef] [PubMed]
  52. Graff Zivin, J.; Kotchen, M.J.; Mansur, E.T. Spatial and Temporal Heterogeneity of Marginal Emissions: Implications for Electric Cars and Other Electricity-Shifting Policies. J. Econ. Behav. Organ. 2014, 107, 248–268. [Google Scholar] [CrossRef]
  53. Callaway, D.S.; Fowlie, M.; McCormick, G. Location, location, location: The variable value of renewable energy and demand-side efficiency resources. J. Assoc. Environ. Resour. Econ. 2018, 5, 39–75. [Google Scholar] [CrossRef]
  54. Hawkes, A. Long-run marginal CO2 emissions factors in national electricity systems. Appl. Energy 2014, 125, 197–205. [Google Scholar] [CrossRef]
  55. EIA. Carbon Dioxide Emissions Coefficients; U.S. Energy Information Administration: Washington, DC, USA, 2016.
  56. GE Power Generation. World’s Most Efficient Combined-Cycle Power Plant; GE Power Generation: New York, NY, USA, 2016. [Google Scholar]
  57. Siemens. Gas Turbine SGT6-8000H—Siemens; Siemens: Erlangen, Germany, 2016. [Google Scholar]
  58. Lis, D. Cold Climate Air Source Heat Pump Specification; Northeast Energy Efficiency Partnerships: Lexington, MA, USA, 2019. [Google Scholar]
  59. Condliffe, J. This Dryer Blasts Water Out of Fabric with Sound Waves; MIT Technology Review: Cambridge, UK, 2017. [Google Scholar]
Figure 1. Historical natural gas consumption in the residential and commercial sectors in California. Commercial gas use includes natural gas used in vehicles through 1996, so the commercial trendline is based on post-1996 data [10].
Atmosphere 10 00435 g001
Figure 2. Breakdown of residential natural gas use in California in 2009 [20].
Atmosphere 10 00435 g002
Figure 3. Primary energy consumption in the US 1973–2016 and the potential for biomass.
Atmosphere 10 00435 g003
Figure 4. System efficiency comparison of electricity to heat via synthetic methane and direct use through a heat pump.
Atmosphere 10 00435 g004
Figure 5. Emissions of various heating technologies as electricity emissions change.
Atmosphere 10 00435 g005
Table 1. Summary of decarbonization options.
OptionPotential Reduction$/Ton CO2
Solar thermal70%$200
Biogas20%$300
Synthetic methane2%$500–1000+
Electrification100%$100–150

