Article

Levels and Sources of Atmospheric Particle-Bound Mercury in Atmospheric Particulate Matter (PM10) at Several Sites of an Atlantic Coastal European Region

by
Jorge Moreda-Piñeiro
1,2,3,*,
Adrián Rodríguez-Cabo
1,
María Fernández-Amado
1,2,3,
María Piñeiro-Iglesias
1,2,3,
Soledad Muniategui-Lorenzo
1,2,3 and
Purificación López-Mahía
1,2,3
1
Grupo Química Analítica Aplicada (QANAP), Department of Chemistry, Faculty of Sciences, University of A Coruña, Campus de A Coruña, s/n. 15071–A Coruña, Spain
2
University Institute of Research in Environmental Studies (IUMA), University of A Coruña, Pazo de Lóngora, 15179, Liáns, Oleiros–A Coruña, Spain
3
Centro de Investigaciones Científicas Avanzadas (CICA), University of A Coruña, Campus de Elviña, s/n. 15008–A Coruña, Spain
*
Author to whom correspondence should be addressed.
Atmosphere 2020, 11(1), 33; https://doi.org/10.3390/atmos11010033
Submission received: 25 November 2019 / Revised: 20 December 2019 / Accepted: 23 December 2019 / Published: 27 December 2019
(This article belongs to the Special Issue Urban Atmospheric Aerosols: Sources, Analysis and Effects)

Abstract

:
Atmospheric particle-bound mercury (PHg) quantification, at a pg m−3 level, has been assessed in particulate matter samples (PM10) at several sites (industrial, urban and sub-urban sites) of Atlantic coastal European region during 13 months by using a direct thermo-desorption method. Analytical method validation was assessed using 1648a and ERM CZ120 reference materials. The limits of detection and quantification were 0.25 pg m−3 and 0.43 pg m−3, respectively. Repeatability of the method was generally below 12.6%. PHg concentrations varied between 1.5–30.8, 1.5–75.3 and 2.27–33.7 pg m−3 at urban, sub-urban and industrial sites, respectively. PHg concentration varied from 7.2 pg m−3 (urban site) to 16.3 pg m−3 (suburban site) during winter season, while PHg concentrations varied from 9.9 pg m−3 (urban site) to 19.3 pg m−3 (suburban site) during the summer. Other trace elements, major ions, black carbon (BC) and UV-absorbing particulate matter (UV PM) was also assessed at several sites. Average concentrations for trace metals (Al, As, Bi, Cd, Cr, Cu, Fe, Mn, Ni, Pb, Sb, Si, Sr, V and Zn) ranged from 0.08 ng m−3 (Bi) at suburban site to 1.11 µg m−3 (Fe) at industrial site. Average concentrations for major ions (including Na+, K+, Ca2+, NH4+, Mg2+, Cl, NO3 and SO42−) ranged from 200 ng m−3 (K+) to 5332 ng m−3 (SO42−) at urban site, 166 ng m−3 (Mg2+) to 4425 ng m−3 (SO42−) at suburban site and 592 ng m−3 (K+) to 5853 ng m−3 (Cl) at industrial site. Results of univariate analysis and principal component analysis (PCA) suggested crustal, marine and anthropogenic sources of PHg in PM10 at several sites studied. Toxicity prediction of PHg, by using hazard quotient, suggested no non-carcinogenic risk for adults.

1. Introduction

Inhalation of atmospheric particulate matter (APM) represents a significant exposure pathway to humans. Several epidemiological studies have shown that chronic environmental exposure to APM has been associated with specific negative health outcomes (decreased pulmonary and renal function; lung cancer; damage to DNA; and cardiovascular, reproductive and endocrine alterations) [1]. The World Health Organization estimates that around six million people in the world die annually due to the effects of atmospheric pollution (indoor and outdoor) [2].
Mercury is a metal without any physiological demand in humans, with high toxicity (it affects the human central nervous system), long-distance transport and strong bioaccumulation tendency in the food chain, which poses a global concern and a great threat to human health, wildlife and environment [3]. Hg and its species are therefore included in priority lists of toxic compounds by several international agreements dealing with environmental protection and international programs to reduce mercury emissions [4,5,6,7]. Mercury is emitted into the atmosphere, as gaseous elemental mercury Hg0 (GEM) and particle-bound mercury (PHg), from both natural (volcanic eruptions, sandstorms, crustal dust and rock weathering, evaporation from water surfaces, geothermal vents and forest fires) and anthropogenic (coal combustion, waste incineration and cement, chlor-alkali, nonferrous metal production) sources [8,9]. GEM is the most predominant form of total gaseous mercury, over 95%, into the atmosphere [10]. GEM is transformed into the atmosphere, via redox chemistry and homogeneous reactions, to gaseous oxidized mercury (GOM), which can be converted to PHg upon adsorption/absorption on aerosol surfaces [11,12,13]. PHg, which accounts for less than 10% of the total atmospheric Hg [14] can then undergo both dry and wet deposition [13].
In the last decades, several studies have focused on the determination of PHg levels at different sites of the Europe [15,16,17,18,19,20,21], but data on levels of PHg in PM10 at Atlantic coastal European regions studies are scarce [22,23,24,25,26]. Measurements of PHg in APM generally fell in the range of few pg m−3 to ng m−3 at rural and urban areas; thus, high and selective techniques, such as inductively coupled plasma mass spectrometry [27], cold vapour atomic absorption/fluorescence spectrometry [28,29], and differential pulse anodic stripping voltammetry [30], are required. These methodologies cannot be considered as environmentally friendly processes due to the use of toxic reagents/acids at high concentrations during the sample pre-treatment. Recently, a more effective, high sensitivity, fast, environmentally friendly and simple direct atomic absorption spectrometry methods followed by thermal decomposition of sample in an oxygen-rich atmosphere and concentration of mercury vapour on an amalgamator have been proposed [31,32]. This method is more suitable for PHg determination due to reduction of Hg losses and the possibility of sample contamination.
In this study we quantified mercury concentrations in PM10 (mean APM which passes through a size-selective inlet with a 50% efficiency cut-off at 10 μm aerodynamic diameter) at pg m−3 levels by direct solid sampling atomic absorption spectrometry. PHg levels were compared with other studies carried out in Europe and in Atlantic coastal European region. PHg seasonal variability and their relationships with APM sources at several sites (industrial, urban and sub-urban sites) of the Atlantic coastal European region during 13 months were also examined. Finally, due to the high toxicity of mercury and scarce information about mercury human health-risk assessment via inhalation several hazard indexes such as average daily intake (ADI), and hazard quotient (HQ) were assessed.

2. Materials and Methods

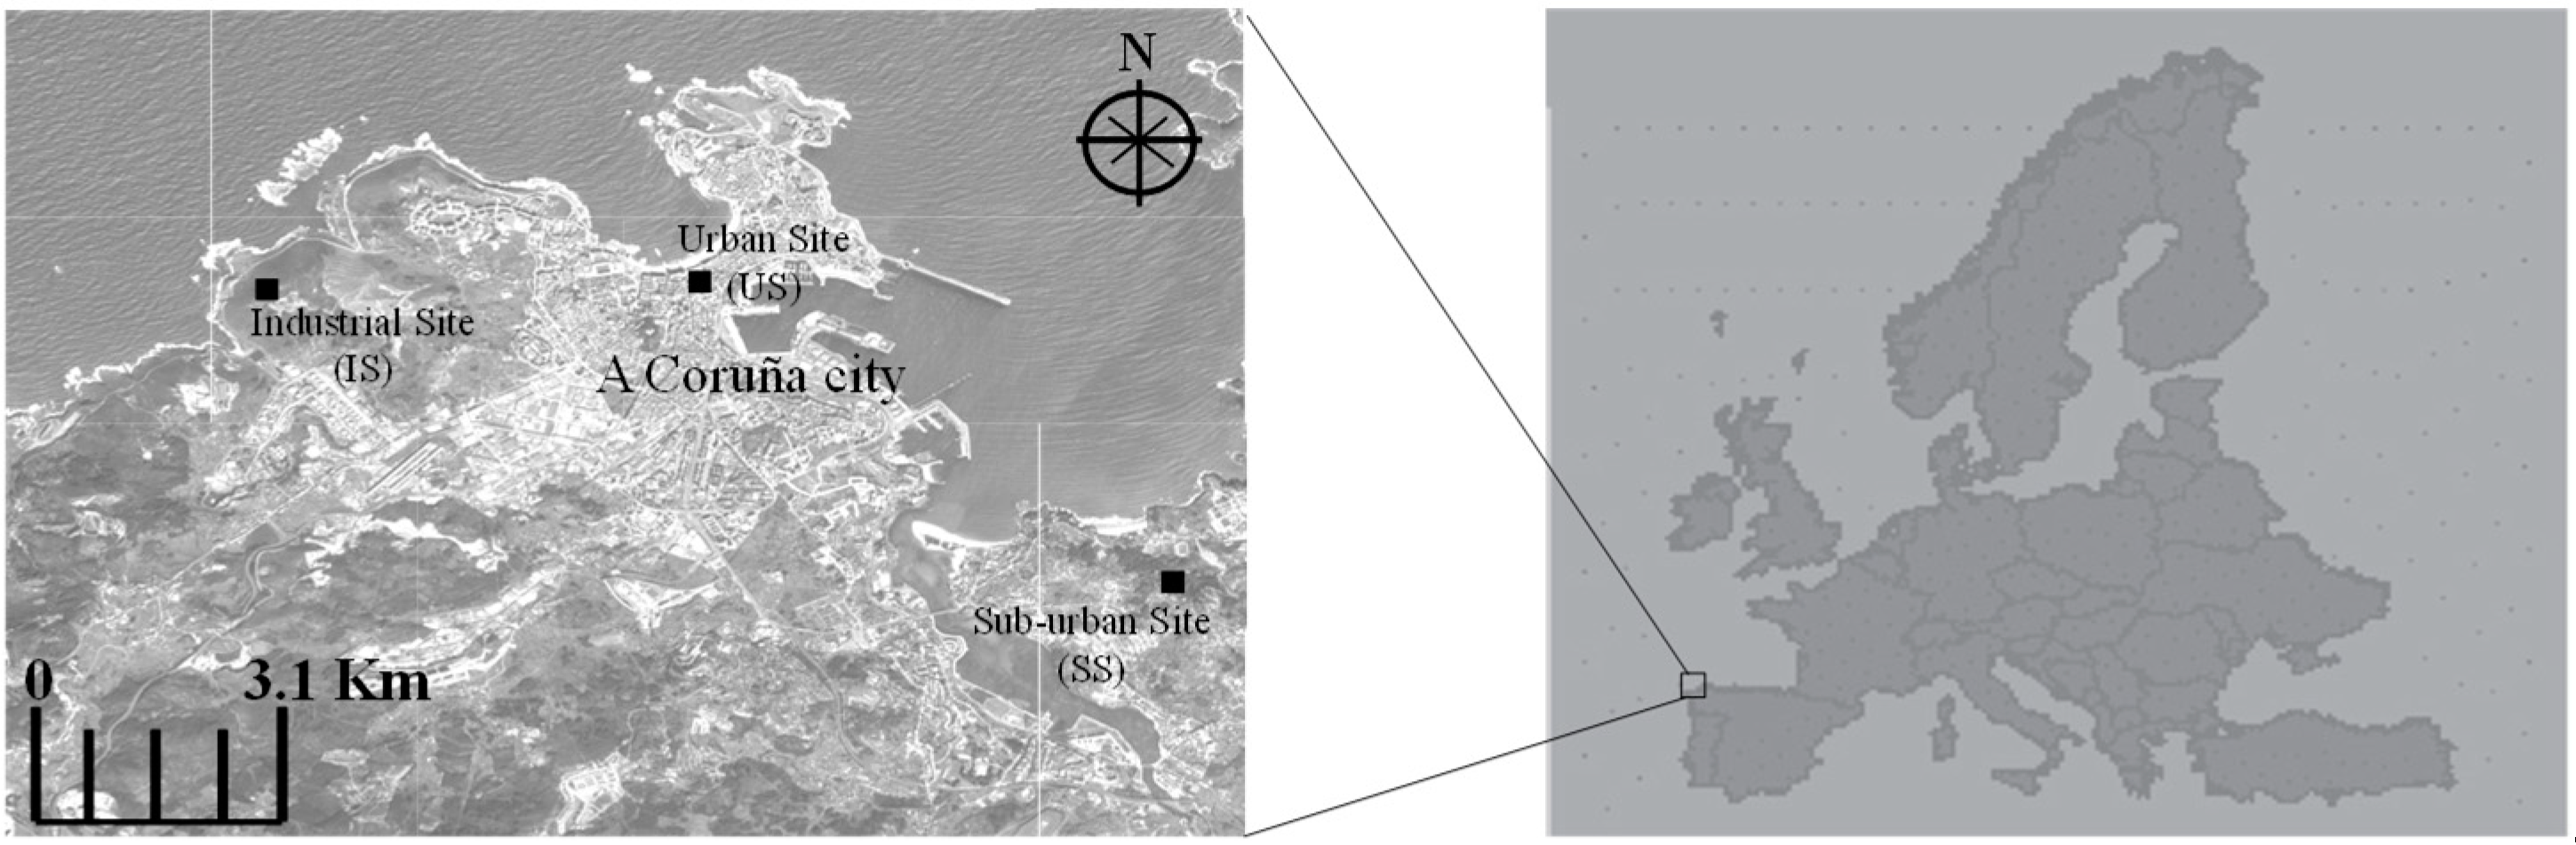
2.1. Details and Description of the Study Areas

A Coruña is an Atlantic coastal city in the northwest of Spain with a quarter of a million inhabitants (Figure 1). Due to its proximity to the sea, the sea salt content of particulate matter is also important. Climate of zone is humid oceanic, with abundant rainfall and prevailing winds from the north in summer and south in winter [33]. The main anthropogenic sources in this area are the emissions from traffic and domestic activities, industrial emissions and biomass burning [33]. Samples were simultaneously collected from May 2009 to May 2010, at urban, sub-urban and industrial sites. Urban site (A Coruña, US, Spain), located inside the downtown (coordinates: 43°22′04″ N 08°25′08″ W) at 5 m above the sea level. Sub-urban site (Liáns, SS, Spain), a residential area near A Coruña city (coordinates: 43°20′12″ N 08°21′09″ W) at 120 m above the sea level (Moreda-Piñeiro et al., 2014). Industrial site (Sabón, IS), an industrial area near to A Coruña (coordinates: 43°19′36″ N 08°30′0.2″ W) at 62 m above the sea level.

2.2. Atmospheric Particulate Matter Sample Collection

PM samples were collected using high-volume samplers (Graseby-Andersen, Gibsonville, NC, USA) with a PM10 head. The samples were taken in 24 h intervals (from 11:00 a.m. to 11:00 a.m. next day) during the whole measurement period. Sampler meets the requirements of UNE EN 12,341 European Norm (European standard EN12341, 2015) [34]. PM10 collection was conducted on QF20 quartz fiber filters (Schleischer&Schuell, Dassel, Germany). Before sampling, the filters were pre-heated at 450 °C for 1 h to remove possible mercury and other trace metal contamination. Before and after sampling, filters were stabilized at 20 ± 1 °C and relative humidity of 50 ± 5% for 48 h, for mass determination by means of a microbalance (Sartorius Genius, Goettingen, Germany) with an accuracy of 0.01 mg [34]. Afterwards sampling, PM10 samples were wrapped in aluminum foil, were sealed in clean polyethylene zipper bags and then stored in a freezer (−18 °C) until further analysis to avoid the losses of mercury from the filter. A total of 123 samples were collected covering thirteen months (44, 38 and 41 samples collected at US, SS and IS sites, respectively). In general, 1–2 samples per week were collected covering sampling period. Finally, field blanks were analysed following the same procedure used for the samples.

2.3. Cleaning Procedures

All plastic ware and glassware were washed with ultrapure water of 18 MΩ cm resistance (Milli-Q water purification system, Millipore, Bedford, MA, USA). Then, plastic ware and glassware were soaked for 48 h with 10% (v/v) nitric acid (ultraclean nitric acid 69–70%, JT Baker, Phillipsburg, PA, USA), and rinsed several times with ultrapure water before use. Sampling boats were pre-heated at 600 °C for 15 min to remove possible mercury contamination. After collection, sample manipulation and analysis were carried out into a class-100 clean room.

2.4. Mercury Quantification by DMA-80 Direct Mercury Analyser

Mercury measurements were performed on the Direct Mercury Analyser DMA-80 spectrometer (Milestone Srl, Sorisole, Italy) by the AAS technique. DMA-80 is a single-purpose atomic absorption spectrometer for determination of mercury traces in various solids and liquids without sample pre-treatment/pre-concentration. Three circular pieces (3 × 9.42 cm2), cut from each PM10 filter, were placed into a sampling boat and transferred to DMA-80. The methodology is based on a thermal decomposition of the sample in an oxygen-rich atmosphere (99.5%) for 60 s at 750 °C; transportation of released gasses (via an oxygen carrier gas) through specific catalytic compounds (for interfering impurities removal) to an Au-amalgamator; and collection of the Hg vapor on an amalgamator. After a pre-defined time the amalgamator was heated up to 800 °C. The released Hg was transported to to the detection system, which contains the Hg-specific lamp (253.7 nm) for mercury quantification. Before the next analysis, the system was cleaned for 45 s to avoid any memory effects.
For quantification, a mercury stock standard solution 1000 mg L−1 (Merck, Poole, Dorset, UK) as Hg2+ in dilute nitric acid (Baker) was used to prepare aqueous calibration solutions in the working range of 0–10 ng. The polynomial of degree two curve was: S i g n a l H g = 0.006   [ H g ] 2 + 0.1641   [ H g ] + 0.0042   ( R 2 = 0.9998 ) .
Analytical recovery studies were performed to procedure validation. Three circular pieces from a PM10 filter (9.42 cm2) were spiked with different amounts of mercury at four levels: 0.25 and 0.5 ng (low levels), 1.0 ng (intermediate level) and 2.0 ng (high level). Each concentration level was performed five times, and also, the un-spiked filter sample was also subjected to the mercury quantification (five times). Analytical recoveries within the 87–110% range were obtained, and good accuracy has been proved. Also, accuracy of the method was assessed by analysing SRM 1648a urban particulate matter (National Institute of Standards and Technology, Gaithersburg, MD, USA). Reference material was analysed ten times by using the described methodology. Concentrations found (1.25 ± 0.09 mg Kg−1) is in good agreement with the certified value (1.323 ± 0.064 mg Kg−1) after statistical evaluation by applying a t-test at 95% confidence level for nine degrees of freedom. tcal value (2.21) is lower than the ttab value of 2.26 Therefore, mercury in PM10 can directly be determined after thermal decomposition, collection on an amalgamator and AAS detection ensuring the accuracy of analysis. Finally, ERM CZ120 fine dust (like PM10) (European Commission­Joint Research Centre Institute for Reference Materials and Measurements (IRMM), Geel, Belgium) reference material was also analysed, concentrations found was 0.22 ± 0.02 mg Kg−1. Unfortunately, no certified/informative or reported values by other authors were available for this reference material.
The limit of detection (LOD) and the limit of quantification (LOQ), based on the 3σ and 10σ criterion (σ, the standard deviation of background signal), were calculated. Keeping in mind the filter surface (9.42 cm2) and the air volume taken through, the LODs and LOQs were 0.25 and 0.43 pg m−3, respectively; where it can be seen that the values are low enough to perform mercury quantification in PM10 samples. The repeatability of the procedure was obtained by subjecting a PM10 sample 11 times to the proposed procedure. Low RSD values (12.6%) was achieved.

2.5. Statistical Treatment of Data

To evaluate the analytical data, Univariate Analysis, Correlation Analysis and Principal Component Analysis were performed with Statgraphics version 7.0 (StatgraphicsGraphics Corporation, SC, USA).

3. Results and Discussion

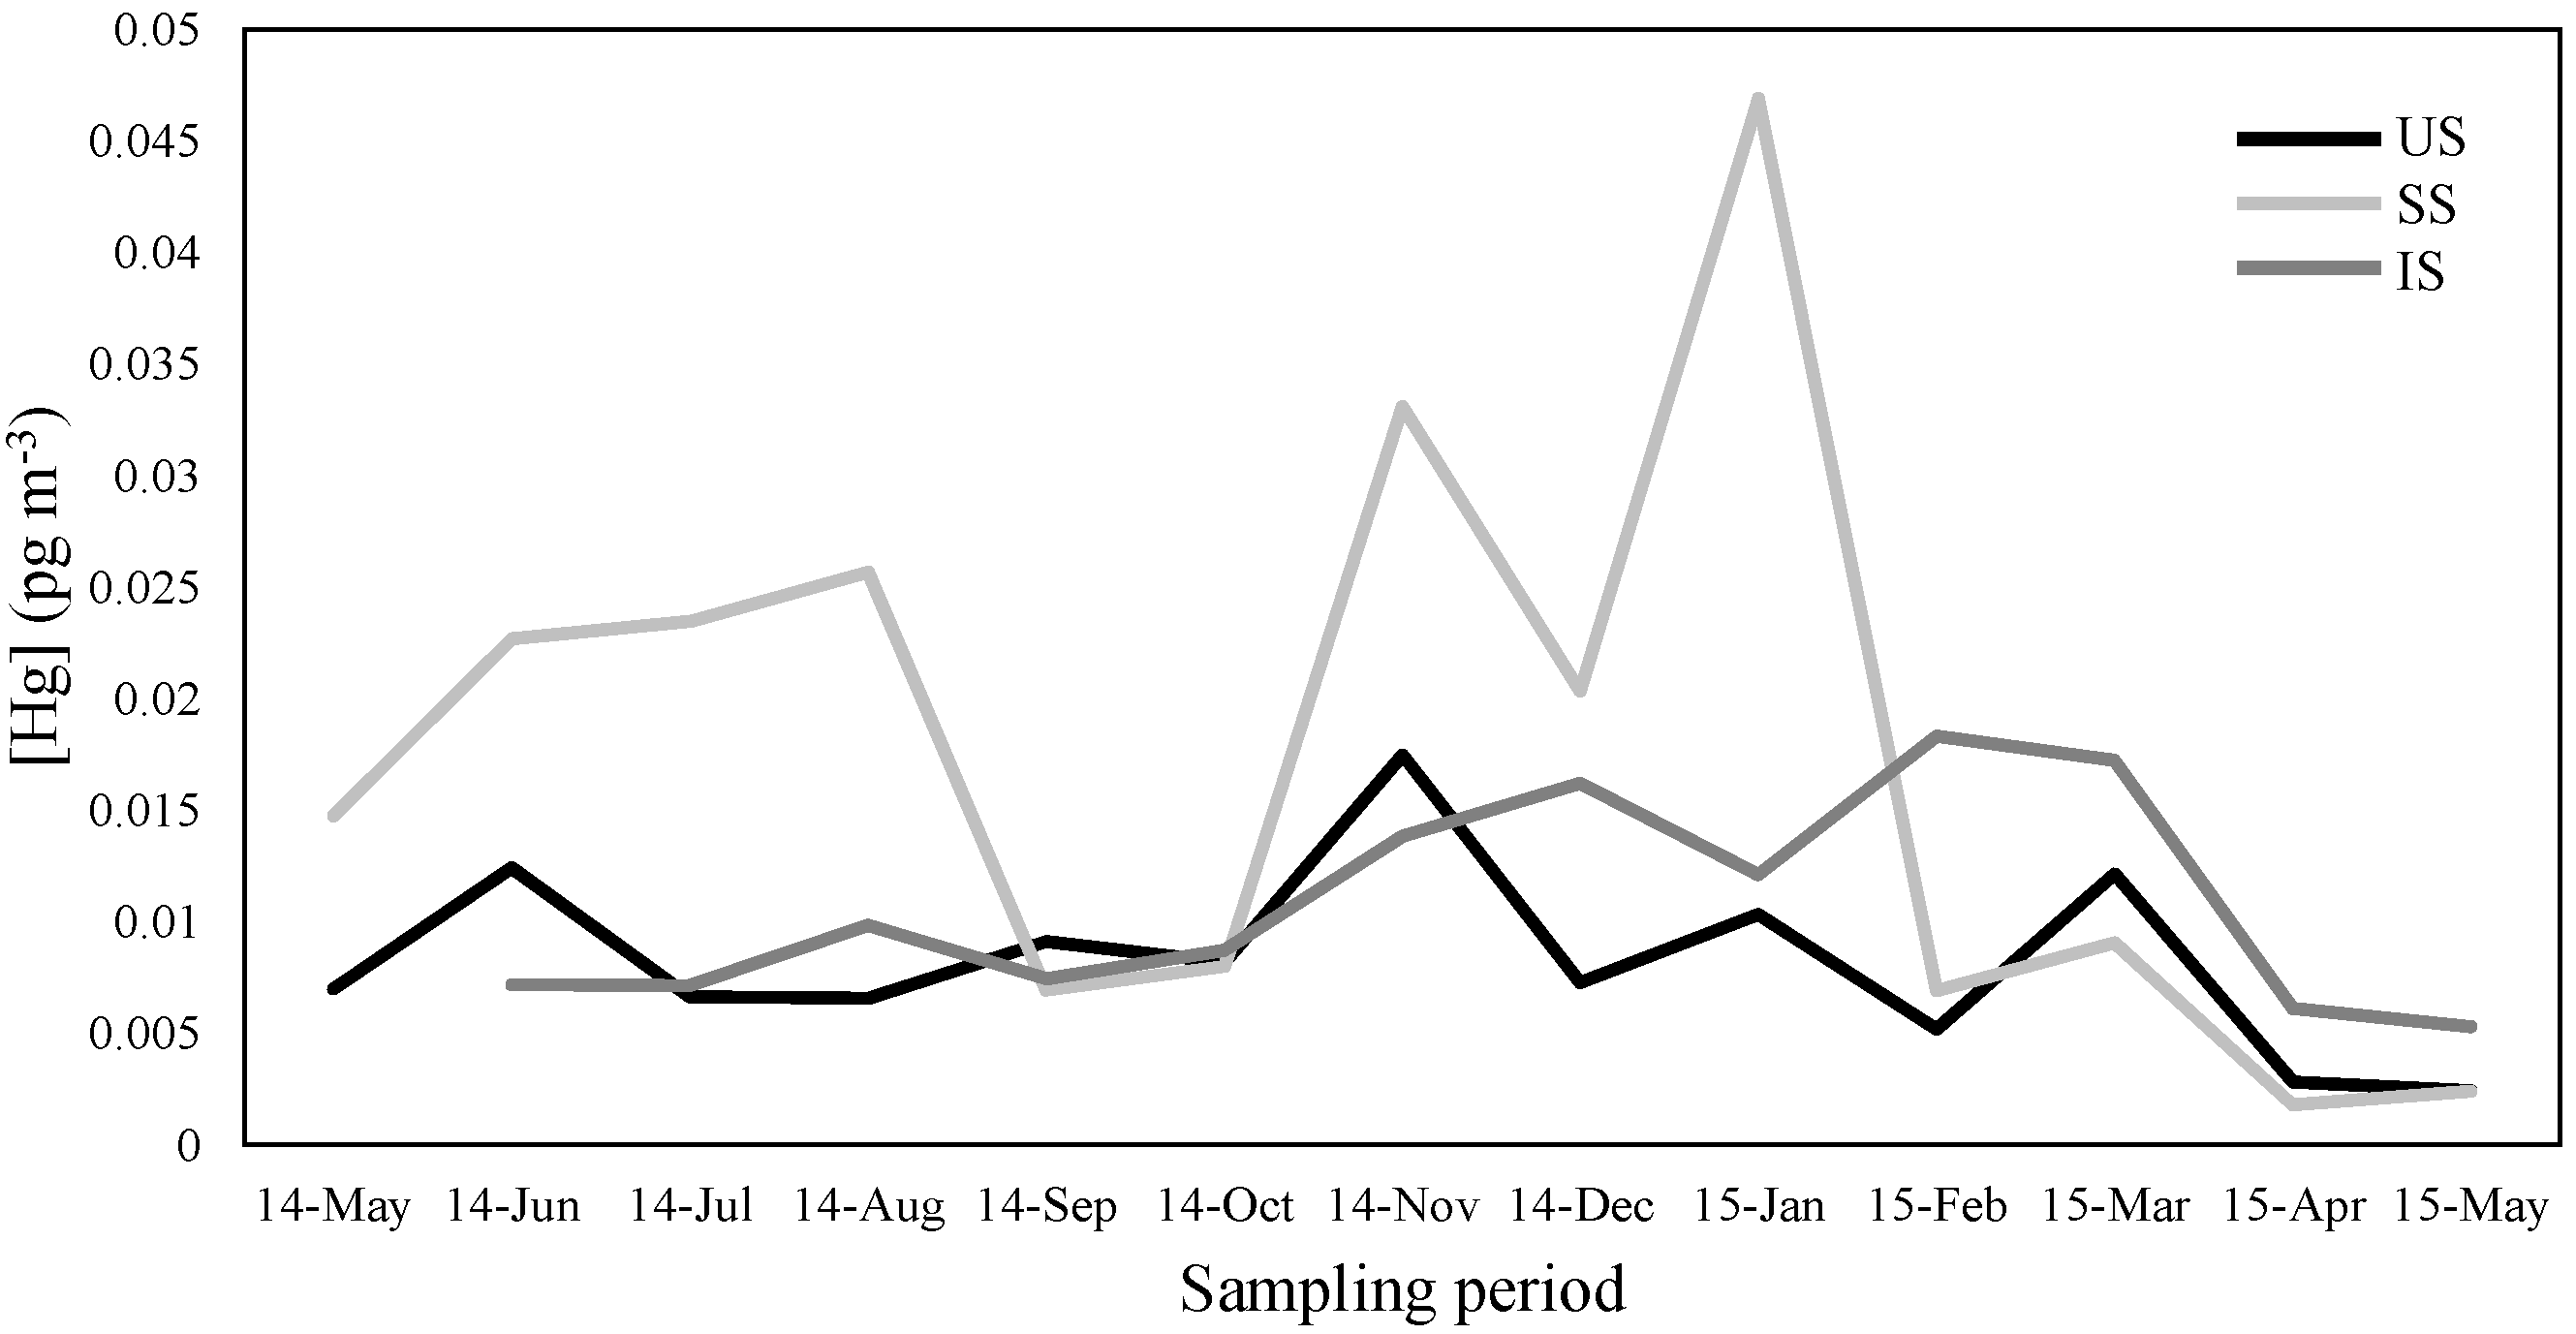
3.1. Atmospheric Particle-Bound Mercury Concentration in PM10

Average PHg concentrations at three sites (US, SS and IS), along with statistical results (RSD, maximum and minimum concentration, and range) are summarized in Table 1. High PHg content in PM10 concentrations were observed at SS (PHg concentrations varied between 1.5 and 75.3 pg m−3), while low values were achieved at US (PHg concentrations varied between 1.5 and 30.8 pg m−3). The biomass burning associated to agricultural activities and wood combustion for heating purposes at SS could be explain the high PHg concentration at SS (see the next section). A first attempt to find tendencies consisted of comparing the averages and SDs of PHg from three sites, and results from ANOVA, showed statistically significant differences (95.0% confidence level) between US and SS sites (the p-values of the F-test is lower than 0.05).
PHg concentrations found (Table 1) are in the concentration range reported for several European sites [15,17,18,19,20,21]. PHg concentration in total particulate matter varied from 5 to 200 pg m−3 at several sites of Northern Europe and in the Mediterranean region [21], from 0.11 to 1.05 pg m−3 in rural air in Southern Poland [20] and from 3.9 to 20.3 pg m−3 at Göteborg [19]. Lewandowska et al. reported PHg concentrations in the range of 0.6 to 32.9 pg m−3 in small aerosols (PM1) at an urbanized coastal zone of the Gulf of Gdansk (southern Baltic) [15]. PHg concentrations in the range of 2 to 142 pg m−3 were reported in coarse and fine particles (PM0.4–2.0) at the same site by Beldowska et al. [18]. Low concentrations have been also reported at urban (7.3–22.6 pg m−3) and forest (2.4–20.8 pg m−3) sites of Poland in coarse (PM2.2) and fine (PM0.7) particles [17]. Similar PHg levels (61 and 66 ng m−3 in PM2.5 and PM2.5–10, respectively) have been reported at a sub-urban area at the Western European coast (Portugal) [26].
On the contrary, high PHg values have been published for several Atlantic European sites. Arruti et al. reported PHg concentrations of <0.7–1.4 ng m−3 in PM10 samples and 0.8–0.9 ng m−3 in PM2.5 samples at several urban, suburban and industrial sites of the Cantabria region (Northern Spain) [22,23]. Frietas et al. reported PHg levels in the range of 0.14 to 1.5 and 0.07 to 2.3 ng m−3 in PM10 and PM2.5 samples, respectively in several inland sites of Portugal [25]. Finally, PHg levels around 0.9 ng m−3 in PM2.5 and PM2.5–10 samples were reported at industrial sites of Portugal by Farinha et al. [24]. The analysis of samples from industrial and contaminated sites and the use of analytical techniques such NAA could explain the high PHg concentrations reported.
A PHg variation among PM10 samples was achieved during the sampling period at several sites, RSD higher than 66% (Table 1), which reflects inherent heterogeneity of the atmospheric particles (marine, crustal and anthropogenic/industrial contributions). The variation of monthly mean PHg concentration (Figure 2) in PM10 at several sites varied largely from month to month. Descriptive statistics of PHg during the winter and summer seasons are summarised in Table 1. During the winter season (January–March and October–December), PHg concentration varied from 1.5 to 30.8, 1.5 to 75.3 and 2.8 to 33.7 pg m−3 at US, SS and IS, respectively (Table 1); with an average of 9.9 ± 8.4, 19.3 ± 20.4 and 14.4 ± 8.6 pg m−3 for US, SS and IS, respectively. On the contrary, concentrations of PHg varied from 1.5 to 25.7, 1.5 to 61.9 and 2.3 to 13.1 pg m−3 at US, SS and IS, respectively; with an average of 7.3 ± 5.9, 16.4 ± 19.0 and 7.5 ± 2.8 pg m−3 for US, SS and IS, respectively (Table 1) during the summer period (April–September). Although, high mean PHg concentrations were obtained during the winter season (November and December 2014 and January, February and March 2015) at all sites (Table 1, Figure 2); after applying ANOVA (Table 2), statistically significant differences (95.0% confidence level) were found between summer and winter seasons only at IS (the p-value of the F-test is lower than 0.05). Without neglecting the influence of the meteorological parameters (humidity, ambient temperature, precipitation, wind speed and direction), photochemical transformation and gas-particulate phase partitioning of atmospheric Hg, the high concentration of PHg during the winter may be due to the increased emissions from anthropogenic sources [30].

3.2. Sources of PHg in PM10

A study on the relations between Hg content (Table 1) and major ions, trace metal, equivalent black carbon (eBC) and UV-absorbing particulate matter (UVPM) concentrations (Tables S1 and S2) in PM10, and consequently the PHg sources, was assessed. Univariate and PCA analysis were assessed for samples collected at US (whole period N = 44, summer season N = 22 and winter season N = 22), SS (whole period N = 38, summer season N = 17 and winter season N = 21) and IS (whole period N = 41, summer season N = 182 and winter season N = 23). Procedures for major ions and trace metals extraction and quantification are summarized in the Supporting Information section; details for eBC and UVPM are also shown in this section.

3.2.1. Univariate Analysis

Spearman coefficients and p-values (Table 3) between PHg and some ions and trace metals for samples collected at US during the whole measuring period were as follows: NO3 (0.5889, p-value = 0.0022); Cr (0.6688, p-value = 0.0005); Pb (0.6037, p-value = 0.0017); and Sb (0.3979, p-value = 0.0387). Also, good correlation (p-value lower than 0.05) were found for PHg and eBC (0.4948, p-value = 0.0101) and UVPM (0.4226, p-value = 0.0281). These results indicate the anthropogenic origin of PHg, mainly associated with combustion of fossil fuels and road traffic. Similar conclusions were reached for samples collected during winter and summer seasons at US.
Good correlations were found for PHg and NO3 (0.6147, p-value = 0.0173 and 0.5874, p-value = 0.0514 for summer and winter seasons, respectively); for PHg and Cr (0.4742, p-value = 0.0562 and 0.7018, p-value = 0.0190 for summer and winter seasons, respectively); PHg and Pb (0.5647, p-value = 0.0519 and 0.7413, p-value = 0.0140 for summer and winter seasons, respectively); and PHg and eBC (0.5353, p-value = 0.0118 and 0.4216, p-value = 0.0186 for summer and winter seasons, respectively).
After applying statistics based on matrix correlations assessment, Spearman coefficients and p-values (Table 3) at SS it is shown that PHg are correlated with sea salt sources during the whole period (−0.3930, p-value = 0.0219 and −0.5532, p-value = 0.0376 for Na+ and Cl, respectively) and during the summer season (−0.5196, p-value = 0.0377 and −0.4843, p-value = 0.0554 for Na+ and Cl, respectively). These correlations could be explained taking in mind the high oceanic influence (backward trajectory analysis in the Supporting Information section) and the reaction of gaseous mercury with the particles of halides carried by marine air mass (see Section 3.2.1). Also, PHg are correlated with crustal and anthropogenic sources; Spearman coefficients and p-values between PHg and SO42− of 0.4476, p-value = 0.0091 and 0.6201, p-value = 0.0131, for during the whole period and summer season, were achieved. Good correlation between PHg and Cr (an anthropogenic tracer) was also found (0.3467, p-value = 0.0432 and 0.4945, p-value = 0.0479, for during the whole period and summer season, respectively). On the contrary, the results suggest an enrichment of mercury on PM10 due to crustal sources at SS site during winter season (0.5955, p-value = 0.0141; 0.5041, p-value = 0.0495, 0.5346, p-value = 0.0532 and 0.5060, p-value = 0.0441 for Ca2+, Al, Fe and Si, respectively). High wind speeds during wintertime would enhance the resuspension of soil/road dust, which could explain the correlation of PHg with crustal components of PM10. Results also suggest an enrichment of mercury on PM10 due to anthropogenic/biogenic sources; a good correlation was found with K+ (0.4778, p-value = 0.0488), the presence of K+ should be attributed to biomass burning in the immediate vicinity of the site.
Finally, crustal and anthropogenic origins for PHg in PM10 samples collected at IS could be assigned during the whole period and winter season (Table 3). PHg are positively correlated with Al (0.3457, p-value = 0.0505 and 0.6214, p-value = 0.0201 for the whole period and winter seasons, respectively), Fe (0.4373, p-value = 0.0514 and 0.5964, p-value = 0.0380 for the whole period and winter seasons, respectively) and Si (0.3522, p-value = 0.0463 and 0.3214, p-value = 0.0201 for the whole period and winter seasons, respectively). PHg are also correlated with anthropogenic tracer such as Bi (0.3538, p-value = 0.0454 and 0.5332, p-value = 0.0460 for the whole period and winter seasons, respectively), Sb (0.4405, p-value = 0.0127 and 0.6500, p-value = 0.0150 for the whole period and winter seasons, respectively) and UVPM (0.3603, p-value = 0.0415 and 0.5357, p-value = 0.0450 for the whole period and winter seasons, respectively). No correlation (p-value lower than 0.05) were found during summer season at this site.

3.2.2. Principal Component Analysis

PCA has been attempted with a data set in which Na+, NH4+, K+, SO42−, NO3, Al, PHg, Pb, Sb, eBC and UVPM contents were the discriminating variables. The results (after half-range and central value transformation, cross-validation and Varimax rotation) show that 69.71% of the total variance was explained by three principal components (PCs) at US during the whole period, which show eigenvalues higher than 1.0 (Figure 3a). NH4+, SO42−, NO3 and Pb content (38.67% of the total variance of the data set) are the main features in PC1. PHg, Pb, Sb, eBC and UVPM contents are the main features in PC2, explaining 16.76% of total variance. These PCs are associated with anthropogenic sources. The third PC offers the high weights for Na+ (sea as source), K+ (biomass burning) and Al (crustal source) explaining 14.27% of the total variance of the data set, respectively. Similar results were achieved during summer and winter seasons (Figure 3b,c), suggesting an anthropogenic source (fossil fuel combustion and road traffic) for PHg at US during all seasons.
PCA has also been attempted with PM10 samples collected at SS during the whole period and during summer and winter seasons. PCA shown that 72.25%, 81.39% and 78.25% of the total variance was explained by three PCs for the whole period (Figure 4a) and for summer (Figure 4b) and winter (Figure 4c) seasons, respectively. NH4+, Al, Sb, eBC and UVPM contents are the main features in PC1 (crustal plus anthropogenic sources), explaining 46.30, 58.67 and 44.86% of total variance at SS during the whole period, and summer and winter seasons, respectively. SO42−, NO3 and Pb contents (13.77, 14.96 and 18.80% of the total variance of the data set for the whole period, and summer and winter seasons, respectively) are the main features in PC2 (anthropogenic sources). Results shown high loading weights for PHg and K+ at PC3 for the whole period and winter season (12.17 and 14.58% of the total variance of the data set for the whole period and winter season, respectively), which suggests a biomass combustion source for PHg at SS during the period sampled [35]. Finally, similar factor loadings were achieved for K+ in the PC1, PC2 and PC3 (0.4960, 0.5567 and 0.4642 for PC1, PC2 and PC3, respectively) at SS during summer season, which can also suggest a biomass combustion source for PHg during this season.
Finally, PCA has also been attempted with PM10 samples collected at IS. Results suggest an anthropogenic origin of PHg during the whole period, a sea salt origin during summer season and anthropogenic and crustal sources during winter season (Figure 5a–c). The marine source of PHg could be explained taking into account that in the coastal atmosphere, Hg0 is transformed into reactive gaseous mercury (HgCl2 + HgBr2 + HgOBr + …), which could react or link with the particles of sodium chloride carried by marine air mass [15,36,37]. Backward trajectory analysis shows that the major air masses transported at studied sites during this season come mainly from Atlantic Ocean. This fact have been reported for several anthropogenic compounds by several authors due to the great influence of oceanic air masses in northwest Atlantic European sites [33,38]. As commented in the previous section (Section 3.2.1), the re-suspension of soil/road dust due to high wind speed could explain PHg relationship with crustal components of PM10 during winter season.

3.3. Human Health Risk Assessment

Non-carcinogenic risk assessment with regard to PHg in PM10 was carried out to evaluate the chronic risk of adults by using inhalation chronic daily intake (CDIinh) and hazard quotient (HQ) indexes. The equations used to calculate health risk were based on models recommended by USEPA [39]. CDIinh was assessed by the following equation:
CDI inh   =   [ PHg ] × R inh   ×   F exp   ×   T exp PEF   ×   ABW   ×   T avrg
where CDIinh is the chronic daily intake (mg kg−1 day−1), [PHg] is the concentration of particulate mercury in PM10 (mg Kg−1), Rinh is the inhalation rate (20 m3 day−1 for adults), Fexp is exposure frequency (365 day year−1), Texp is the exposure duration (24 years for adults), PEF is the particle emission factor (1.36 × 10⁹ m3 kg−1), ABW is the average body weight (60 kg for adults) and Tavrg is the averaging time (for non-carcinogens Tavrg = Texp). HQ was assessed by the following equation:
HQ = CDI inh R fD
where RfD is the reference dose of daily exposure to mercury that is likely to be without deleterious effects (3 × 10⁻⁴ mg kg−1 day−1) [40]. When HQ ≤ 1 suggests unlikely non carcinogenic effects, HQ > 1 suggests possible non-carcinogenic effects and HQ > 10 indicates high chronic health risk [36]
The mean CDIinh values were 1.5 × 10⁻⁵ ± 1.2 × 10⁻⁵, 5.7 × 10⁻⁵ ± 7.2 × 10⁻⁵ and 2.2 × 10⁻⁵ ± 1.4 × 10⁻⁵ mg Kg−1 d−1 at US, SS and IS, respectively. The HQ values assessed in PM10 at several sites (0.051, 0.189 and 0.073 for US, SS and IS, respectively, Figure 6 were lower than the safe level (HQ = 1), suggesting no non-carcinogenic adverse effects to adults via inhalation.

4. Conclusions

Our data on PHg levels in PM10 at several sites of an Atlantic coastal European region (northwest Spain), represent a novel contribution to the knowledge of complex atmospheric cycle of mercury in regions with high marine influence. In general, it was found that the concentrations of PHg found at these sites were lower than most of other ones reported at continental, Mediterranean and Atlantic coast European sites. PHg in PM10 increased, especially due to the burning of fossil fuels for heating purposes. Data from backward trajectory analysis, and univariate and principal component analysis suggest an anthropogenic origin of PHg at urban site during both seasons (summer and winter season). However, at suburban site the main contribution of PHg could be attribute biomass burning. A sea salt and crustal/anthropogenic origin of PHg could be suggested at industrial site. The reaction of Hg0 emitted with the particles of sodium chloride carried by marine air mass could explain the PHg association with sea salt sources, while the re-suspension of soil/road dust due to high wind speed could explain PHg relationship with crustal components of PM10 during winter season. This conclusion could be extrapolated to other north Atlantic urban, suburban and industrial sites of Europe in which the main air masses come from Atlantic Ocean. Finally, the HQ values assessed suggesting no non-carcinogenic risks for PHg at several sites studied.

Supplementary Materials

The following are available online at https://www.mdpi.com/2073-4433/11/1/33/s1, Table S1: Average, RSD, range and minimum and maximum values of major ions, metals, eBC and UVPM in PM10 samples at urban site (US) N = 44, suburban site (SS) N = 38 and industrial site (IS) N = 41, Table S2: Seasonal variation of major ions, metals, eBC and UVPM in PM10 samples at urban site US (summer season N = 22, winter season N = 22), suburban site SS (summer season N = 17, winter season N = 21) and industrial site IS (summer season N = 18, winter season N = 23).

Author Contributions

M.P.-I., and J.M.-P.; methodology, A.R.-C., M.F.-A., and J.M.-P.; software, J.M.-P.; validation, A.R.-C., M.F.-A., and M.P.-I.; formal analysis, S.M.-L., and J.M.-P.; investigation, A.R.-C., and J.M.-P.; resources, P.L.-M., and S.M.-L.; data curation, A.R.-C., and J.M.-P.; writing—Original draft, J.M.-P.; writing—Review and editing, J.M.-P., M.P.-I., and M.F.-A.; visualization, J.M.-P., M.P.-I., and A.R.-C.; supervision, P.L.-M., and S.M.-L.; project administration, P.L.-M., and S.M.-L.; funding acquisition, P.L.-M., and S.M.-L. All authors have read and agreed to the published version of the manuscript.

Funding

This work was supported by Xunta de Galicia (Programa de Consolidación y Estructuración de Unidades de Investigación Competitivas ref: ED431C 2017/28-2017-2020) FEDER-MINECO (UNLC15-DE-3097, financed together (80/20%) with Xunta de Galicia and Ministerio de Ciencia, Innovación y Universidades (Programa Estatal de I+D+i Orientada a los Retos de la Sociedad ref: RTI2018-101116-B-I00 (MCIU/AEI/FEDER, UE).

Acknowledgments

We are grateful to Alicia Cantarero-Roldán (SAI-University of A Coruña) for ICP-MS technical support. M. Fernández-Amado appreciates the Ministerio de Ciencia, Innovación y Universidades support (PTA2017-13607-I). The authors would like to thank P. Esperón (PTA2013-8375-I) for her support.

Conflicts of Interest

The authors declare no conflict of interest.

References

  1. Pope, C.A., III; Burnett, R.T.; Thun, M.J.; Calle, E.E.; Krewski, D.; Ito, K.; Thurston, G.D. Lung cancer, cardiopulmonary mortality, and long-term exposure to fine particulate air pollution. J. Am. Med. Assoc. 2002, 287, 1132–1141. [Google Scholar] [CrossRef] [Green Version]
  2. WHO Expert Consultation: Available Evidence for the Future Update of the WHO Global Air Quality Guidelines (AQGs). 2015. Available online: http://www.euro.who.int/__data/assets/pdf_file/0013/301720/Evidence-future-update-AQGs-mtg-report-Bonn-sept-oct-15.pdf?ua=1 (accessed on 15 October 2019).
  3. Lindberg, S.E.; Stratton, W.J. Atmospheric mercury speciation: Concentrations and behaviour of reactive gaseous mercury in ambient air. Environ. Sci. Technol. 1998, 32, 49–57. [Google Scholar] [CrossRef]
  4. EU. Ambient Air Pollution by Mercury (Hg). Position Paper. The European Commission Report. 2001. Available online: http://europa.eu.int/comm/environment/air/background.htm#mercury (accessed on 15 October 2019).
  5. The International Air Quality Advisory Board of the International Joint Commission and the Commission for Environmental Cooperation. Addressing Atmospheric Mercury: Science and Policy. 2003. Available online: https://scholar.uwindsor.ca/ijcarchive/558/ (accessed on 15 October 2019).
  6. ACAP. Assessment of Mercury Releases from the Russian Federation; The Arctic Council Action Plan (ACAP) to Eliminate Pollution of the Arctic; The Ministry of Natural Resources of the Russian Federation, The Danish Environmental Protection Agency and COWI A/S: Copenhagen, Denmark, 2005. [Google Scholar]
  7. ACAP. Arctic Mercury Releases Assessment. Reduction of atmospheric Mercury Releases from Arctic States; The Arctic Council Action Plan (ACAP) to eliminate pollution of the Arctic; Danish Environmental Protection Agency and COWI A/S: Copenhagen, Denmark, 2005. [Google Scholar]
  8. United Nations-Environment Programme. Minamata Convention on Mercury. 2017. Available online: http://www.mercuryconvention.org/Portals/11/documents/Booklets/COP1%20version/Minamata-Convention-booklet-eng-full.pdf (accessed on 15 October 2019).
  9. Pirrone, N.; Cinnirella, S.; Feng, X.; Finkelman, R.B.; Friedli, H.R.; Leaner, J.; Mason, R.; Mukherjee, A.B.; Stracher, G.B.; Streets, D.G.; et al. Global mercury emissions to the atmosphere from anthropogenic and natural sources. Atmos. Chem. Phys. 2010, 10, 5951–5964. [Google Scholar] [CrossRef] [Green Version]
  10. Xu, L.; Chen, J.; Yang, L.; Niu, Z.; Tong, L.; Yin, L.; Chen, Y. Characteristics and sources of atmospheric mercury speciation in a coastal city, Xiamen, China. Chemosphere 2015, 119, 530–539. [Google Scholar] [CrossRef] [PubMed]
  11. Fu, X.; Feng, X.; Qiu, G.; Shang, L.; Zhang, H. Speciated atmospheric mercury and its potential source in Guiyang, China. Atmos. Environ. 2011, 45, 4205–4212. [Google Scholar] [CrossRef]
  12. Bargagli, R. Atmospheric chemistry of mercury in Antarctica and the role of cryptogams to assess deposition patterns in coastal ice-free areas. Chemosphere 2016, 163, 202–208. [Google Scholar] [CrossRef]
  13. Han, D.; Zhang, J.; Hu, Z.; Ma, Y.; Duan, Y.; Han, Y.; Chen, X.; Zhou, Y.; Cheng, J.; Wang, W. Particulate mercury in ambient air in Shanghai, China: Size-specific distribution, gase-particle partitioning, and association with carbonaceous composition. Environ. Pollut. 2018, 238, 543–553. [Google Scholar] [CrossRef]
  14. Tang, Y.; Wang, S.; Wu, Q.; Liu, K.; Wang, L.; Li, S.; Gao, W.; Zhang, L.; Zheng, H.; Li, Z.; et al. Recent decrease trend of atmospheric mercury concentrations in East China: The influence of anthropogenic emissions. Atmos. Chem. Phys. 2018, 18, 8279–8291. [Google Scholar] [CrossRef] [Green Version]
  15. Xiu, G.L.; Jin, Q.; Zhang, D.; Shi, S.; Huang, X.; Zhang, W.; Bao, L.; Gao, P.; Chen, B. Characterization of size-fractionated particulate mercury in Shanghai ambient air. Atmos. Environ. 2005, 39, 419–427. [Google Scholar] [CrossRef]
  16. Lewandowska, A.U.; Bełdowska, M.; Witkowska, A.; Falkowska, L.; Wiśniewska, K. Mercury bonds with carbon (OC and EC) in small aerosols (PM1) in the urbanized coastal zone of the Gulf of Gdansk (Southern Baltic). Ecotoxicol. Environ. Saf. 2018, 157, 350–357. [Google Scholar] [CrossRef]
  17. Pyta, H.; Rogula-Kozłowska, W.; Mathews, B. Co-occurrence of PM2.5-bound mercury and carbon in rural areas affected by coal combustion. Atmos. Pollut. Res. 2017, 8, 127–135. [Google Scholar] [CrossRef]
  18. Siudek, P.; Frankowski, M.; Siepak, J. Atmospheric particulate mercury at the urban and forest sites in central Poland. Environ. Sci. Pollut. Res. 2016, 23, 2341–2352. [Google Scholar] [CrossRef] [PubMed] [Green Version]
  19. Beldowska, M.; Saniewska, D.; Falkowska, L.; Lewandowska, A. Mercury in particulate matter over Polish zone of the southern Baltic Sea. Atmos. Environ. 2012, 46, 397–404. [Google Scholar] [CrossRef]
  20. Li, J.; Sommar, J.; Wängberg, I.; Lindqvist, O.; Wei, S.-Q. Short-time variation of mercury speciation in the urban of Göteborg during GÖTE-2005. Atmos. Environ. 2008, 42, 8382–8388. [Google Scholar] [CrossRef]
  21. Zielonka, U.; Hlawiczka, S.; Fudala, J.; Wängberg, I.; Munthe, J. Seasonal mercury concentrations measured in rural air in Southern Poland Contribution from local and regional coal combustion. Atmos. Environ. 2005, 39, 7580–7586. [Google Scholar] [CrossRef]
  22. Wängberg, I.; Munthe, J.; Pirrone, N.; Iverfeldt, Å.; Bahlman, E.; Costa, P.; Ebinghaus, R.; Feng, X.; Ferrara, R.; Gårdfeldt, K.; et al. Atmospheric mercury distribution in Northern Europe and in the Mediterranean region. Atmos. Environ. 2001, 35, 3019–3025. [Google Scholar] [CrossRef]
  23. Arruti, A.; Fernández-Olmo, I.; Irabien, A. Regional evaluation of particulate matter composition in an Atlantic coastal area (Cantabria region, northern Spain): Spatial variations in different urban and rural environments. Atmos. Res. 2011, 101, 280–293. [Google Scholar] [CrossRef]
  24. Arruti, A.; Fernández-Olmo, I.; Irabien, A. Evaluation of the contribution of local sources to trace metals levels in urban PM2.5 and PM10 in the Cantabria region (Northern Spain). J. Environ. Monit. 2010, 12, 1451–1458. [Google Scholar] [CrossRef]
  25. Farinha, M.M.; Almeida, S.M.; Freitas, M.C.; Verburg, T.G.; Wolterbeek, H.T. Influence of meteorological conditions on PM2.5 and PM2.5–10 elemental concentrations on Sado estuary area, Portugal. J. Radioanal. Nucl. Chem. 2009, 282, 815–819. [Google Scholar] [CrossRef]
  26. Freitas, M.C.; Farinha, M.M.; Ventura, M.G.; Almeida, S.M.; Reis, M.A.; Pacheco, M.G. Gravimetric and chemical features of airborne PM10 and PM2.5 in mainland Portugal. Environ. Monit. Assess. 2005, 109, 81–95. [Google Scholar] [CrossRef]
  27. Almeida, S.M.; Pio, C.A.; Freitas, M.C.; Reis, M.A.; Trancoso, M.A. Source apportionment of fine and coarse particulate matter in a sub-urban area at the Western European Coast. Atmos. Environ. 2005, 39, 3127–3138. [Google Scholar] [CrossRef]
  28. Morton-Bermea, O.; Garza-Galindo, R.; Hernández-Álvarez, E.; Ordoñez-Godínez, S.L.; Amador-Muñoz, O.; Beramendi-Orosco, L.; Miranda, J.; Rosas-Pérez, I. Mercury in the metropolitan area of Mexico City. Bull. Environ. Contam. Toxicol. 2018, 100, 588–592. [Google Scholar] [CrossRef] [PubMed]
  29. Qie, G.; Wang, Y.; Wu, C.; Mao, H.; Zhang, P.; Li, T.; Li, Y.; Talbot, R.; Hou, C.; Yue, T. Distribution and sources of particulate mercury and other trace elements in PM2.5 and PM10 atop Mount Tai, China. J. Environ. Manag. 2018, 215, 195–205. [Google Scholar] [CrossRef] [PubMed] [Green Version]
  30. Duan, L.; Cheng, N.; Xiu, G.; Wang, F.; Chen, Y. Characteristics and source appointment of atmospheric particulate mercury over East China Sea: Implication on the deposition of atmospheric particulate mercury in marine environment. Environ. Pollut. 2017, 224, 26–34. [Google Scholar] [CrossRef]
  31. Kumari, A.; Kulshrestha, U. Trace ambient levels of particulate mercury and its sources at a rural site near Delhi. J. Atmos. Chem. 2018, 75, 335–355. [Google Scholar] [CrossRef]
  32. Xu, H.; Sonke, J.E.; Guinot, B.; Fu, X.; Sun, R.; Lanzanova, A.; Candaudap, F.; Shen, Z.; Cao, J. Seasonal and annual variations in atmospheric Hg and Pb isotopes in Xi’an, China. Environ. Sci. Technol. 2017, 51, 3759–3766. [Google Scholar] [CrossRef]
  33. Fang, G.-C.; Lo, C.-T.; Zhuang, Y.-J.; Cho, M.-H.; Huang, C.-Y.; Xiao, Y.-F.; Tsai, K.-H. Seasonal variations and sources study by way of back trajectories and ANOVA for ambient air pollutants (particulates and metallic elements) within a mixed area at Longjing, central Taiwan: 1-year observation. Environ. Geochem. Health 2017, 39, 99–108. [Google Scholar] [CrossRef]
  34. Moreda-Piñeiro, J.; Turnes-Carou, I.; Alonso-Rodríguez, E.; Moscoso-Pérez, C.; Blanco-Heras, G.; López-Mahía, P.; Muniategui-Lorenzo, S.; Prada-Rodríguez, D. The influence of oceanic air masses on concentration of major ions and trace metals in PM2.5 fraction at a coastal European suburban site. Water Air Soil Pollut. 2015, 226, 2240. [Google Scholar] [CrossRef]
  35. UNE-EN 12341. Ambient Air-Standard Gravimetric Measurement Method for the Determination of the PM10 or PM2,5 Mass Concentration of Suspended Particulate Matter; European Committee for Standardization: Brussels, Belgium, 2015. [Google Scholar]
  36. Cheng, I.; Zhang, L.; Blanchard, P.; Dalziel, J.; Tordon, R.; Huang, J.; Holsen, T.M. Comparisons of mercury sources and atmospheric mercury processes between a coastal and inland site. J. Geophys. Res. Atmos. 2013, 118, 2434–2443. [Google Scholar] [CrossRef]
  37. Hedgecock, I.M.; Pirrone, N. Mercury and photochemistry in the marine boundary layer-modelling studies suggest the in situ production of reactive gas phase mercury. Atmos. Environ. 2001, 35, 3055–3062. [Google Scholar] [CrossRef]
  38. Sommar, J.; Hallquist, M.; Ljungström, E.; Lindqvist, O. On the gas phase reactions between volatile biogenic mercury species and the nitrate radical. J. Atmos. Chem. 1997, 27, 233–247. [Google Scholar] [CrossRef]
  39. Santos, P.S.M.; Otero, M.; Santos, E.B.H.; Duarte, A.C. Chemical composition of rainwater at a coastal town on the southwest of Europe: What changes in 20 years? Sci. Total Environ. 2011, 409, 3548–3553. [Google Scholar] [CrossRef] [PubMed]
  40. US EPA. Risk assessment guidance for superfund. In Part A: Human Health Evaluation Manual; Part F, Supplemental Guidance for Inhalation Risk Assessment; U.S. Environmental Protection Agency: Washington, DC, USA, 2011; Volume I. [Google Scholar]
Figure 1. Sampling sites at the A Coruña City.
Atmosphere 11 00033 g001
Figure 2. Monthly variation of PHg concentration during the study period at urban (US), suburban (SS) and industrial (IS) sites.
Atmosphere 11 00033 g002
Figure 3. Three-dimensional plots of factor loadings for PM10 mass, Na+, NH4+, SO42−, NO3, Al, PHg, Pb, Sb, eBC and UVPM contents at urban site during whole period (a), summer (b) and winter (c) seasons.
Atmosphere 11 00033 g003
Figure 4. Three-dimensional plots of factor loadings for PM10 mass, Na+, NH4+, SO42−, NO3, Al, PHg, Pb, Sb, BC and UV PM contents at suburban site during one year long (a), summer (b) and winter (c) seasons.
Atmosphere 11 00033 g004
Figure 5. Three-dimensional plots of factor loadings for PM10 mass, Na+, NH4+, SO42−, NO3, Al, PHg, Pb, Sb, eBC and UVPM contents at industrial site during the whole period (a), summer (b) and winter (c) seasons.
Atmosphere 11 00033 g005
Figure 6. Average Hazard Quotient (HQ) of PHg at urban (US), suburban (SS) and industrial (IS) sites. The dotted line shows the acceptable limit of HQ i.e., 1 as established by US EPA.
Atmosphere 11 00033 g006
Table 1. Average, SD, range and minimum and maximum values of PHg in PM10 samples at urban site (US), suburban site (SS) and industrial site (IS).
SiteAverage ± SD (pg m−3)Max (pg m−3)Min (pg m−3)Range (pg m−3)N
Whole period
US8.5 ± 7.330.81.529.444
SS18.0 ± 19.875.31.573.838
IS11.4 ± 7.633.72.331.441
Summer season
US7.3 ± 5.925.71.524.222
SS16.4 ± 19.061.91.560.417
IS7.5 ± 2.813.02.310.718
Winter season
US9.9 ± 8.430.81.529.322
SS19.3 ± 20.475.31.573.821
IS14.4 ± 8.633.72.830.923
Table 2. Analysis of variance of PHg concentration for winter and summer seasons at urban (US), suburban (SS) and industrial (IS) sites.
SiteGroupsSum of SquaresDegree of FreedomMean SquareF-Ratiop-Value
USBetween groups73.79173.791.410.2420
Within groups2200.14252.38
SSBetween groups79.64179.640.200.6547
Within groups14090.836391.4
ISBetween groups489.901489.9010.770.0022
Within groups1774.03945.49
Table 3. Spearman rank correlation coefficients and p-values (in brackets) for PHg and major ions, metals, eBC and UVPM at urban site US (whole period, summer season, winter season), suburban site SS (whole period, summer season, winter season) and industrial site IS (whole period, summer season, winter season) at the probability of 95%. Bolded numbers means statistically significant correlations.
USSSIS
Summer + WinterSummerWinterSummer + WinterSummerWinterSummer + WinterSummerWinter
PM10 mass0.1357 (0.4806)−0.0.353 (0.893)0.1818 (0.5465)0.2773 (0.1059)−0.0441 (0.8599)0.4510 (0.0630)0.10003 (0.5706)0.1490 (0.5372)−0.3679 (0.1687)
NH4+−0.0126 (0.9478)−0.0588 (0.8199)0.1399 (0.6427)0.2199 (0.1998)0.2725 (0.2765)0.1125 (0.6428)0.3390 (0.0551)−0.0258 (0.9153)0.4808 (0.0720)
K+−0.1232 (0.5222)−0.0353 (0.8913)−0.3986 (0.1862)0.4380 (0.0653)−0.1533 (0.5398)0.4778 (0.0488)0.0889 (0.6150)0.3106 (0.2003)−0.0107 (0.9680)
Na+−0.3678 (0.0560)−0.3441 (0.1826)−0.5224 (0.0690)−0.3930 (0.0219)−0.5196 (0.0377)−0.2528 (0.2972)−0.2390 (0.1764)−0.4299 (0.0818)−0.3143 (0.2396)
Ca2+0.2063 (0.2836)0.3029 (0.2407)−0.0909 (0.7630)0.2832 (0.0987)0.0613 (0.8064)0.5955 (0.0141)−0.0692 (0.6955)−0.0712 (0.7691)0.0536 (0.8411)
Mg2+−0.3607 (0.0609)−0.3441 (0.1826)−0.5315 (0.0780)−0.2625 (0.1259)−0.5000 (0.8064)−0.0093 (0.9694)−0.1270 (0.4725)0.2590 (0.2855)−0.2714 (0.3098)
Cl−0.2507 (0.1927)−0.2206 (0.3929)−0.3427 (0.2558)−0.5532 (0.0376)−0.4843 (0.0554)0.0114 (0.9627)−0.1848 (0.2958)0.3228 (0.1126)−0.4071 (0.1277)
SO42−0.0980 (0.6107)0.0941 (0.7155)0.2168 (0.4721)0.4476 (0.0091)0.6201 (0.0131)0.3416 (0.1590)0.2721 (0.1238)0.1641 (0.4987)0.5179 (0.0527)
NO30.5889 (0.0022)0.6147 (0.0173)0.5874 (0.0514)0.1745 (0.3038)0.2940 (0.2470)0.1455 (0.5485)0.1374 (0.4371)0.1187 (0.6246)0.3000 (0.2617)
Al0.0082 (0.9659)−0.1987 (0.4416)0.3123 (0.3003)0.1843 (0.2825)0.0650 (0.7949)0.5041 (0.0495)0.3457 (0.0505)−0.0506 (0.8348)0.6214 (0.0201)
As−0.0438 (0.8199)−0.3761 (0.1452)0.4273 (0.1664)0.4715 (0.0600)0.4012 (0.1085)0.6144 (0.0113)0.2669 (0.0930)0.1166 (0.6306)0.3330 (0.2127)
Bi−0.0827 (0.6674)−0.4418 (0.0870)0.3726 (0.2166)0.3305 (0.0539)0.3640 (0.1454)0.2884 (0.2344)0.3538 (0.0454)0.1770 (0.4665)0.5332 (0.0460)
Cd0.0398 (0.8360)−0.1624 (0.5295)0.3410 (0.2581)−0.0131 (0.8552)−0.2730 (0.2731)0.1034 (0.6700)0.4032 (0.0226)0.1613 (0.5059)0.4861 (0.0689)
Cr0.6688 (0.0005)0.4742 (0.0562)0.7018 (0.0190)0.3467 (0.0432)0.4945 (0.0479)0.3038 (0.2104)−0.0351 (0.8425)−0.1043 (0.6670)−0.0717 (0.7885)
Cu0.3637 (0.0590)0.3824 (0.1386)0.2168 (0.4721)0.0014 (0.9935)0.1693 (0.4982)−0.2189 (0.3668)0.1765 (0.3181)−0.0609 (0.8018)0.3143 (0.2396)
Fe0.4155 (0.0308)0.3735 (0.1480)0.3930 (0.1924)0.3155 (0.0658)0.3004 (0.2295)0.5346 (0.0532)0.4373 (0.0514)0.1168 (0.6301)0.5964 (0.0380)
Mn0.1796 (0.3506)0.0154 (0.9526)0.3556 (0.2383)−0.0302 (0.8602)0.1357 (0.5873)−0.1082 (0.6555)0.2653 (0.1334)−0.04303 (0.8681)0.2906 (0.2768)
Ni−0.1692 (0.3792)−0.5133 (0.0468)0.2168 (0.4721)0.2757 (0.1079)0.2876 (0.2499)0.2851 (0.2398)0.3061 (0.0834)0.0918 (0.7049)0.3682 (0.1683)
Pb0.6037 (0.0017)0.5647 (0.0519)0.7413 (0.0140)0.2448 (0.1534)0.2451 (0.3264)0.2528 (0.2972)0.4106 (0.0514)−0.0031 (0.9898)0.1107 (0.6787)
Sb0.3979 (0.0387)0.2647 (0.3053)0.4266 (0.1571)0.3232 (0.0549)0.2770 (0.2679)0.3540 (0.1444)0.4405 (0.0127)0.2322 (0.3384)0.6500 (0.0150)
Si0.0077 (0.9683)−0.1853 (0.4730)0.3047 (0.3122)0.1840 (0.2834)0.0650 (0.7949)0.5060 (0.0441)0.3522 (0.0463)−0.0527 (0.8278)0.3214 (0.0201)
Sr0.0071 (0.9705)0.1941 (0.4522)−0.2448 (0.4169)−0.2459 (0.1516)−0.1642 (0.5113)−0.2797 (0.2489)−0.0638 (0.7180)0.0588 (0.8084)−0.2071 (0.4383)
V−0.1218 (0.5268)−0.5029 (0.0514)0.2417 (0.4228)0.1377 (0.4220)0.3438 (0.1691)0.0598 (0.8083)0.2407 (0.1783)0.1487 (0.5398)0.4036 (0.1310)
Zn0.3091 (0.1083)0.3853 (0.1356)0.3706 (0.2190)0.0821 (0.6321)−0.3936 (0.1154)03.3480 (0.1514)0.1257 (0.4772)0.1063 (0.6612)0.2357 (0.3778)
eBC0.4948 (0.0101)0.5353 (0.0118)0.4497 (0.0462)0.3224 (0.0610)0.3456 (0.1669)0.2611 (0.2817)0.3105 (0.0790)0.2074 (0.3924)0.4679 (0.0800)
UVPM0.4226 (0.0281)0.4216 (0.0186)0.4308 (0.0524)0.3076 (0.0729)0.4578 (0.0669)0.2340 (0.3341)0.3603 (0.0415)0.2157 (0.3787)0.5357 (0.0450)

