1. Introduction
Community concern about the perceived impact of industry on air pollution can be an important driver for research into the sources of air pollution. Atmospheric particles are one of the most significant air pollutants with respect to human mortality and morbidity [
1], even at concentrations below the current air quality standards, and were responsible in 2015 for nine million premature deaths globally [
2]. Exposure to atmospheric particles causes respiratory and circulation problems, particularly in elderly people, children, and people with existing health conditions. According to the World Health Organization [
3], particulate matter affects more people than any other air pollutant and its effects on health occur at levels of exposure currently being experienced by most urban and rural populations in developed countries. Even chronic exposure to low concentrations of fine particulate matter have been found to be associated with detrimental health effects such as has been documented for Sydney [
4].
Particles can be emitted directly into the atmosphere by both anthropogenic activities and from natural sources (known as primary particles) or can be produced in the atmosphere by oxidation of precursor gases (of anthropogenic and natural origins) to form volatile products that form new particles or condense onto existing particles (known as secondary particles). Particles in the atmosphere vary in size, with particles less than 10 microns (µm) in diameter (PM10) and fine particles less than 2.5 microns in diameter being the focus of air quality monitoring and management. PM10 comprises fine particles (smaller than 2.5 microns, termed PM2.5) and coarse particles (ranging in size from 2.5 to 10 microns, termed PM2.5–10). The fact that particles are made up of a complex mixture of sizes and chemical compositions that are dependent on the source of the particles, means that the chemical composition as a function of particle diameter can tell us something about the sources of particles in an airshed.
In this paper, we report on two studies that were carried out in the Hunter Valley of New South Wales (NSW), Australia to determine the sources of particles contributing to PM2.5 and PM2.5–10 in the region. The Hunter Valley, often divided into the Upper Hunter Valley (inland) and Lower Hunter Valley (near the coast) is located approximately 120 km (at the coast Newcastle) to 310 km (inland) north of Sydney and is home to a number of moderately sized towns with a range of commercial and domestic emissions as well as activities such as open cut coal mining, the transportation of coal to the Newcastle Port, the loading of coal into ships at the port, and the combustion of coal for power generation. A significant proportion of NSW electricity is generated by coal-fired power stations located in the Hunter Valley and fuelled with locally mined coal. Two studies were initiated by the NSW Government to address community concerns about particle pollution from industrial activities in the region. This also improves our knowledge beyond that available from existing emissions inventories which include data on primary particles from anthropogenic sources but rely on modelling for estimating secondary particle concentrations.
This paper focuses on synthesizing the results from the following two studies into an assessment of the sources of fine and coarse particles and the relative importance of the sources influencing the region in a typical year:
The Upper Hunter Fine Particle Characterization Study, which took place in 2012 and focused on PM
2.5 sampled at two towns in the Upper Hunter Valley [
5]; and
The Lower Hunter Particle Characterization Study that took place in 2014–2015 and focused on PM
2.5 and PM
2.5-10 sampled at four locations in the Lower Hunter Valley [
6].
2. Methods
2.1. Sampling Locations
Samples were collected at six locations in the Hunter Valley NSW, Australia (
Figure 1). Two sampling sites were located in the Upper Hunter Region in the towns of Singleton and Muswellbrook. Many open-cut coal mines are close to the towns and there are two major coal-fired power stations situated between the two towns with a total installed generating capacity of 5.6 GW.
Four sampling sites were located in the Lower Hunter Region at Beresfield, Mayfield, Stockton, and Newcastle. The Lower Hunter Region is where the Hunter River valley opens out to a coastal plain along the NSW east coast. Major urban areas include the city of Newcastle and the Maitland regional centre. The Newcastle–Maitland urban area has a population of 430,000, with the highest population density of 2900 km
−2 in the city of Newcastle [
7]. The Port of Newcastle is the largest bulk shipping port on the east coast of Australia and an internationally significant coal export port.
Wind directions at each site are generally aligned along the valley on a north–west to south–east axis. During the winter (June–August) off-shore, west–north-westerly airflow prevails over the region while during the summer (December–February), south-easterly (on-shore) airflow dominates the region (
Figure 1). Spring and autumn seasons are characterised by more varied airflow patterns, with wind from the north-western and south-eastern quadrants prevalent across much of the region. On a daily basis, the land–sea breeze circulation results in on-shore (easterly component) sea breezes during the daytime and off-shore land breezes at the surface during the night time.
2.2. Sample Collection
Samples of particulate matter were collected over two measurement campaigns. The Upper Hunter Study was carried out in 2012 at two locations (Singleton and Muswellbrook) using PM
2.5 samplers. The Lower Hunter Study was carried out in 2014–2015 at four locations (Newcastle, Beresfield, Mayfield, and Stockton) and included the collection of PM
2.5 and PM
2.5–10 samples. The instruments used to collect the samples at each location are shown in
Table 1.
The filter substrate used to collect particulate matter samples was dependent on the analysis to be performed on the filters.
Table 1 also lists the filter substrates used in each sampler and the parameters analysed on each substrate.
2.3. Analysis
2.3.1. Mass Measurement
The mass of particulate matter on the samples was determined gravimetrically. The filters were weighed before and after the sampling period to determine the particulate mass collected and then divided by the total volume of air that passed through the filter to obtain the particulate mass concentration. The weighing was performed under controlled conditions of 22 ± 2 °C and 50 ± 10% relative humidity.
2.3.2. Chemical Composition
Elemental composition was analysed on the PM
2.5 Teflon filters and the PM
2.5–10 nucleopore filters non-destructively using nuclear ion-beam analysis (IBA) techniques including proton induced x-ray emission (PIXE) [
8], proton induced gamma-ray emission PIGE) [
9], and proton elastic scattering analysis (PESA) [
10]. The elements analysed were hydrogen (H), sodium (Na), aluminium (Al), silicon (Si), phosphorous (P), sulphur (S), chlorine (Cl), potassium (K), calcium (Ca), titanium (Ti), vanadium (V), chromium (Cr), manganese (Mn), iron (Fe), cobalt (Co), nickel (Ni), copper (Cu), zinc (Zn), bromine (Br), and lead (Pb).
The concentration of soluble ions was determined on PM samples by ion chromatography. The PM
2.5 Teflon filters and the PM
2.5–10 Nucleopore filters were analysed for major water-soluble ions by suppressed ion chromatography (IC) and for anhydrous sugars including levoglucosan by high-performance anion-exchange chromatography with pulsed amperometric detection. These methods are described in detail elsewhere [
11]. The species whose concentrations were determined were chloride (Cl
−), nitrate (NO
3−), sulphate (SO
42−), oxalate (C
2O
4−), formate (HCOO
−), acetate (CH
3COO
−), phosphate (PO
43−), methanosulphonate (MSA
−), sodium (Na
+), ammonium (NH
4+), magnesium (Mg
2+), calcium (Ca
2+), potassium (K
+), levoglucosan (C
6H
10O
5, an anhydrous sugar–woodsmoke tracer), mannosan (C
6H
10O
5, an anhydrous sugar–woodsmoke tracer), arabitol, and mannitol.
Elemental and organic carbon analysis was performed on the quartz filters using a DRI Model 2001A Thermal-Optical Carbon Analyzer following the IMPROVE-A temperature protocol [
12]. Details of the method used in this study can be found [
11]. The IMPROVE-A carbon method measures four organic carbon (OC) fractions at four non-oxidizing heat ramps (OC1 at 140 °C, OC2 at 280 °C, OC3 at 480 °C, and OC4 at 580 °C) and three elemental carbon (EC) fractions at three oxidizing heat ramps (EC1 at 580 °C, EC2 at 740 °C, and EC3 at 840 °C).
Black carbon (BC) was measured on the 25 mm Teflon filters by the laser integrated plate method (LIPM). Full details can be found in [
13].
2.3.3. Receptor Modelling using Positive Matrix Factorisation (PMF)
Positive matrix factorisation (PMF) is a mathematical method that relies on internal correlations between species in the dataset to identify both the factors contributing to the samples and the amount that each factor contributes to the composition measured on the filter [
14,
15]. Sources are identified from the factors using the species that contribute to the factor, knowledge of atmospheric chemistry, and other information such as meteorological data. In some instances, a single source dominates the factor and in others, sources that are co-located or otherwise correlated can appear together in a single factor or across several factors. PMF can identify factors representing species or groups of species that are directly emitted (primary particles) and those formed by chemical reactions in the atmosphere and gas-to-particle conversions (secondary particles).
In this work, the chemical composition data of all the samples was analysed using the U.S. Environmental Protection Agency’s EPA PMF 3.0 [
16] and EPA PMF 5.0 software [
17]. The uncertainty in the factor contributions was derived from the bootstrapping and displacement methods. Note that the uncertainties are not symmetric about the best fit and are not standard deviations, but rather represent confidence intervals that with a high probability contain the (unknown) true values. Some factor contributions have relatively little uncertainty (e.g., the fresh sea-salt factor) whereas others are much more uncertain (e.g., the mixed industry/vehicle factor).
Forty-five species were produced by the analytical methods used in these studies, however, not all were used in the PMF analysis. Species were removed for the following reasons:
Duplication of the species between the two methods (e.g., SO42− by IC and S by PIXE, EC by thermal desorption and BC by laser integrated plate method);
Negative biases for some species in a method (e.g., IBA data for Na, S, Cl, K, and Ca);
Poor fit between PMF and measured concentrations (r2 < 0.4) to remove noise from PMF (e.g., Br and PO43−);
Species with more than 95% of measured concentrations less than the minimum detection limit as recommended in the EPA PMF 5.0 User Guide [
17] (e.g., Co, P, Se, CH
3COO
−, and HCOO
−).
In addition, the signal-to-noise (S/N) ratio calculated by EPA PMF was used to assign an uncertainty weighting to the species with species with S/N ratios less than 0.5 being removed from the analysis. Species with S/N ratios between 0.5 and 1 were considered weak variables so that their estimated uncertainties were increased by a factor of three to reduce their weight in the solution. The mass variable, as a totalizing variable, was also assigned to be weak.
The list of species included in each study, their uncertainty rating (weak or strong), and their S/N ratio are presented in the
Supplementary Materials (Tables S1–S3). At Singleton and Muswellbrook, a total of 123 PM
2.5 samples from each site, each with 25 species were included in the PMF analysis. At Newcastle, Beresfield, Mayfield, and Stockton, a total of 122 PM
2.5 samples from each site, each with 30 species were included in the PMF analysis, and at Stockton and Mayfield, a total of 123 PM
2.5–10 samples from each site, each with 25 species, were included in the PMF analysis.
Of note is that for the PM2.5 samples measured in Newcastle, Beresfield, Mayfield, and Stockton, EC data were used instead of BC, while for the PM10–PM2.5 samples from Mayfield and Stockton, BC was used since EC was not determined on these filters. For the Singleton and Muswellbrook PM2.5 samples, an artefact in the EC thermal desorption measurements resulted in poor data quality for EC, which meant that BC was used instead.
PMF models were run separately for data for each site and each size fraction. For the Singleton and Muswellbrook PM2.5 datasets, PMF 3.0 was executed with 40 runs, a random seed, and an extra modelling uncertainty of 5% to account for errors not considered in calculating measurement or analytical errors. For the other datasets, PMF 5.0 was executed with 100 base runs, a random seed, and various numbers of factors, and an extra modelling uncertainty of 10%. For all datasets, the model was executed with various numbers of factors until the final solution was found by examining the scaled residuals and the ability of the model solution to simulate the observed time series of the species concentrations. The G-space plots showed little rotation and Fpeak was not used. All runs converged and the Q values were stable, indicating little influence from outliers.
3. Results
3.1. PM Mass
The highest average PM
2.5 concentrations were measured at Stockton and Muswellbrook, and concentrations of PM
2.5–10 were over two times greater at Stockton than at Mayfield. Stockton also measured the greatest maximum concentration in PM
2.5 and PM
2.5–10 concentrations. Average, minimum, and maximum PM
2.5 concentrations were consistent across the other sites. The average concentrations shown in
Table 2 were much lower than the National Environment Protection Measure (NEPM) for PM
2.5 of 25 µg m
−3 over 24 h, however the maximum concentrations approached this standard value at several of the sampling sites.
The time series of gravimetric mass measured on the filters at the six locations is shown in
Figure 2. PM
2.5 at Muswellbrook and Singleton in 2012 showed the highest concentrations between May and October 2012. Elevated concentrations of PM
2.5 at Stockton, Mayfield, Newcastle, and Beresfield occurred between May and August 2014 and November and December 2014 when the peak concentrations occurred. A similar pattern was observed for PM
2.5–10 at Stockton and Mayfield during 2014.
PM2.5 concentrations at Stockton, Mayfield, Newcastle, and Beresfield in 2014–2015 were similar on most days, suggesting that the regional transport and dispersion of fine particles significantly influences concentration levels at each site. Significantly higher PM2.5 levels were recorded at Stockton on many occasions from mid-April to mid-August.
At Beresfield, PM2.5 concentrations measured during winter 2014 (June–August) were higher than those measured at Newcastle and Mayfield, but lower than measured at Muswellbrook and Singleton in 2012, while in summer (December–February), higher PM2.5 concentrations were measured at Mayfield when compared to Beresfield.
3.2. Chemical Speciation
The average, standard deviation, and maximum concentration of chemical species measured on PM
2.5 samples are listed in
Table 3. At most of the sites, the species with the highest concentrations were organic carbon, sulphate, elemental carbon, and sodium. The exception was Stockton, where nitrate was also present in very high concentrations.
The average, standard deviation, and maximum concentration of chemical species measured in PM
2.5–10 samples at Mayfield and Stockton are listed in
Table 4. At both sites, the species with the highest concentrations was chloride, followed by sodium, and black carbon.
3.3. PMF Receptor Modelling Results
Eight factors were identified in the PMF analysis of the PM
2.5 data at Muswellbrook and Singleton (using EPA PMF 3.0); nine factors were identified in the PMF analysis of the PM
2.5 data at Newcastle, Beresfield, Mayfield, and Stockton; and six factors were identified in the PMF analysis of the PM
2.5–10 data at Mayfield and Stockton (using EPA PMF 5.0 which was not available for the Upper Hunter analysis).
Table 5 lists the factors identified, the main species used to identify the factor and the contribution of each factor to the PM mass. Additionally, listed is the uncertainty in the factor contributions derived from the bootstrapping and displacement methods in the EPA PMF 5.0 software [
18]. The uncertainties represent confidence intervals that with a high probability contain the (unknown) true values. The factor fingerprints obtained by PMF analysis at each site are available in the
Supplementary Materials (Figures S1–S8).
Across the six sites and two size fractions over the two sampling periods, 14 factors were found to contribute to particle mass. Of these, three source profiles common to all sites, size fractions, and sampling period were fresh sea salt, pollutant-aged sea salt and soil. Four source profiles were common across all sites for PM2.5 including secondary sulphate, nitrate (primary and secondary), mixed industry/vehicles, and woodsmoke. One source profile (other biomass smoke) was only identified in PM2.5 at Singleton and Muswellbrook, and two source profiles (mixed industry/shipping and vehicles) were only identified in PM2.5 at Newcastle, Beresfield, Mayfield, and Stockton. Three sources (bioaerosol, light absorbing particles (coal dust), and industry) were only identified in the PM2.5–10 size fraction at Mayfield and Stockton.
The following description groups the factors into several sets:
Fresh sea salt, pollutant-aged sea salt, soil, and bioaerosol factors–mechanically derived primary aerosol from natural sources. Pollutant-aged sea salt includes secondary components in addition to sea salt;
Woodsmoke and biomass smoke factors, combustion of biomass sources;
Industry and vehicle factors including all sources with an industry origin, directly emitted to the atmosphere, and hence primary sources;
Sulphate and nitrate (secondary ammonium sulphate and nitrate formed by reactions in the atmosphere from precursor gases of anthropogenic origin) and primary nitrate at Stockton.
The following discussion presents the results in terms of the percentage that each factor makes to the PM2.5 and PM2.5–10 mass at each site. Noting that the annual averaged PM2.5 across most of the sites was consistent, the percentage contribution of each factor can also be considered equivalent to the relative concentration contribution of each factor at the sites.
3.3.1. Sea Salt and Soil Factors
Fresh Sea Salt
The fresh sea salt factor contributed to both the PM2.5 and PM2.5–10 size fractions at all sites and is characterized by the presence of sea water elements sodium, chloride, magnesium, and sulphate. The average contribution of this factor to PM2.5 was greatest at Stockton (closest site to the coast at 0.2 km from the coast) and lowest at Muswellbrook (furthest site from the coast at 100 km from the coast). The annual average contribution of this factor to the PM2.5–10 at Mayfield and Stockton was greater than the contribution to PM2.5 at these sites, which is expected since the sea salt aerosol mass size distribution is dominated by particles greater than 2.5 µm in diameter.
This factor was identifiable as fresh sea salt aerosol since the ratios of the sea water elements (
Table 6) were generally within 10% of the ratios found in standard sea water [
18]. The lower [Cl
−/Na
+] ratios at Singleton and Muswellbrook may be attributed to some loss of chloride, as indicated by the presence of both non sea salt sulphate (note the high SO
42−/Na
+ ratio at Singleton) and nitrate in the source profile at these sites.
Pollutant-Aged Sea Salt
The pollutant-aged sea salt factor occurred across all sites in the PM2.5 and PM2.5–10 size fractions and was dominated by the presence of sulphate and sodium. The annual average contribution of this factor to PM2.5 was greatest at Beresfield and lowest at Singleton. The annual average contribution of this factor to PM2.5–10 was lower than the contribution of this factor to PM2.5 at Mayfield and Stockton.
This factor was identifiable as the pollutant-aged sea salt source since the ratios of the elements magnesium, calcium and potassium to sodium were the same or close to those of sea water (
Table 6 shows the magnesium/sodium ratio). However, chloride was absent (in the PM
2.5 samples) or very low (in the PM
2.5–10 samples), indicating that chloride had been displaced by sulphuric acid, nitric acid, and possibly oxalic acid [
19]. In this process, sulphuric acid is neutralized by the weak base of the sea salt particles, resulting in the replacement of chloride by sulphate, thus enhancing the ratio of sulphate to sodium ratio relative to seawater. The PM
2.5–10 factor was less ‘aged’ than the corresponding factor for PM
2.5 (i.e., still retains significant chloride) because the smaller surface-area-to-volume ratio for the coarse particles meant that the timescale of the reactions replacing the chloride was longer than for PM
2.5.
The sources of these acids are industrial and transport emissions. Sulphuric and nitric acids are produced from the oxidation of sulphur and nitrogen oxides from fossil fuel combustion. Oxalate can be produced through the oxidation of oxygenated volatile organic compounds (e.g., [
19,
20]).
Soil
The soil factor occurred across all sites in the PM2.5 and PM2.5–10 size fractions and was characterized by the presence of crustal dust elements aluminium, silicon, and titanium. Generally, the soil factor accounted for the greatest proportion of these species (65–80% for all sites and size fractions). The average contribution of this factor to PM2.5 was relatively consistent across the sites (around 10%).
The factor was identifiable as fresh soil dust since the ratios of the aluminium to silicon generally matched those for crustal composition for PM
2.5 at all of the sites (
Table 7), with the exception of Stockton, where the ratio was more than twice that of crustal composition [
21] and Australian dust [
22], suggesting an additional source of aluminium at Stockton for PM
2.5. The aluminium to silicon ratios in the soil factor for PM
2.5–10 at Mayfield and Stockton were also slightly higher than the crustal composition, again indicating an additional aluminium source to PM
2.5–10.
The elevated ratios of aluminium to titanium relative to crustal ratios for both size fractions at Stockton and PM2.5–10 at Mayfield indicated the presence of an additional aluminium source that is low in titanium. The soil factor for PM2.5–10 at Mayfield and Stockton also included small amounts of iron, manganese and zinc, so may indicate some road and/or industrial dust in this factor.
PM2.5 at several sites also showed elevated iron relative to crustal soil (Muswellbrook, Singleton, Mayfield, and Stockton), which may indicate an industrial origin for part of the dust. The soil factor also included varying amounts of organic and elemental carbon across the sites and size fractions, consistent with soil dust being of a more local origin than some of the other factors.
Bioaerosols
The bioaerosols factor was only observed in the PM
2.5–10 samples. The annual average contribution of this factor to PM
2.5–10 was 6% at Mayfield and 5% at Stockton. This factor was identifiable as bioaerosols since it included 80–90% of the arabitol and mannitol, which are biomarkers for fungal spores and have been used to assess the abundance of bioaerosols in the atmosphere [
23,
24].
3.3.2. Woodsmoke and Biomass Smoke
The woodsmoke factor occurred across all sites in the PM2.5 fraction and was characterized by the presence of levoglucosan and mannosan. The average contribution of the woodsmoke factor to PM2.5 mass was greatest at Muswellbrook and lowest at Stockton.
The woodsmoke factor was clearly identifiable as woodsmoke because it contained 85–90% of the levoglucosan and mannosan, both unique tracers for the combustion of cellulose found in trees and plants [
25]. This factor also included about 20–30% of the organic carbon at all sites except Singleton, where it included 8% of organic carbon. The amount of black/elemental carbon sites varied from 20% at Muswellbrook, Beresfield, Stockton, and Mayfield to less than 5% at Singleton and Newcastle.
Figure 3 shows a clear linear relationship between the volatile organic carbon fraction (OC1) measured by the IMPROVE-A method and levoglucosan, indicating that the woodsmoke was fresh, which is expected considering the proximity of the sampling sites to houses. Note that in the NSW 2008 emissions inventory, residential wood heater emissions were estimated to be 900 tonnes of PM
2.5 and about 35 tonnes of PM
2.5–10 in 2008 across regions of the Hunter, accounting for 94% of PM
2.5 emissions from the residential sector during 2008.
The biomass smoke factor was only identified in PM2.5 at Singleton (8%) and Muswellbrook (12%) and included potassium and organic carbon with the contribution of the least volatile organic carbon fraction measured by the IMPROVE-A method (OC4) as having the greatest contribution and the least volatile fraction (OC1) was the lowest. This factor was identifiable as biomass smoke because of the presence of potassium, which can be produced by the combustion of cellulose. The absence of the woodsmoke tracer levoglucosan indicated that the smoke may have resulted from the combustion of material other than wood (e.g., grasses) or that the biomass burning smoke source was aged. For example, Hennigan et al. (2010) showed the decay of levoglucosan after reaction with hydroxyl radicals under experimental conditions. The high concentration of OC4 (the least volatile OC group) may also indicate that the smoke was aged in the biomass smoke factor
The biomass smoke factor and the woodsmoke factor at Singleton and Muswellbrook clearly divide the smoke sources into bushfire/hazard reduction smoke and domestic woodheaters. On the other hand, at Beresfield, Newcastle, Stockton, and Mayfield, the PMF did not separate these smoke sources and both are included in the Woodsmoke Factor. The seasonal patterns in the two smoke factors provide information on the contribution of each source to the different sites (
Figure 4).
The contribution of the woodsmoke factor to all sites is greatest during winter (June–August) 66% at Muswellbrook, 41% at Beresfield, 31% at Newcastle and Mayfield, 30% at and Singleton 11% at Stockton. At Muswellbrook and Singleton, the factor was only present during the cooler months of the year with significant contributions from May to August in both towns, while in Newcastle, Beresfield, Mayfield, and Stockton, this factor contributes to PM2.5 mass from May to November. The seasonal pattern in the contribution of the woodsmoke factor at Newcastle, Beresfield, Mayfield, and Stockton correspond to the use of domestic woodheaters from May to August and emissions from bushfire/hazard reduction burns that take place in autumn (March, April, and May) and early spring (September and October).
The contribution of the biomass smoke factor to PM
2.5 at Singleton and Muswellbrook was elevated from September to January and showed slightly elevated levels during May and June (more distinct at Muswellbrook). Data from the NSW Rural Fire Service in
Figure 5 shows that there were many wildfires and hazard reduction burns from August to December 2012.
Back trajectory analysis was undertaken using the National Oceanic and Atmospheric Administration (NOAA) Hybrid Single-Particle Lagrangian Integrated Trajectory (HYSPLIT) model [
26] to investigate the likely contribution of bushfire/hazard reduction burning to the woodsmoke factor at the Lower Hunter locations. Findings indicated that bushfires may have contributed to some extent on about a quarter of all smoke-affected days (10% in winter, 25% in autumn, and 50% in spring), with the most dominant contributions likely to have occurred on days in late October, early November (spring).
3.3.3. Industry and Vehicles
Industry
The industry factor was only present in the PM2.5–10 samples from Stockton and Mayfield and included most of the zinc, iron, and manganese (50–75%) in the samples. The annual average contribution of this factor to the PM2.5–10 mass at Mayfield was 12% and 5% at Stockton. Other species contributing to this factor included calcium and fluoride. Aluminium, silicon, and titanium were also present, but with ratios very different from those found in soils. This factor makes the greatest contribution to PM2.5–10 mass during early summer (December) at Mayfield and late autumn to winter (May to August) at Stockton.
Light Absorbing Carbon
The light absorbing carbon factor was only observed in the PM2.5–10 samples from Stockton and Mayfield and included 90% of the light-absorbing carbon. The annual average contribution of this factor to PM2.5–10 was 10% at Mayfield and Stockton. The light absorbing carbon factor also included some sea salt elements, with lower chloride suggesting some chloride loss compared to the fresh sea salt factor.
Analysis of the PM
2.5–10 samples from Stockton using the advanced optical reflected light imaging and analysis system, described in [
27] suggested that all or most of the light-absorbing carbon identified in the Stockton PM
2.5–10 mass consisted of coal particles. Several coal works facilities are located in the Port of Newcastle. Sources of coal dust emissions from coal terminal operations include fugitive emissions from rail receival stations, conveyors and transfer points, wind erosion of stockpiles, stacking and reclaiming, ship loading, and dozer and front-end loader operations [
28]. Coal works in the Newcastle region were estimated to emit 90 tonnes/year of PM
2.5 and 750 tonnes/year of PM
10 based on the 2008 Greater Metropolitan Region air emissions inventory [
29].
Vehicles
The vehicle factor was only present in the PM2.5 samples from Newcastle, Beresfield, Stockton, and Mayfield and was characterized by the presence of iron, manganese, chromium, and copper. The annual average contribution of this vehicle factor to PM2.5 mass was consistent at around 10% at Newcastle, Beresfield, and Mayfield and lowest (at 5%) at Stockton. Note that the vehicle factor was not identified in the PM2.5 Muswellbrook and Stockton datasets. Instead, vehicles were captured in the mixed industry/vehicle factor (described below).
The vehicle factor could include direct vehicle emissions from the combustion of petrol and diesel as well as emissions from brake and tyre wear and can incorporate non-road vehicles and equipment running on automotive petrol and diesel. This factor included about half the iron, manganese, chromium, and copper at all sites. Zinc was mostly absent from this factor (most of the zinc (>70%) was in the mixed industry/vehicle factor). However, the presence of 60% of zinc in this factor for the Stockton samples suggested the presence of industry sources mixed in the vehicle factor at Stockton.
Copper has been identified as a marker for brake wear since the wear of brakes results in the emission of iron and copper [
30]. Manganese may be indicative of the fuel additive methylcyclopentadienyl manganese tricarbonyl (MMT), which has been used as a fuel additive in Australia since 2000 [
31]. During combustion, MMT releases inorganic manganese species [
32] and its presence of up to 5 ng m
-3 in PM
2.5 in Sydney was attributed to vehicle emissions [
33].
On-road vehicles were estimated to emit 230 tonnes of PM
2.5 in 2008 across the regions of the Hunter Valley [
29], comprising exhaust emissions from diesel (55.2%), petrol (8.3%), and other vehicles (0.4%), and non-exhaust emissions from brake, tyre, and road surface wear (36.1%).
Mixed Industry/Vehicles
The mixed industry/vehicle factor occurred at all sites but only in the PM2.5 fraction. The annual average contribution of this factor to PM2.5 mass was greatest at Singleton and lowest at Mayfield.
The mixed industry/vehicle factor explained more than 60–70% of zinc across all sites except Singleton (<5%) and Muswellbrook (30%). The National Pollutant Inventory (NPI) lists the zinc sources in the region as 65% industry, 26% vehicles, 5% wind-blown dust, and 4% other (bushfires, wood heaters) [
34]. Other species contributing to this factor included manganese, chromium, copper, lead, and iron as well as sulphate, organic carbon, and black/elemental carbon. There was more zinc and manganese relative to iron in the mixed industry/vehicle factor than in the vehicle factor, while the ratios of chromium, copper, and calcium to iron were similar across the two factors.
The vehicle component of this mixed factor could include direct vehicle emissions from the combustion of petrol and diesel as well as emissions from brakes and tyre wear or resuspension of paved road dust. The latter is not likely to be significant, however, since silica and aluminium were absent from the factor.
Mixed Shipping/Industry
The mixed shipping/industry factor was only present in the PM2.5 fraction from Newcastle, Beresfield, Stockton, and Mayfield. The annual average contribution of this factor to PM2.5 mass was consistently low (less than 5%) across each site.
The mixed shipping/industry factor included most of the vanadium and a significant fraction of the nickel. The ratio of vanadium to nickel of 3–3.5 at all sites is representative of heavy oil combustion from shipping [
35,
36]. The vanadium concentration was the maximum at Stockton (near the port) and lowest inland at Beresfield, indicating the influence of shipping on the vanadium concentrations at sites closer to the port. Shipping related factors were not identified at the inland Muswellbrook and Singleton sites in the Upper Hunter. The factor also included sulphate, organic carbon, and elemental carbon. While shipping emissions include sulphate and elemental carbon, the consistency of the vanadium to nickel ratio, and the increase in the sulphate and elemental carbon relative to vanadium with increasing distance from the coast suggest the contribution from industry (the main source of sulphate) across these sites.
3.3.4. Secondary Sulphate and Nitrate
Secondary Ammonium Sulphate
The secondary ammonium sulphate factor occurred across all sites in the PM2.5 fraction. The annual average contribution to PM2.5 was greatest at Muswellbrook and least at Mayfield and Stockton.
This secondary ammonium sulphate factor was dominated by the presence of ammonium (55–85%) and sulphate (30–60%), except at Stockton where it only accounted for 20% of ammonium. Note that primary nitrate factor accounted for most of the ammonium at Stockton.
Ammonium and sulphate occur in atmospheric particles because of photochemical reactions in the atmosphere. Gaseous sulphur dioxide is emitted to the atmosphere during the combustion of fossil fuels (e.g., in power stations or motor vehicles) and in the presence of sunlight will oxidize to form sulphuric acid. The seasonal cycle displayed by the secondary ammonium sulphate factor of higher contributions during the summer months represents the greater number of daylight hours for photochemical reactions to occur. Sources of ammonia include agriculture (mostly from animal excrement and fertilizer application), industrial processes, vehicular emissions, and volatilization from soils and oceans [
37]. Ammonia plays an important role in neutralizing acids in the atmosphere, hence readily neutralizes the sulphuric acid to produce ammonium sulphate aerosol.
Local and regional sources may contribute to secondary ammonium sulphate concentrations. The contribution of inter-regional transport to airborne particle concentrations within NSW metropolitan areas has been addressed in several studies [
38,
39]. For example, the contribution of sulphur dioxide emissions from coal-fired power stations located in the Upper Hunter, Central Coast, and Lithgow to secondary sulphate concentrations measured in parts of the Sydney basin have been estimated [
40].
Nitrate (Primary or Secondary)
The nitrate factor occurred across all sites in the PM2.5 fraction. At all sites except Stockton, it is a secondary nitrate (sodium nitrate) factor but at Stockton, it is a primary nitrate (ammonium nitrate) factor. The annual contribution of the nitrate (primary and secondary) factor to PM2.5 mass was greatest at Stockton and lowest at Singleton.
The secondary nitrate factor contained most of the nitrate (60%) and included some ammonium, chloride, sodium, sulphate, and OC. At Stockton, however, the primary nitrate factor accounted for 80% of nitrate and 60% of ammonium with negligible contributions from other species.
Generally, nitrate occurs in atmospheric particles because of photochemical reactions in the atmosphere. Nitrogen dioxide produced from the oxidation of nitrogen oxide that is emitted to the atmosphere during combustion of fossil fuels (e.g., in power stations or motor vehicles) is further oxidized to form nitric acid. Nitric acid can be neutralized by gaseous base ammonia or alkaline aerosols such as sea salt. However, at Stockton, a nearby industry contributed primary nitrate emissions to the PM
2.5 mass. The Stockton site is situated about 700 m to the south-east of the Orica Australia Pty. Ltd. ammonium nitrate manufacturing facility on Kooragang Island. Emissions from this facility include particulate matter, ammonia, oxides of nitrogen and nitric acid [
41], with particulate matter emissions from ammonium nitrate production (via a prilling tower) largely comprised of PM
2.5 ammonium nitrate as reported in monitoring results [
42]. Emissions from the prilling tower result from carry-over of fine particles and fume by the prilling cooling air flowing through the tower. Emissions from low-density prilling towers have been documented by the US EPA as comprising predominantly small particles, 56% of which are below 2.5 µm, 73% below 5 µm, and 83% below 10 µm [
43].
There is little evidence of a seasonal pattern in the contribution of the secondary nitrate factor. However, at Stockton, the primary nitrate factor is only present in the second half of autumn and winter (May to August). This corresponds to the time of year when north-westerly winds prevail at Stockton that transport the emissions from Kooragang Island towards the Stockton site. The direction of the source from the monitoring site is clearly indicated by the bivariate pollution rose in
Figure 6. The plot indicates that high ammonium nitrate concentrations at Stockton occurred when the winds were from the northwest when the prilling tower was directly upwind of the Stockton site. The narrowness of the red sector (‘upwind footprint’) is indicative of the direct emission of ammonium nitrate.
4. Discussion
Figure 7 shows the annual average percentage contribution of the source profiles for sea salt, soil, smoke (woodsmoke and other biomass smoke), primary industry (industry, mixed industry/vehicles, mixed industry/shipping, vehicles, light absorbing carbon) and secondary industry (pollutant-aged sea salt, secondary ammonium sulphate, and primary and secondary nitrate) for PM
2.5. Note that for Stockton, the nitrate factor was included in the primary industry group. The sites were plotted as increasing distance from the coast, with Stockton being nearest to the coast (200 m) and Muswellbrook being further from the coast (100 km).
The contribution of the soil factor to PM2.5 mass is reasonably consistent at about 10% across the all sites (<1 µg m−3), while the fresh sea salt decreases with distance from the coast from 23% (2.1 µg m−3) at Stockton to 3% (0.3 µg m−3) at Muswellbrook, and smoke increased with distance from the coast.
Primary industry was greatest at Stockton (due to the influence of ammonium nitrate from the prill plant) at 32% (2.9 µg m−3) and lowest inland at Muswellbrook (8% or 0.6 µg m−3). Except for Muswellbrook and Stockton, primary emissions across the sites accounted for 30% (3 µg m−3) of the industry sources.
The largest contribution to PM2.5 was from secondary sources (32–44% or 2.1–3 µg m−3) at all sites except at Muswellbrook, where woodsmoke and industry sources each contributed about 40% (3.4 µg m−3). Except for Stockton and Muswellbrook, secondary reactions accounted for approximately 70% of the industry source, while at Stockton, with the presence of the prilling tower this split was 50% primary and 50% secondary while at Muswellbrook, the split was 20% primary and 80% secondary. Secondary industry contributions were lowest at Stockton and highest at Mayfield.
Comparison with Previous Studies in the Region
The long-term trend in sources influencing PM
2.5 measured at the Mayfield site between 2008 and 2013 using IBA techniques and PMF analysis have been investigated [
44] and nine source fingerprints identified: soil, secondary sulphate, seaspray, smoke, industrial processes (specifically related to calcium, manganese, and iron), and two different automobile sources. Anthropogenic sources comprised motor vehicles, smoke from biomass burning, and secondary sulphate from industrial processes contributed 70% of ambient PM
2.5 in the Mayfield local area over the 15-year period. Over this 15-year period, there have been major changes in sources with the closure of the major iron and steel works in 1999, phasing out of leaded petrol in 2001, and the closure of a magnesium dioxide production plant in 2008.
It is difficult to directly compare the source fingerprints identified in the 15-year study [
44] with those identified in this study because of the differences in species included in the PMF analysis and the closure of industries discussed above. However, in general there are important similarities in the sources identified in the 15-year analysis and the more recent analysis, with natural sources of sea salt and soil contributing to approximately 20–30% of the PM
2.5 mass in both studies. In line with the phasing out of leaded petrol, the vehicle source identified in the recent study was significantly lower than the 15-year study. The lower woodsmoke contribution in the recent study resulted from the use of the unique tracer for biomass burning that separates out the woodsmoke component of the more generic ‘smoke’ factor identified in the 15-year study. The secondary sulphate source identified in the 15-year study was greater than that identified in the recent study since the addition of nitrate and ammonium concentrations in the recent study allows for the division of secondary sulphate into secondary ammonium nitrate. Despite these differences, both studies identified a contribution of 70–80% of anthropogenic aerosol to PM
2.5 at Mayfield.
5. Conclusions
Across the six sites and two size fractions over the two 12-month sampling periods, 14 factors were found to contribute to particle mass. Of these, three source profiles that were common to all sites, size fractions, and sampling periods included fresh sea salt, industry-aged sea salt, and soil. Four source profiles were common across all sites for PM2.5 including secondary sulphate, secondary and primary nitrate, mixed industry/vehicles, and woodsmoke. One source profile (other biomass smoke) was only identified in PM2.5 at Singleton and Muswellbrook and two source profiles (mixed industry/shipping and vehicles) were only identified in PM2.5 at Newcastle, Beresfield, Mayfield, and Stockton. Three sources (bioaerosol, light absorbing particles, and industry) were only identified in the PM2.5–10 size fraction at Mayfield and Stockton.
Industry was identified to contribute to seven of the factors: pollutant-aged sea salt (all sites and size fractions), mixed industry/vehicle, secondary ammonium sulphate, and secondary nitrate (PM2.5 at all sites), primary nitrate (PM2.5 at Stockton), industry shipping (PM2.5 at Newcastle, Beresfield, Mayfield, and Stockton), industry and light absorbing carbon (all sites with PM2.5–10).
Vehicles/transportation was identified to contribute to three factors: vehicles and mixed industry/shipping (PM2.5 at Newcastle, Beresfield, Mayfield, and Stockton), mixed industry/vehicles (PM2.5 all sites).
Anthropogenic primary emissions contributed to six source profiles (woodsmoke, industry, mixed industry/vehicles, mixed industry/shipping, vehicles, light absorbing carbon). Natural primary emissions contributed to four source profiles (sea salt, soil, bioaerosols, and other biomass smoke).
Secondary formation contributed to three of the source profiles (pollutant-aged sea salt, secondary ammonium sulphate, and primary/secondary nitrate.
Exposure to fine particles over long periods of time is known to have a greater impact on health than shorter term exposures and exposure to coarse particles. These studies identified that up to 40% of the fine particle mass resulted from direct anthropogenic emissions from industry or vehicles. The studies also provided information on the sources that contributed to elevated particle concentrations of fine particles at certain times of the year such as woodsmoke during winter at the inland sites and the prilling tower at Stockton between May and September when offshore winds direct the emissions from the plant to the sampling location. By identifying and quantifying the contribution of the different sources that add to particle loadings in the Hunter Valley of NSW, this study contributes to evidence-based policy and programs that aim to reduce the exposure of communities to particulate matter.
Supplementary Materials
The following are available online at
https://www.mdpi.com/2073-4433/11/1/4/s1, Figure S1: PMF factor fingerprints for PM
2.5 at Beresfield, Figure S2: PMF factor fingerprints for PM
2.5 at Mayfield, Figure S3: PMF factor fingerprints for PM
2.5-10 at Mayfield, Figure S4: PMF factor fingerprints for PM
2.5 at Muswellbrook, Figure S5: PMF factor fingerprints for PM
2.5 at Newcastle, Figure S6: PMF factor fingerprints for PM
2.5 at Singleton, Figure S7: PMF factor fingerprints for PM2.5 at Stockton, Figure S8: PMF factor fingerprints for PM
2.5–10 at Stockton, Table S1: Species included in Positive Matrix Factorisation analysis of PM
2.5 data from Newcastle, Beresfield, Mayfield, and Stockton listing PMF category, and the median concentration and signal-to-noise ratio calculated by Environment Protection Authority Positive Matrix Factorisation at each site, Table S2: Species included in PMF analysis of PM
2.5-10 data for Mayfield and Stockton listing PMF category, and the median concentration and signal-to-noise ratio calculated by EPA PMF at each site, Table S3: Species included in PMF analysis of PM
2.5 data from Singleton and Muswellbrook listing PMF category, and the median concentration and signal-to-noise ratio calculated by EPA PMF at each site.
Author Contributions
Conceptualization, Y.S., M.F.H., D.D.C., and M.K.; Data curation P.W.S., E.S., and A.J.A.; Formal analysis M.F.H., A.J.A., D.D.C., and P.W.S.; Investigation, P.W.S., M.F.H., M.K., D.D.C., E.S., A.J.A., Y.S., and L.T.-C.C.; Writing-original draft preparation, M.K., M.F.H., P.S., M.D., E.S., and A.J.A.; Writing-review and editing, M.K., M.F.H., P.W.S., M.D., A.J.A., and Y.S.; Project administration, Y.S.; Funding acquisition, Y.S. All authors have read and agreed to the published version of the manuscript.
Funding
This research was funded by the NSW Environment Protection Authority (EPA), NSW Office of Environment and Heritage (OEH), NSW Ministry of Health, CSIRO Oceans & Atmosphere (O&A), and Australian Nuclear Science and Technology Organisation (ANSTO).
Acknowledgments
The authors acknowledge contributions from project support teams including Kate Boast at CSIRO, David Garton, Peter Drewer, and Craig Thompson at ANSTO, and the OEH project support and field staff Peter Crabbe, Scott Thompson, Gareth James, Upma Dutt, Stuart Masson, Chris Eiser, Melinda Hale, Matt Flack, and John Kirkwood. We also acknowledge inputs by Matt Riley of OEH, Ben Scalley of the NSW Ministry of Health, and Judy Greenwood and Leanne Graham from the NSW EPA. Access to the Stockton sampling site was enabled by Orica Limited and to the Mayfield site by CSIRO Energy. Nada Derek, Bronwyn Dunse, and Max Desservettaz assisted with the preparation of some of the figures. Descriptive and statistical analyses were carried out using R statistical analysis version 3.5.1 (R Core Team, 2016). The main package used in R statistical analysis is known as “openair” version 2.4 [
45].
Conflicts of Interest
The authors declare no conflicts of interest.
References
- Pope, C.A.; Burnett, R.T.; Thun, M.J.; Calle, E.E.; Krewski, D.; Ito, K.; Thurston, G.D. Lung cancer, cardiopulmonary mortality, and long-term exposure to fine particulate air pollution. J. Am. Med. Assoc. 2002, 287, 1132–1141. [Google Scholar] [CrossRef] [PubMed] [Green Version]
- Burnett, R.; Chen, H.; Szyszkowicz, M.; Fann, N.; Hubbell, B.; Pope, C.A., III; Aptr, J.S.; Brauer, M.; Cohen, A.; Weichenthal, S.; et al. Global estimates of mortality associated with long-term exposure to outdoor fine particulate matter. Proc. Natl. Acad. Sci. USA 2018, 115, 9592–9597. [Google Scholar] [CrossRef] [PubMed] [Green Version]
- WHO. Review of Evidence on Health Aspects of Air Pollution—Revihaap Project; WHO European Centre for Environmental and Health: Bonn, Germany, 2013; Available online: http://www.euro.who.int/en/health-topics/environment-and-health/air-quality/publications/2013/review-of-evidence-on-health-aspects-of-air-pollution-revihaap-project-final-technical-report (accessed on 1 October 2019).
- Hanigan, I.C.; Rolfe, M.I.; Knibbs, L.D.; Salimi, F.; Cowie, C.T.; Heyworth, J.; Marks, G.B.; Guo, Y.M.; Cope, M.; Bauman, A.; et al. All-cause mortality and long-term exposure to low level air pollution in the ‘45 and up study’ cohort, Sydney, Australia, 2006–2015. Environ. Int. 2019, 126, 762–770. [Google Scholar] [CrossRef] [PubMed]
- Hibberd, M.F.; Selleck, P.; Keywood, M.D.; Cohen, D.; Stelcer, E.; Atanacio, A. Upper Hunter Valley Particle Characterization Study; Report to NSW OEH; CSIRO Marine & Atmospheric Research: Canberra, Australia, 2013; 40p. Available online: https://www.environment.nsw.gov.au/research-and-publications/publications-search/upper-hunter-valley-particle-characterization-study-final-report (accessed on 9 December 2019).
- Hibberd, M.F.; Keywood, M.; Selleck, P.; Cohen, D.; Stelcer, E.; Scorgie, Y.; Chang, L. Lower Hunter Particle Characterisation Study; Report prepared by CSIRO, ANSTO and the NSW Office of Environment and Heritage for the NSW Environment Protection Authority; Sydney, Australia, 2016. Available online: https://www.environment.nsw.gov.au/topics/air/research/previous-research/lower-hunter-particle-characterisation-study (accessed on 9 December 2019).
- ABS. 3218.0 Regional Population Growth; Australian Bureau of Statistics: David Kalisch, Australia, 2015.
- Cohen, D.D. Applications of simultaneous Iba techniques to aerosol analysis. Nucl. Instrum. Methods Phys. Res. Sect. B-Beam Interact. Mater. At. 1993, 79, 385–388. [Google Scholar] [CrossRef]
- Cohen, D.D. Characterisation of atmospheric fine particles using IBA techniques. Nucl. Instrum. Methods Phys. Res. Sect. B-Beam Interact. Mater. At. 1998, 136, 14–22. [Google Scholar] [CrossRef]
- Cohen, D.D.; Bailey, G.M.; Kondepudi, R. Elemental analysis by PIXE and other IBA techniques and their application to source fingerprinting of atmospheric fine particle pollution. Nucl. Instrum. Methods Phys. Res. Sect. B-Beam Interact. Mater. At. 1996, 109, 218–226. [Google Scholar] [CrossRef]
- Keywood, M.; Selleck, P.; Reisen, F.; Cohen, D.; Chambers, S.; Cheng, M.; Cope, M.; Crumeyrolle, S.; Dunne, E.; Emmerson, K.; et al. Comprehensive aerosol and gas data set from the Sydney Particle Study. Earth Syst. Sci. Data Discuss. 2019, 2019, 1–34. [Google Scholar]
- Chow, J.C.; Watson, J.G.; Chen, L.W.A.; Chang, M.C.O.; Robinson, N.F.; Trimble, D.; Kohl, S. The IMPROVE-A temperature protocol for thermal/optical carbon analysis: Maintaining consistency with a long-term database. J. Air Waste Manag. Assoc. 2007, 57, 1014–1023. [Google Scholar] [CrossRef] [Green Version]
- Taha, G.; Box, G.P.; Cohen, D.A.; Stelcer, E. Black carbon measurement using laser integrating plate method. Aerosol Sci. Technol. 2007, 41, 266–276. [Google Scholar] [CrossRef] [Green Version]
- Chan, Y.C.; Cohen, D.D.; Hawas, O.; Stelcer, E.; Simpson, R.; Denison, L.; Wong, N.; Hodge, M.; Comino, E.; Carswell, S. Apportionment of sources of fine and coarse particles in four major Australian cities by positive matrix factorisation. Atmos. Environ. 2008, 42, 374–389. [Google Scholar] [CrossRef] [Green Version]
- Ho, W.Y.; Tseng, K.H.; Liou, M.L.; Chan, C.C.; Wang, C.H. Application of Positive Matrix Factorization in the Identification of the Sources of PM2.5 in Taipei City. Int. J. Environ. Res. Public Health 2018, 15, 1305. [Google Scholar] [CrossRef] [PubMed] [Green Version]
- Norris, G.; Duvall, R.; Brown, S.; Bai, S. EPA Positive Matrix Factorization (PMF) 3.0—Fundamentals and User Guide; US EAP/600/R-08/108; EPA: Washington, DC, USA, 2008. Available online: https://www.epa.gov/air-research/positive-matrix-factorization-model-environmental-data-analyses (accessed on 15 June 2017).
- Norris, G.; Duvall, R. EPA Positive Matrix Factorization (PMF) 5.0 Fundamentals and User Guide; EPA: Washington, DC, USA, 2014. Available online: https://www.epa.gov/sites/production/files/2015-02/documents/pmf_5.0_user_guide.pdf (accessed on 9 December 2019).
- Millero, F.J.; Feistel, R.; Wright, D.G.; McDougall, T.J. The composition of Standard Seawater and the definition of the Reference-Composition Salinity Scale. Deep-Sea Res. 2008, 55, 50–72. [Google Scholar] [CrossRef]
- Warneck, P. In-cloud chemistry opens pathway to the formation of oxalic acid in the marine atmosphere. Atmos. Environ. 2003, 37, 2423–2427. [Google Scholar] [CrossRef]
- Carlton, A.G.; Turpin, B.J.; Altieri, K.E.; Seitzinger, S.; Reff, A.; Lim, H.J.; Ervens, B. Atmospheric oxalic acid and SOA production from glyoxal: Results of aqueous photooxidation experiments. Atmos. Environ. 2007, 41, 7588–7602. [Google Scholar] [CrossRef]
- Lide, D.R. (Ed.) CRC Handbook of Chemistry and Physics, 78th ed.; CRC Press: Boca Raton, FL, USA, 1997. [Google Scholar]
- Radhi, M.; Box, M.A.; Box, G.P.; Mitchell, R.M.; Cohen, D.D.; Stelcer, E.; Keywood, M.D. Size-resolved mass and chemical properties of dust aerosols from Australia’s Lake Eyre Basin. Atmos. Environ. 2010, 44, 3519–3528. [Google Scholar] [CrossRef]
- Bauer, H.; Claeys, M.; Vermeylen, R.; Schueller, E.; Weinke, G.; Berger, A.; Puxbaum, H. Arabitol and mannitol as tracers for the quantification of airborne fungal spores. Atmos. Environ. 2008, 42, 588–593. [Google Scholar] [CrossRef]
- Despres, V.R.; Huffman, J.A.; Burrows, S.M.; Hoose, C.; Safatov, A.S.; Buryak, G.; Frohlich-Nowoisky, J.; Elbert, W.; Andreae, M.O.; Poschl, U.; et al. Primary biological aerosol particles in the atmosphere: A review. Tellus B Chem. Phys. Meteorol. 2012, 64. [Google Scholar] [CrossRef] [Green Version]
- Iinuma, Y.; Bruggemann, E.; Gnauk, T.; Muller, K.; Andreae, M.O.; Helas, G.; Parmar, R.; Herrmann, H. Source characterization of biomass burning particles: The combustion of selected European conifers, African hardwood, savanna grass, and German and Indonesian peat. J. Geophys. Res. -Atmos. 2007, 112. [Google Scholar] [CrossRef]
- Stein, A.F.; Draxler, R.R.; Rolph, G.D.; Stunder, B.J.B.; Cohen, M.D.; Ngan, F. Noaa‘S hysplit atmospheric transport and dispersion modeling system. Bull. Am. Meteorol. Soc. 2015, 96, 2059–2077. [Google Scholar] [CrossRef]
- Hibberd, M.F.; Hartmann, S.; O’Brien, G.; Warren, K. Lower Hunter Particle Characterisation Study Supplementary Report – Quantifying the Coal Particle Component of Airborne Particulate Matter at Stockton; Report for NSW Office of Environment & Heritage; CSIRO Oceans & Atmosphere: Aspendale, Australia, 2016. Available online: https://www.environment.nsw.gov.au/topics/air/research/previous-research/coal-particle-study-at-stockton (accessed on 9 December 2019).
- Environ. Pollution Reduction Program (PRP) 4—Particulate Emissions from Coal Trains; Prepared by Environ Australia Pty Ltd for Australian Rail Track Corporation; Environ Australia Pty Ltd.: Perth, Australia, 2012. [Google Scholar]
- EPA. Air Emissions Inventory for the Greater Metropolitan Region in New South Wales: 2008 Calendar Year; NSW Environment Protection Authority: Sydney, Australia, 2012. Available online: www.epa.nsw.gov.au/air/airinventory2008.htm (accessed on 7 October 2019).
- Visser, S.; Slowik, J.G.; Furger, M.; Zotter, P.; Bukowiecki, N.; Canonaco, F.; Flechsig, U.; Appel, K.; Green, D.C.; Tremper, A.H.; et al. Advanced source apportionment of size-resolved trace elements at multiple sites in London during winter. Atmos. Chem. Phys. 2015, 15, 11291–11309. [Google Scholar] [CrossRef] [Green Version]
- NICNAS. Methylcyclopentadienyl Manganese Tricarbonyl (MMT): Priority Existing Chemical Assessment; Report No. 24; Commonwealth of Australia: Canberra, Australia. Available online: https://www.nicnas.gov.au/__data/assets/word_doc/0008/34829/PEC24-MMT.docx (accessed on 7 October 2019).
- Joly, A.; Lambert, J.; Gagnon, C.; Kennedy, G.; Mergler, D.; Adam-Poupart, A.; Zayed, J. Reduced Atmospheric Manganese in Montreal Following Removal of Methylcyclopentadienyl Manganese Tricarbonyl (MMT). Water Air Soil Pollut. 2011, 219, 263–270. [Google Scholar] [CrossRef]
- Cohen, D.D.; Gulson, B.L.; Davis, J.M.; Stelcer, E.; Garton, D.; Hawas, O.; Taylor, A. Fine-particle Mn and other metals linked to the introduction of MMT into gasoline in Sydney, Australia: Results of a natural experiment. Atmos. Environ. 2005, 39, 6885–6896. [Google Scholar] [CrossRef]
- NPI. National Pollutant Inventory. 2014. Available online: www.npi.gov.au (accessed on 9 December 2019).
- Viana, M.; Amato, F.; Alastuey, A.; Querol, X.; Moreno, T.; Dos Santos, S.G.; Herce, M.D.; Fernandez-Patier, R. Chemical Tracers of Particulate Emissions from Commercial Shipping. Environ. Sci. Technol. 2009, 43, 7472–7477. [Google Scholar] [CrossRef] [PubMed]
- Viana, M.; Hammingh, P.; Colette, A.; Querol, X.; Degraeuwe, B.; de Vlieger, I.; van Aardenne, J. Impact of maritime transport emissions on coastal air quality in Europe. Atmos. Environ. 2014, 90, 96–105. [Google Scholar] [CrossRef]
- Behera, S.N.; Sharma, M.; Aneja, V.P.; Balasubramanian, R. Ammonia in the atmosphere: A review on emission sources, atmospheric chemistry and deposition on terrestrial bodies. Environ. Sci. Pollut. Res. 2013, 20, 8092–8131. [Google Scholar] [CrossRef] [PubMed]
- Nelson, P.F.; Azzi, M.; Cope, M.; Lilley, W.; Carras, J.N.; Hurley, P.J.; Hyde, R. Interregional Transport of Air Pollutants Study (IRTAPS); CSIRO Energy Technology: North Ryde, NSW, Australia, 2002. [Google Scholar]
- Cope, M.; Keywood, M.D.; Emmerson, K.; Galbally, I.E.; Boast, K.; Chambers, S.; Cheng, M.; Crumeyrolle, S.; Dunne, E.; Fedele, R.; et al. Sydney Particle Study—Stage II; Report to the Office of Environment and Heritage NSW; CSIRO Marine and Atmospheric Research: Aspendale, Australia, 2014; 152p. Available online: https://www.environment.nsw.gov.au/topics/air/research/previous-research/sydney-particle-study (accessed on 9 December 2019).
- Cohen, D.D.; Crawford, J.; Stelcer, E.; Atanacio, A.J. Application of positive matrix factorization, multi-linear engine and back trajectory techniques to the quantification of coal-fired power station pollution in metropolitan Sydney. Atmos. Environ. 2012, 61, 204–211. [Google Scholar] [CrossRef]
- AECOM. Proposed Ammonium Nitrate Facility Expansion, Environmental Assessment, Proposed Ammonium Nitrate Facility Expansion, Greenleaf Road, Kooragang Island; Main Report, Report prepared by AECOM for Orica Australia Pty Ltd.; AECOM: Gordon, NSW, Australia, 2009; Volume 1. [Google Scholar]
- Orica Australia Pty Ltd. Orica Kooragang Island Annual Environmental Management Report; Orica Australia Pty Ltd.: Melbourne, Australia, 2014; Available online: www.orica.com/ArticleDocuments/493/Annual%20Environmental%20Management%20Report_December%202014_Final.pdf.aspx (accessed on 9 December 2019).
- US EPA. AP 42, Compilation of Air Pollutant Emission Factors, 5th ed.; Stationary Point and Area Sources, Chapter 8 Inorganic Chemical Industry, Section 8.3 Ammonium Nitrate, Research Triangle Park; United States Environmental Protection Agency: Washington, DC, USA, 1995; Volume 1. Available online: https://www.epa.gov/air-emissions-factors-and-quantification/ap-42-compilation-air-emissions-factors (accessed on 9 December 2019).
- Stelcer, E.; Cohen, D.D.; Atanacio, A.J. Long term PM2.5 trends in the Australian industrial city of Newcastle: A 15-year study from 1998 to 2013. Environ. Chem. 2014, 11, 644–652. [Google Scholar] [CrossRef]
- Carslaw, D.C.; Ropkins, K. Openair—An R package for air quality data analysis. Environ. Model. Softw. 2012, 27–28, 52–61. [Google Scholar] [CrossRef]
Figure 1.
Map showing the study location and sampling locations in the Hunter Valley and wind directions in June, July, August (top windrose) and December, January, February (bottom windrose). Large open-cut coal mining areas are visible in the vicinity of Muswellbrook and Singleton.
Figure 1.
Map showing the study location and sampling locations in the Hunter Valley and wind directions in June, July, August (top windrose) and December, January, February (bottom windrose). Large open-cut coal mining areas are visible in the vicinity of Muswellbrook and Singleton.
Figure 2.
PM2.5 (top) and PM2.5-10 (bottom) gravimetric mass time series.
Figure 2.
PM2.5 (top) and PM2.5-10 (bottom) gravimetric mass time series.
Figure 3.
Relationship between levoglucosan (tracer of woodsmoke) and OC1 (the most volatile organic carbon fraction measured using the IMPROVE-A method) for each site.
Figure 3.
Relationship between levoglucosan (tracer of woodsmoke) and OC1 (the most volatile organic carbon fraction measured using the IMPROVE-A method) for each site.
Figure 4.
Monthly averaged PM2.5 concentrations attributed to the woodsmoke (WS) and the biomass smoke (BS) factors.
Figure 4.
Monthly averaged PM2.5 concentrations attributed to the woodsmoke (WS) and the biomass smoke (BS) factors.
Figure 5.
Occurrence of wildfires and hazard reduction burns in the Hunter region during 2012 (data from the Rural Fire Service). The vertical axis shows the area burnt, which is representative of the amount of smoke generated. The inset shows the location of the fires in 2012.
Figure 5.
Occurrence of wildfires and hazard reduction burns in the Hunter region during 2012 (data from the Rural Fire Service). The vertical axis shows the area burnt, which is representative of the amount of smoke generated. The inset shows the location of the fires in 2012.
Figure 6.
Pollution increase at Stockton of primary nitrate (factor contributions (colour scale units µg m−3) versus wind direction and speed (m s−1).
Figure 6.
Pollution increase at Stockton of primary nitrate (factor contributions (colour scale units µg m−3) versus wind direction and speed (m s−1).
Figure 7.
Annual average percent contribution shows the annual average percentage contribution of the source profiles for sea salt, soil, smoke (woodsmoke and other biomass smoke), primary industry (industry, mixed industry/vehicles, mixed industry/shipping, vehicles, primary nitrate), and secondary industry (pollutant-aged sea salt, secondary ammonium sulphate, and secondary nitrate) for PM2.5 on the left axis and annual average PM2.5 concentration (solid line) on the right axis. The sites were plotted in order of increasing distance from the coast with Stockton closest to the coast (0.2 km) and Muswellbrook furthest from the coast (100 km).
Table 1.
Sampling location, instrumentation, size fractions, filter types and parameters analysed on the different filter types. (OEH – Office of Environment & Heritage; AQM—Air Quality Monitoring; OC—organic carbon; EC—elemental carbon; BC—black carbon).
Table 1.
Sampling location, instrumentation, size fractions, filter types and parameters analysed on the different filter types. (OEH – Office of Environment & Heritage; AQM—Air Quality Monitoring; OC—organic carbon; EC—elemental carbon; BC—black carbon).
| Sampling Site and Time | Equipment, Size Fraction and Filter Type | Analysis |
|---|
OEH Singleton AQM Station
1 January to 31 December 2012 | One Ecotech HiVol 3000 high volume sampler with a PM2.5 size selective inlet with quartz tissue filters
One ANSTO ASP (Aerosol Sampling Program) PM2.5 particulate Cyclone samplers with 25 mm stretched Teflon filters | OC & EC (quartz)
Gravimetric mass, elements, BC & soluble ions (Teflon) |
OEH Muswellbrook AQM Station
1 January to 31 December 2012 | One Ecotech HiVol 3000 high volume sampler with a PM2.5 size selective inlet with quartz tissue filters
One ANSTO ASP PM2.5 particulate cyclone sampler with 25 mm stretched Teflon filters | OC & EC (quartz)
Gravimetric mass, elements, BC & soluble ions |
OEH Newcastle AQM Station
1 March 2014 to 28 February 2015 | Two ANSTO ASP PM2.5 cyclone samplers—one collecting on a Teflon filter and one on a quartz filter
| OC & EC (quartz)
Gravimetric mass, elements, BC & soluble ion (Teflon) |
OEH Beresfield AQM Station
1 March 2014 to 28 February 2015 | Two ANSTO ASP PM2.5 cyclone samplers—one collecting on a Teflon filter and one on a quartz filter
| OC & EC (quartz)
Gravimetric mass, elements, BC & soluble ion (Teflon) |
OEH Mayfield AQM Station
1 March 2014 to 28 February 2015 | One GENT stacked filter unit (SFU) sampling ‘coarse’ (PM2.5-10) particles on a Nuclepore filter and ‘fine’ (PM2.5) particles on a quartz filter
One ANSTO ASP PM2.5 cyclone sampler collecting fine particles on a Teflon filter | Gravimetric mass, elements, BC & soluble ion (Nuclepore)
OC&EC (quartz)
Gravimetric mass, elements, BC & soluble ion (Teflon) |
OEH Stockton AQM Station
1 March 2014 to 28 February 2015 | One GENT SFU sampling ‘coarse’ (PM2.5-10) particles on a Nuclepore filter and ‘fine’ (PM2.5) particles on a quartz filter
One ANSTO ASP PM2.5 cyclone sampler collecting fine particles on a Teflon filter | Gravimetric mass, elements, BC & soluble ion (Nuclepore)
OC&EC (quartz)
Gravimetric mass, elements, BC & soluble ion (Teflon) |
Table 2.
Number of samples, average, minimum, and maximum daily gravimetric mass concentrations for PM
2.5 and PM
2.5–10 measured at each sampling site (see
Table 1 for sampling periods). Bold values highlight the highest values.
Table 2.
Number of samples, average, minimum, and maximum daily gravimetric mass concentrations for PM
2.5 and PM
2.5–10 measured at each sampling site (see
Table 1 for sampling periods). Bold values highlight the highest values.
| Location. | Number of Samples | Size Fraction | Average µg m−3 | Min µg m−3 | Max µg m−3 |
|---|
| Singleton | 123 | PM2.5 | 6.50 | 2.05 | 19.64 |
| Muswellbrook | 123 | PM2.5 | 8.11 | 2.69 | 19.25 |
| Beresfield | 128 | PM2.5 | 6.37 | 1.78 | 16.32 |
| Newcastle | 128 | PM2.5 | 6.68 | 1.51 | 22.06 |
| Mayfield | 122 | PM2.5 | 6.85 | 2.11 | 19.97 |
| Mayfield | 122 | PM2.5–10 | 10.72 | 0.85 | 43.02 |
| Stockton | 133 | PM2.5 | 9.15 | 2.31 | 24.30 |
| Stockton | 123 | PM2.5–10 | 26.46 | 2.32 | 84.93 |
Table 3.
Concentrations of measured species in the PM2.5 samples from both studies. Values listed (in ng m-3) of average (cavg), standard deviation (σ), and maximum (cmax) at each site.
Table 3.
Concentrations of measured species in the PM2.5 samples from both studies. Values listed (in ng m-3) of average (cavg), standard deviation (σ), and maximum (cmax) at each site.
| Species (ng m−3) | Muswellbrook PM2.5 | Singleton PM2.5 | Newcastle PM2.5 | Beresfield PM2.5 | Mayfield PM2.5 | Stockton PM2.5 |
|---|
| | cavg ± σ | cmax | cavg ± σ | cmax | cavg ± σ | cmax | cavg ± σ | cmax | cavg ± σ | cmax | cavg ± σ | cmax |
|---|
| Sulphate | 957 ± 707 | 3894 | 907 ± 711 | 4453 | 966 ± 660 | 3924 | 871 ± 646 | 3516 | 953 ± 647 | 3696 | 1197 ± 613 | 3599 |
| Organic carbon | 3794 ± 2182 | 9404 | 2713 ± 1745 | 10,510 | 642 ± 631 | 2815 | 864 ± 688 | 3226 | 1338 ± 1054 | 4878 | 1219 ± 1003 | 6190 |
| Sodium | 205 ± 181 | 1012 | 212 ± 163 | 810 | 717 ± 514 | 2346 | 448 ± 380 | 2079 | 614 ± 476 | 2263 | 862 ± 586 | 2383 |
| Chloride | 169 ± 163 | 1010 | 145 ± 142 | 685 | 730 ± 717 | 3882 | 374 ± 481 | 2442 | 584 ± 643 | 3060 | 1003 ± 883 | 3821 |
| Elemental carbon | 1559 ± 818 | 3881 | 1428 ± 1037 | 5660 | 320 ± 328 | 1586 | 414 ± 337 | 1548 | 615 ± 535 | 2268 | 518 ± 466 | 2250 |
| Nitrate | 272 ± 180 | 1206 | 223 ± 133 | 850 | 271 ± 154 | 758 | 230 ± 149 | 856 | 274 ± 178 | 954 | 1393 ± 2166 | 11,777 |
| Ammonium | 318 ± 231 | 1354 | 268 ± 236 | 1462 | 143 ± 114 | 669 | 164 ± 141 | 793 | 151 ± 117 | 681 | 545 ± 753 | 3742 |
| Silicon | 124 ± 62 | 304 | 169 ± 152 | 980 | 66 ± 83 | 666 | 107 ± 98 | 519 | 99 ± 89 | 580 | 85 ± 98 | 605 |
| Magnesium | 34 ± 26 | 125 | 34 ± 28 | 146 | 79 ± 57 | 265 | 50 ± 42 | 234 | 70 ± 54 | 253 | 96 ± 65 | 268 |
| Iron | 58 ± 41 | 212 | 66 ± 52 | 356 | 55 ± 66 | 352 | 100 ± 72 | 442 | 100 ± 86 | 511 | 66 ± 77 | 421 |
| Potassium | 49 ± 32 | 203 | 41 ± 31 | 167 | 51 ± 30 | 163 | 44 ± 30 | 184 | 47 ± 26 | 131 | 60 ± 28 | 169 |
| Calcium | 74 ± 45 | 281 | 69 ± 54 | 387 | 40 ± 25 | 155 | 35 ± 24 | 142 | 46 ± 27 | 132 | 49 ± 24 | 118 |
| Levoglucosan | 682 ± 974 | 3333 | 247 ± 380 | 1691 | 130 ± 250 | 1424 | 181 ± 304 | 1279 | 81 ± 129 | 681 | 63 ± 108 | 795 |
| Methanesulphonic acid | 24 ± 19 | 92 | 28 ± 23 | 110 | 26 ± 26 | 151 | 23 ± 21 | 118 | 25 ± 23 | 145 | 25 ± 24 | 150 |
| Aluminium | 36 ± 20 | 89 | 52 ± 51 | 322 | 18 ± 25 | 157 | 30 ± 32 | 155 | 30 ± 30 | 186 | 32 ± 45 | 200 |
| Zinc | 4 ± 5 | 43 | 4 ± 2 | 14 | 8.9 ± 13 | 77 | 7.2 ± 6.4 | 25 | 18 ± 30 | 151 | 12 ± 24 | 226 |
| Phosphate | 17 ± 12 | 62 | 11 ± 6 | 30 | 4.7 ± 5.3 | 47 | 4.6 ± 3.6 | 25 | 5.9 ± 5.3 | 46 | 5.2 ± 4.9 | 44 |
| Lead | 2.2 ± 2.6 | 20.1 | 1.9 ± 1.8 | 9.5 | 4.7 ± 6.8 | 32 | 3.9 ± 4.7 | 28 | 4.3 ± 4.7 | 23 | 3.8 ± 4.5 | 21 |
| Vanadium | 0.2 ± 0.2 | 0.9 | 0.3 ± 0.3 | 1.4 | 4.0 ± 4.4 | 21 | 0.9 ± 0.9 | 6.8 | 3.4 ± 3.8 | 20 | 8.7 ± 9.3 | 46 |
| Bromide | 2.6 ± 2.0 | 20.1 | 2.2 ± 1.2 | 8.8 | 2.0 ± 1.3 | 6.4 | 1.4 ± 1.3 | 10 | 1.7 ± 1.4 | 9 | 5.0 ± 4.6 | 29 |
| Titanium | 3.1 ± 1.7 | 8.7 | 4.1 ± 3.6 | 22.0 | 2.3 ± 2.4 | 16 | 2.9 ± 2.7 | 15 | 3.0 ± 2.4 | 15 | 2.1 ± 2.3 | 13 |
| Manganese | 1.4 ± 1.1 | 8.1 | 1.3 ± 1.1 | 7.0 | 1.8 ± 2.3 | 12 | 2.3 ± 2.2 | 14 | 4.0 ± 5.9 | 38 | 1.9 ± 2.4 | 20 |
| Copper | 0.9 ± 0.9 | 7.5 | 0.9 ± 0.7 | 3.8 | 1.9 ± 2 | 8.4 | 1.2 ± 1.0 | 5.8 | 2.5 ± 1.9 | 11 | 1.2 ± 1.3 | 8.6 |
| Nickel | 0.4 ± 0.8 | 4.5 | 0.4 ± 0.6 | 2.9 | 1.5 ± 1.4 | 6.9 | 0.54 ± 0.6 | 3 | 1.2 ± 1.1 | 5.3 | 2.8 ± 2.7 | 12 |
| Mannosan | 19 ± 27 | 99 | 7 ± 10 | 58 | 4.6 ± 9.6 | 63 | 5.9 ± 10 | 44 | 3.0 ± 5.1 | 34 | 2.5 ± 4.8 | 41 |
| Chromium | 0.2 ± 0.1 | 0.6 | 0.2 ± 0.2 | 0.9 | 0.36 ± 0.4 | 1.9 | 0.88 ± 1.6 | 12 | 0.59 ± 0.6 | 3 | 0.40 ± 0.4 | 2 |
Table 4.
Concentrations of measured species in the PM2.5–10 samples. Values listed (in ng m−3) of average (cavg), standard deviation (σ), and maximum (cmax) at each site.
Table 4.
Concentrations of measured species in the PM2.5–10 samples. Values listed (in ng m−3) of average (cavg), standard deviation (σ), and maximum (cmax) at each site.
| Species (ng m−3) | Stockton PM2.5–10 | Mayfield PM2.5–10 |
|---|
| cavg ± σ | cmax | cavg ± σ | cmax |
|---|
| Chloride | 6945 ± 4985 | 20,406 | 1943 ± 1565 | 8074 |
| Sodium | 4200 ± 2795 | 11,782 | 1246 ± 952 | 4769 |
| Black carbon | 2278 ± 1388 | 6532 | 1101 ± 916 | 4892 |
| Sulphate | 1197 ± 771 | 3299 | 382 ± 281 | 1463 |
| Nitrate | 543 ± 390 | 1856 | 269 ± 277 | 1369 |
| Silicon | 404 ± 398 | 2252 | 320 ± 265 | 1631 |
| Magnesium | 481 ± 339 | 1382 | 137 ± 110 | 550 |
| Calcium | 228 ± 139 | 653 | 110 ± 92 | 489 |
| Iron | 125 ± 121 | 550 | 134 ± 108 | 724 |
| Aluminium | 119 ± 150 | 897 | 103 ± 82 | 543 |
| Potassium | 148 ± 102 | 420 | 43 ± 31 | 159 |
| Oxalate | 29 ± 29 | 261 | 18 ± 16 | 101 |
| Phosphate | 13 ± 15 | 128 | 7.5 ± 8.6 | 52 |
| Mannitol | 10 ± 11 | 71 | 12 ± 17 | 94 |
| Fluoride | 18 ± 29 | 132 | 7.2 ± 9.5 | 57 |
| Bromine | 14 ± 10 | 46 | 3 ± 2.3 | 9 |
| Titanium | 6.7 ± 8.6 | 44 | 5.8 ± 6.4 | 36 |
| Zinc | 6.1 ± 6.5 | 34 | 6.6 ± 7.1 | 39 |
| Arabitol | 5.7 ± 6.5 | 37 | 6.7 ± 8.8 | 50 |
| Manganese | 4.6 ± 4.5 | 34 | 6 ± 6.8 | 46 |
| Copper | 3.4 ± 2.4 | 14 | 4.2 ± 2.5 | 13 |
| Chromium | 2.0 ± 1.7 | 10 | 2.3 ± 1.7 | 10 |
| Ammonium | 3.0 ± 3.9 | 24 | 2.3 ± 2.3 | 14 |
| Lead | 1.13 ± 1.2 | 9.0 | 0.92 ± 0.7 | 3.2 |
| Nickel | 0.83 ± 0.6 | 3.2 | 0.59 ± 0.4 | 1.8 |
| Cobalt | 0.54 ± 0.4 | 2.7 | 0.57 ± 0.5 | 3.7 |
| Vanadium | 1.50 ± 1.5 | 6.3 | 0.39 ± 0.4 | 1.4 |
Table 5.
Summary of the PMF factors (from the EPA PMF 3.0 and 5.0 analyses), main species, contributions of these factors at each site and potential sources.
Table 5.
Summary of the PMF factors (from the EPA PMF 3.0 and 5.0 analyses), main species, contributions of these factors at each site and potential sources.
| Factor | Main Species (Drivers Bold) | Contribution of the Factor to Total Annual Particulate Mass | Potential Sources |
|---|
| PM2.5 | PM2.5–10 |
|---|
| Singleton | Muswellbrook | Newcastle | Beresfield | Mayfield | Stockton | Mayfield | Stockton |
|---|
| Fresh sea salt | Cl−:Na+:SO42−:Mg2+ | 8%
(7–9%) | 3%
(2–4%) | 24%
(20–27%) | 13%
(12–16%) | 20%
(18–22%) | 23%
(19–25%) | 40%
(33–45%) | 63%
(50–66%) | Primary particles. Fresh sea salt aerosol from wave-breaking. Contribution decreases with increasing distance from the coast. |
| Pollutant-aged sea salt | Na+:Mg2+, non-sea-salt SO4, OC, EC, almost no Cl− | 18%
(16–18%) | 13%
(12–14%) | 23%
(9–38%) | 23%
(15–34%) | 25%
(15–40%) | 22%
(13–28%) | 16%
(7–17%) | 6%
(4–11%) | Sea salt reacted with industrial, commercial, road & non-road transport emission from local & regional sources, esp. SO2 |
| Soil | Si:Al:Ti, Fe, Ca2+, OC, EC | 12%
(11–13%) | 11%
(9–15%) | 8%
(2–14%) | 10%
(9–14%) | 11%
(5–16%) | 8%
(5–10%) | 14%
(10–27%) | 11%
(6–14%) | Primary particles. Soil dust. Potential industrial contributions of organic & black carbon at Mayfield & Stockton. Possibly coal particles and/or soot contribute. |
| Bioaerosols | Arabitol, mannitol, Cl−, SO42−, Fe, Mg2+ | | | | | | | 6%
(5–15%) | 5%
(2–9%) | Bioaerosol such as fungal spores and pollens combined with industrial emissions and sea salt |
| Wood smoke | Levoglucosan, mannosan, OC, EC, NO3−, SO42−, Cl− K+ | 14%
(13–15%) | 30%
(27–34%) | 10%
(6–18%) | 15%
(8–24%) | 11%
(7–15%) | 6%
(5–9%) | | | Primary aerosol. Domestic wood heaters at Singleton and Muswellbrook. Domestic wood heaters, bushfires, and hazard reduction burns at Lower Hunter sites |
| Biomass Smoke | OC2, OC3, OC4, K, SO42−, Al, Si, Ti, BC | 8%
(7–10%) | 12%
(9–15%) | | | | | | | Wildfires, hazard reduction burns |
| Industry | F-, Fe, SO42−, Si, Cl−, Al, | | | | | | | 12%
(3–19%) | 5%
(3–10%) | Industry |
| Vehicle | EC, OC, Fe, Cu, Mn, Cr, Pb, NO3−, SO42−, | | | 10%
(3–15%) | 11%
(6–13%) | 9%
(5–15%) | 5%
(4–7%) | | | Primary (EC, metals, OC) & secondary (NO3−, OC) particles. Vehicles, non-diesel road equipment |
| Light Absorbing Carbon | Cl−:Na+, BC, SO42−, Mg2+ | | | | | | | 10%
(8–26%) | 10%
(7–19%) | Light-absorbing carbon (LAC) with some sea salt. Coal particles are conjectured to contribute to this factor. |
| Mixed industry/ vehicle (a) | Zn, Mn, Fe, Cu, Cr, SO42−, NH4+, NO3 | 17%
(16–18% | 8
(6–7%) | 3%
(2–9%) | 9%
(3–13%) | 1%
(1-3%) | 5%
(4–10%) | | | Primary (metals) & secondary particles. Industry, vehicles, non-diesel road equipment |
| Mixed shipping/ industry | V:Ni, SO42−, NH4−, EC OC, NO3− | | | 2%
(1–6%) | 3%
(3–10%) | 4%
(3–7%) | 3%
(2–9%) | | | Secondary & primary (V, Ni) particles. Shipping, sulphate, ammonium |
| Secondary ammonium sulphate | NH4+:nssSO42−, OC, EC | 20%
(18–22%) | 17%
(16–19%) | 12%
(6–16%) | 10%
(9–17%) | 8%
(7–16%) | 9%
(7–13%) | | | Secondary aerosol–ammonium sulphate. Local & regional sources of SO2 (e.g., fossil fuel burning) and ammonia (agriculture, industry, vehicles, non-road diesel equipment, soils, ocean) |
| Primary or secondary nitrate | NO3−, Na+, SO42−, Cl-, OC
NH4, NO3 at Stockton | 3%
(2–4%) | 6%
(5–7%) | 8%
(5–14%) | 6%
(4–13%) | 11%
(7–16%) | 19%
(17–22%) | | | Secondary sodium nitrate at Mayfield, Newcastle, and Beresfield. Primary ammonium nitrate at Stockton-industry. NOx from vehicles, non-road diesel equipment, industry. |
Table 6.
Comparison of the constituents of the fresh sea salt factor and the pollutant-aged sea salt factor with standard sea water [
18]. Mg is magnesium, Na is sodium, Cl is chloride, and SO
4 is sulphate.
Table 6.
Comparison of the constituents of the fresh sea salt factor and the pollutant-aged sea salt factor with standard sea water [
18]. Mg is magnesium, Na is sodium, Cl is chloride, and SO
4 is sulphate.
| Ratios | Mg/Na | Cl/Na | SO4/Na | Distance from the Coast (km) |
|---|
| Standard sea water | 0.12 | 1.8 | 0.252 | |
| Fresh Sea Salt Factor PM2.5 |
| Muswellbrook | 0.12 | 1.34 | 0.3 | 100 |
| Singleton | 0.115 | 1.13 | 0.47 | 70 |
| Beresfield | 0.108 | 1.6 | 0.28 | 16 |
| Newcastle | 0.11 | 1.69 | 0.27 | 1 |
| Mayfield | 0.112 | 1.66 | 0.33 | 6 |
| Stockton | 0.112 | 1.67 | 0.26 | 0.2 |
| Fresh Sea Salt Factor PM2.5–10 |
| Mayfield | 0.11 | 1.72 | 0.25 | 6 |
| Stockton | 0.115 | 1.75 | 0.25 | 0.2 |
| Pollutant-Aged Sea Salt Factor PM2.5 |
| Muswellbrook | 0.117 | 0 | 1.993 | 100 |
| Singleton | 0.119 | 0 | 1.47 | 70 |
| Beresfield | 0.11 | 0.04 | 2.32 | 16 |
| Mayfield | 0.111 | 0 | 2.41 | 6 |
| Newcastle | 0.121 | 0.08 | 2.32 | 1 |
| Stockton | 0.106 | 0.18 | 1.51 | 0.2 |
| Pollutant-Aged Sea Salt Factor PM2.5–10 |
| Mayfield | 0.12 | 0.99 | 0.4 | 6 |
| Stockton | 0.09 | 0.74 | 0.39 | 1 |
Table 7.
Comparison of the constituents of the soil factor with crustal composition [
21] and some typical Australian dust [
22].
Table 7.
Comparison of the constituents of the soil factor with crustal composition [
21] and some typical Australian dust [
22].
| Species Ratio | Crust | Australian Dust | Muswellbrook | Singleton | Newcastle | Beresfield | Mayfield | Stockton | Mayfield | Stockton |
|---|
| PM2.5 | PM2.5–10 |
| Al/Si | 0.29 | 0.27–0.29 | 0.33 | 0.31 | 0.32 | 0.32 | 0.30 | 0.86 | 0.38 | 0.38 |
| Al/Ti | 14 | 11.5–15.1 | 12.7 | 12.7 | 14.2 | 14.6 | 13.9 | 36 | 23 | 25 |
| Ti/Si | 0.020 | 0.018–0.026 | 0.026 | 0.025 | 0.022 | 0.022 | 0.021 | 0.023 | 0.016 | 0.015 |
| Fe/Si | 0.200 | 0.22–0.23 | 0.29 | 0.30 | 0.15 | 0.11 | 0.27 | 0.34 | 0.15 | 0.14 |
© 2019 by the authors. Licensee MDPI, Basel, Switzerland. This article is an open access article distributed under the terms and conditions of the Creative Commons Attribution (CC BY) license (http://creativecommons.org/licenses/by/4.0/).

 ,
, 


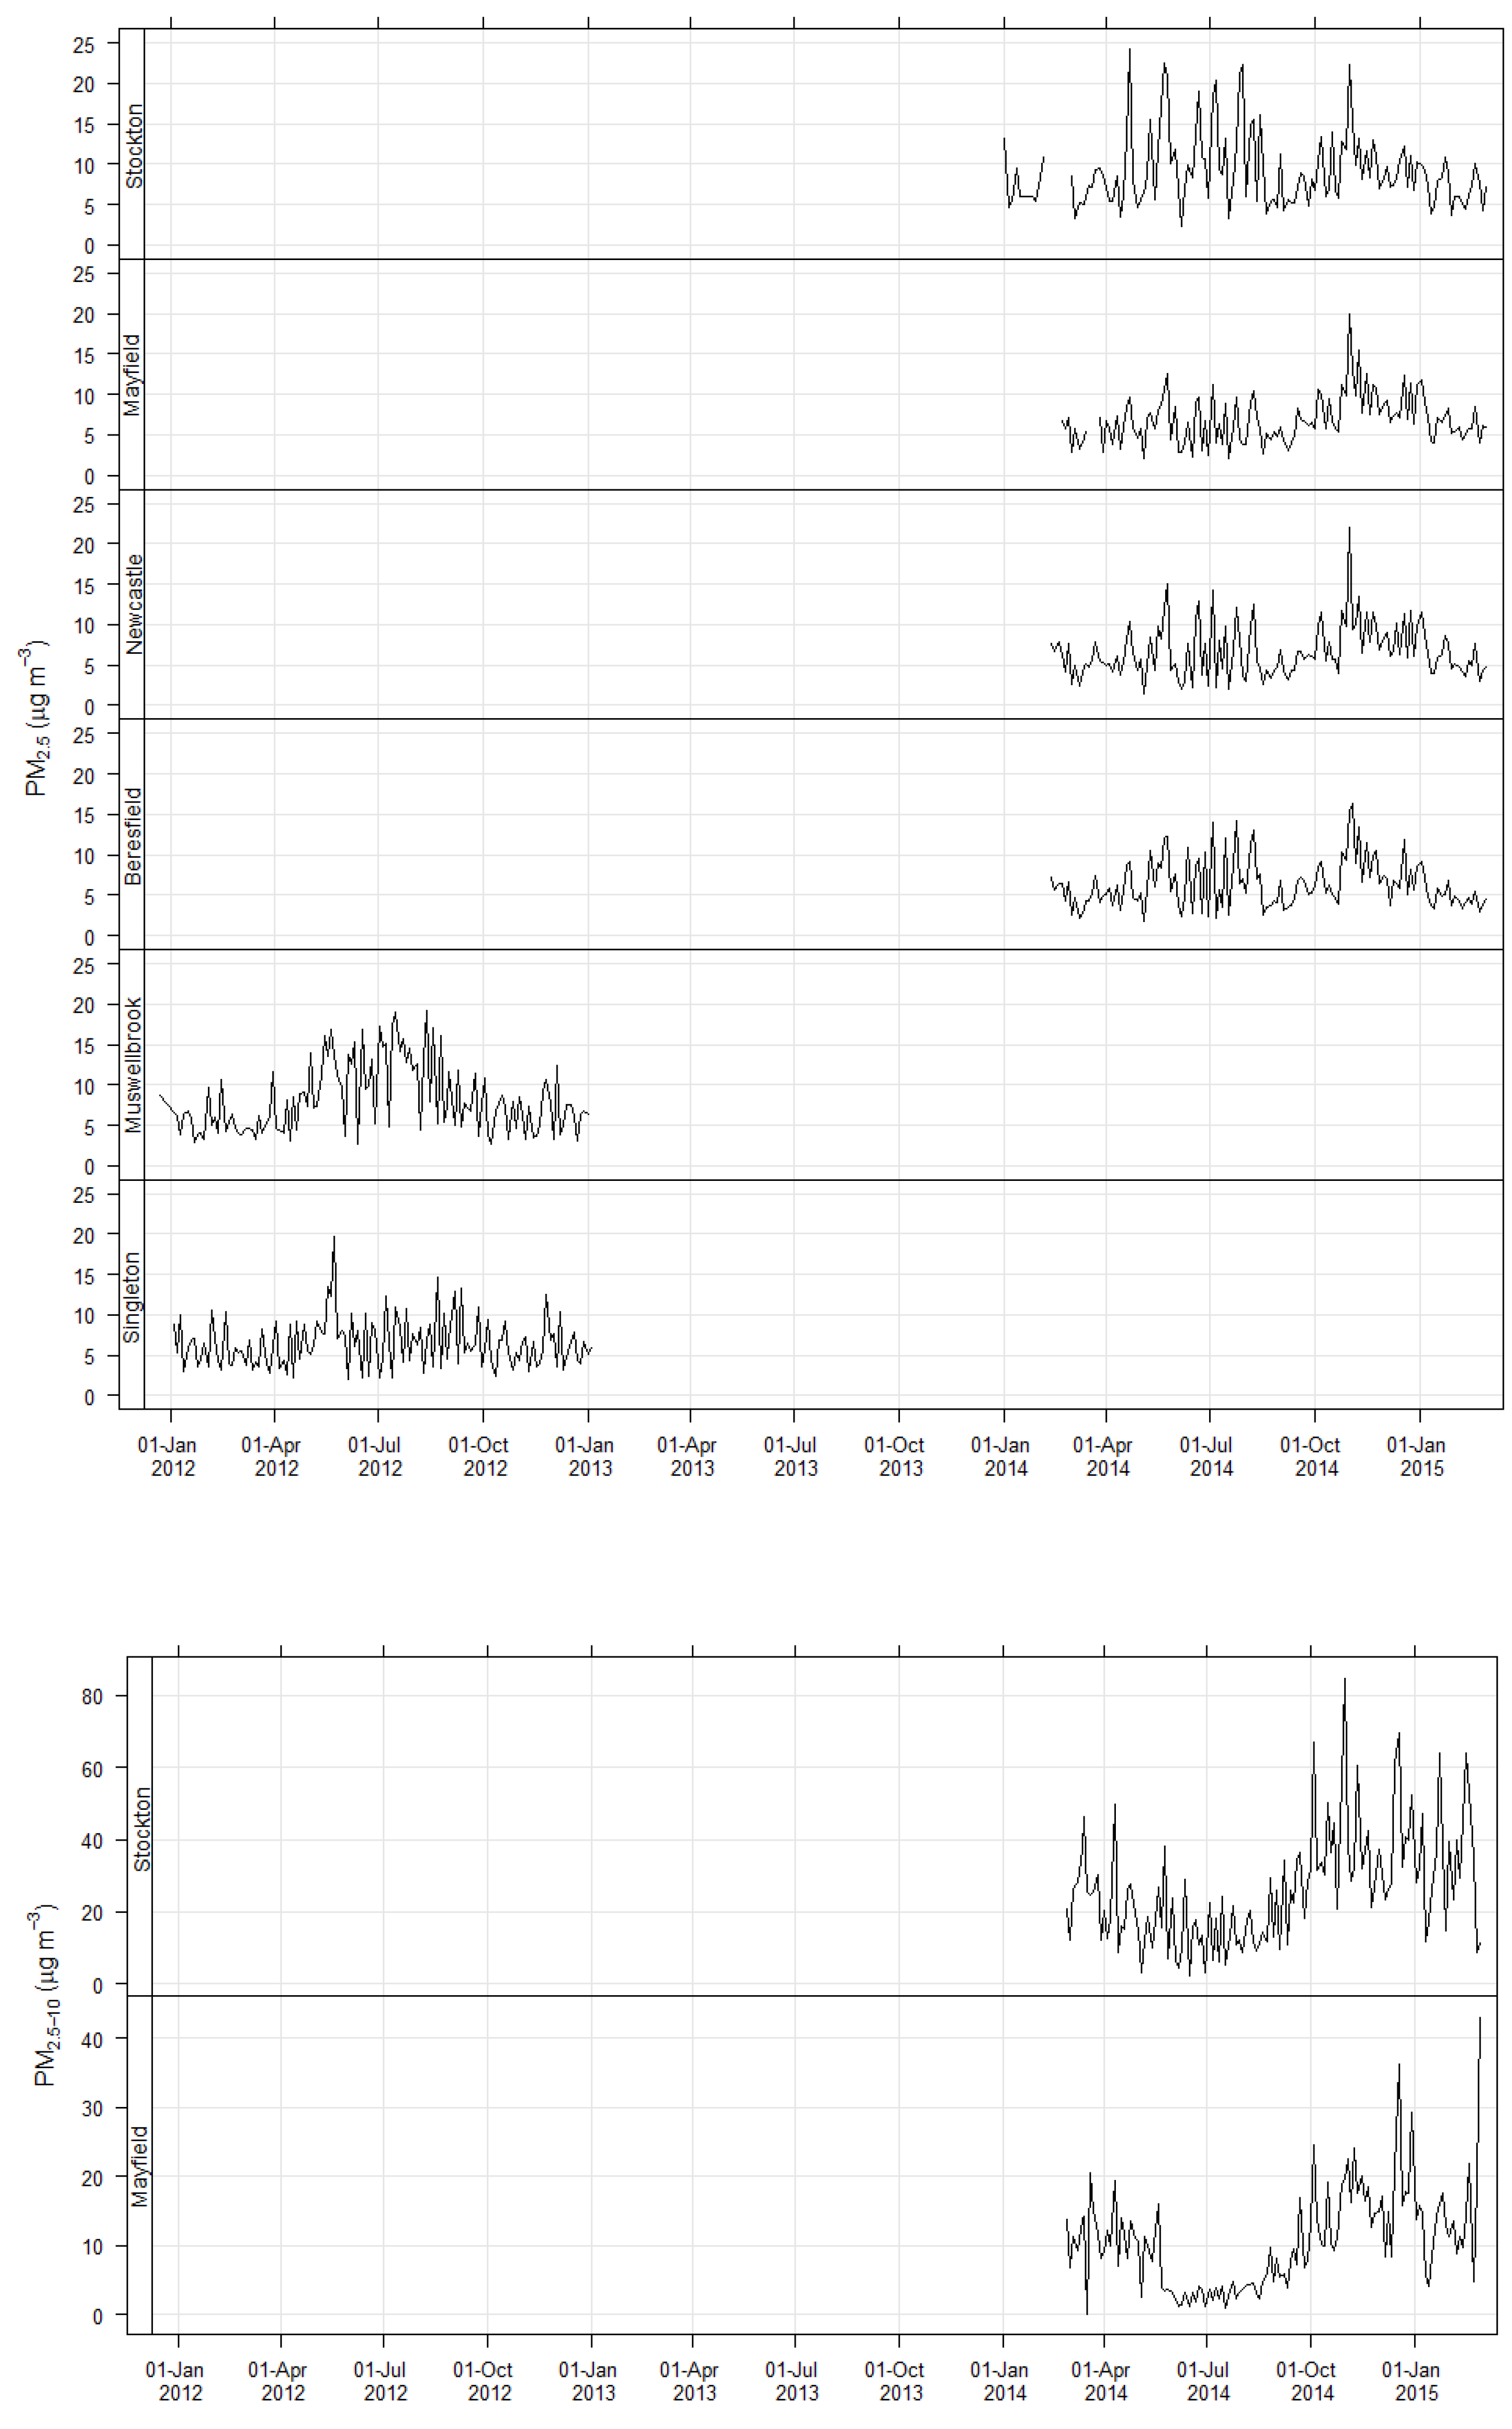
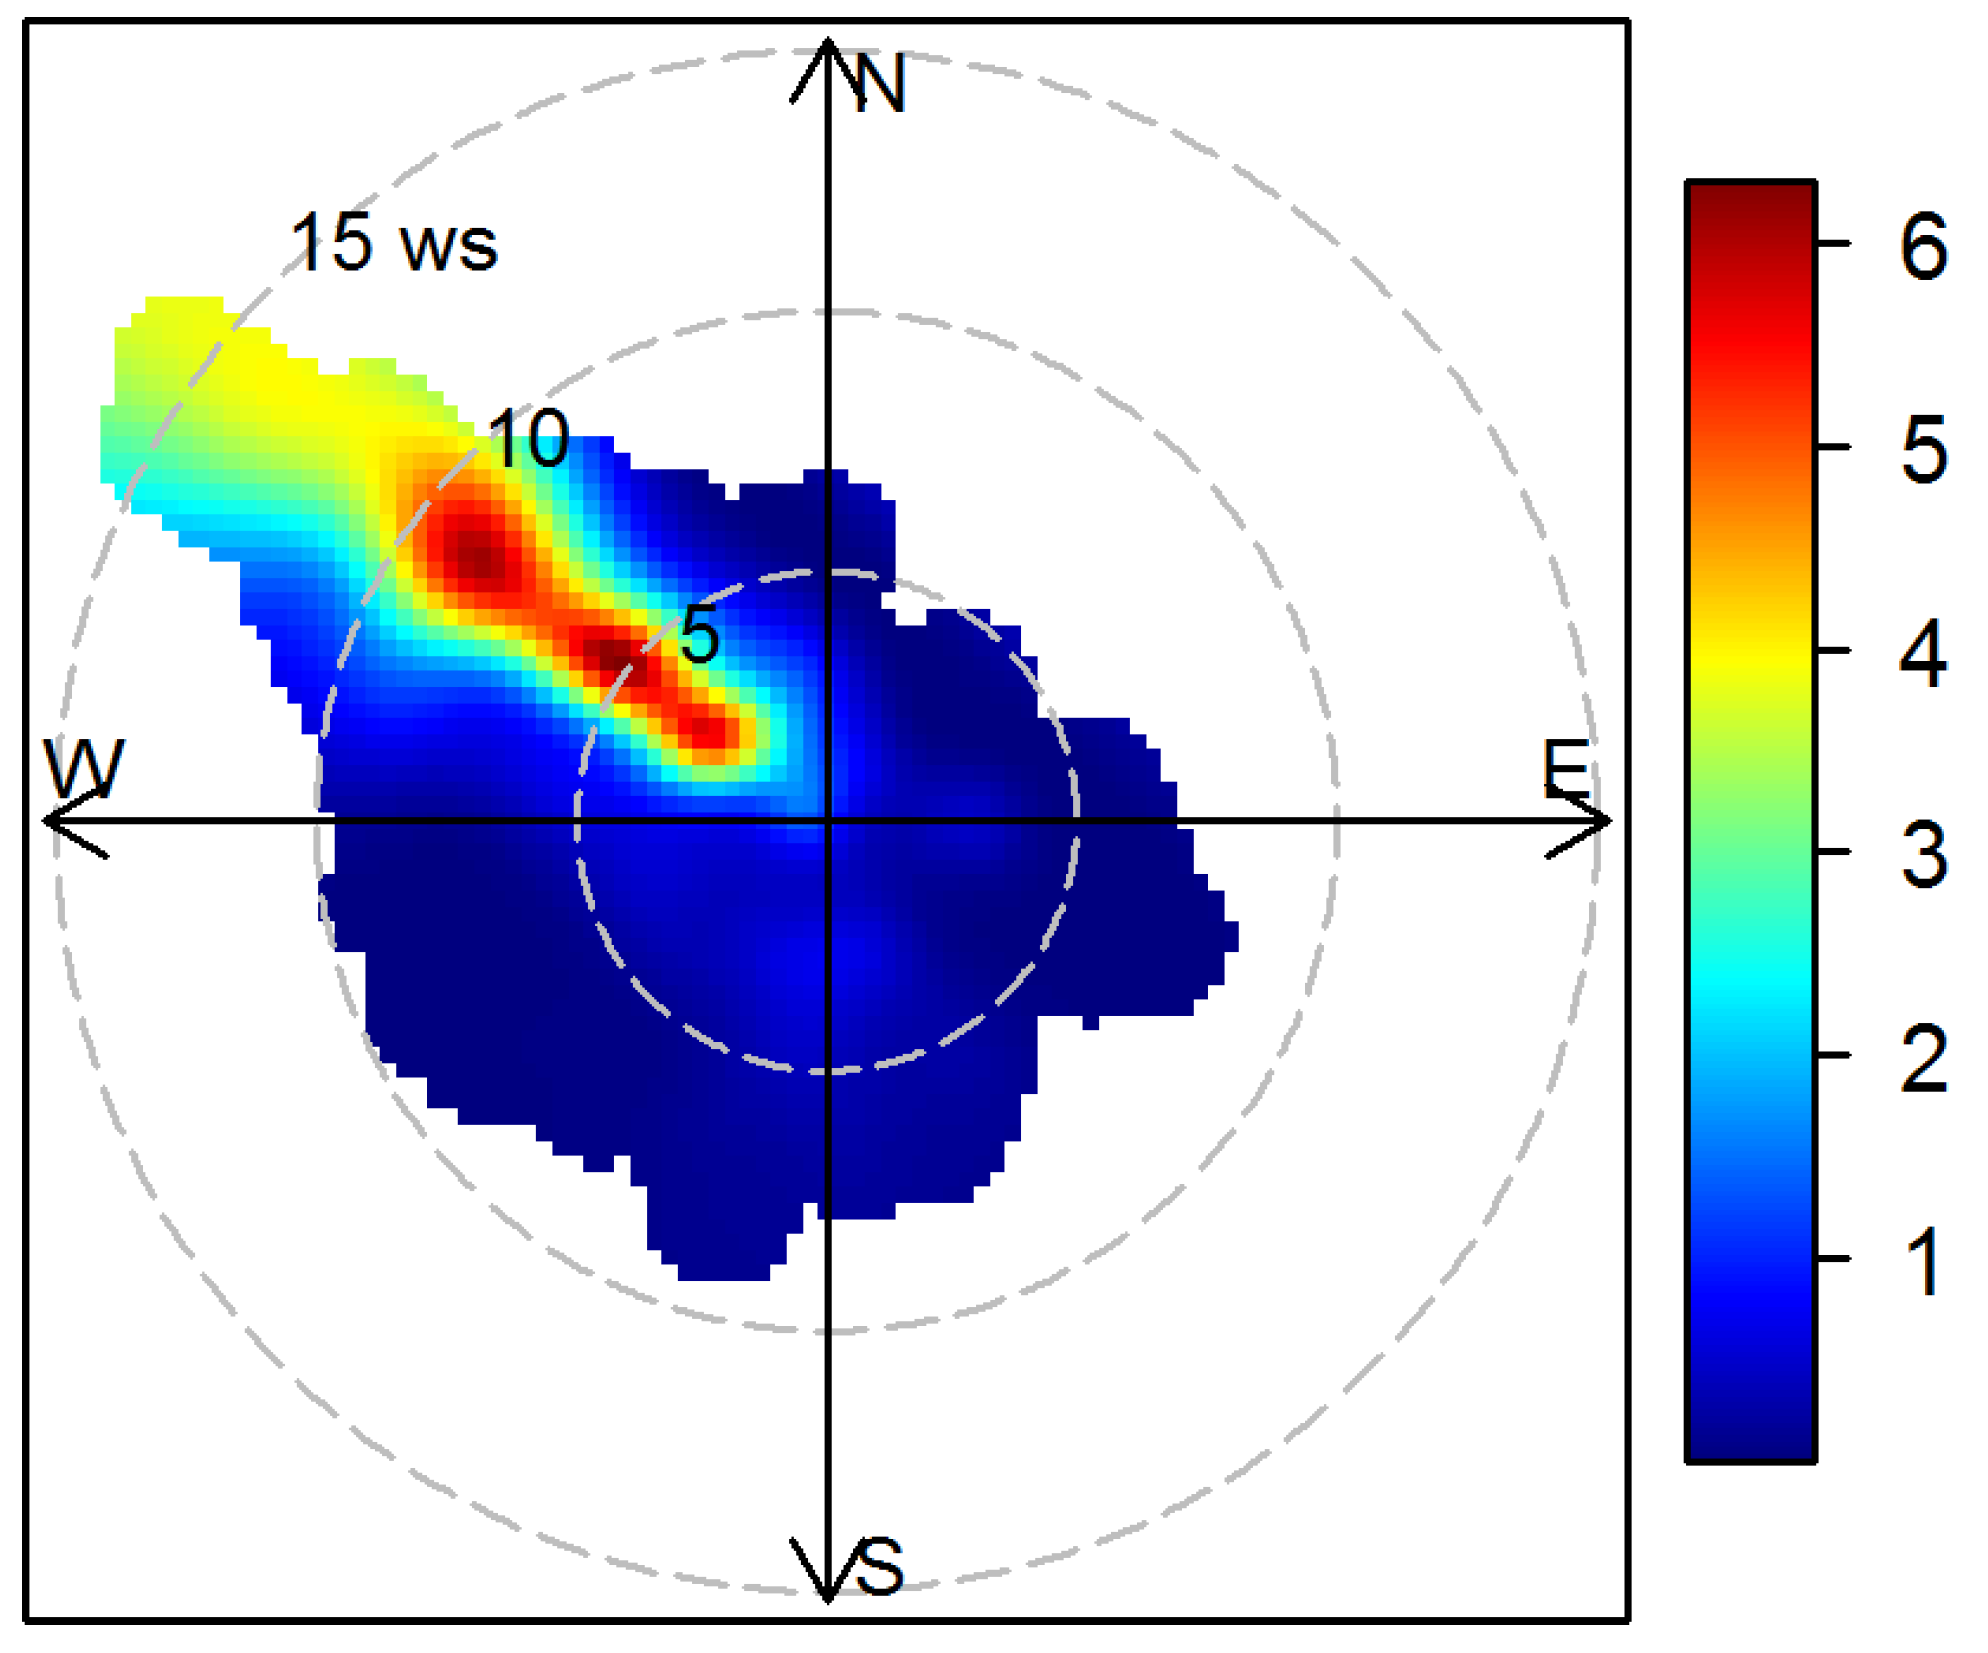