Article

Long-Term Observations of Atmospheric Speciated Mercury at a Coastal Site in the Northern Gulf of Mexico during 2007–2018

1
Air Resources Laboratory, National Oceanic and Atmospheric Administration, College Park, MD 20740, USA
2
Cooperative Institute for Satellite Earth System Studies, University of Maryland, College Park, MD 20740, USA
3
Department of Atmospheric and Oceanic Science, University of Maryland, College Park, MD 20742, USA
4
Wisconsin State Laboratory of Hygiene, University of Wisconsin, Madison, WI 53706, USA
5
Grand Bay National Estuarine Research Reserve, Moss Point, MS 39562, USA
*
Author to whom correspondence should be addressed.
Atmosphere 2020, 11(3), 268; https://doi.org/10.3390/atmos11030268
Submission received: 4 February 2020 / Revised: 28 February 2020 / Accepted: 4 March 2020 / Published: 7 March 2020
(This article belongs to the Special Issue Atmospheric Mercury: Sources, Sinks, and Transformations)

Abstract

:
Atmospheric mercury species (gaseous elemental mercury (GEM), gaseous oxidized mercury (GOM), and particulate-bound mercury (PBM)), trace pollutants (O3, SO2, CO, NO, NOY, and black carbon), and meteorological parameters have been continuously measured since 2007 at an Atmospheric Mercury Network (AMNet) site that is located on the northern coast of the Gulf of Mexico in Moss Point, Mississippi. For the data that were collected between 2007 and 2018, the average concentrations and standard deviations are 1.39 ± 0.22 ng m−3 for GEM, 5.1 ± 10.2 pg m−3 for GOM, 5.9 ± 13.0 pg m−3 for PBM, and 309 ± 407 ng m−2 wk−1 for mercury wet deposition, with interannual trends of −0.009 ng m−3 yr−1 for GEM, −0.36 pg m−3 yr−1 for GOM, 0.18 pg m−3 yr−1 for PBM, and 2.8 ng m−2 wk−1 yr−1 for mercury wet deposition. The diurnal variation of GEM shows lower concentrations in the early morning due to GEM depletion, likely due to plant uptake in high humidity events and slight elevation during the day, likely due to downward mixing to the surface of higher concentrations of GEM in the air aloft. The seasonal variation of GEM shows higher levels in winter and spring and lower levels in summer and fall. Diurnal variations of both GOM and PBM show broad peaks in the afternoon likely due to the photochemical oxidation of GEM. Seasonally, PBM measurements exhibit higher levels in winter and early spring and lower levels in summer with rising levels in fall, while GOM measurements show high levels in late spring/early summer and late fall and low levels in winter. The seasonal variation of mercury wet deposition shows higher values in summer and lower values in winter, due to larger rainfall amounts in summer than in winter. As expected, anticorrelation between mercury wet deposition and the sum of GOM and PBM, but positive correlation between mercury wet deposition and rainfall were observed. Correlation among GOM, ozone, and SO2 suggests possible different GOM sources: direct emissions and photochemical oxidation of GEM, with the possible influence of boundary layer dynamics and seasonal variability. This study indicates that the monitoring site experiences are impacted from local and regional mercury sources as well as large scale mercury cycling phenomena.

1. Introduction

Mercury (Hg) is a potent neurotoxin that is particularly damaging to the development of fetuses, infants, and young children [1]. While Hg ubiquitously exists in the natural environment, anthropogenic activities have moved previously sequestered materials (e.g., Hg in coal and metallurgical ores) into the ecosphere and increased its bioavailability [2]. Global emissions of Hg to the atmosphere are estimated to be approximately one-third from direct anthropogenic sources, approximately one-third from re-emission of previously deposited anthropogenic emissions, and about one-third from natural sources, but there are significant uncertainties in the overall amounts and proportions, as well as the spatial, temporal, and chemical distribution of emissions [3,4,5]. The concentrations of Hg in the air are usually low and they are generally not an air quality concern. It is when mercury deposits to land and water surfaces that it becomes a potential issue. The current primary pathway of ecosystem contamination is the emissions of Hg from both natural and anthropogenic sources to the atmosphere, followed by Hg deposition. Once deposited to watersheds and receiving waters, Hg can be converted to highly toxic methylmercury, which can be incorporated into the food chain and increase with trophic levels through bioaccumulation. Humans are exposed to methylmercury, primarily through consuming contaminated fish and other aquatic organisms. Consumption advisories for fish and other seafood due to mercury contamination are widespread throughout the United States and worldwide [6,7].
It is important to assess the long-term trends of atmospheric mercury in order to understand the relative contribution of Hg to ecosystems from various geographic regions and source types because atmospheric mercury deposition is the major pathway for the input of Hg into ecosystems. Such understanding is essential for developing and assessing regulations and control policies. Several distinct chemical and physical forms of Hg exist in the air and there are three operationally-defined Hg species: gaseous elemental mercury (GEM), gaseous oxidized mercury (GOM), and particulate-bound mercury (PBM). While GEM is ubiquitously observed in the troposphere, the distributions of GOM and PBM are not well documented. Mercury in aquatic ecosystems mainly results from dry and wet deposition of GOM and PBM from the atmosphere [8,9,10]. Thus, it is highly desirable to conduct measurements of mercury species along with a variety of trace gases to facilitate source identification.
The northern coast of the Gulf of Mexico experiences high atmospheric wet deposition of Hg due to unique atmospheric conditions in this region, including high rainfall amounts and relatively high concentrations of Hg in rain [11]. The exact reasons for the high Hg wet deposition in this area are not entirely clear, but they may include enhanced scavenging of free-tropospheric GOM by deep convective thunderstorms [12]. Dry deposition of mercury is generally less important but not insignificant, due to the relatively high wet deposition in the region. A recent study found that the oxidation of GEM by bromine radical might be an important pathway for forming GOM over the southeastern United States (U.S.) [13], while Engle et al. [14] suggest the rapid deposition of GOM and coarse PBM may be important sources of Hg input. Previous observations of atmospheric Hg in this area show peak ground-level atmospheric GOM concentrations in the afternoon [14,15]. The elevated GOM levels were attributed to the photochemical oxidation of GEM by atmospheric oxidants, with the enhancement of morning GOM being attributed to local emissions and boundary layer processes, such as the erosion of the nocturnal inversion and subsequent vertical mixing [14]. Long-term observations of mercury speciation can help to characterize these processes and assess the regional atmospheric budget [16] and global cycle of mercury [17].
In this work, we present measurements of atmospheric speciated mercury collected at a coastal site in the northern Gulf of Mexico and examine their long-term trends. Correlationships between mercury, trace gases, and meteorological parameters were also examined. The overall goal of this study is to develop source-receptor information for atmospheric mercury deposition to this sensitive coastal environment and inform policies to reduce mercury loadings.

2. Site and Measurements

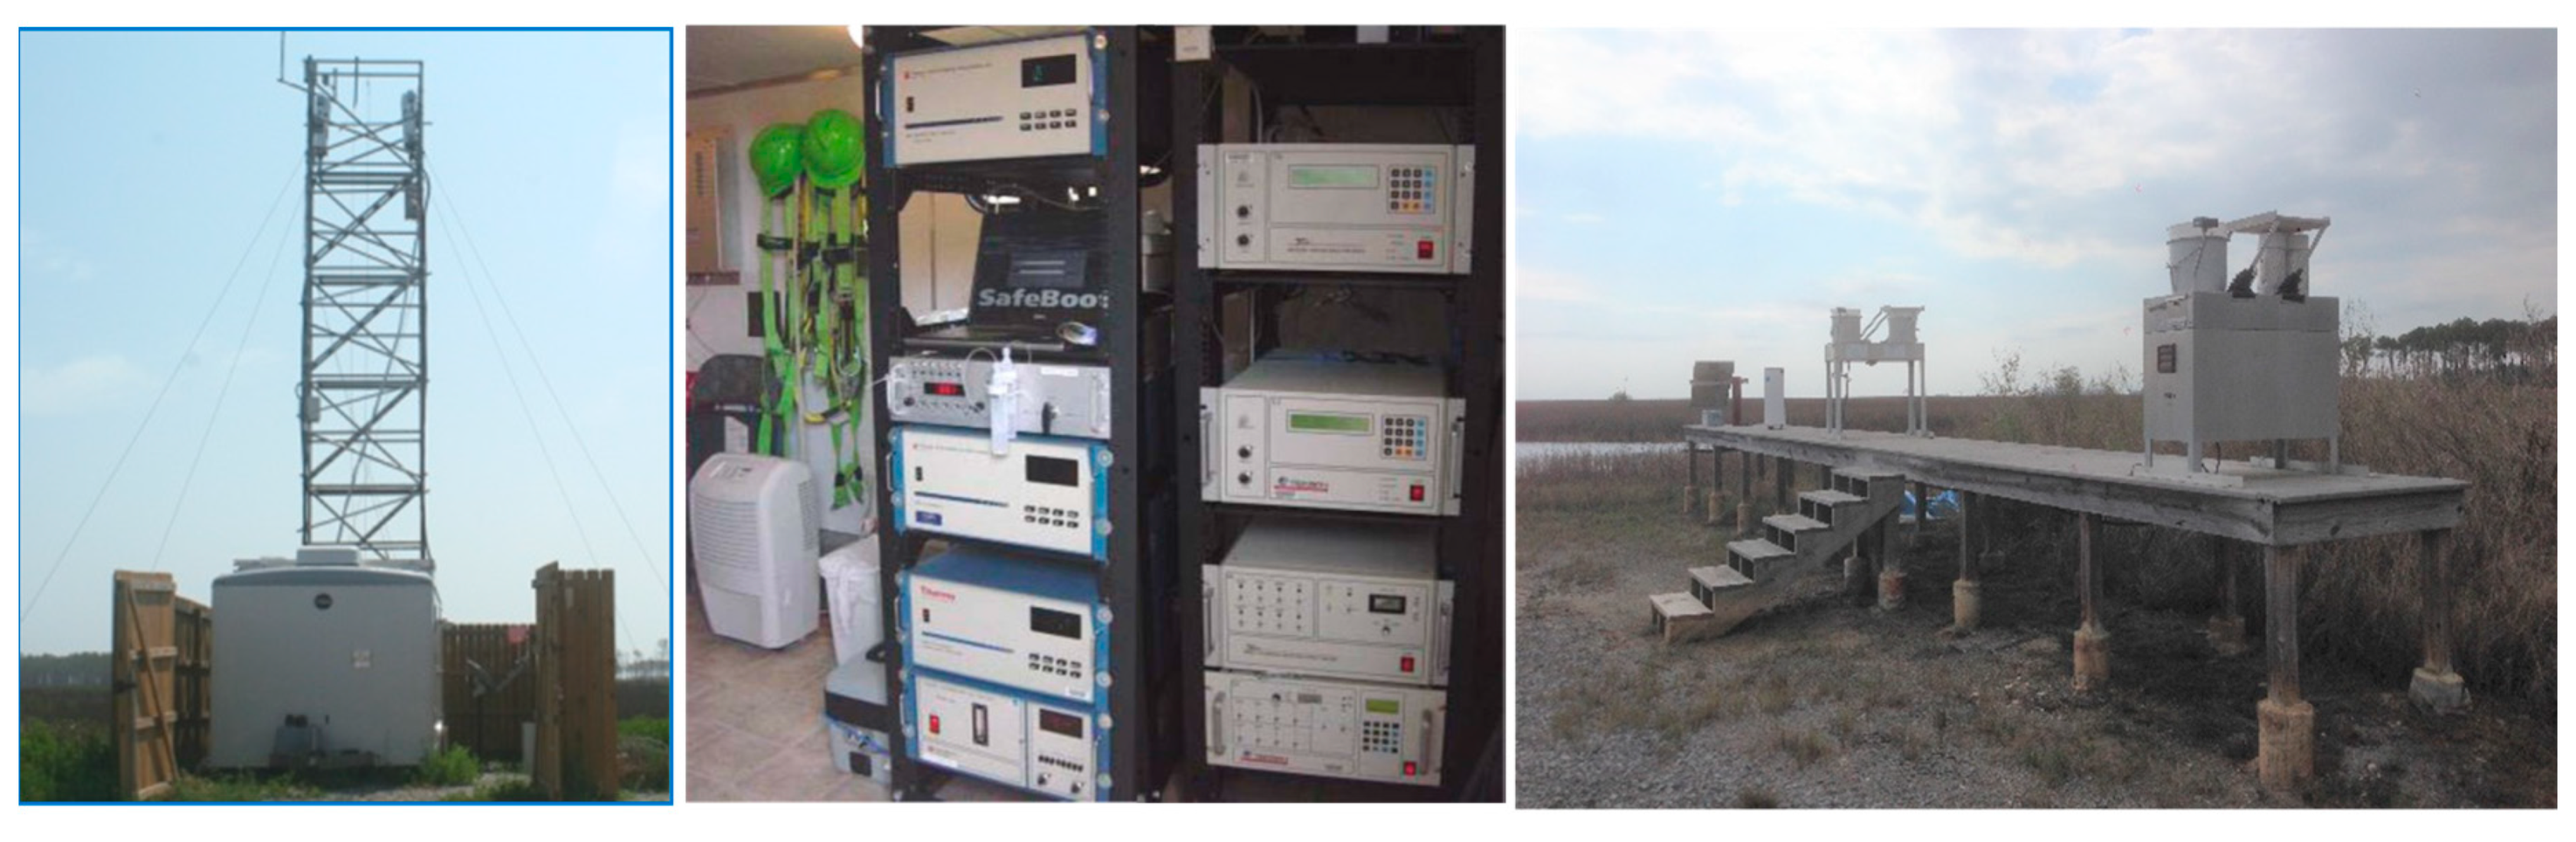
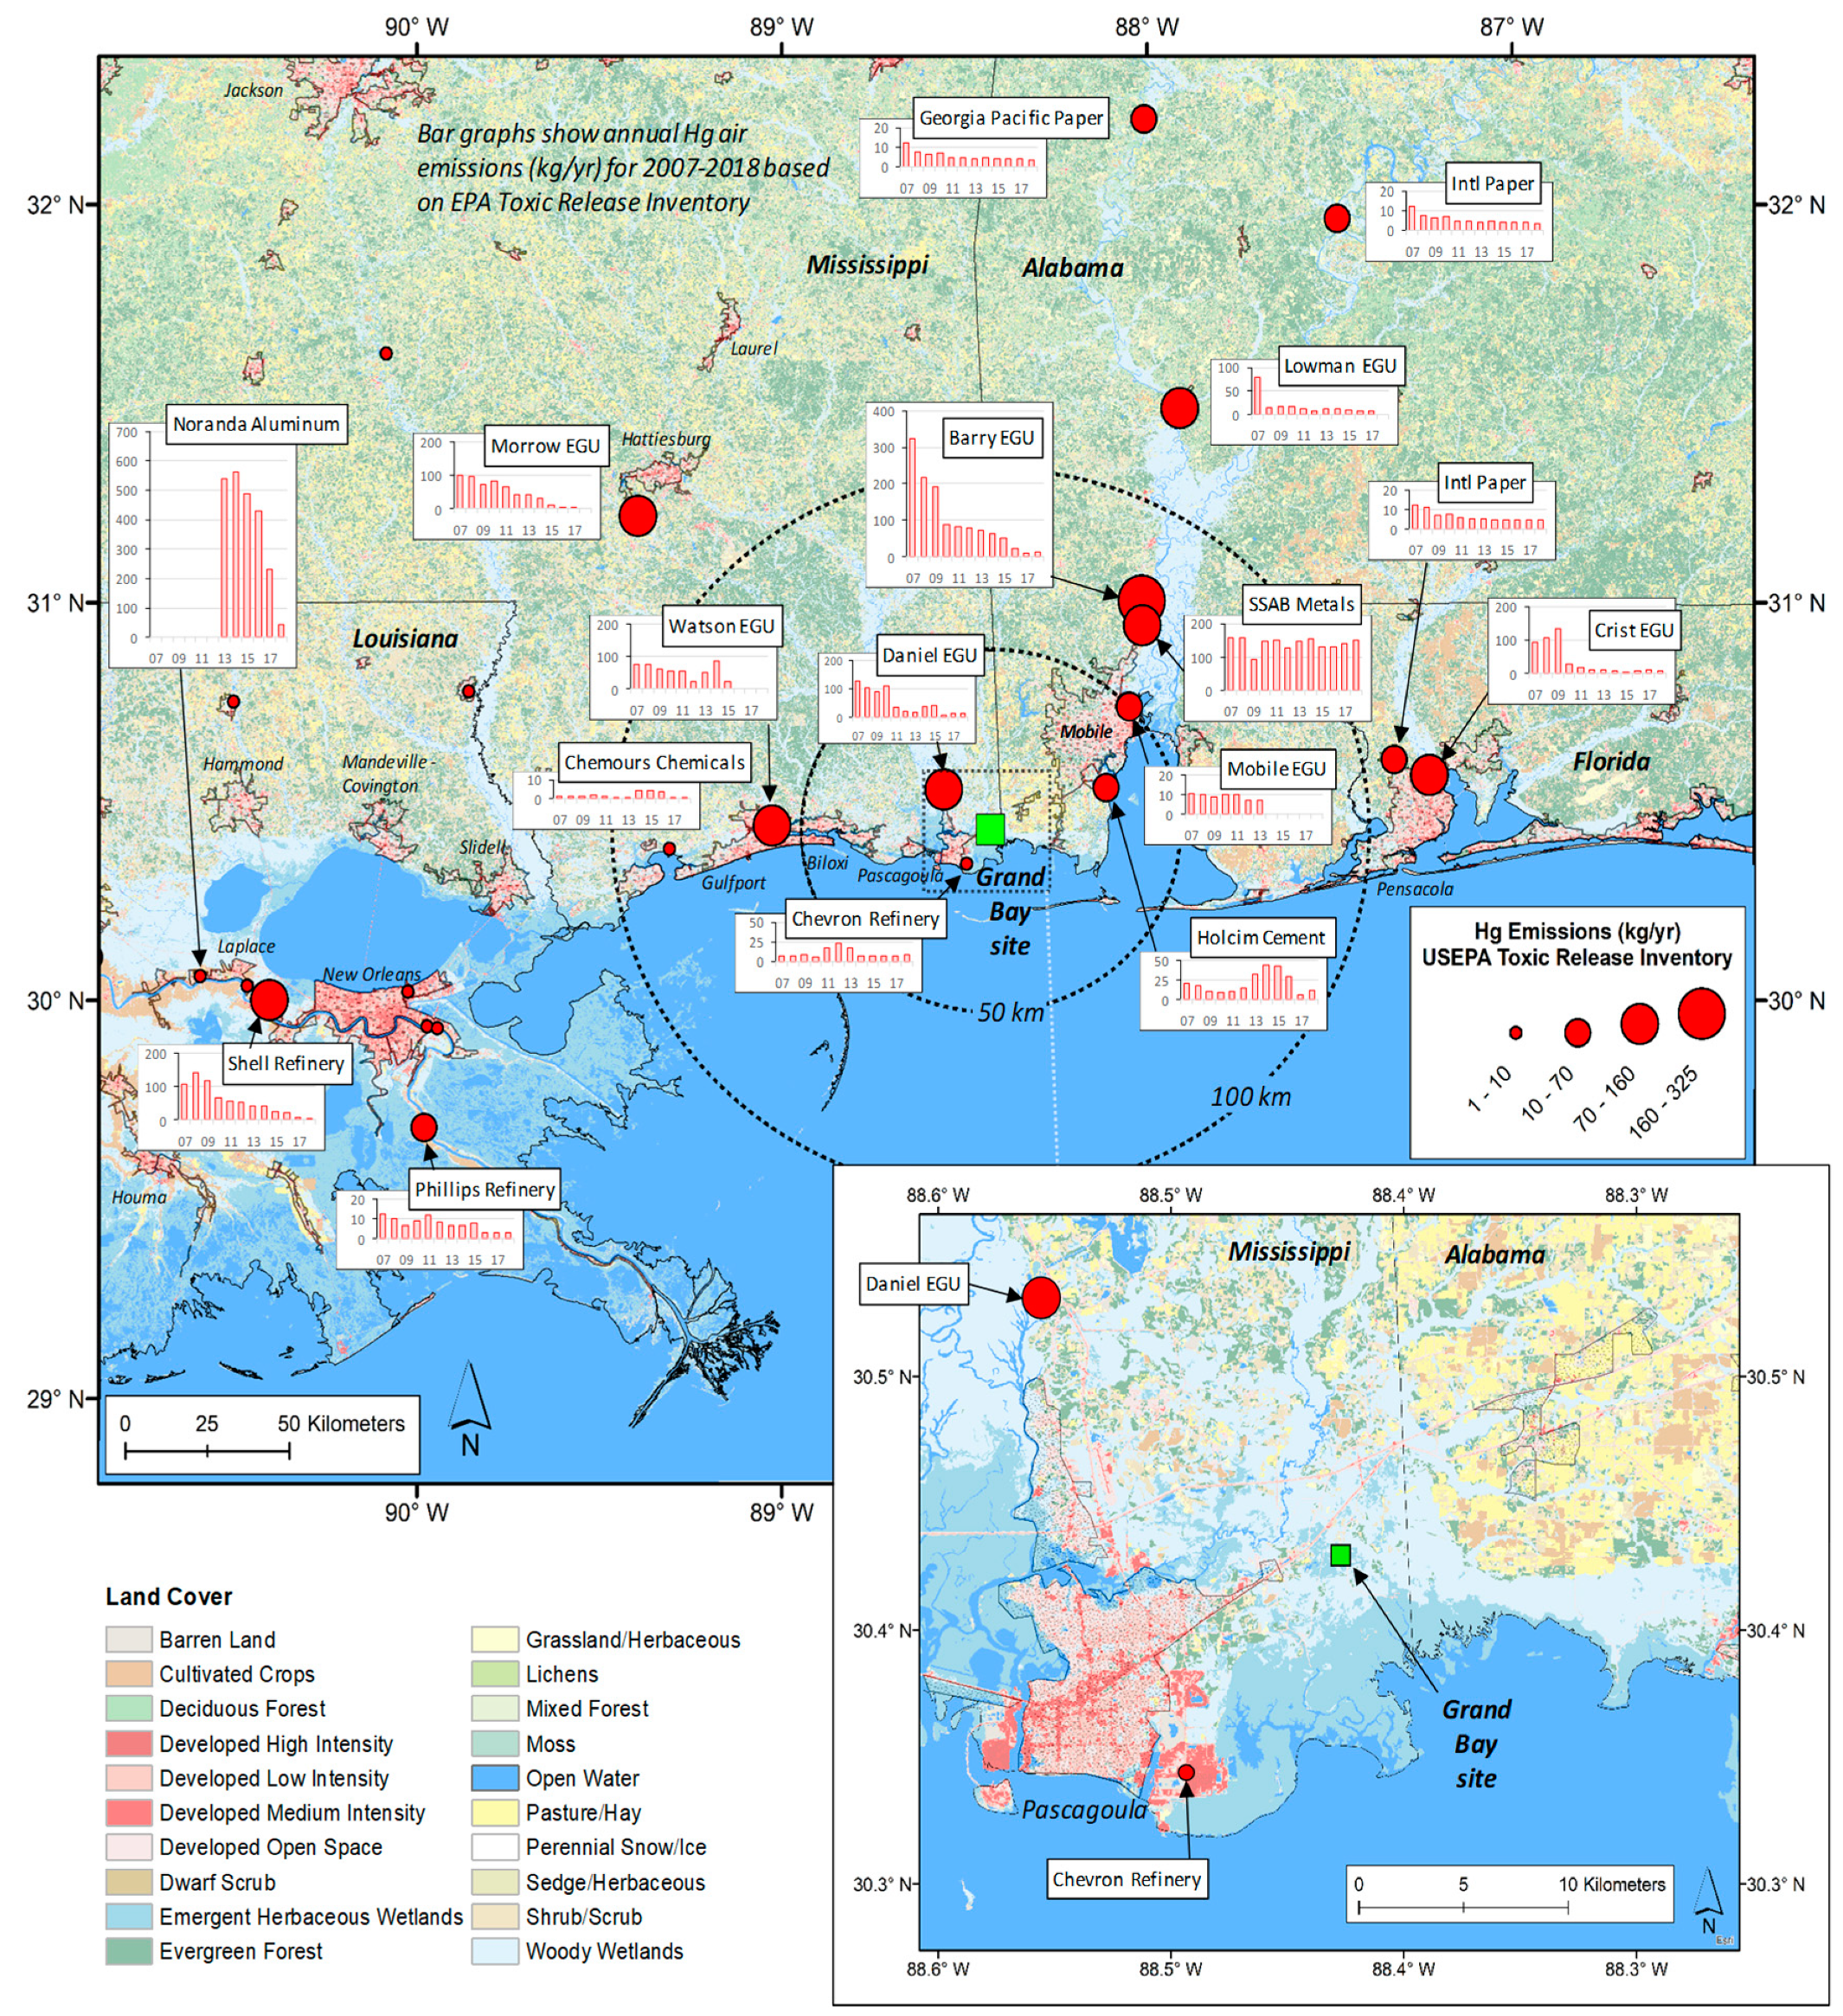
2.1. Site Description

National Oceanic and Atmospheric Administration’s (NOAA’s) Air Resources Laboratory (ARL) started to establish the mercury monitoring site at Grand Bay in 2006. The monitoring site has been described elsewhere [18], and only a brief description is given here. The site is operated as part of the National Acid Deposition Program’s (NADP’s) Atmospheric Mercury Network (AMNet, Site MS12) and it is located in the NOAA Grand Bay National Estuarine Research Reserve (NERR) in Moss Point, Mississippi (30.412° N, 88.404° W). The reserve is located in extreme southeastern Mississippi near the Alabama state line. Figure 1 shows the location of the site and regional point sources of mercury. The area has both wetland and terrestrial habitats that are unique to the coastal zone, such as maritime forests.

2.2. Experimental Description

2.2.1. Measurements of Speciated Mercury

Atmospheric speciated mercury, including GEM, GOM, and PBM, has been monitored at the Grand Bay site since 2007 while using two Tekran speciation systems (Tekran Instrument Corporation, Scarborough, ON, Canada, Figure 2). Details of atmospheric mercury measurements have been described in previous studies [20,21]. Briefly, as ambient air flows through the mercury detection system, large particles (diameter d > 2.5 μm) are removed by an elutriator/impactor, GOM is collected on a KCl-coated annular denuder, PBM (with a particle diameter < 2.5 μm) is then collected on a quartz regenerable particle filter (RPF), and GEM is collected on gold traps with sequential detection that is based on cold vapor atomic fluorescence spectrometry (CVAFS). The collected GOM on the denuder and PBM on the quartz filter are then sequentially thermally desorbed and quantitatively converted to GEM, which is then analyzed by the mercury detector. AMNet standard operating protocols were followed for mercury data collection and reduction [21,22]. Two Tekran mercury speciation systems were deployed at the site from 2008 to 2012, which allowed for truly continuous measurements of GOM and PBM, the collection of quality control and quality assurance data, and testing methodological refinements [21].
Recent studies [23,24,25,26] have reported that GOM measurements with KCl-coated denuders may underestimate the atmospheric concentrations of GOM. McClure et al. [26] found a lower collection efficiency of GOM on KCl-coated denuders that are impacted by ozone and humidity due to the release of GEM from the denuder. It is not clear if the results from these studies can be generalized to all of the field measurements [16], and this issue of possible bias in the GOM measurements needs further investigation. This bias would affect the GOM measurement, but the GOM trend that is reported here likely remains valid. A consistent protocol has been followed for the operation of the Tekran systems since 2007, so any biases in the GOM measurement that are caused by ozone and humidity would remain similar over this 12-year period because there were no significant trends in humidity and ozone only decreased at a rate of 0.3 ppb year−1.

2.2.2. Ancillary Measurements

Other measurements of atmospheric constituents were made at the same site, including ozone (O3), sulfur dioxide (SO2), carbon monoxide (CO), nitric oxide (NO), total reactive nitrogen (NOY), and black carbon. Meteorological parameters (temperature, pressure, relative humidity, precipitation, wind speed and direction, and solar radiation) were also measured. Since 2010, weekly-integrated precipitation samples have been collected at the site for subsequent chemical analysis of total mercury, major ions, and trace metals, according to the NADP’s Mercury Deposition Network (MDN) and National Trend Network (NTN) protocols. Weekly mercury wet deposition was quantified by multiplying weekly precipitation totals by the total mercury concentrations that were measured in the weekly samples.
Besides the long-term monitoring, an intensive study in two phases was also conducted with the first phase in summer 2010 and the second phase in spring 2011 [20]. During the intensive study, some additional measurements were added, including the measurements of halogen species (BrO, HOBr, etc.) and mercury deposition fluxes at the surface; aircraft measurements of GEM, GOM, SO2, O3, and particles to determine the vertical profiles of mercury aloft and interpret the subsequent data; and, ozonesondes to identify high ozone aloft as a surrogate for downward mixing from the upper atmosphere. The results from this intensive study have been summarized by Ren et al. [20] and show that peak GOM levels were associated with elevated O3, BrO, and solar radiation or elevated SO2, but with lower O3, suggesting two potential sources of GOM: photochemical oxidation of GEM and the direct emissions of GOM from nearby sources.

3. Results

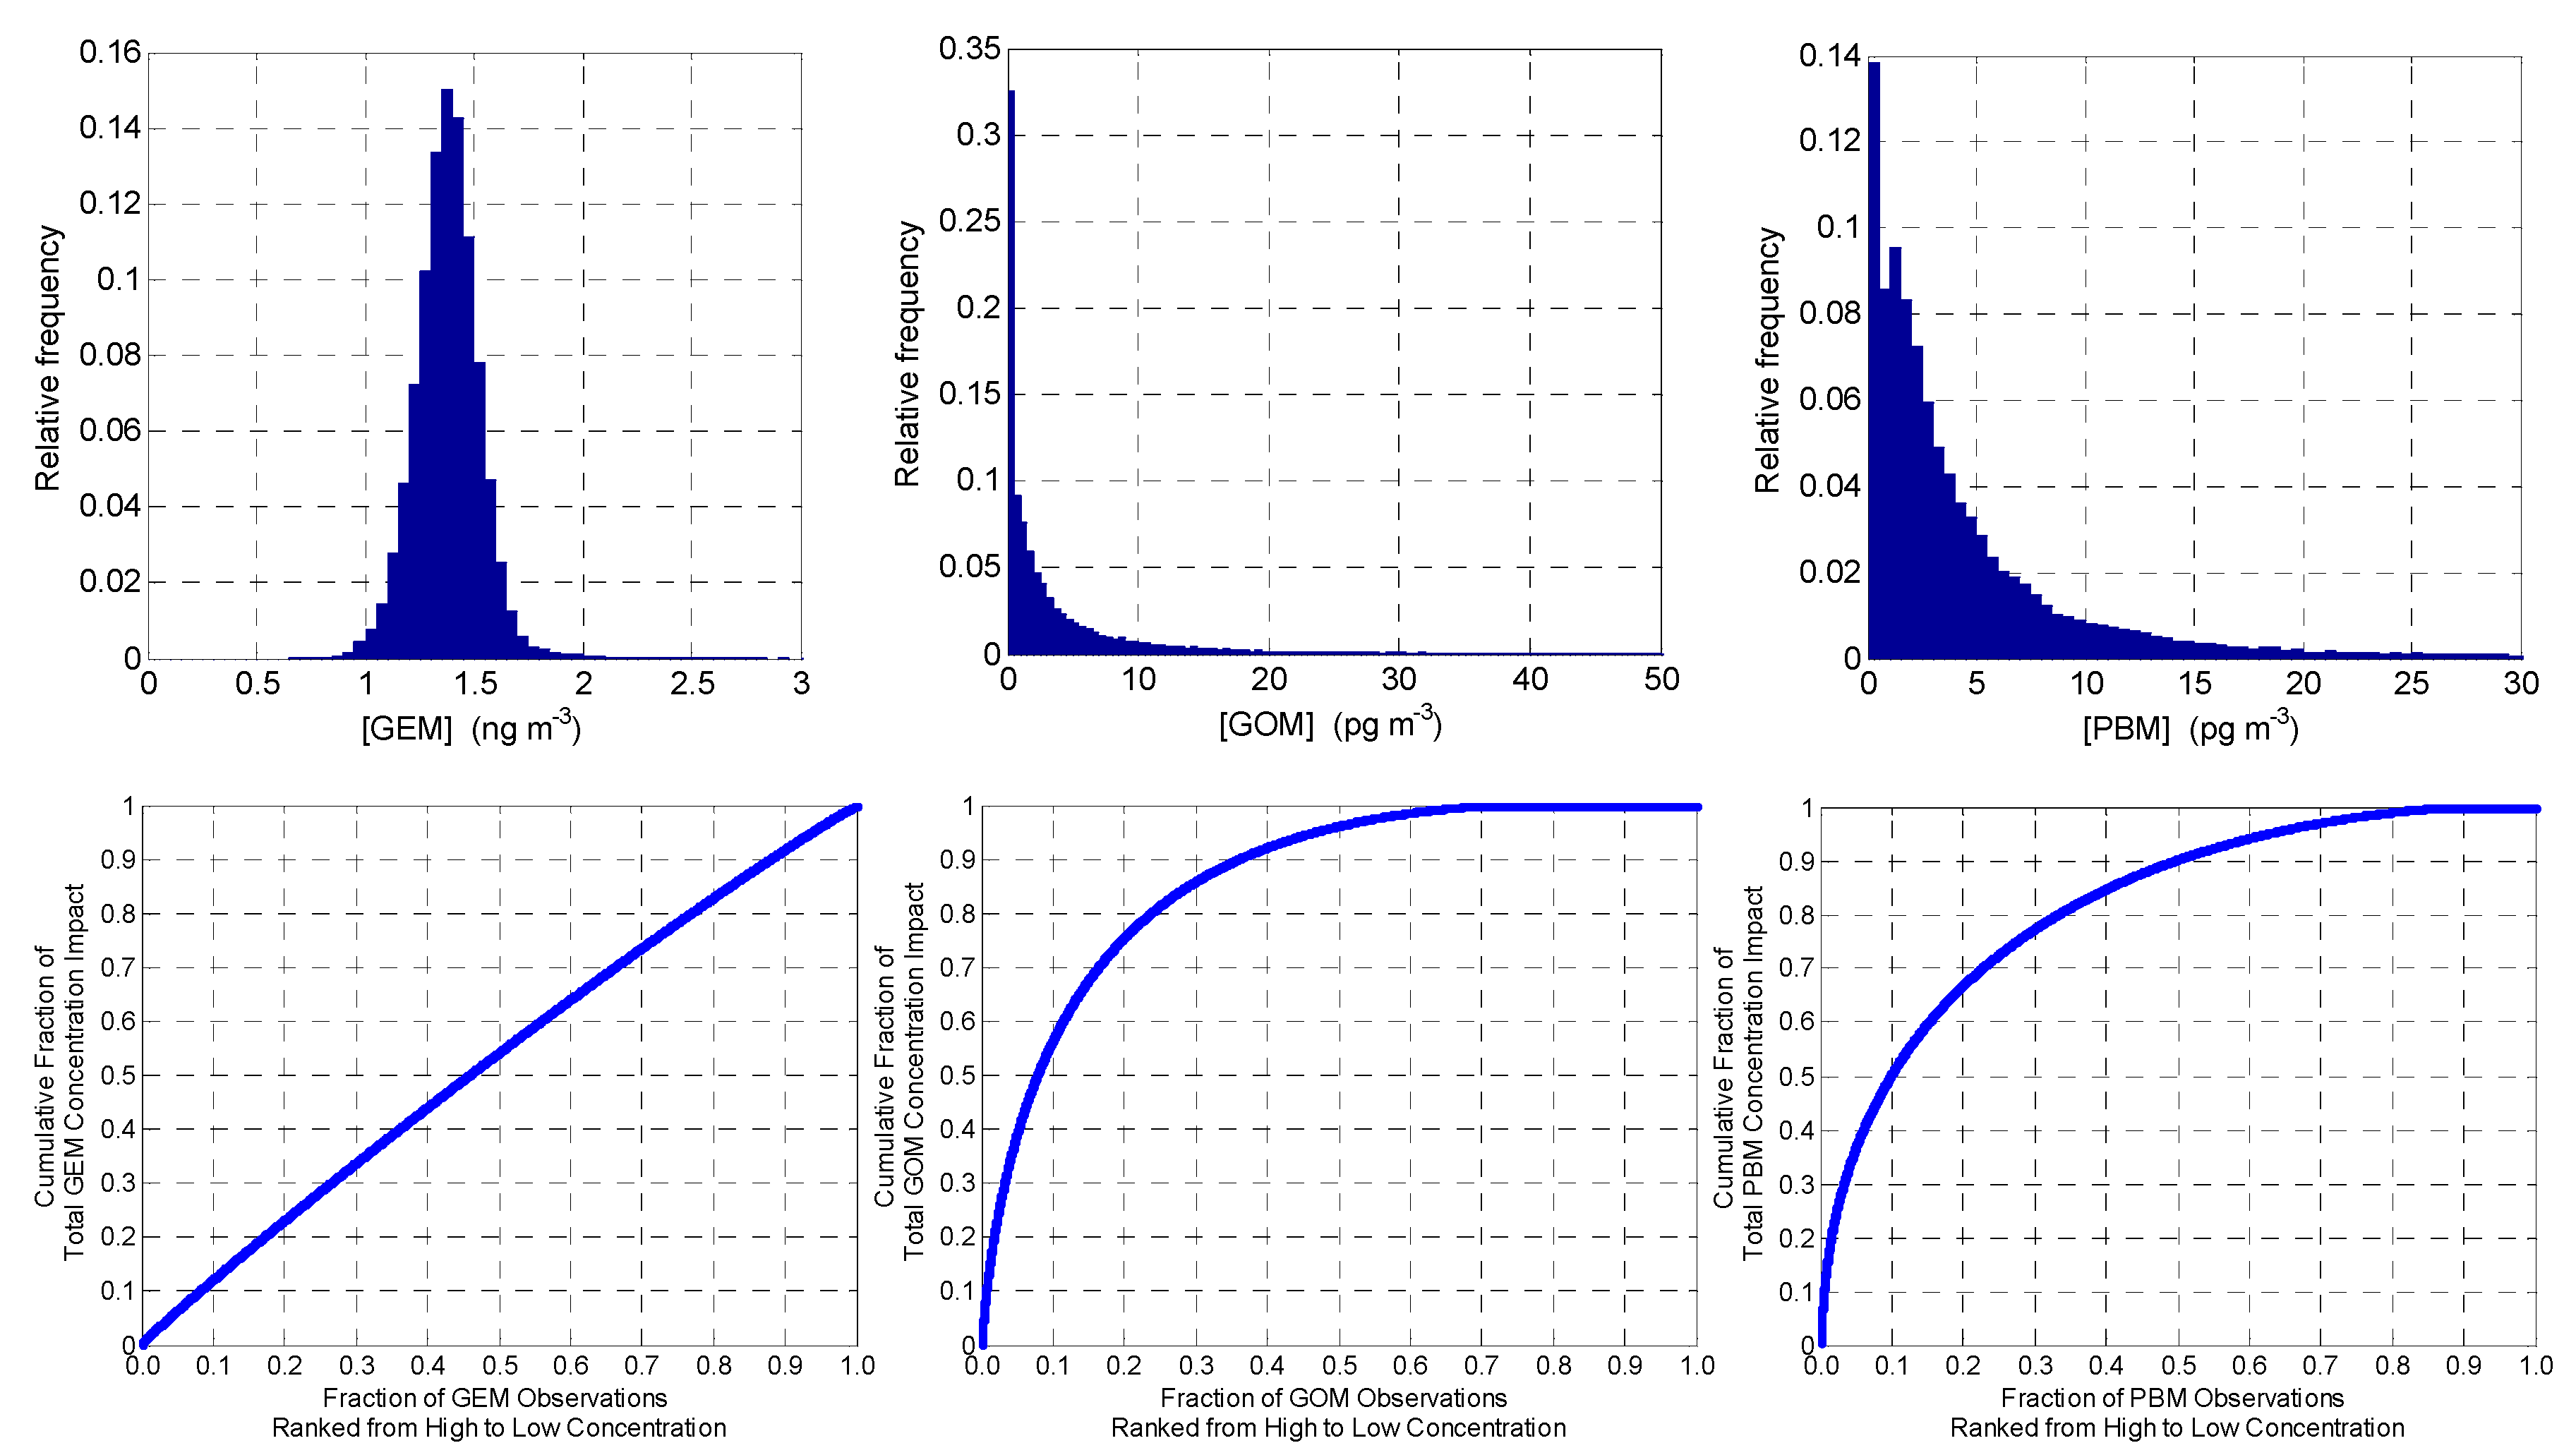
3.1. Overall Measurement Statistics

Table 1 and Figure S1 show a statistical summary of the GEM, GOM, and PBM measurements at the Grand Bay site from 2007 to 2018. The mean concentrations and standard deviations of hourly measurements during this 12-year period are 1.39 ± 0.22 ng m−3 for GEM, 5.1 ± 10.2 pg m−3 for GOM, and 5.9 ± 13.0 pg m−3 for PBM. The weekly atmospheric deposition measurements show that the mean and standard deviation of mercury wet deposition were 309 ± 407 ng m−2 wk−1 from 2010 to 2018. There were some variations in annual mean mercury concentrations from year to year (Figure S1 and Table 1). For example, the annual mean GEM concentration was 1.31 ng m−3 in 2017 and 2018, but was 1.44 ng m−3 in 2011. High GOM and PBM events were observed with the GOM concentration up to 256 pg m−3 in 2008 and the PBM concentration up to 970 pg m−3 in 2014. In recent years, from 2013 to 2017, the maximum hourly concentrations of GEM, GOM, and PBM have generally been decreasing, which is likely due to emission reductions of air pollutants from power plants and other regional sources that also reduced mercury emissions as a co-benefit [27].
The frequency distributions of GEM, GOM, and PBM measured at the Grand Bay site from 2007 to 2018 show that GEM exhibits a nearly normal distribution (i.e., annual median and mean concentrations are about the same for each year (Table 1)), while significant portions of GOM (32%) and PBM (14%) measurements are less than 0.5 pg m−3 (Figure 3). Similar distributions of these measurements were observed at the suburban site that is located in Beltsville, Maryland [21]. The bottom panels of Figure 3 show the cumulative concentrations for GEM, GOM, and PBM. For these plots, the set of all measured concentrations of a given mercury form are first sorted from high to low. Subsequently, the cumulative concentration that is associated with each measurement is calculated by adding each successive concentration to the running total. The total cumulative concentration—or “total concentration impact”—is equal to the average concentration times the total number of measurements. Since dry deposition is related to concentration, the cumulative concentration is related to the cumulative dry deposition. Each axis is then normalized to show the fraction of the total. For the y-axis, the cumulative concentrations are normalized by the total cumulative concentration (i.e., the sum of all hourly concentrations that were measured at the site) and the total number of measurements normalizes the x-axis. For GOM and PBM, it can be seen that the top 10% of hourly concentrations measured contributed more than 50% of the overall concentration impact for the 2007–2018 period. The peak concentrations of GEM were not nearly as disproportionately significant to the overall concentration impact. Section S2 in the Supporting Information provides more details regarding how these plots were created and provides plots for each year of measurements (Figures S2–S4).

Inter-Annual Variation

Figure 4 shows the time series of hourly GEM, GOM, and PBM concentrations and biweekly mercury wet deposition measured at the Grand Bay site from 2007 to 2018. A decreasing inter-annual trend for GEM was observed at this site from 2007 to 2018: −0.009 ± 0.003 ng m−3 yr−1 or −0.6 ± 0.2% yr−1. This trend is statistically significant (p-value < 0.01) while using a Mann–Kendall test [28,29]. Similar but stronger decreasing trends of GEM were observed at the Beltsville site (1.3 ± 0.5% yr−1 over 2007–2015) in Beltsville, Maryland and at the Piney Reservoir air monitoring site (13% over the entire 2006–2014 period) in western Maryland, respectively, both being located downwind of several large coal-fired power plants in Ohio, Pennsylvania, and West Virginia [16,21]. The quarterly mean concentrations of GEM measured at the Grand Bay site ranged from 1.5 to 1.2 ng m−3 from 2007 to 2018. This is largely because of the seasonal variation of GEM, as described in Section 3.3. The annual mean GEM concentrations decreased from 1.45 ng m−3 in 2011 to 1.31 ng m−3 in 2017 and 2018 (Table 1). This decrease likely reflects an overall decreasing trend in the regional anthropogenic mercury emissions (Figure 5).
There are considerable variations for GOM and PBM and mercury wet deposition, even for the quarterly average values (Figure 4), mainly due to seasonal variations. However, a statistically significant decreasing trend of −0.36 ± 0.07 pg m−3 yr−1 or −7.1 ± 1.4% yr−1 for GOM (p-value < 0.01) was observed, similar to the decreasing trend that was observed at the Beltsville site (−7.3 ± 2.6% yr−1). There is an apparent increase in PBM at the Grand Bay site (0.18 ± 0.22 pg m−3 yr−1 or 3.5 ± 4.3% yr−1), but the trend is not a statistically significant trend (p-value = 0.67). Weekly measurements of mercury wet deposition at the Grand Bay site show that its mean and standard deviation are 309 ± 407 ng m−2 wk−1 from 2010 to 2018. There is also no statistically significant trend in the mercury wet deposition during this period (p-value > 0.01), even though there is a slight increase of 2.8 ± 10.4 ng m−2 wk−1 yr−1 or 0.9 ± 3.4% yr−1. There is a slight increase of 54 mm yr−1 or 5% yr−1 in the precipitation from 2010 to 2018, which at least partially contributes to the increase of mercury wet deposition. The rate of increase in the mercury wet deposition is consistent with the increase in PBM measured at the same site and the overall increase in mercury deposition at other MDN sites in the southeast US [30].
The concentrations and trends of GEM, GOM, and PBM that were observed at the Grand Bay site are influenced by the spatio-temporal patterns of upwind emissions—including the poorly characterized partitioning of emissions among the different mercury forms—as well as complex atmospheric transport, dispersion, chemical transformation, and deposition phenomena that mercury is subjected to after emission to the air. While the spatio-temporal trend of GOM emissions are not well known, the overall interannual trend of GOM follows well with the decreasing trend of total mercury release into air from direct, inventoried point sources in the region that surround the Grand Bay site (Figure 5), even though the global anthropogenic mercury emissions to the air likely increased over this period [31,32]. The decreasing trend of GEM is not as steep, as the hemispheric background of GEM contributes significantly, due to its relatively long atmospheric lifetime of approximately 6–12 months. If a hypothetical background GEM concentration of 1.2 ng m−3 is subtracted from the Grand Bay annual means, a comparable reduction in this background-adjusted GEM concentration to GOM is seen. This suggests that the overall GOM level at this site might be strongly influenced by regional mercury emission sources, while the GEM level is influenced by both regional emissions and the global mercury pool. Similar correlation between decreasing trends in the observed Hg species and the reduction in local power-plant Hg emissions has been shown at rural sites in western Maryland [16,33], the northeastern U.S. [31], and a suburban site in Maryland [21]. The interannual variations in PBM mean concentrations do not follow the decreasing trend in the reported regional emissions. This might be due to complexities that arise from atmospheric chemical transformations among the different mercury forms, differences in trends between total mercury emissions and speciated mercury emissions, and/or mercury emissions not included in the emissions inventory data shown (e.g., releases from biomass burning).

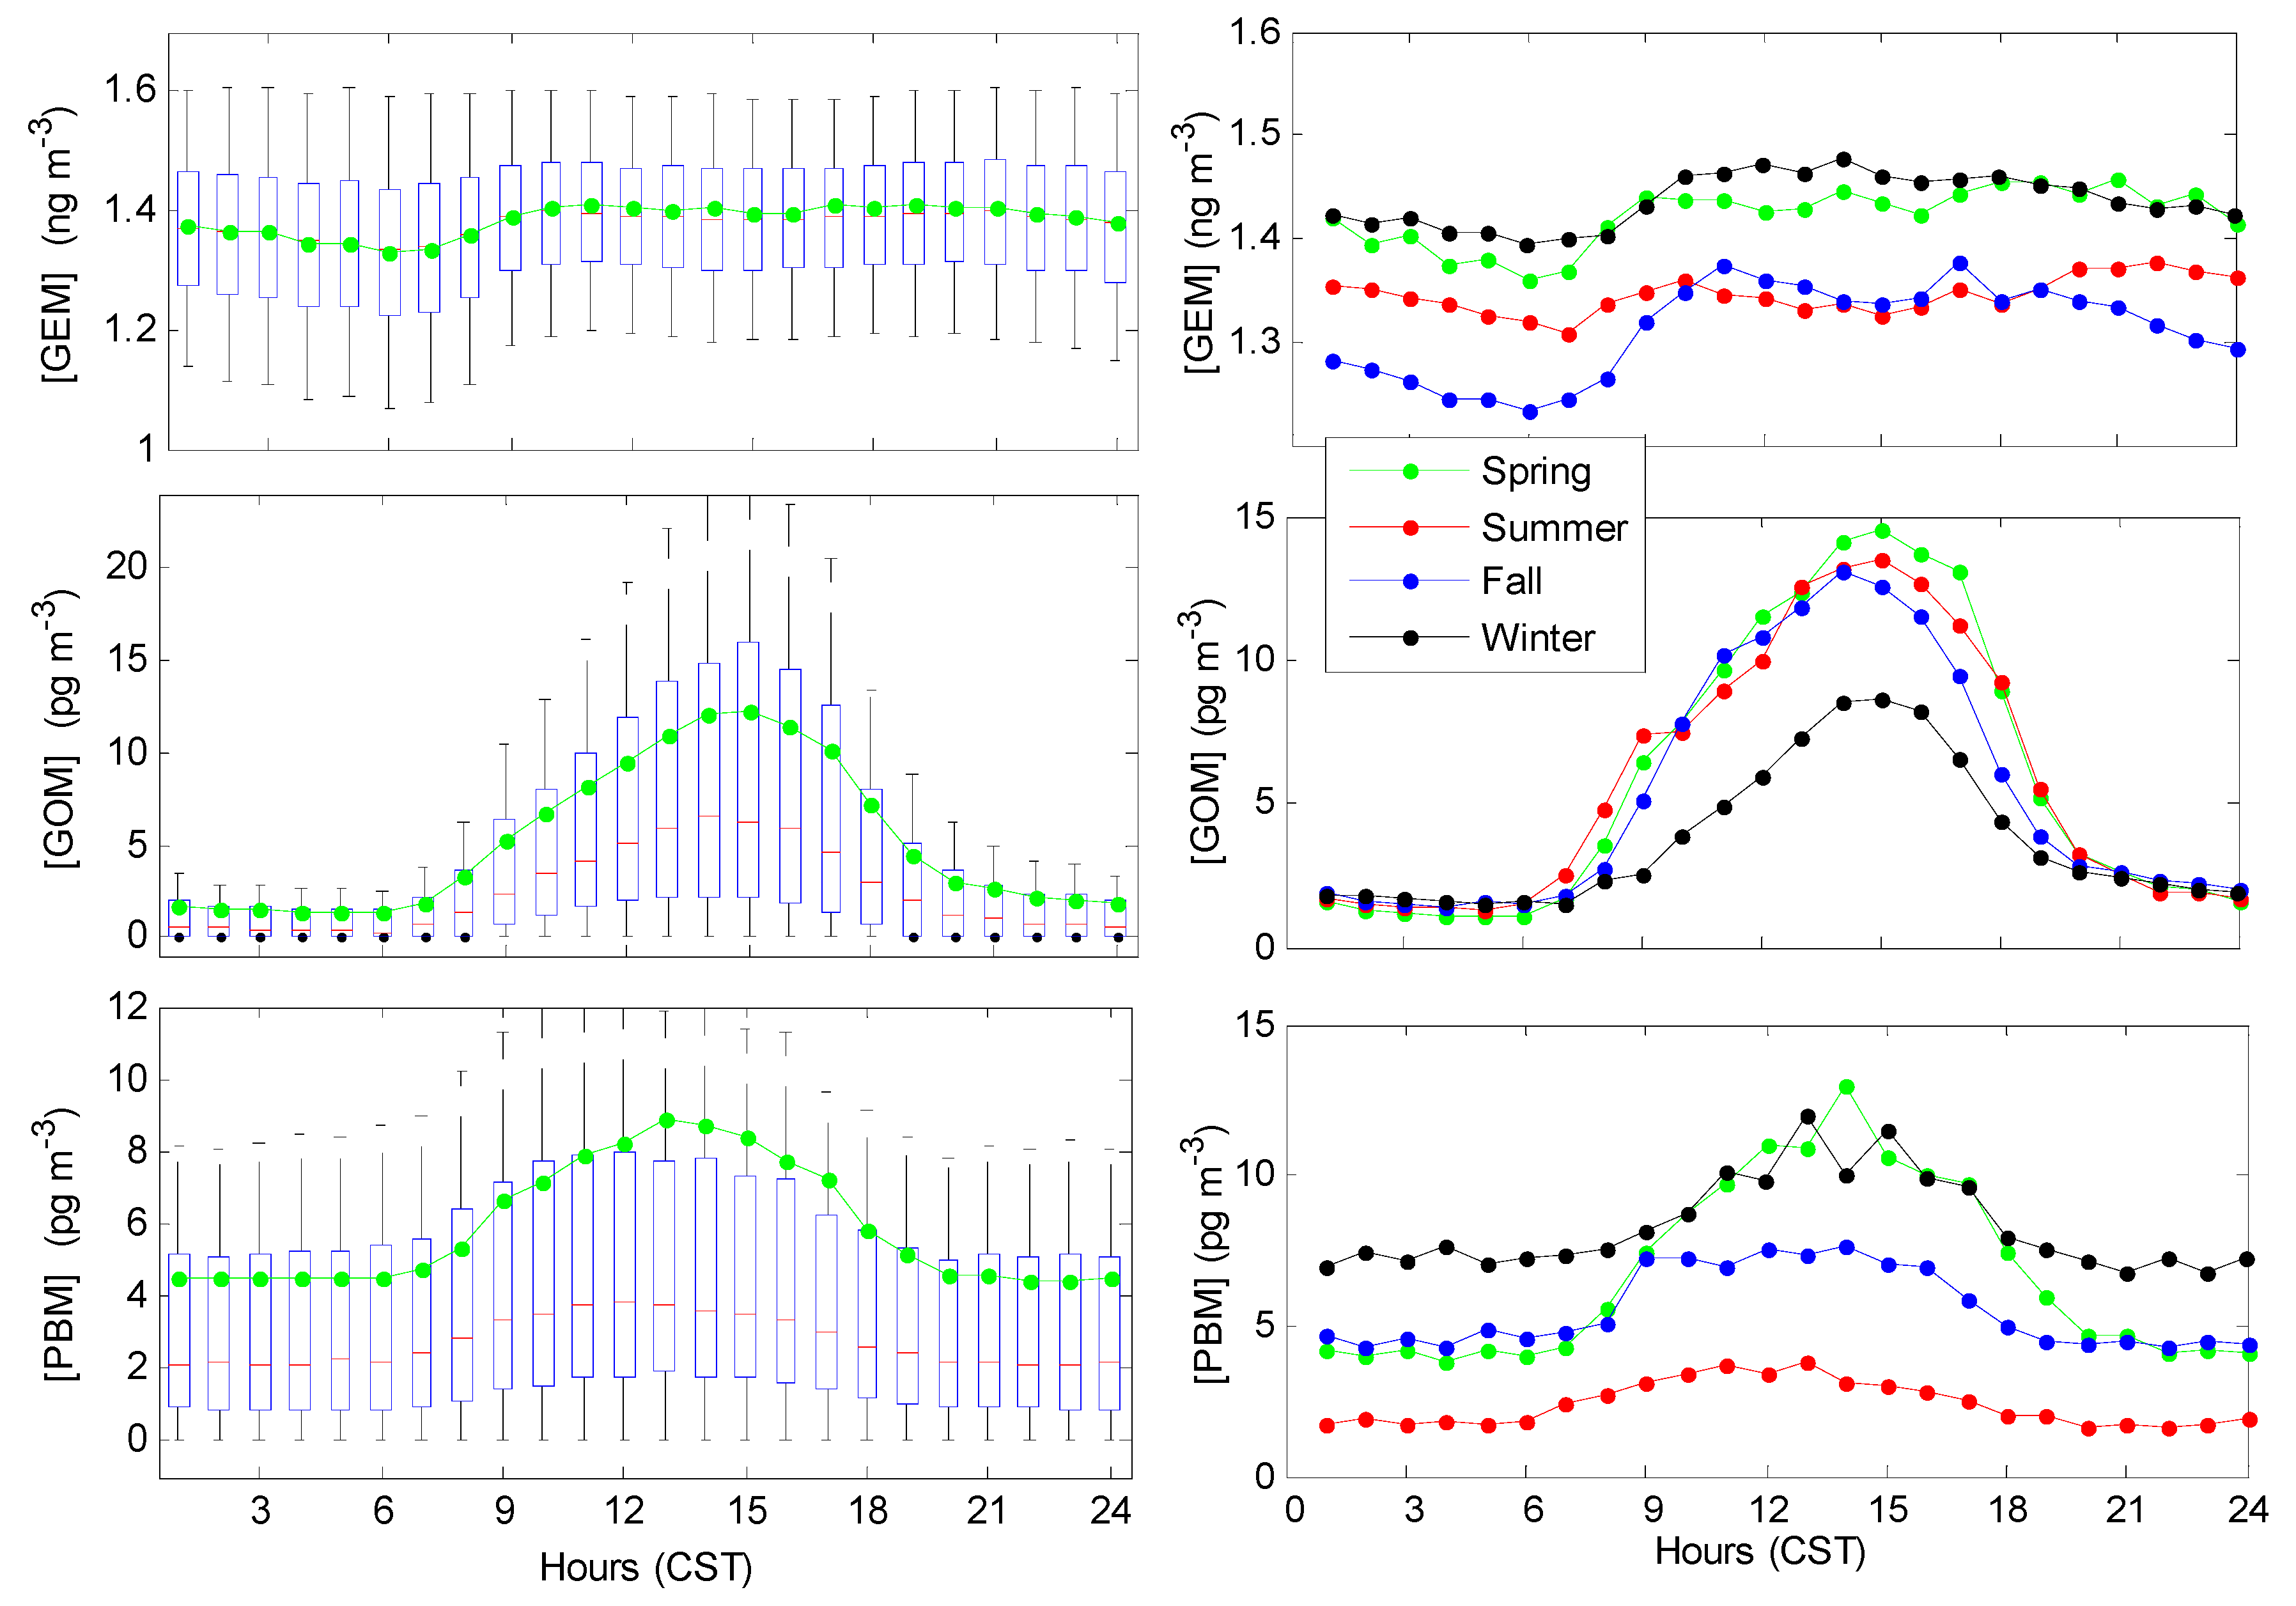
3.2. Seasonal Trends

The seasonal variation of GEM shows that its concentration was the lowest in fall at the Grand Bay site; the lowest monthly GEM concentration of 1.28 ng m−3 was observed in September, while the GEM concentrations were generally constant in winter and spring and slightly lower in summer (Figure 6). GOM concentration was highest in early summer and late fall and lowest in winter and summer; the highest monthly [GOM] of 7.4 pg m−3 was observed in June and the lowest monthly [GOM] of 2.9 pg m−3 in December. This is consistent with observations at several different sites in the southeastern U.S. [15,34]. The high [GOM] that was observed at this site in early summer and late fall might be associated to greater high pressure subsidence and a relatively long lifetime at the surface, due to the lower humidity and smaller rainfall in early summer and late fall (Figure 6) [21]. The seasonal PBM variation shows higher levels from late fall to early spring, with a mean [PBM] of 7.8 ± 0.8 pg m−3 from November to April, and lower levels from late spring to fall, with a mean [PBM] of 3.4 ± 1.5 pg m−3 (Figure 6). This seasonal variation of PBM is consistent with some other studies [15,21,35,36,37] and it might be, in part, due to increased gas to aerosol partitioning at lower temperatures in winter and higher removal by precipitation in summer.
The seasonal variation of mercury wet deposition exhibits a broad peak from late spring to early fall and the lowest values in late fall through winter, being roughly proportional to rainfall with the highest amount in summer and the lowest amount in fall and winter (Figure 6).

3.3. Diurnal Trends of Hg Speciation

The average diurnal variation of GEM at the Grand Bay site exhibits a few prominent features: decreasing levels after 21:00 Central Standard Time (CST)) with a minimum near daybreak (06:00 CST), increasing levels after 07:00 (CST) and reaching the maximum at around 10:00 (CST), and relatively constant levels during the day between 10:00 and 21:00 (CST) (Figure 7). The minimum GEM concentrations between 05:00–07:00 (CST) are due to GEM depletion events under high humidity conditions, which will be further discussed in Section 4.3. This low GEM concentration in the morning differs from the observations at polluted sites where a morning peak was usually observed due to the confinement of emissions in the shallow boundary layer [15,21,38].
GOM and PBM both show significant diurnal variations with broad peaks in the afternoon, with the amplitude of PBM peak being somewhat smaller than the GOM peak. These midday peaks are likely due to the production of reactive mercury from the photochemical oxidation of GEM and/or downward mixing of air aloft to the surface in the convective boundary layer. The maximum mean hourly [GOM] of 12.2 pg m−3 and the maximum mean hourly [PBM] of 8.8 pg m−3 appear at 15:00 and 13:00 (CST), respectively, thus making the peak of total reactive mercury (TRM = GOM + PBM) appear at 14:00 (CST, Figure S5). At night, GOM concentrations were usually 1–2 pg m−3, while PBM concentrations remained at 4–5 pg m−3 (Figure 7). Similar diurnal variations of GEM, GOM, and PBM were observed at three types of sites (coastal suburban, urban, and rural) in the southeast U.S. [15,34], as well as at rural sites in St. Anicet, Québec, Canada [39] and in Beltsville, Maryland [21]. The diurnal variations of GOM and PBM can also be influenced by planetary boundary layer dynamics, e.g., the depletion of surface layer concentrations due to atmospheric deposition from the relatively stable and shallow night-time boundary layer and subsequent replenishment from the downward mixing of air aloft with greater concentrations of mercury as the boundary layer expands during midday [21,34,38].
The interpretation of coastal measurements with this lens is complicated, though, as adjacent land and water surfaces often create conditions that dictate significantly different boundary layer heights and the transition zone between marine and terrestrial boundary layer regimes is relatively complex and uncertain. The sea-breeze phenomenon, which promotes flow from the ocean to the land during the day and from the land to the ocean at night, especially during the summer, is an additional meteorological factor that influences diurnal variations at the site. The higher GOM and PBM levels that were observed during the day could be, at least partially, due to the oxidation of GEM in the marine boundary layer brought onshore due to daytime sea-breeze flow. Finally, emissions from tall stacks, e.g., from coal-fired power plants in vicinity of the site, may sometimes be injected above the shallow night-time boundary layer and so be meteorologically disconnected from impacting surface measurement sites under those conditions.
Diurnal profiles in different seasons also show some interesting features (Figure 7, right-hand panels). Diurnal GEM concentrations are higher in winter and spring than in summer and fall. The morning GEM minimum is more prominent in fall than in other three seasons, because GEM depletion events usually occur during fog/dew events in fall under high humidity conditions. The daytime GOM levels are lower in winter than in the other three seasons, perhaps due to the lower photochemical production of GOM in winter, while nighttime GOM levels are similar for all four seasons. The PBM diurnal profile shows the lowest concentrations in summer than the other three seasons. The daytime PBM levels in winter are similar to those in spring, while, on average, the nighttime PBM levels are the highest in winter and the lowest in summer.

4. Discussion

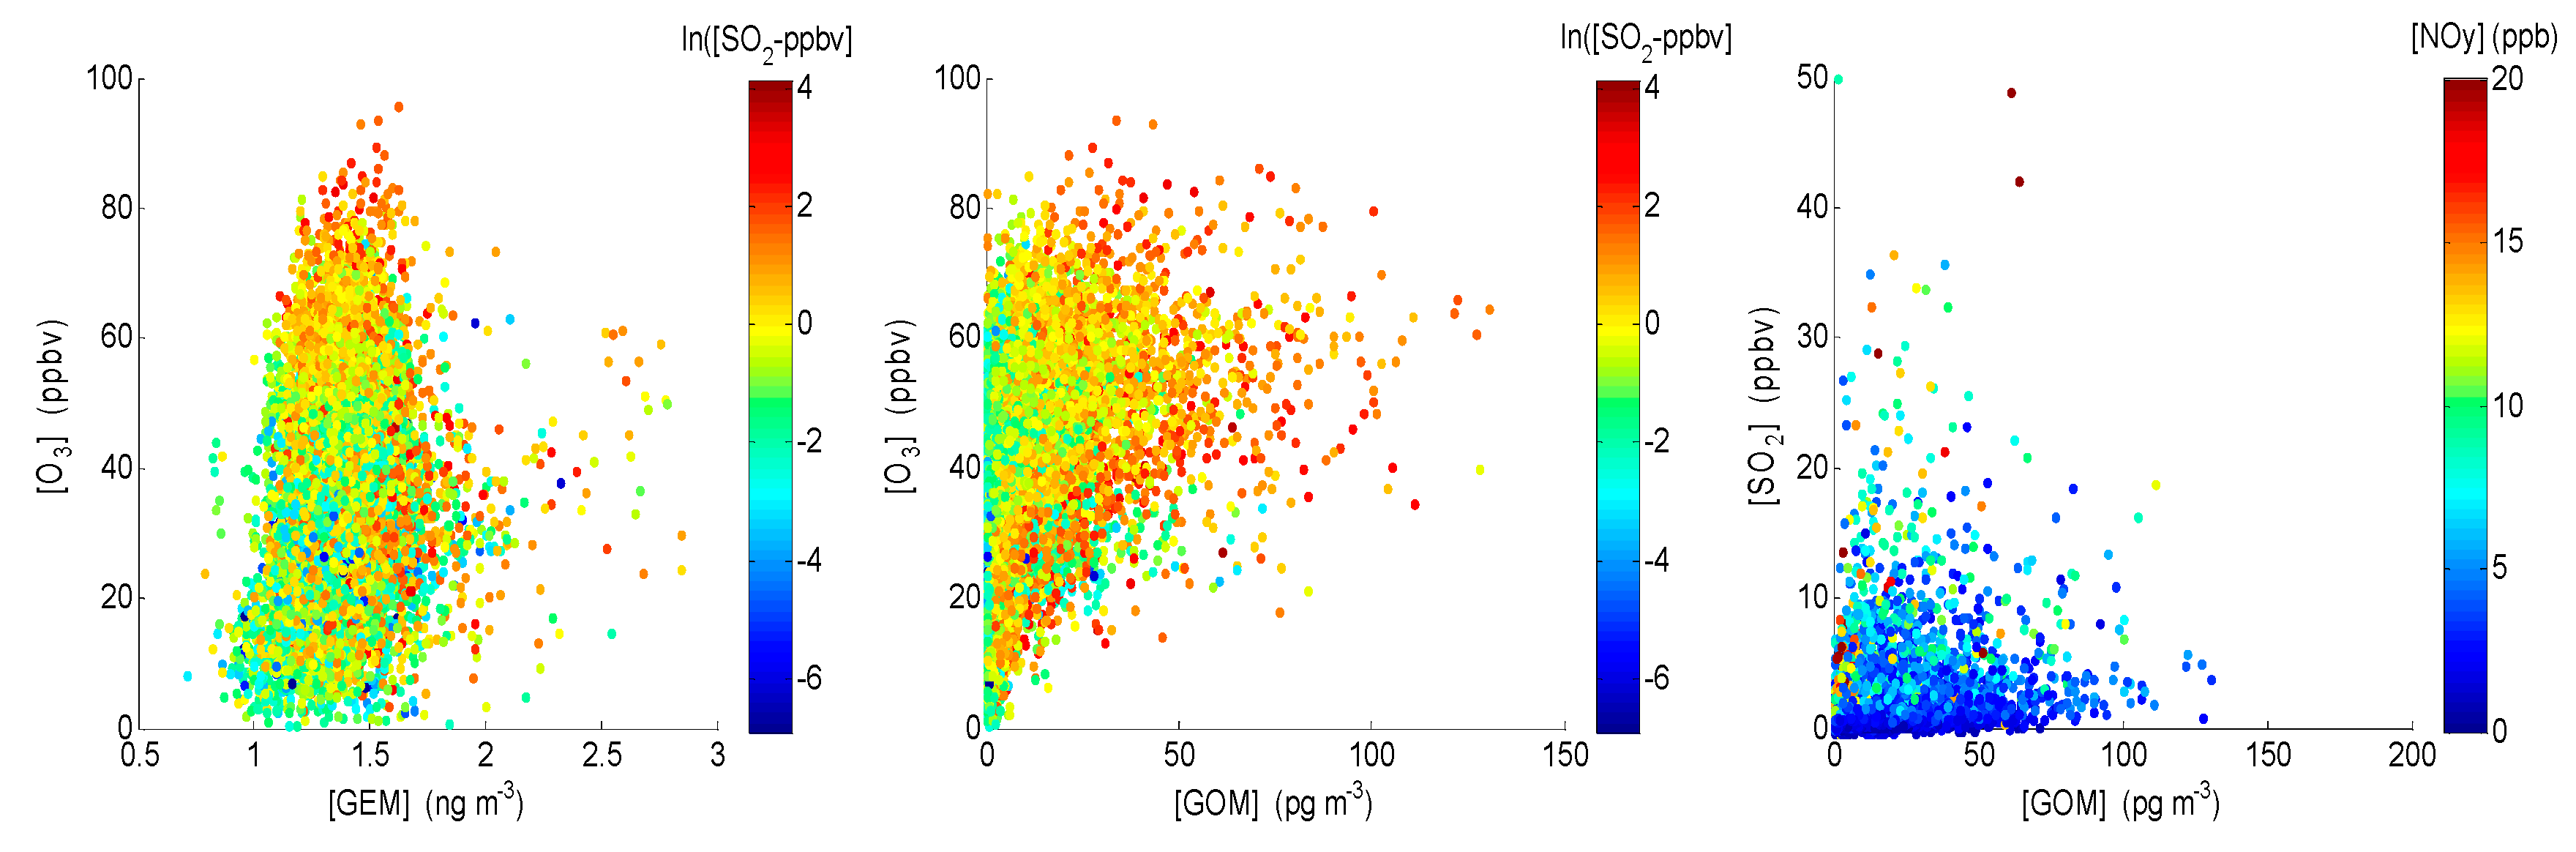
4.1. Correlation between Observed Mercury Species and Other Chemical Species

The correlation between Hg species, ozone, and SO2 can be used to differentiate the mercury sources between direct emissions (typically with narrow plumes of SO2 and Hg fumigating the site, leading to short-term spikes) and photochemical production of GOM and PBM (typically with longer duration increases during the day) because of some common emission sources for mercury and SO2, and ozone being a tracer for photochemical oxidation [20,21,34].
One example is the observations on 18–21 March 2011 when elevated GOM and O3 levels together with SO2 spikes were observed (Figure 8). On 18 March, ozone gradually increased from −10 ppbv in the early morning to −55 ppbv at noon and remained at this high level through midnight. Broad peaks of GOM (up to 53 pg m−3) and PBM (up to 5 pg m−3) were observed from the early morning to the late afternoon. SO2 remained at low levels of less than 1.5 ppbv until a peak of SO2 up to 9 ppbv appeared around midnight, with a simultaneous peak of GOM up to 30 pg m−3, while there was no significant enhancement in GEM or PBM. On 19 March, O3, GOM and PBM gradually increased after sunrise with broad peaks during the day, while SO2 remained at low levels below 1 ppbv and then gradually increased starting at noon, reaching a peak up to 15 ppbv between 17:00 and 18:00 with a simultaneous GOM peak up to 40 pg m−3. On 20 March, simultaneous peaks of SO2 (up to 5.5 ppbv) and GOM (up to 48 pg m−3) were observed between 07:00–10:00 in the morning. After noon, SO2 dropped to below 1 ppbv, while GOM remained at high levels up to 66 pg m−3 in the afternoon. These observed features might suggest different GOM sources contributing to ground-level concentrations at the Grand Bay site: direct emissions, intrusion of air aloft to the surface, and in-situ photochemical production.
Scatter plots of ozone versus GEM, GOM, and PBM that are colored by SO2 concentration also suggest these two sources of GOM. In general, high ozone and high GOM concentrations during the day (Figure 9) might suggest the photochemical production of GOM or intrusion of air aloft to the surface, while high GOM and SO2 concentrations at low O3 concentrations might point to direct emissions of GOM. The relatively good correlation between ozone and GOM does not necessarily prove that GEM is oxidized in sum or in part by ozone. There is substantial uncertainty regarding the overall relative importance of different potential GEM oxidizing agents (e.g., O3, OH, Br) and the spatio-temporal variability in relative importance [21,40]. In addition, the diurnal dynamics of the planetary boundary layer or seasonal dependence might also influence the correlation between GOM and O3, i.e., higher concentrations of GOM and O3 in spring. Finally, the correlation might simply reflect the common production of these species by tropospheric photochemical processes.
The diurnal variation of a pollutant, such as carbon monoxide (CO), which is relatively inactive chemically, and so can be considered a quasi-conservative tracer, can be used to help understand the impact of the boundary layer dynamics at the site. At the Grand Bay site from 2007 to 2018, the mean CO concentration was 148 ppbv during the day (defined by with solar radiation values greater than 10 W m−2) and 183 ppbv at night (solar radiation equal to zero). While using the mean CO concentration of 134 ppbv when the winds were from south-southeasterly (SSE) to south-southwesterly (SSW) as a regional background, the enhancement of CO is approximately 49 ppbv at night and 14 ppbv during the day above the background. All things being equal, this suggests that boundary layer dynamics—at least for low-elevation emission—may contribute to a dilution of approximately, a factor of 3.5 during the day. However, diurnal variations of local/regional CO emissions and the variation in atmospheric transport time from sources to our site complicate the interpretation. The mean GOM concentration that was measured at the Grand Bay site was 7.83 pg m−3 during the day, greater than the mean GOM concentration at night (2.52 pg m−3) by a factor of 3.1. Boundary layer dynamics no doubt play a role in the diurnal variations that were observed at this site, but other processes, such as direct emissions, photochemical oxidation, as well as dry and wet deposition also likely affect the GOM concentrations.
There is no strong correlation between GOM and SO2 (Figure 9), possibly suggesting a mix of primary sources of SO2 and GOM with varying emission characteristics, and different chemical processing and removal rates of SO2 and GOM during transport. The lack of correlation between GOM and PBM in all four seasons with correlation coefficients less than 0.1 (Figure S6) might suggest different sources and/or removal rates of these Hg species.

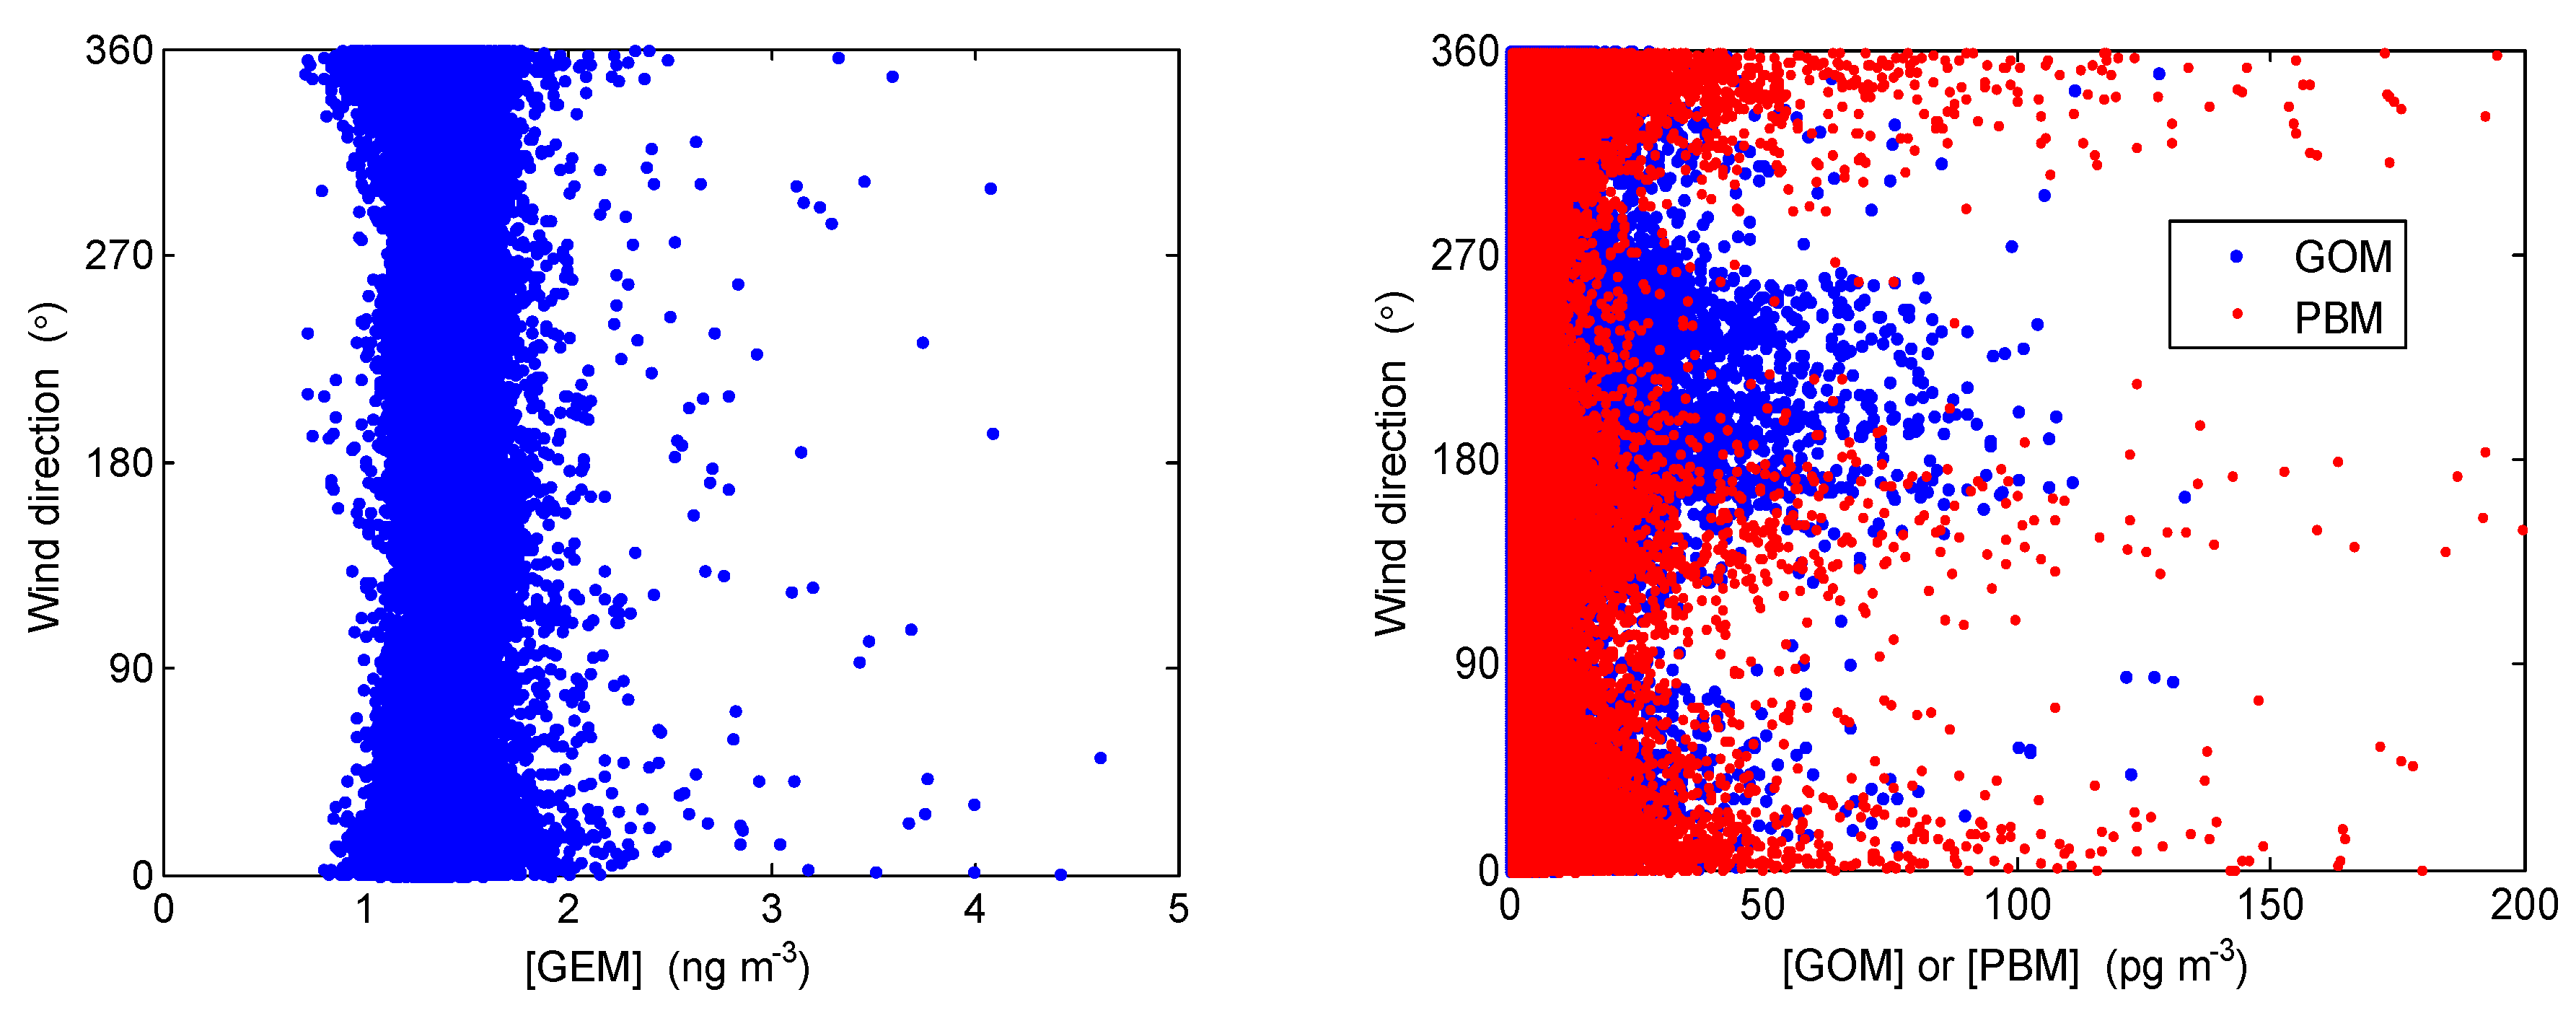
4.2. Correlation with Meteorological Parameters

Wind direction and wind speed can play an important role in enhanced GEM, GOM, and PBM concentrations. The highest concentrations of GOM and PBM were mainly observed in air masses from two wind sectors, as shown in Figure 10: southerly (from southeasterly to southwesterly with marine origins) and northerly (from northeasterly/northwesterly with continental origins). This is expected, as major mercury emission sources are mainly found in the northerly wind sectors from the site (Figure 1), while elevated GOM and PBM in southerly air masses were likely caused by the oxidation of GEM by halogens in the marine boundary layer [41,42,43].
On the other hand, GEM show little dependence on wind direction for its concentrations less than 10 ng m−3, while higher GEM concentrations (>10 ng m−3) were mainly observed in air masses coming from north (Figure 11). Wind directions that were associated with measurements were those measured at the site. Air masses likely did not travel a straight line in this direction, as they were transported to the site, though, and this is an acknowledged limitation to the interpretation of these wind-direction findings.
Anticorrelation between GOM and RH and between PBM and RH was observed, as we expect, because of the high deposition removal of GOM and PBM under high humidity conditions. Anticorrelation between Hg wet deposition and the sum of GOM and PBM due to depletion by precipitation scavenging but positive correlation between Hg wet deposition and rainfall were observed, as we would expect (Figure 12).

4.3. GEM Depletion Events

GEM depletion events were occasionally observed in the early morning hours under high humidity (with relative humidity (RH) largely > 80%) and relatively calm wind (with a mean wind speed of less than or equal to 1.5 m s−1) conditions (Figure 13). The winds were mostly from the north during these GEM depletion events, which suggests that the marine boundary layer might not play an important role in those events. This is different from the GEM depletion events that were observed in the marine boundary layer at Cape Point in South Africa [44], where GEM depletion events were mostly observed in the afternoon in air masses with a marine origin. Similar depletion events were also observed at a suburban site in Beltsville, Maryland [21], at a rural site in New England [45], and in a forest in Northeast China [46].
In polar regions, GEM can be quickly oxidized by reactive bromine species and its concentration reduction are well correlated with enhanced GOM concentrations [47,48,49,50]. However, during the GEM depletion events that were observed at the Grand Bay site, GOM and PBM concentrations were very low, with a mean concentration of 0.6 pg m−3 for GOM and of 3.4 pg m−3 for PBM (Figure 13). Observations of BrO at this site during the intensive study in 2011 show that peak BrO was observed in the midday while nighttime BrO concentration was close to zero [20]. Mao et al. [45] has proposed that the nighttime loss of GEM in forest areas is mainly caused by dry deposition with additional chemical oxidation by O3, OH, and NO3. The GEM depletion events that were observed in this study might be attributed to the plant uptake of GEM as suggested by Fu et al. [46]. Marsh grass and maritime forest of pine savannah in the surrounding area of the Grand Bay site could be responsible for the GEM uptake during GEM depletion events. Given the fact that the GEM depletion events occurred with high RH, it is possible that the plant uptake of GEM can also be enhanced by oxidation within dew or even low-level fog at the surface layer. Further investigation is needed to confirm this mechanism.
Standard additions of GEM were conducted at the Beltsville site in Maryland during GEM depletion events by introducing a known amount of GEM to both the sampling inlet and upstream of the denuder of the sampling unit on the tower. The Beltsville site was equipped with a similar mercury instrumentation as that at the Grand Bay site [21]. Figure 14 shows one example, with a GEM depletion event at Beltsville in the early morning of 12 August 2018. During this event, standard additions of GEM were conducted and the recovery of the GEM standard additions at the inlet on the tower remained relatively constant, which indicated that the observed GEM depletion was not a measurement artifact and it was not due to any potential losses of GEM in the ambient air through the sampling system.

5. Conclusions

Continuous observations of atmospheric speciated mercury and other chemical and meteorological parameters were made at the Grand Bay site in Mississippi for 12 years from 2007 to 2018. The results show that this rural site was affected by local and regional emission sources of mercury and other primary trace species with occasional transport-related episodes of higher concentrations, as well as photochemical processes and planetary boundary layer dynamics. During this period, the mean concentrations and standard deviations were 1.39 ± 0.22 ng m−3 for GEM, 5.1 ± 10.2 pg m−3 for GOM, 5.9 ± 13.0 pg m−3 for PBM, and 309 ± 407 ng m−2 wk−1 for mercury wet deposition. The GEM and GOM concentrations at this site have been slowly decreasing during this 12-year period, with a decrease rate of −0.6 ± 0.2% yr−1 for GEM and −7.1 ± 1.4% yr−1 for GOM, both being statistically significant. A slight increasing trend in PBM (3.5 ± 4.3% yr−1) was observed at this site, even though the trend is not statistically significant, given the variability of the data. Coincident with increases in the atmospheric PBM concentrations, Hg wet deposition has been slightly increasing at a rate of 2.8 ± 10.4 ng m−2 wk−1 yr−1 (0.9 ± 3.4% yr−1), although this trend is not statistically significant.
Lower GEM concentrations were observed in the early morning, especially during fog events with high humidity and weak winds in fall. The GEM depletion events were mainly observed in air masses coming from north with continental origins and likely due to the uptake by surrounding plants, which is perhaps enhanced by oxidation within surface moisture (e.g., dew) within a shallow night-time boundary layer. The slight elevation of GEM during the day is likely due to downward mixing of air masses with higher concentrations of GEM aloft. Diurnal variations of GOM and PBM both show peaks in the afternoon, likely due to the production of reactive mercury from the photochemical oxidation of GEM, but possibly also because of development of the midday convective boundary layer entraining air aloft. The seasonal variation of GEM shows higher levels in winter and spring and lower levels in summer and fall. GOM measurements show high levels in spring and consistently low levels in the other three seasons, while the PBM measurements exhibit higher levels from late fall to early spring and lower levels from late spring to fall. As expected, mercury wet deposition was the highest in the summer due to higher precipitation amounts.
Relationships between elevated GEM/GOM/PBM and wind direction indicate that mercury measurements at this site may be influenced by nearby mercury sources. Relationships among GOM, O3, and SO2 suggest different sources of GOM: direct emissions from mercury sources in situ photochemical production, and the transport of air aloft to the surface. This study indicates that the receptor site experienced impacts from mercury sources that are both local and regional in nature. The long-term monitoring data at this site will be further analyzed with the HYSPLIT trajectory and dispersion model to elucidate mercury source-receptor relationships in this coastal environment (Cohen et al., manuscript in preparation, 2020).

Supplementary Materials

The following are available online at https://www.mdpi.com/2073-4433/11/3/268/s1, Figure S1: Yearly variations of GEM, GOM, and PBM, Figure S2: The normalized cumulative concentration as a function of the normalized rank for GEM for each year from 2007–2018. Figure S3: Same as Figure S2 but for GOM, S4: Same as figure S2 but for PBM, Figure S5: Boxplots of total reactive mercury (TRM) measured at the Grand Bay site from 2007 to 2018, Figure S6: Correlation between PBM and GOM in four seasons.

Author Contributions

Conceptualization, W.T.L., M.D.C., X.R.; Methodology, W.T.L., P.K., M.D.C., X.R.; Software, X.R., M.D.C., P.K.; Validation, W.T.L., P.K., X.R.; Formal Analysis, X.R., M.D.C.; Investigation, X.R., W.T.L., P.K., M.D.C., M.L.O., J.W., R.C., M.A.; Resources, X.R.; Data Curation, X.R., W.T.L., P.K., M.D.C.; Writing—Original Draft Preparation, X.R.; Writing—Review & Editing, X.R., W.T.L., P.K., M.D.C., M.L.O., J.W., R.C., M.A., A.A.S.; Visualization, X.R., P.K., M.D.C.; Supervision, W.T.L., R.A., A.A.S.; Project Administration, W.T.L., R.A., A.A.S.; Funding Acquisition, R.A., A.A.S. All authors have read and agreed to the published version of the manuscript.

Funding

This study was supported by National Oceanic and Atmospheric Administration through the Cooperative Institute for Satellites Earth System Studies (Grant NA14NES4320003) at the University of Maryland.

Acknowledgments

The authors thank the NOAA Grand Bay NERR for cooperation in facilitating the field observations. The scientific results and conclusions, as well as any views or opinions expressed herein, are those of the authors and do not necessarily reflect the views of NOAA or the Department of Commerce.

Conflicts of Interest

The authors declare no conflict of interest.

References

  1. Choi, A.L.; Grandjean, P. Methylmercury exposure and health effects in humans. Environ. Chem. 2008, 5, 112–120. [Google Scholar] [CrossRef] [Green Version]
  2. Ruelas-Inzunza, J.; Delgado-Alvarez, C.; Frias-Espericueta, M.; Paez-Osuna, F. Mercury in the Atmospheric and Coastal Environments of Mexico. Rev. Environ. Contam. Toxicol. 2013, 226, 65–99. [Google Scholar]
  3. Gworek, B.; Dmuchowski, W.; Baczewska, A.H.; Bragoszewska, P.; Bemowska-Kalabun, O.; Wrzosek-Jakubowska, J. Air Contamination by Mercury, Emissions and Transformations-a Review. Water Air Soil Pollut. 2017, 228, 123. [Google Scholar] [CrossRef] [PubMed] [Green Version]
  4. Cohen, M.D.; Draxler, R.R.; Artz, R.S.; Blanchard, P.; Gustin, M.S.; Han, Y.J.; Holsen, T.M.; Jaffe, D.A.; Kelley, P.; Lei, H.; et al. Modeling the global atmospheric transport and deposition of mercury to the Great Lakes. Elem. Sci. Anthr. 2016, 4, 000118. [Google Scholar] [CrossRef] [Green Version]
  5. Zhang, L.M.; Lyman, S.; Mao, H.T.; Lin, C.J.; Gay, D.A.; Wang, S.X.; Gustin, M.S.; Feng, X.B.; Wania, F. A synthesis of research needs for improving the understanding of atmospheric mercury cycling. Atmos. Chem. Phys. 2017, 17, 9133–9144. [Google Scholar] [CrossRef] [Green Version]
  6. NPS. Fish Consumption Advisories. 2018. Available online: https://www.nps.gov/subjects/fishing/fish-consumption-advisories.htm (accessed on 5 December 2019).
  7. Evers, D.C.; DiGangi, J.; Petrlík, J.; Buck, D.G.; Šamánek, J.; Beeler, B.; Turnquist, M.A.; Hatch, S.K.; Regan, K. Global Mercury Hotspots: New Evidence Reveals Mercury Contamination Regularly Exceeds Health Advisory Levels in Humans and Fish Worldwide. BRI-IPEN Science Communications Series 2014-34. 2014. Available online: http://www.briloon.org/uploads/BRI_Documents/Mercury_Center/BRI-IPEN-report-update-102214%20for%20web.pdf (accessed on 5 December 2019).
  8. Fitzgerald, W.F.; Engstrom, D.R.; Mason, R.P.; Nater, E.A. The case for atmospheric mercury contamination in remote areas. Environ. Sci. Technol. 1998, 32, 1–7. [Google Scholar] [CrossRef]
  9. Schroeder, W.H.; Munthe, J. Atmospheric mercury—An overview. Atmos. Environ. 1998, 32, 809–822. [Google Scholar] [CrossRef]
  10. Lin, C.J.; Pehkonen, S.O. The chemistry of atmospheric mercury: A review. Atmos. Environ. 1999, 33, 2067–2079. [Google Scholar] [CrossRef]
  11. Harris, R.; Pollman, C.; Landing, W.; Evans, D.; Axelrad, D.; Hutchinson, D.; Morey, S.L.; Rumbold, D.; Dukhovskoy, D.; Adams, D.H.; et al. Mercury in the Gulf of Mexico: Sources to receptors. Environ. Res. 2012, 119, 42–52. [Google Scholar] [CrossRef] [Green Version]
  12. Butler, T.J.; Cohen, M.D.; Vermeylen, F.M.; Likens, G.E.; Schmeltz, D.; Artz, R.S. Regional precipitation mercury trends in the eastern USA, 1998–2005: Declines in the Northeast and Midwest, no trend in the Southeast. Atmos. Environ. 2008, 42, 1582–1592. [Google Scholar] [CrossRef]
  13. Coburn, S.; Dix, B.; Edgerton, E.; Holmes, C.D.; Kinnison, D.; Liang, Q.; ter Schure, A.; Wang, S.Y.; Volkamer, R. Mercury oxidation from bromine chemistry in the free troposphere over the southeastern US. Atmos. Chem. Phys. 2016, 16, 3743–3760. [Google Scholar] [CrossRef] [Green Version]
  14. Engle, M.A.; Tate, M.T.; Krabbenhoft, D.P.; Kolker, A.; Olson, M.L.; Edgerton, E.S.; DeWild, J.F.; McPherson, A.K. Characterization and cycling of atmospheric mercury along the central US Gulf Coast. Appl. Geochem. 2008, 23, 419–437. [Google Scholar] [CrossRef]
  15. Nair, U.S.; Wu, Y.L.; Walters, J.; Jansen, J.; Edgerton, E.S. Diurnal and seasonal variation of mercury species at coastal-suburban, urban, and rural sites in the southeastern United States. Atmos. Environ. 2012, 47, 499–508. [Google Scholar] [CrossRef]
  16. Castro, M.S.; Sherwell, J. Effectiveness of Emission Controls to Reduce the Atmospheric Concentrations of Mercury. Environ. Sci. Technol. 2015, 49, 14000–14007. [Google Scholar] [CrossRef] [PubMed]
  17. Horowitz, H.M.; Jacob, D.J.; Zhang, Y.X.; Dibble, T.S.; Slemr, F.; Amos, H.M.; Schmidt, J.A.; Corbitt, E.S.; Marais, E.A.; Sunderland, E.M. A new mechanism for atmospheric mercury redox chemistry: Implications for the global mercury budget. Atmos. Chem. Phys. 2017, 17, 6353–6371. [Google Scholar] [CrossRef] [Green Version]
  18. Ren, X.R.; Luke, W.T.; Kelley, P.; Cohen, M.; Ngan, F.; Artz, R.; Walker, J.; Brooks, S.; Moore, C.; Swartzendruber, P.; et al. Mercury Speciation at a Coastal Site in the Northern Gulf of Mexico: Results from the Grand Bay Intensive Studies in Summer 2010 and Spring 2011. Atmosphere 2014, 5, 230–251. [Google Scholar] [CrossRef] [Green Version]
  19. USEPA. Toxic Release Inventory. 2020. Available online: https://www.epa.gov/toxics-release-inventory-tri-program/tri-basic-data-files-calendar-years-1987-2018 (accessed on 13 January 2020).
  20. ESRI. USA National Land Cover Database 2011, Based on Data from the Multi-Resolution Land Characteristics Consortium; ESRI ArcGIS Data Server: Redlands, CA, USA, 2019. [Google Scholar]
  21. Ren, X.R.; Luke, W.T.; Kelley, P.; Cohen, M.D.; Artz, R.; Olson, M.L.; Schmeltz, D.; Puchalski, M.; Goldberg, D.L.; Ring, A.; et al. Atmospheric mercury measurements at a suburban site in the Mid-Atlantic United States: Inter-annual, seasonal and diurnal variations and source-receptor relationships. Atmos. Environ. 2016, 146, 141–152. [Google Scholar] [CrossRef] [Green Version]
  22. Gay, D.A.; Schmeltz, D.; Prestbo, E.; Olson, M.; Sharac, T.; Tordon, R. The Atmospheric Mercury Network: Measurement and initial examination of an ongoing atmospheric mercury record across North America. Atmos. Chem. Phys. 2013, 13, 11339–11349. [Google Scholar] [CrossRef] [Green Version]
  23. Gustin, M.S.; Huang, J.Y.; Miller, M.B.; Peterson, C.; Jaffe, D.A.; Ambrose, J.; Finley, B.D.; Lyman, S.N.; Call, K.; Talbot, R.; et al. Do We Understand What the Mercury Speciation Instruments Are Actually Measuring? Results of RAMIX. Environ. Sci. Technol. 2013, 47, 7295–7306. [Google Scholar] [CrossRef]
  24. Lyman, S.N.; Cheng, I.; Gratz, L.E.; Weiss-Penzias, P.; Zhang, L. An updated review of atmospheric mercury. Sci. Total Environ. 2020, 707, 135575. [Google Scholar] [CrossRef]
  25. Lyman, S.N.; Jaffe, D.A.; Gustin, M.S. Release of mercury halides from KCl denuders in the presence of ozone. Atmos. Chem. Phys. 2010, 10, 8197–8204. [Google Scholar] [CrossRef] [Green Version]
  26. McClure, C.D.; Jaffe, D.A.; Edgerton, E.S. Evaluation of the KCI Denuder Method for Gaseous Oxidized Mercury using HgBr2 at an In-Service AMNet Site. Environ. Sci. Technol. 2014, 48, 11437–11444. [Google Scholar] [CrossRef]
  27. Holland, S.P.; Mansur, E.T.; Muller, N.; Yates, A.J. Decompositions and Policy Consequences of an Extraordinary Decline in Air Pollution from Electricity Generation; National Bureau of Economic Research: Cambridge, MA, USA, 2018. [Google Scholar]
  28. Mann, H.B. Nonparametric tests against trend. Econometrica 1945, 13, 245–259. [Google Scholar] [CrossRef]
  29. Kendall, M.G. Rank Correlation Methods; Griffin: London, UK, 1975. [Google Scholar]
  30. Weiss-Penzias, P.S.; Gay, D.A.; Brigham, M.E.; Parsons, M.T.; Gustin, M.S.; ter Schure, A. Trends in mercury wet deposition and mercury air concentrations across the US and Canada. Sci. Total Environ. 2016, 568, 546–556. [Google Scholar] [CrossRef] [PubMed]
  31. Zhou, H.; Zhou, C.L.; Lynam, M.M.; Dvonch, J.T.; Barres, J.A.; Hopke, P.K.; Cohen, M.; Holsen, T.M. Atmospheric Mercury Temporal Trends in the Northeastern United States from 1992 to 2014: Are Measured Concentrations Responding to Decreasing Regional Emissions? Environ. Sci. Technol. Lett. 2017, 4, 91–97. [Google Scholar] [CrossRef]
  32. UNEP. Global Mercury Assessment 2018; UN Environment Programme, Chemicals and Health Branch: Geneva, Switzerland, 2019. [Google Scholar]
  33. Cheng, I.; Zhang, L.M.; Castro, M.; Mao, H.T. Identifying Changes in Source Regions Impacting Speciated Atmospheric Mercury at a Rural Site in the Eastern United States. J. Atmos. Sci. 2017, 74, 2937–2947. [Google Scholar] [CrossRef]
  34. Gustin, M.S.; Weiss-Penzias, P.S.; Peterson, C. Investigating sources of gaseous oxidized mercury in dry deposition at three sites across Florida, USA. Atmos. Chem. Phys. 2012, 12, 9201–9219. [Google Scholar] [CrossRef] [Green Version]
  35. Poissant, L.; Pilote, M.; Beauvais, C.; Constant, P.; Zhang, H.H. A year of continuous measurements of three atmospheric mercury species (GEM, RGM and Hg-p) in southern Quebec, Canada. Atmos. Environ. 2005, 39, 1275–1287. [Google Scholar] [CrossRef]
  36. Schleicher, N.J.; Schafer, J.; Blanc, G.; Chen, Y.; Chai, F.; Cen, K.; Norra, S. Atmospheric particulate mercury in the megacity Beijing: Spatiotemporal variations and source apportionment. Atmos. Environ. 2015, 109, 251–261. [Google Scholar] [CrossRef]
  37. Xu, L.L.; Chen, J.S.; Niu, Z.C.; Yin, L.Q.; Chen, Y.T. Characterization of mercury in atmospheric particulate matter in the southeast coastal cities of China. Atmos. Pollut. Res. 2013, 4, 454–461. [Google Scholar] [CrossRef] [Green Version]
  38. Brooks, S.; Luke, W.; Cohen, M.; Kelly, P.; Lefer, B.; Rappengluck, B. Mercury species measured atop the Moody Tower TRAMP site, Houston, Texas. Atmos. Environ. 2010, 44, 4045–4055. [Google Scholar] [CrossRef]
  39. Poissant, L. Potential sources of atmospheric total gaseous mercury in the St. Lawrence River valley. Atmos. Environ. 1999, 33, 2537–2547. [Google Scholar] [CrossRef]
  40. Ariya, P.A.; Amyot, M.; Dastoor, A.; Deeds, D.; Feinberg, A.; Kos, G.; Poulain, A.; Ryjkov, A.; Semeniuk, K.; Subir, M.; et al. Mercury Physicochemical and Biogeochemical Transformation in the Atmosphere and at Atmospheric Interfaces: A Review and Future Directions. Chem. Rev. 2015, 115, 3760–3802. [Google Scholar] [CrossRef] [PubMed]
  41. Kalinchuk, V.; Lopatnikov, E.; Astakhov, A. Gradient measurements of gaseous elemental mercury (Hg-0) in the marine boundary layer of the northwest Sea of Japan (East Sea). Environ. Pollut. 2018, 237, 1124–1136. [Google Scholar] [CrossRef] [PubMed]
  42. Wang, F.; Saiz-Lopez, A.; Mahajan, A.S.; Martin, J.C.G.; Armstrong, D.; Lemes, M.; Hay, T.; Prados-Roman, C. Enhanced production of oxidised mercury over the tropical Pacific Ocean: A key missing oxidation pathway. Atmos. Chem. Phys. 2014, 14, 1323–1335. [Google Scholar] [CrossRef] [Green Version]
  43. Ye, Z.Y.; Mao, H.T.; Lin, C.J.; Kim, S.Y. Investigation of processes controlling summertime gaseous elemental mercury oxidation at midlatitudinal marine, coastal, and inland sites. Atmos. Chem. Phys. 2016, 16, 8461–8478. [Google Scholar] [CrossRef] [Green Version]
  44. Brunke, E.G.; Labuschagne, C.; Ebinghaus, R.; Kock, H.H.; Slemr, F. Gaseous elemental mercury depletion events observed at Cape Point during 2007–2008. Atmos. Chem. Phys. 2010, 10, 1121–1131. [Google Scholar] [CrossRef] [Green Version]
  45. Mao, H.; Talbot, R.W.; Sigler, J.M.; Sive, B.C.; Hegarty, J.D. Seasonal and diurnal variations of Hg degrees over New England. Atmos. Chem. Phys. 2008, 8, 1403–1421. [Google Scholar] [CrossRef] [Green Version]
  46. Fu, X.W.; Zhu, W.; Zhang, H.; Sommar, J.; Yu, B.; Yang, X.; Wang, X.; Lin, C.J.; Feng, X.B. Depletion of atmospheric gaseous elemental mercury by plant uptake at Mt. Changbai, Northeast China. Atmos. Chem. Phys. 2016, 16, 12861–12873. [Google Scholar] [CrossRef] [Green Version]
  47. Lindberg, S.E.; Brooks, S.; Lin, C.J.; Scott, K.J.; Landis, M.S.; Stevens, R.K.; Goodsite, M.; Richter, A. Dynamic oxidation of gaseous mercury in the Arctic troposphere at polar sunrise. Environ. Sci. Technol. 2002, 36, 1245–1256. [Google Scholar] [CrossRef]
  48. Obrist, D.; Tas, E.; Peleg, M.; Matveev, V.; Fain, X.; Asaf, D.; Luria, M. Bromine-induced oxidation of mercury in the mid-latitude atmosphere. Nat. Geosci. 2011, 4, 22–26. [Google Scholar] [CrossRef]
  49. Steffen, A.; Lehnherr, I.; Cole, A.; Ariya, P.; Dastoor, A.; Durnford, D.; Kirk, J.; Pilote, M. Atmospheric mercury in the Canadian Arctic. Part I: A review of recent field measurements. Sci. Total Environ. 2015, 509, 3–15. [Google Scholar] [CrossRef] [PubMed]
  50. Wang, S.Y.; McNamara, S.M.; Moore, C.W.; Obrist, D.; Steffen, A.; Shepson, P.B.; Staebler, R.M.; Raso, A.R.W.; Pratt, K.A. Direct detection of atmospheric atomic bromine leading to mercury and ozone depletion. Proc. Natl. Acad. Sci. USA 2019, 116, 14479–14484. [Google Scholar] [CrossRef] [PubMed] [Green Version]
Figure 1. Mercury air emissions point sources in the Grand Bay region based on the Toxic Release Inventory [19]. Symbols on the maps are scaled based on emissions in 2007 and the bar graphs near large and/or nearby sources show the time series of annual mercury emissions from 2007–2018 (kg yr−1). Land cover categories shown on the maps are based on 2011 National Land Cover Database [20].
Atmosphere 11 00268 g001
Figure 2. Left: the 10-m measurement tower at the Grand Bay site, showing two sets of Tekran collection units for gaseous elemental mercury (GEM), gaseous oxidized mercury (GOM), and particulate-bound mercury (PBM). Middle: instruments to measure mercury and chemical species inside a climate-controlled trailer adjacent to the tower. Right: precipitation collectors for National Acid Deposition Program’s Mercury Deposition Network and National Trends Network at the site to measure mercury wet deposition and precipitation chemistry.
Atmosphere 11 00268 g002
Figure 3. Top panels: Frequency distributions of hourly measurements of GEM (left), GOM (middle), and PBM (right) at the Grand Bay site from 2007 to 2018. All GEM, GOM, and PBM data, including zero values for GOM and PBM concentrations, are plotted. The intervals of the bins are 0.05 ng m−3 for GEM and 0.5 pg m−3 for GOM and PBM. Bottom panels: the cumulative concentration as a function of rank for GEM (left), GOM (middle), and PBM (right) concentrations. The y-axis and x-axis are normalized to show fractions of the total.
Atmosphere 11 00268 g003
Figure 4. Time series of GEM (a), GOM (b), PBM (c), and mercury wet deposition (d) measured at the Grand Bay site from 2007 to 2018. The individual points show hourly averaged atmospheric mercury concentrations in (a–c) and Hg wet deposition in weekly samples in (d). The linked green circles are quarterly mean mercury concentrations and Hg wet deposition. The red dashed lines represent linear regressions of the quarterly means over 2007–2018. The GEM and GOM trends are statistically significant (p-value < 0.01) but the PBM and Hg wet deposition trends are not (p-value > 0.01).
Atmosphere 11 00268 g004
Figure 5. Time series of point-source anthropogenic mercury air emissions in different distance ranges away from the Grand Bay site [19] and annual mean concentrations of GEM, GOM, and PBM from 2007 to 2018. The mean concentrations of GEM minus a hypothetical background concentration of 1.2 ng m−3 is also shown.
Atmosphere 11 00268 g005
Figure 6. Boxplots showing composite seasonal variations of GEM, GOM, PBM, and Hg wet deposition measured at the Grand Bay site from 2007 to 2018. On each box, the central mark is the median, the edges of the box are the 25th and 75th percentiles, and the whiskers extend to the 5th and 95th percentiles. The linked green squares are composite monthly means. The linked black circles in the bottom panel are the composite monthly precipitation amounts (units: mm × 5).
Atmosphere 11 00268 g006
Figure 7. Left: Boxplots showing composite diurnal variations of GEM (top), GOM (middle), and PBM (bottom) measured at the Grand Bay site from 2007 to 2018. On each box, the central mark is the median, the edges of the box are the 25th and 75th percentiles, and the whiskers extend to the 5th and 95th percentiles. The linked green circles are hourly means. Right: Mean composite diurnal variations of GEM (top), GOM (middle), and PBM (bottom) for four seasons: spring (March–May), summer (June–August), fall (September–November), and winter (December–February). Times are Central Standard Time (CST).
Atmosphere 11 00268 g007
Figure 8. Time series of GEM, GOM, PBM, ozone, and SO2 concentrations on three days in March 2011.
Atmosphere 11 00268 g008
Figure 9. Scatter plot of ozone versus GEM (left) and GOM (middle) colored with ln([SO2 ppb]), as well as SO2 versus GOM colored with NOY concentrations (right) for the daytime data (with solar radiation greater than 20 W m−2) collected at the Grand Bay site from 2007 to 2018.
Atmosphere 11 00268 g009
Figure 10. Relationships between wind direction and GEM (top) and between wind direction and GOM or PBM (bottom). Individual data points are hourly averaged measurements at the Grand Bay site from 2007 to 2018.
Atmosphere 11 00268 g010
Figure 11. Relationships between wind direction and GEM (left) and between wind direction and GOM (middle) or PBM (right). Individual data points are hourly averaged measurements.
Atmosphere 11 00268 g011
Figure 12. GOM (left) and PBM (middle) versus relative humidity (RH) colored by SO2 concentration. (Right): [GOM] + [PBM] versus mercury wet deposition colored with rainfall at the Grand Bay site from 2007–2018.
Atmosphere 11 00268 g012
Figure 13. An example of GEM depletion events observed on 1–2 November 2009 (left), wind rose plot for GEM (middle) during GEM depletion events, and GEM versus RH (right) during GEM depletion events observed at the Grand bay site from 2007–2018. Data were filtered with [GEM] less than 1.0 ng m−3 and were limited to the early morning hours only from 02:00–08:00 (CST) when the GEM depletion events occurred.
Atmosphere 11 00268 g013
Figure 14. Time series of ambient [GEM] and GEM recovery with standard additions to both the inlet and upstream of the denuder of the sampling unit on the tower at the Beltsville site on August 11 and 12, 2018. The GEM recovery is expressed as fractions and is calculated by the equation of ([GEM]sa − [GEM]amb)* Sample Volume/(GEM amount injected), where [GEM]sa is the total [GEM] concentration (ambient [GEM] + added [GEM]) during standard additions, [GEM]amb is the ambient GEM concentration, which is calculated as the mean of the GEM concentrations before and after the standard addition. The injected GEM amount is calculated from the the mercury source permeation rate times the permeation source injection time.
Atmosphere 11 00268 g014
Table 1. Statistics of measured hourly concentrations of GEM, GOM, and PBM at the Grand Bay site in Mississippi. Minimum concentrations for GOM and PBM were zero (not shown). Overall statistics are shown in bold.
Year [GEM] (ng m−3)[GOM] (pg m−3)[PBM] (pg m−3)
MinMaxMedianMean ± σMaxMedianMean ± σMaxMedianMean ± σ
20070.858.01.401.41 ± 0.291401.24.0 ± 8.71121.72.8 ± 4.3
20080.796.11.401.40 ± 0.162562.17.5 ± 15.2522.63.8 ± 4.1
20090.718.11.371.37 ± 0.171331.75.2 ± 9.4462.13.6 ± 4.4
20100.922.81.401.39 ± 0.121301.76.1 ± 12.13644.69.4 ± 17.5
20110.7916.01.451.44 ± 0.231271.76.4 ± 11.74702.94.9 ± 8.7
20120.8313.81.371.38 ± 0.25981.54.8 ± 8.94642.34.4 ± 10.4
20130.867.81.411.43 ± 0.321042.25.5 ± 9.71002.44.4 ± 7.5
20140.709.71.391.41 ± 0.34941.84.5 ± 7.69705.312.3 ± 28
20150.729.31.321.34 ± 0.23711.93.5 ± 4.81927.114.1 ± 19.4
20160.823.71.331.33 ± 0.14421.42.9 ± 4.5612.33.9 ± 5.2
20170.832.241.311.31 ± 0.14460.892.7 ± 4.8340.61.2 ± 2.2
20180.742.201.311.31 ± 0.132701.5 ± 3.01742.35.0 ± 12.2
All0.7016.01.381.39 ± 0.222561.65.1 ± 10.29702.75.9 ± 13.0

