Article

Classification of Clouds Sampled at the Puy de Dôme Station (France) Based on Chemical Measurements and Air Mass History Matrices

1
Laboratoire de Météorologie Physique, UMR 6016, CNRS, Université Clermont Auvergne, 63178 Aubière, France
2
Observatoire de Physique du Globe de Clermont-Ferrand, UMS 833, CNRS, Université Clermont Auvergne, 63178 Aubière, France
3
Commissariat à L’énergie Atomique et aux Énergies Alternatives (CEA, DAM, DIF), 91297 Arpajon, France
4
Université Clermont Auvergne, CNRS, SIGMA Clermont, Institut de Chimie de Clermont-Ferrand, F-63000 Clermont-Ferrand, France
*
Authors to whom correspondence should be addressed.
Now at Institute for Atmospheric and Earth System Research/Physics, Faculty of Science, University of Helsinki, FI-00014 Helsinki, Finland.
Atmosphere 2020, 11(7), 732; https://doi.org/10.3390/atmos11070732
Submission received: 12 June 2020 / Revised: 4 July 2020 / Accepted: 7 July 2020 / Published: 10 July 2020
(This article belongs to the Special Issue Atmospheric Aqueous-Phase Chemistry)

Abstract

:
A statistical analysis of 295 cloud samples collected at the Puy de Dôme station in France (PUY), covering the period 2001–2018, was conducted using principal component analysis (PCA), agglomerative hierarchical clustering (AHC), and partial least squares (PLS) regression. Our model classified the cloud water samples on the basis of their chemical concentrations and of the dynamical history of their air masses estimated with back-trajectory calculations. The statistical analysis split our dataset into two sets, i.e., the first set characterized by westerly air masses and marine characteristics, with high concentrations of sea salts and the second set having air masses originating from the northeastern sector and the “continental” zone, with high concentrations of potentially anthropogenic ions. It appears from our dataset that the influence of cloud microphysics remains minor at PUY as compared with the impact of the air mass history, i.e., physicochemical processes, such as multiphase reactivity.

1. Introduction

The chemical composition of cloud water has revealed the high complexity of this medium [1], resulting from the cloud scavenging of soluble gases, the dissolution of the soluble fraction of the aerosol acting as cloud condensation nuclei (CCN), and from aqueous phase reactions [2]. Additionally, recent studies have shown that microbial activity altered the cloud water chemical composition [3,4,5]. Therefore, cloud water is composed of a mixture of complex inorganic and organic compounds with strong oxidants which have been shown to drive aqueous phase transformations in the presence of solar radiation [6,7].
Studies devoted to the analysis of the chemical composition and to its variability have aimed to better understand several atmospheric physicochemical processes such as droplet activation and growth, production and consumption of chemical compounds, as well as transport and deposition by precipitation of pollutants. Many field studies have reported in cloud production of low-volatility products [8,9]. The production of strong acids such as sulfates has been highlighted in the cloud aqueous phase leading to acidification, a process that controls both the phase partitioning and chemical reaction rates [10] and is responsible for the widely known phenomenon of acid rain [11,12]. Oxidative cloud processing was suggested to form secondary organic aerosol (aqSOA) through functionalization of dissolved organic compounds [13]. These aqueous phase transformations alter particle properties in terms of mass, chemical composition, hygroscopicity, and oxidation state [14], also affecting their CCN ability. Variability of solute concentrations together with drop size distribution have been observed in many field studies, revealing variations of the CCN composition with particle size and the dependency of some processes (dissolution of soluble gases and condensational growth) on drop size [15,16,17]. In cloud scavenging efficiencies have also been investigated by simultaneously measuring cloud water concentrations and interstitial particulate or gaseous concentrations [18,19,20]. Deviations, up to a few orders of magnitude from Henry’s law equilibrium, have been reported for carbonyl compounds with low effective water solubility [21,22] which suggested a more efficient scavenging of organic compounds by cloud water than expected. Deposition through precipitation of the scavenged chemical compounds removes large amounts of organic and inorganic pollutants from the atmosphere providing a significant contribution of nutrients (positive inputs) and pollutants (negative inputs) in various ecosystems [23,24].
Cloud water studies have been conducted over various continents [1] including Europe [25,26,27,28], Asia [7,29,30,31], North and South America [1,32,33,34], as well as in contrasted environments (polluted, marine, and remote). Significant developments have been implemented to enhance the collection efficiency of cloud collectors [35,36,37] and to better characterize the molecular composition by targeted or non-targeted methods, often using mass spectrometry [3,20,38]. Those studies mostly investigated the temporal variability of cloud chemical composition, as well as the transport of air masses and the physicochemical processes [30,33]. However, most of these field campaigns were performed over short-term periods due, in part, to the inherent difficulty of collecting clouds. A few sites have continuously collected cloud water over long-term periods such as the Puy de Dôme station in France (PUY) [39], Mt. Brocken in Germany [40], Whiteface Mountain in USA [32], Mt. Oyama in Japan [41] and Mt. Tai in China [31]. These mountain sites offer facilities to sample clouds under optimal conditions and to conserve quality homogeneity of chemical analysis on a long-term basis. These stations have a relatively high altitude, i.e., hundreds of meters above the surrounding plains, where cloud formation occurs, optimizing collection efficiency and sampling air masses from varied origins, throughout the year.
The present study aims at analyzing a long-term dataset of the chemical composition of cloud water samples at PUY. This remote site is influenced by long-range transport [42,43] and the proposed study has the objective to provide information on the physicochemical variability of air masses on a regional scale. For this, cloud water chemical composition is used to constrain a multivariate statistical analysis and propose a chemical classification of the sampled clouds. Then, this classification is combined to a numerical analysis using the CAT model (computing advection-interpolation of atmospheric parameters and trajectory tool) [39,44]. This model simulates the atmospheric transport of air masses and provides zone and sector matrices. Thereby, in regards to the basic back-trajectory methods [45], the CAT model brings additional information, and completes more robust statistical analyses, such as partial least squares (PLS) regressions between chemical and air mass history matrices. A specific point is addressed by the comparison of a previous cloud classification at PUY [46] and the identification of PUY’s specificities, with similar studies [33,45,47,48,49]. Monitoring over 18 years also reveals some trends, both in terms of chemical concentrations and history of air masses that are discussed in this paper. Such a long-term monitoring avoids numerous statistical biases encountered in short-time field campaigns. The statistical information on the variability of chemical composition as a function of environmental factors (i.e., source regions) is also helpful for evaluating the extent of oceanic vs. continental influences and to define environmental contrasted scenarios for modeling purposes. Finally, the effect of cloud physics or air mass history on the chemical composition of clouds sampled at PUY is estimated.

2. Experiments

2.1. Cloud Sampling

Sampling was performed at PUY (45.7722° N, 2.9648° E), which belongs to several international networks as follows: EMEP (the European Monitoring and Evaluation Programme), GAW (Global Atmosphere Watch), and ACTRIS (Aerosols, Clouds, and Trace Gases Research Infrastructure). The observatory chalet is on top of a monogenetic volcano rising above the surrounding area with a height of 1465 m. PUY is part of the Chaîne des Puys, a north–south oriented chain of extinct volcanoes in the Massif Central (France), and to the west, an agricultural plain to the ocean (300 km apart). The urban area of Clermont-Ferrand and its surrounding suburbs (285,000 inhabitants) is situated 16 km east and 1000 m lower than the station. PUY is able to characterize air masses from various histories, coming from the boundary layer or in the free troposphere, varying as a function of the seasons and time of the day. The top of the mountain is frequently in cloudy conditions, on average 30% of the time per year, with higher occurrences during winter and autumn [50]. This makes PUY a reference site to study and sample cloud properties.
The cloud sampling dataset used in this study covered the period 2001–2018, with an average sampling time of 3 h and an average sampling volume of 75 mL. Non-precipitating cloud droplets were sampled using cloud collectors, as described previously for PUY cloud studies [46]. Cloud droplets, larger than 7 μm (cut-off diameter) [51], were collected by impaction onto a rectangular aluminum plate. Most of the time, droplets were collected directly as a liquid, and more rarely, they froze upon impaction (supercooled conditions). The water was transferred at room temperature, either directly or after a short melting period into glass vials. The aluminum collectors were cleaned and sterilized by autoclaving. Samples were collected in sterilized bottles and cloud water was filtered (0.20 μm nylon filter to eliminate microorganisms and particles). The majority of the sampled clouds resulted from frontal systems that mainly occurred during autumn, spring, and winter; these meteorological conditions enabled sampling clouds over long-time durations.

2.2. PuyCloud Database

The PuyCloud observation system deals with the monitoring of the biological, microphysical, and chemical properties of clouds. Biological and chemical analyses are performed in collaboration with the ICCF (Institute of Chemistry of Clermont-Ferrand). It is part of the French CO-PDD (Cézeaux-Aulnat-Opme-Puy De Dôme) multisite platform fully described by Baray et al. [39] in terms of instrumentations and data availability and widely employed [22,25,52,53,54,55].
The meteorological parameters that are monitored at PUY include the following: wind speed and direction, temperature, pressure, and relative humidity. Cloud microphysical properties, i.e., liquid water content (LWC) and effective droplets radius (re), are measured with a Gerber particle volume monitor, model 100 (PVM-100).
Physicochemical parameters are measured immediately after sampling (pH, conductivity, and redox potential). The concentrations of the major organic and inorganic ions (acetic, formic, succinic, malonic and oxalic acids, Ca2+, K+, Mg2+, Na+, NH4+, Cl, SO42−, and NO3) are measured by ion chromatography, using a DIONEX DX-320. The H2O2 and iron content, which are important parameters in the evaluation of the cloud oxidative capacity, are also determined. The spectrofluorimetric method based on the reactivity of p-hydroxyphenilacetic acid with horseradish peroxidase [53] was used to measure the concentration of hydrogen peroxide in cloud water. The Fe(II) concentration was measured by UV-visible spectroscopy at 562 nm, using the method developed by Stookey [56] based on the rapid complexation of iron with ferrozine. A detailed description of the physicochemical parameters and chemical analysis has been provided in Bianco et al. [6].
Between 2001 and 2018, 141 cloud events have been sampled at PUY, representing 295 individual samples (896 h of sampling), including 72 samples in spring, 21 samples in summer, 75 samples in fall, and 127 samples in winter. Table S1 indicates the physicochemical analysis performed for each cloud event. This cloud water chemical characterization was systematically performed for the last 20 years. Additional cloud water chemical and biological analysis have been developed during this last decade using targeted or global methods [3,22,25,52,54,57,58,59,60,61].

2.3. Dynamical Analysis

The trajectory approach is commonly used to identify source areas of air pollutants, based on conditional probability fields including back trajectory calculations, land cover, and meteorological data [62,63]. In the present work a dynamical analysis using the CAT model is performed to identify source areas of chemical compounds detected in cloud samples.
The CAT model is the recent evolution of the Lagrangian model LACYTRAJ [44]. CAT is a three-dimensional (3D) forward/backward kinematic trajectory code using initialization wind fields from the recent reanalysis ECMWF ERA-5 [64]. A cluster of starting back trajectory points is defined by the user and advected by the model using a bilinear interpolation for horizontal wind fields and time and a log-linear interpolation for vertical wind fields. The CAT model has already been used to determine the air masses arriving in PUY on the basis of calculations of two sets of 24 h back trajectories per day over a two-year period (2015–2016) [39].
In this study, sets of 45 back trajectories were calculated every hour during the cloud sampling in volume +/− 0.1° in latitude and longitude. The vertical starting altitude of the back trajectories was deduced from the pressure measured at the Puy de Dôme summit considering the hydrostatic equilibrium. Trajectories were calculated between the summit and 50 m below (corresponding to 4 hPa) to take into account the ascent from the slopes of PUY of the air masses arriving below the observatory. The temporal resolution was 15 min and the total duration was 72 h.
The CAT model was initialized with ECMWF ERA-5 wind fields of any temporal and spatial resolution. For this work, wind fields were extracted every 3 h with a spatial resolution of 0.5° in latitude (55 km) and longitude (40 km), on 23 vertical pressure levels between 200 and 1000 hPa. CAT integrated a topography matrix at a resolution of around 10 km [65].
In addition to the wind parameters, the boundary layer height was also extracted from the ECMWF ERA-5 reanalysis in the same horizontal resolution, and spatially and temporally interpolated on all the trajectory points.
The trajectory calculation phase was followed by a dynamical characterization analysis phase. This phase consisted of flagging the cloud samples on the base of the results of the trajectories calculations.
The history of air masses was modeled by counting the number of trajectory points in each of the following nine geographic areas: north-northeast (NNE), east-northeast (ENE), east-southeast (ESE), south-southeast (SSE), south-southwest (SSW), west-southwest (WSW), west-northwest (WNW) and north-northwest (NNW), named “sector” hereafter, and one nearby area. The latter was defined because it was not possible to determine the origin for the closest points to PUY, in a radius of 0.5°, because of the spatial resolution of the wind fields. The percentage of points located over the sea and the continental surfaces was, then, determined using the topography file. If the altitude of the topography interpolated on each trajectory point is 0, this point is considered to be above the sea, and therefore corresponds to the “sea surface” zone. Otherwise it is the “continental surface” zone. Finally, we separated the continental and sea zones vertically, using the altitude of the atmospheric boundary layer height (ABLH) interpolated on the trajectory points (data summarized in Table S1, blue columns).
All of these characteristics were, then, compiled for each cloud sampling, providing a so-called “zone matrix” and a so-called “sector matrix”. Thus, the matrices indicated, for each cloud sample, the distribution of the sectors or the zones crossed by their 72-hour backward trajectory. The relationship between the air mass history and the cloud composition was the subject of a statistical analysis, as described in Section 2.4.

2.4. Statistical Analysis

A principal component analysis (PCA) was performed using the concentrations of both organic and inorganic ions (Ca2+, K+, Mg2+, Na+, NH4+, Cl, NO3, SO42−, acetate, formate, malonate, oxalate, and succinate). The aim was to determine the most relevant variables to establish chemical categories (categories which would, then, be put in parallel with microphysical parameters or air mass history matrices). However, some chemical analyses were lacking and some samples presented missing values. Missing values were not replaced by the mean values to fully represent the variability of the dataset and to avoid overfitting [66]. Thus, samples, that were not fully characterized, were not considered in the statistical analysis.
Then, we performed numerous PCAs, and the maximum of information, gathered on the first two factors, was obtained with three ions with predominant marine sources (Cl, Mg2+, and Na+) and three ions with major sources from the continental surface (mostly anthropogenic ones) (NH4+, SO42−, and NO3). Hence, by keeping six inorganic ions, as similar studies [33,46,47], we fulfilled the best balance between samples and variables (i.e., increasing the number of variables means decreasing the number of samples).
The PCA type that was used during the computations was the Spearman’s correlations (more appropriate when running the PCA on variables with different distributions).
Then, we performed agglomerative hierarchical clustering (AHC), an iterative classification method, the aim of which was to make up homogeneous groups of objects (categories) on the basis of their description by a set of variables (chemical variables, herein) describing the dissimilarity between the objects (cloud events, herein). The AHC produced a dendrogram which showed the progressive grouping of the data. To calculate the dissimilarity between samples, we applied the common Ward’s agglomeration method (which minimized the within-group inertia) using Euclidean distance. The data were centered-reduced, to avoid variables with strong variance which unduly weighed on the results. The truncation level was automatically defined on the base of the entropy, and therefore the number of categories to retain.
Then, a PLS regression was performed to establish the correlations between the chemical parameters and the air masses history parameters. The Mann–Whitney and Kruskal–Wallis nonparametric tests were carried out to validate significant differences between two and among several data groups, respectively. Two air mass categories were declared to be different when the probability for the groups to have identical data distribution was lower than 5% (p-value < 0.05). These tests were chosen because the population from which the sample was extracted did not follow a normal distribution, according to the Shapiro–Wilk normality test.
This statistical analysis was performed using Excel XLSTAT software [67].

3. Results and Discussion

The multivariate statistical analysis was performed on 295 cloud samples collected at PUY, starting with PCA and AHC, in order to classify them according to their chemical composition. Then, these results were compared to the previous PUY study [46]. Then, we investigated, by using PLS regression, the relationships among these chemical data and the matrices provided by the CAT model, both on the zones (“sea and continental surfaces”) and on the cardinal sectors crossed by the air masses. Finally, we compared the respective influences of the air mass history and microphysics on the chemical composition of clouds.

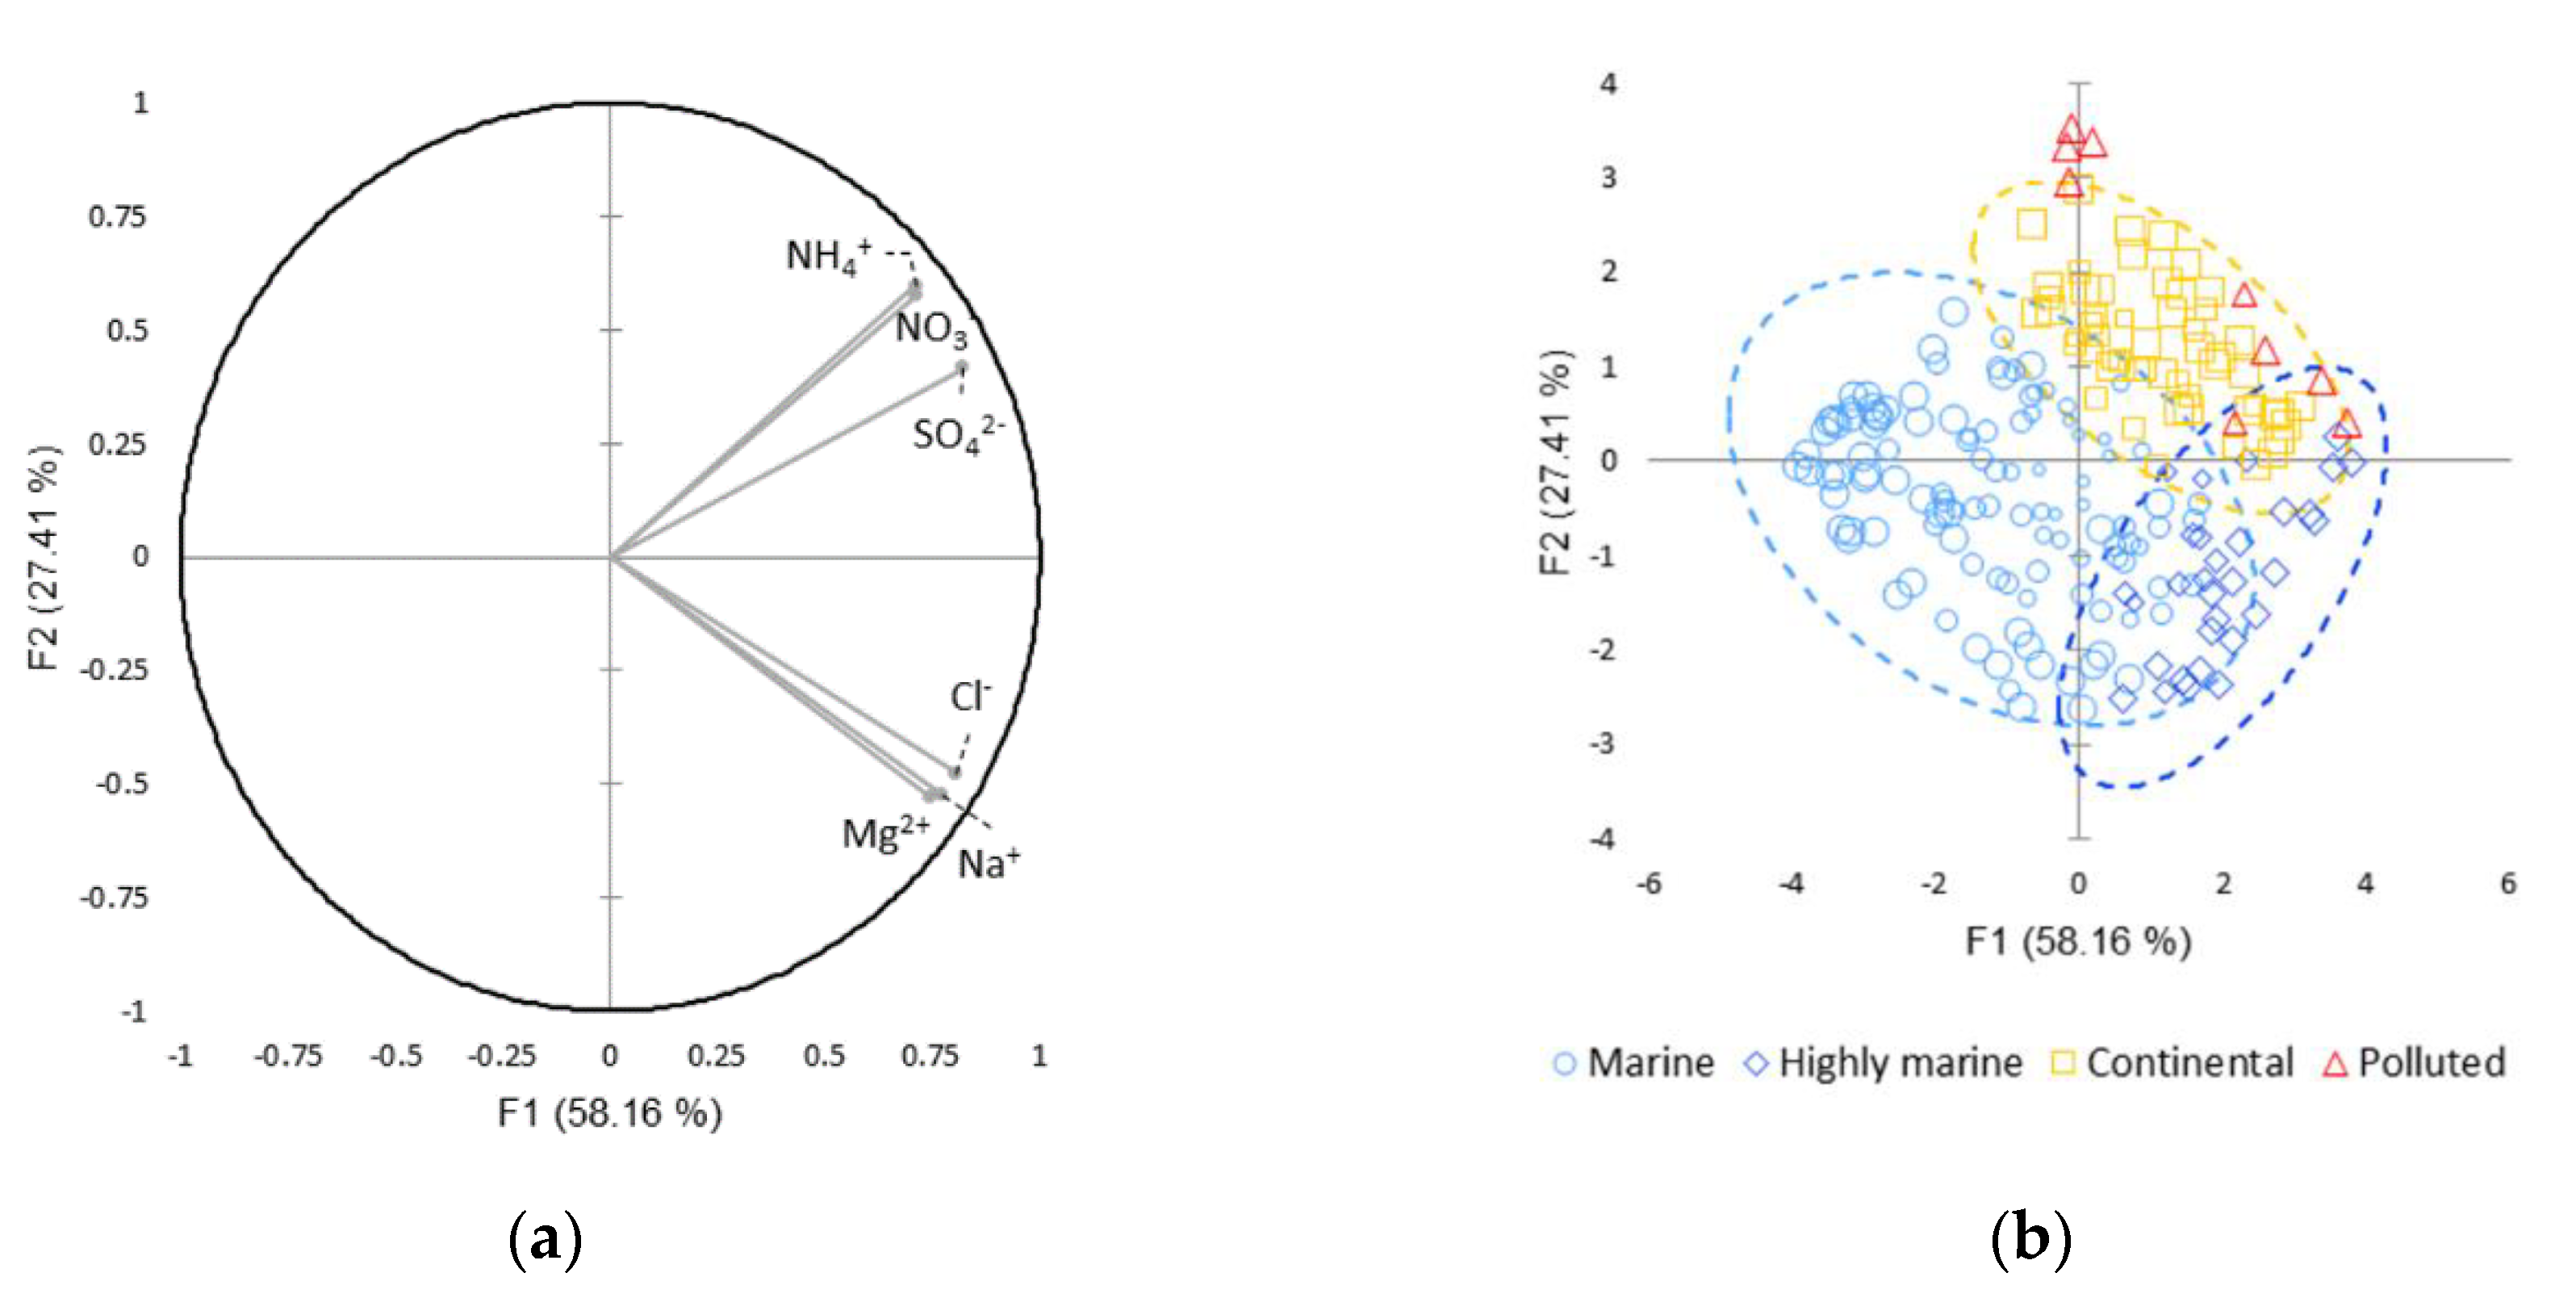
3.1. Clusterization of Cloud Waters at PUY

Data relative to Cl, Mg2+, Na+, NH4+, NO3, and SO42−, presented in Table S1, were analyzed by AHC and PCA to obtain categories based on ion concentration dissimilarities.

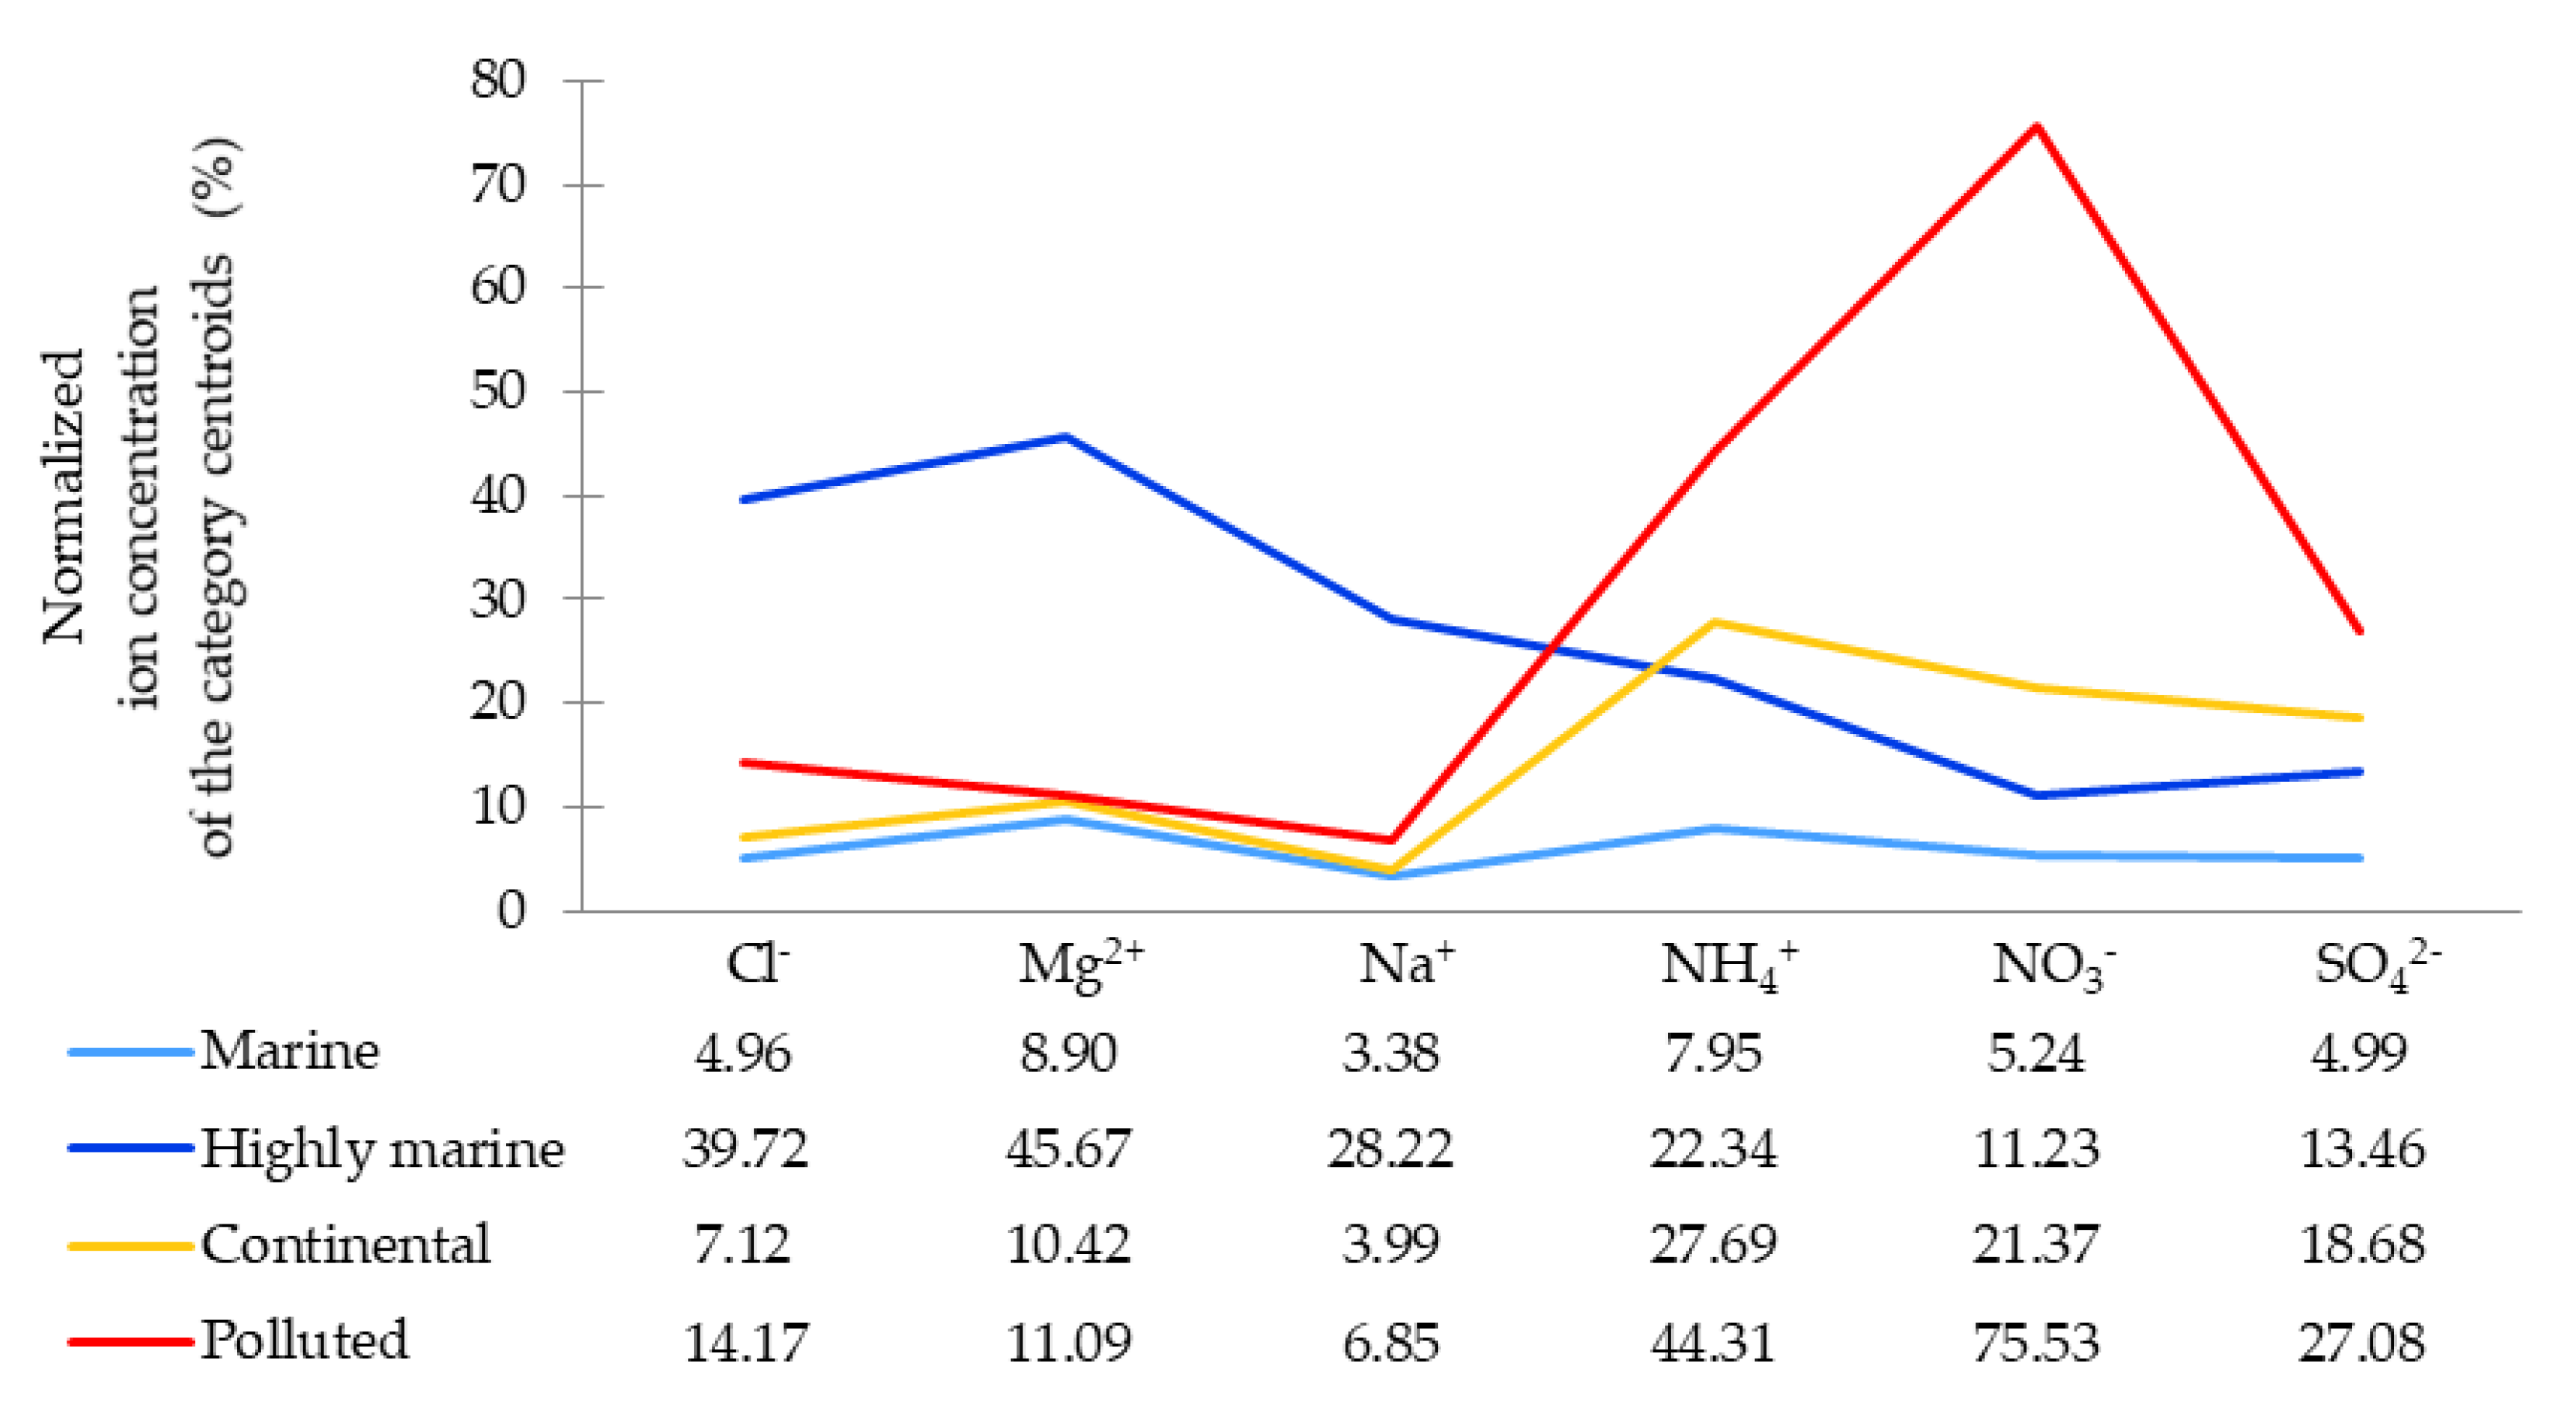
3.1.1. Chemical Categories

AHC was used to categorize cloud samples based on the long-term monitoring of their chemical composition. The AHC algorithm successfully grouped all the observations with a satisfactory cophenetic correlation (correlation coefficient between the dissimilarity and the Euclidean distance matrices) of 0.619 (Figure 1). Indeed, the closer the correlation to 1, the better the quality of the clustering. The dotted line in Figure 1 represents the degree of truncation (dissimilarity = 91.16) of the dendrogram used for creating categories and was automatically chosen based on the entropy level. Given the small difference in dissimilarity (Figure 1) between the light blue category (dissimilarity = 88.91) and the aggregate of the yellow and red categories (dissimilarity = 93.41), the AHC could be almost as robust with three or five categories. Nevertheless, these four AHC categories are consistent with our previous study [46]. Categories 1, 2, 3, and 4 consist of 113, 31, 55 and 9 clouds, respectively.
The ACH profile plot (Figure 2), represents the four categories determined from the six main inorganic ions (Cl, Mg2+, Na+, NH4+, NO3, and SO42−). The light blue category with low ion concentrations is named “Marine” according to its air mass history (i.e., the time spent by this air mass above the “sea surface”, detailed in Section 3.2). This category is the most homogeneous. This is confirmed by its significantly lower within-class variance (179.86), as shown in Figure 1. The “marine” category is also the main category (113 objects), which is consistent with the remoteness of the PUY. The dark blue category is characterized by high concentrations of Na+, Cl, and Mg2+ and its air mass history, and thus called “highly marine”. PUY is located more than 300 km from the Atlantic shore. Nevertheless, at a synoptic scale, the air masses are mainly transported from the Ocean to PUY with no relief between (as confirmed hereafter by the CAT model). Hence, this category, with 31 objects, would appear to be counterintuitively modest. This suggests that some western clouds (which could have been classified as “highly marine”) have either precipitated or become diluted (increase in liquid water content), thereby decreasing concentration. Then, these western clouds are classified “marine”, hence, the importance of this category (i.e., a category with a marine history, but without salt).
In red, the smallest category (nine objects), referred to as “polluted” in Figure 1 displays peak concentrations for SO42−, NH4+, and NO3, suggesting the air mass passed over an urbanized area. Below these maxima, in yellow, the “continental” category with 55 objects stands out. It should be noted, with only nine objects, the polluted category is statistically less robust, and could have been merged with the “continental” category (see dissimilarities in Figure 1), and regarded as the extreme SO42−, NH4+, and NO3 values of the category. Conversely, the “highly marine” category could have been split (see dissimilarities in Figure 1), according to their SO42− concentration (not shown).
Because the computed p-value in the Kruskal–Wallis test (Figure 3) is lower than the significance level alpha = 0.05, the distribution of ions (Cl, Mg2+, Na+, NH4+, NO3, and SO42−) concentration can be accepted as significantly different between each category. The samples do not come from the same population. We observe, in particular, high sea salts concentrations (Cl, Mg2+, and Na+) for both “marine” and “highly marine” categories, and high concentrations of potentially anthropogenic ions (NH4+, NO3, and SO42−) [68,69,70,71,72] for both “polluted” and “continental” categories (Table S2).

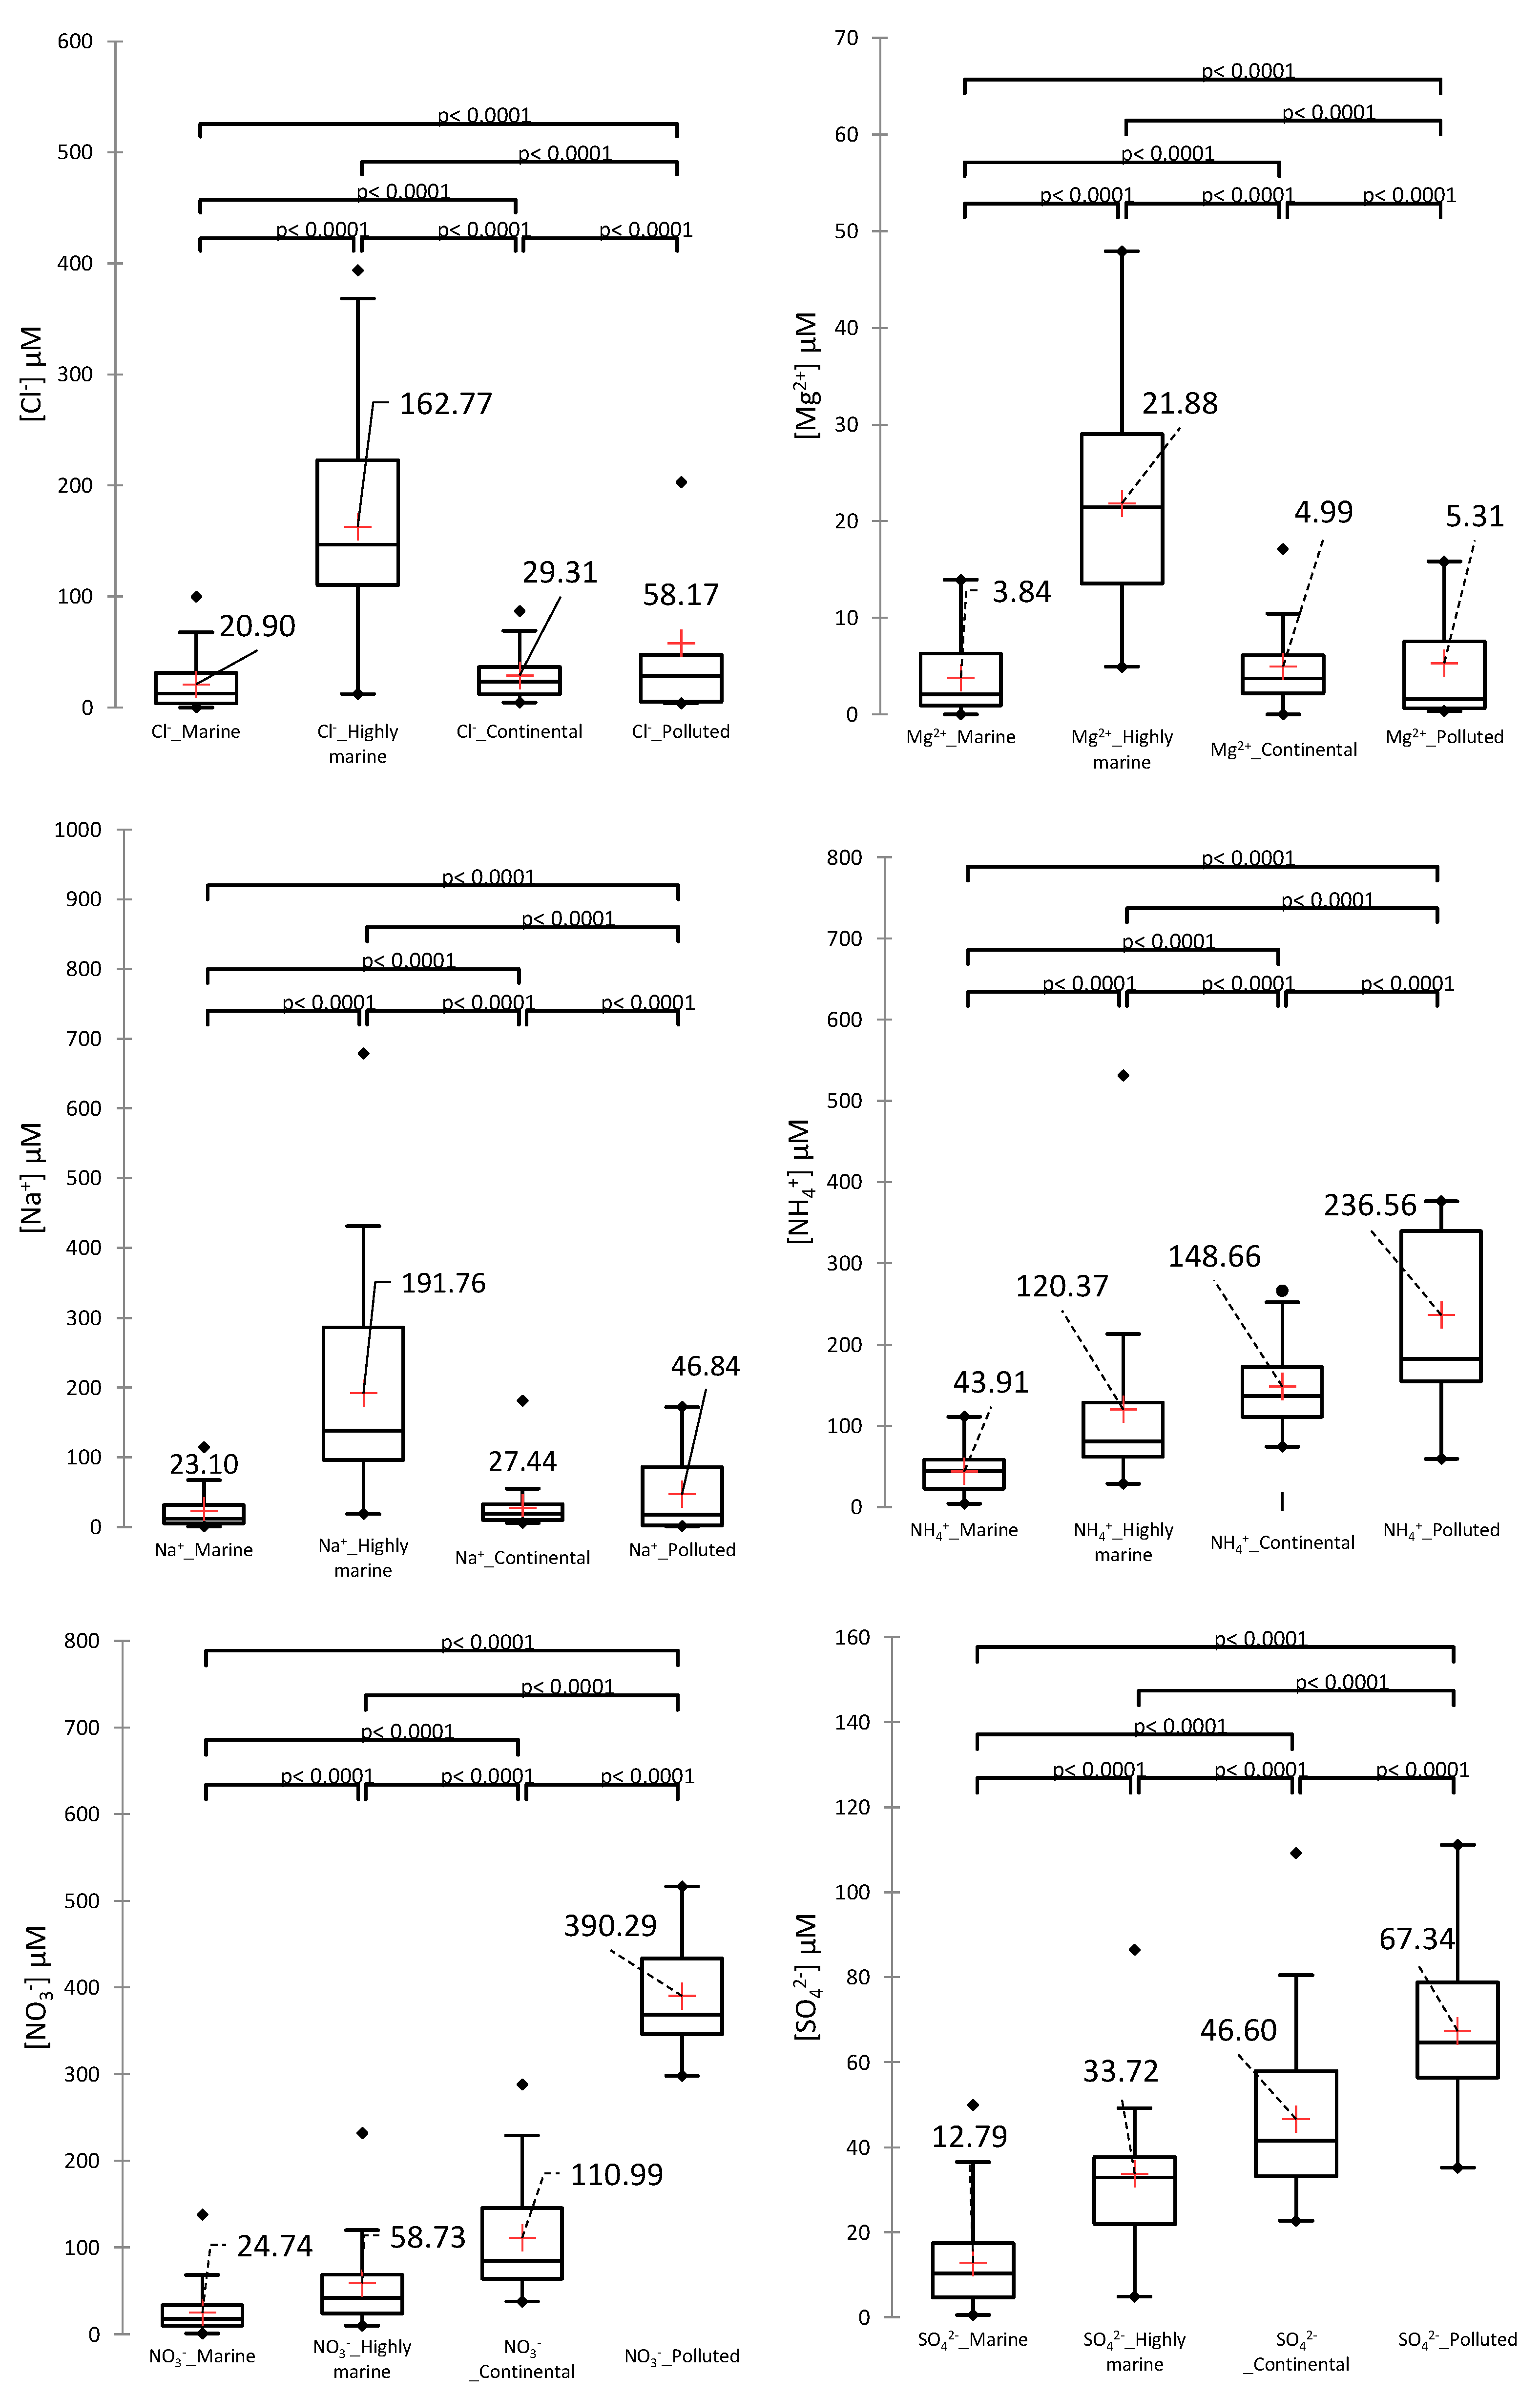
3.1.2. Variable Validation

A PCA was computed on a Spearman correlation matrix using the concentrations of the ions (Cl, Mg2+, Na+, NH4+, NO3, and SO42−). The PCA correlation circle (Figure 4a) provides evidence that Cl, Mg2+, and Na+ are strongly correlated (see correlation matrix in Table S3, r(Na+, Cl) = 0.82, r(Mg2+, Cl) = 0.77, and r(Na+, Mg2+) = 0.77); as well as NH4+, NO3, and SO42− (r(NO3, NH4+) = 0.77; r(NO3, SO42−) = 0.75; and r(NH4, SO42− = 0.78); while these two sets are practically uncorrelated, except Cl and SO42− (r(Cl, SO42−) = 0.49), suggesting the presence of anthropogenic chlorine and sea salt sulphate.
In this PCA (Figure 4), the first two factors represent 85.57% of the initial variability of the data; the PCA is robust, with no information hidden in the next four factors (see squared cosines of the variables in Table S4). The horizontal axis (F1) is linked to the total ion concentration and represents 58.16% of the information, while the vertical axis (F2: 27.4%) is linked to the concentrations of NH4+, NO3, and SO42− in positive, and Cl, Mg2+, and Na+ in negative. The PCA is consistent with the AHC. Coherently, in Figure 4b, the AHC “marine” category stands out on the left (F1 < 0) of the chart, the “highly marine” category at the bottom right (F1 > 0 and F2 < 0), the “continental” and the “polluted” categories at the top right (F1 > 0 and F2 > 0).

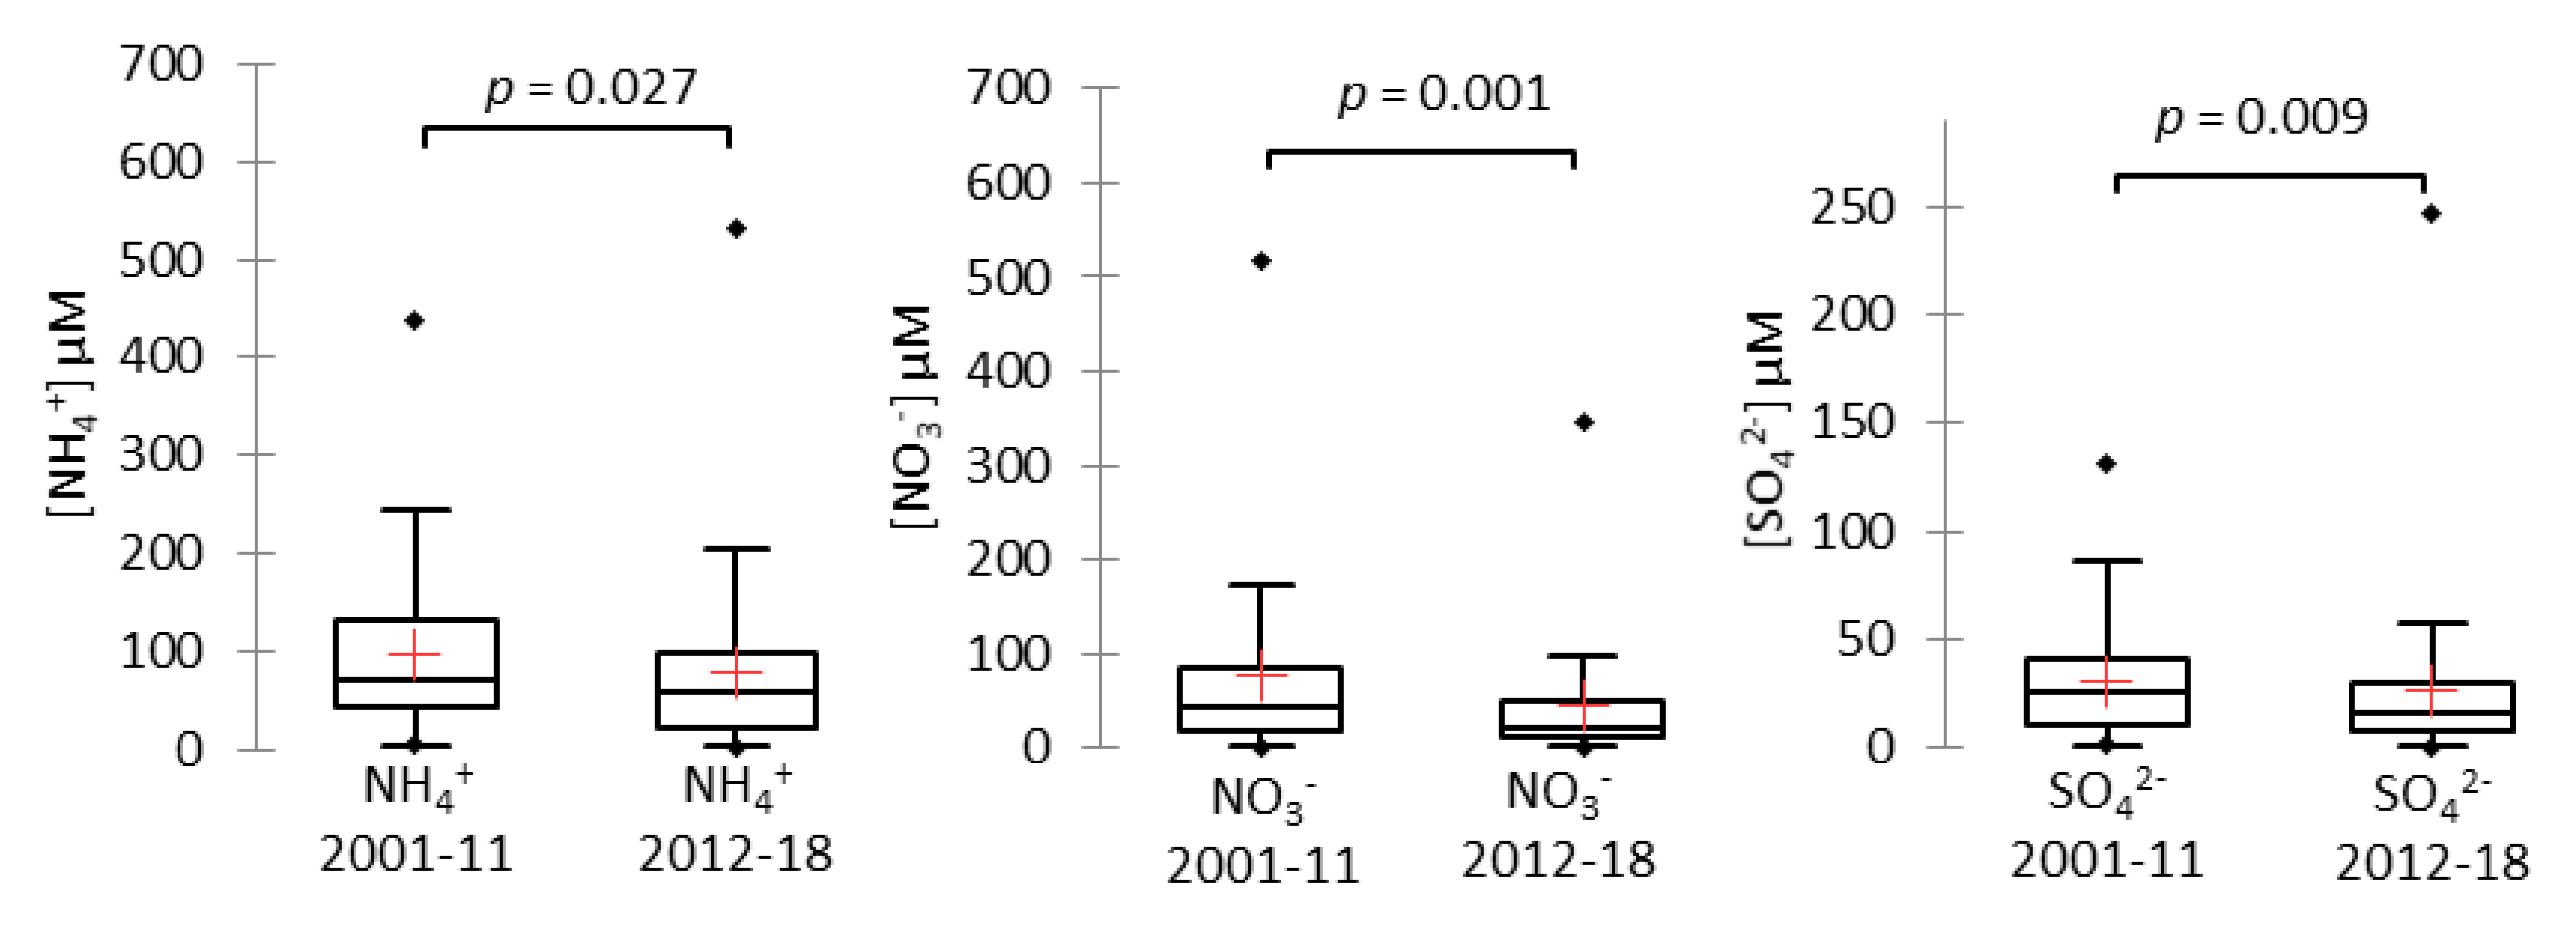
3.1.3. Evolution Since the 2001–2011 Study

In this study, the statistical analysis evolves as compared to our previous work. First, the AHC is performed with a larger number of samples (208 versus 134) and variables considered for the statistical analysis are different, i.e., pH is not taken into account and Mg2+ is added to the variables, as explained above. We removed cloud events with missing values. The ACP Spearman’s correlations replaced Pearson’s. However, the distribution of categories is fairly unchanged; among the 208 cloud events used in the AHC, 164 (78.8%) were clustered in a category similarly named in the 2001–2011 study [46] (see Table S1).
The samples with high Cl, Mg2+, and Na+ concentrations are still gathered in the so-called “highly marine” (HM) category. However, the present HM category is an expanded version of the former “highly marine” (HM_01–11) category, with lower mean concentrations of Cl and Na+ ([Na+]HM = 192 µM vs. [Na+]HM_01–11 = 311 µM and [Cl]HM = 163 µM vs. [Cl]HM_01–11 = 232 µM). The average ratio Cl/Na+ of this updated “HM” category is higher 1.22 vs. 1.06. Among the 31 cloud events in HM, only 10 were clustered in “HM_01–11”.
The “marine” category is barely larger in percentage than the former one (marine_01–11), with lower Na+, Cl, and SO42− concentrations ([Na+]Marine = 23.3 µM vs. [Na+]Marine_01–11 = 32 µM, [Cl]Marine = 20.5 µM vs. [Cl] Marine_01–11 =30 µM, and [SO42−] Marine = 12.8 µM vs. [SO42−] Marine_01–11 = 28 µM). NH4+ and NO3 are equivalent. Among the 113 cloud events in “marine”, 111 are clustered in “marine_01–11”.
Conversely, the “continental” category, is slightly smaller in percentage than the former one (continental_01–11), 26% of the samples vs. 34%, although the mean SO42− concentration increases ([SO42−]Continental = 46.6 µM vs. [SO42−]Continental_01–11 = 94 µM). The other concentrations remain almost unchanged. Among the 35 cloud events in “continental”, 35 were clustered in “continental_01–11”.
In both studies, 4% of cloud samples are in the “polluted” category, while the mean ion concentrations are markedly lower. Among the nine cloud events in “polluted”, eight are clustered in “polluted_01–11”.
In summary, the “marine” category slightly increases in percentage, as the mean ion concentration of the “continental” and “polluted” categories dwindle, in particular for the anthropogenic ions. “Highly marine” is the category that has expanded the most. This trend is not fully explained by the minor statistical processing adjustments (see Section 2.4). We compared (not shown) the two methods on the first 2001–2011 dataset, without observing any significant difference.
We performed a Mann–Whitney test (Figure 5) on the clouds sampled from 2001 to 2011 (period covered by our previous work [46]) and since then. It appears that NH4+, NO3, and SO42− concentrations are significantly lower on this second period (2012–2018), i.e., ([NH4+]01–11 = 96 µM vs. [NH4+]12–18 = 78 µM, [NO3]01–11 = 76 µM vs. [NO3]12–18 = 44 µM, and [SO42−]01–11 = 31 µM vs. [SO42−]12–18 = 27 µM (p-values are 0.027, 0.0009, and 0.009, respectively). The concentration of sea salts does not evolve significantly, but the changes on anthropogenic classes (mentioned above) drive the changes observed in the “marine” and “highly marine” categories. Category terminology will receive additional justifications in Section 3.2.

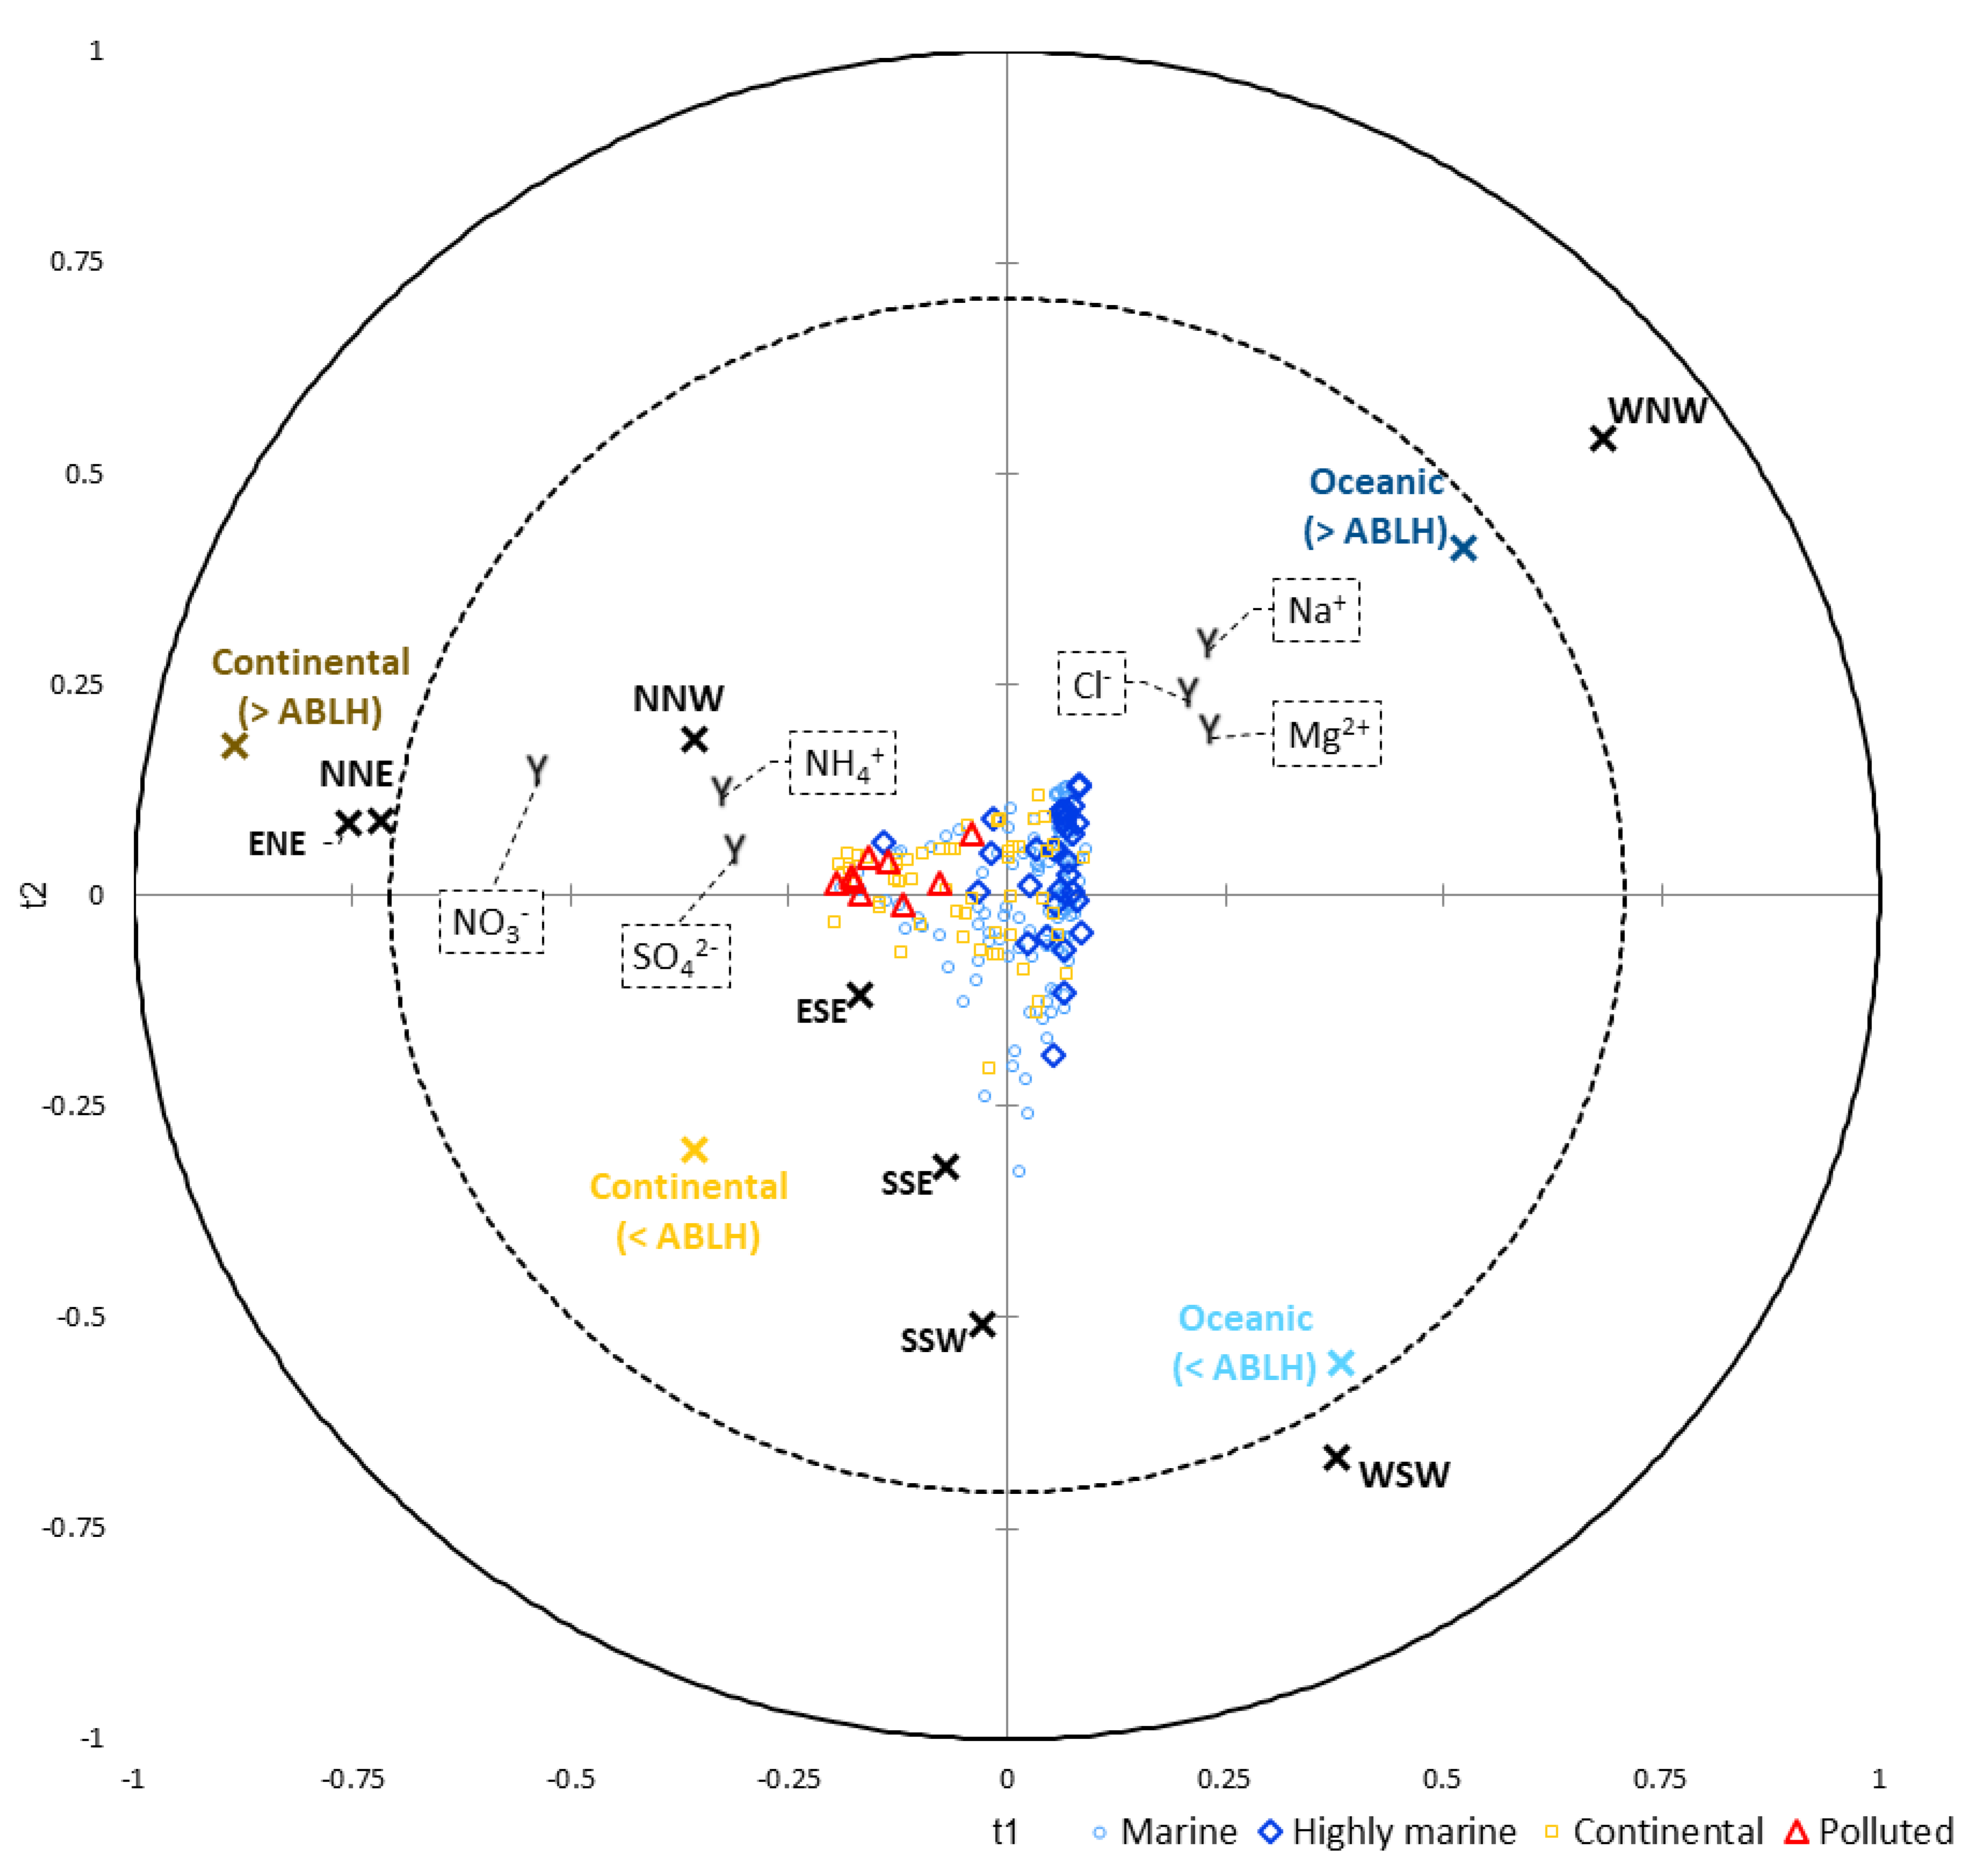
3.2. Influence of Air Mass History at PUY

This section is devoted to the correlation between the concentration of the inorganic ions and the air mass history. During their atmospheric transports, the air masses received chemical species under various forms (gases and particles) from various sources. This strongly depended on the altitude of the air masses. During the transport, chemicals could also undergo multiphasic chemical transformations, as well as dry or wet deposition. The objective, here, is to evaluate the effect of the history of air masses on the chemical composition of clouds. To this end, PLS regressions are performed and the results are validated with nonparametric tests (Kruskal–Wallis and Mann–Whitney tests).
As described in Section 2.4, the CAT model provides two matrices. The “zone matrix” contains information about the time spent by air masses over “continental surface” or “sea surface”, in the atmospheric boundary layer (<ABLH) or in the free troposphere (>ABLH). The “sector matrix” contains information about the time spent by air masses in the eight forty-five degrees sectors (NNE, ENE, ESE, SSE, SSW, WSW, WNW and NNW; see Figure S1c). Figure 6a represents the distribution of these parameters for all the cloud events. Despite the distance from the coast (300 Km), the strong maritime influence at PUY is obvious (Figure 6a). Over a 72-hour backward trajectory, on average, an air mass spends almost two days over the “sea surface”. Coherently, PUY is characterized by prevailing strong west and north winds (WSW, WNW, NNW, and NNE), with average percentages of time spent over these four main sectors of 23, 44, 14, and 12%, respectively (Figure 6b).
To perform the PLS analysis (Figure 7), the matrix of the explanatory variables (the “Xs”) is composed of the “sector matrix” and the “zone matrix”. The matrix of the dependent variables (the “Ys”) is the chemical matrix. As explained in Section 2.3, we restricted our statistical analysis to the concentration of six chemical compounds to avoid excessive loss of information and overfitting in the statistical analyses.
The index of the predictive quality of the models is quite low (Q2 = 0.1, ideally it should be close to 1) suggesting weak correlations. It is well known that cloud composition depends on many other parameters than the chosen explanatory variables, related to the air mass history calculated by the model. Indeed, cloud chemical composition depends foremost on local microphysics [17,37,73], proximity to sources [33,48,74,75], biological activity [4,5,61], seasonal cycles [30,76,77,78], and diurnal cycles [79].
Figure 7 displays numerous intricacies between chemical parameters and the air mass history. First, some zone variables are weakly correlated to some sector variables (cf. PLS correlation matrix in Table S5), “sea surface” (>ABLH) with WNW), “sea surface” (<ABLH) with WSW), “continental surface” (>ABLH) with ENE (too few observations to be interpretable on the graph) and more robustly, “continental surface” (>ABLH) with ENE (R = 0.7).
The “polluted” category in red (Figure 7) and, to a lesser extent, the “continental” category in yellow are on the left of the display, toward the NNE sector and the “continental surface” (>ABLH) zone. The “highly marine” category in dark blue and, to a lesser extent, the “marine” category in light blue are drawn toward the WNW/WSW sectors and the “sea surface” (>ABLH) zone.
We performed an AHC on the “sector matrix” and obtained three clusters. Then, we reran the previous PLS. The simplified correlation matrix (Table 1) highlights the link between “sea surface” zones west sector and “continental surface” zones and northeast sector. We do not keep this clusterization in the main PLS to avoid a loss of information.
The simplified correlation matrix (Table 2) displays weak correlations. However, the link between sea salts (Cl, Mg2+, and Na+) and both the “sea surface” (>ABLH) zone and the WSW/WNW clustered sectors is noticeable. The same applies to ions of potentially anthropogenic origin (NH4+, NO3, and SO42−) and both the “continental surface” (>ABLH) zone and the NNW/NNE/ENE sector. For both marine and continental ions, the correlations are higher above the atmospheric boundary layer height (>ABLH), confirming PUY is surely influenced by long-range transport [42,43].
In order to statistically validate these observations, we performed the Kruskal–Wallis test and compared the category distribution within each zone (Figure S1a) and main sectors (Figure S1b). As the computed p-values are lower than the significance level alpha = 0.05, we accept that the main sectors (WSW, WNW, NNW, NNE, and ENE) and the zones (“sea surface” (>ABLH), “sea surface” (<ABLH), and “continental surface” (>ABLH)) are significantly different for each category. The samples do not come from the same population. Only the p-value of “continental surface” (>ABLH) is greater than the significance level alpha = 0.05 (p-value = 0.062). The difference between the categories according to the sector distribution can also be observed on the map (Figure S1c) provided by the CAT model. The history of air masses significantly influences the chemical composition of clouds.

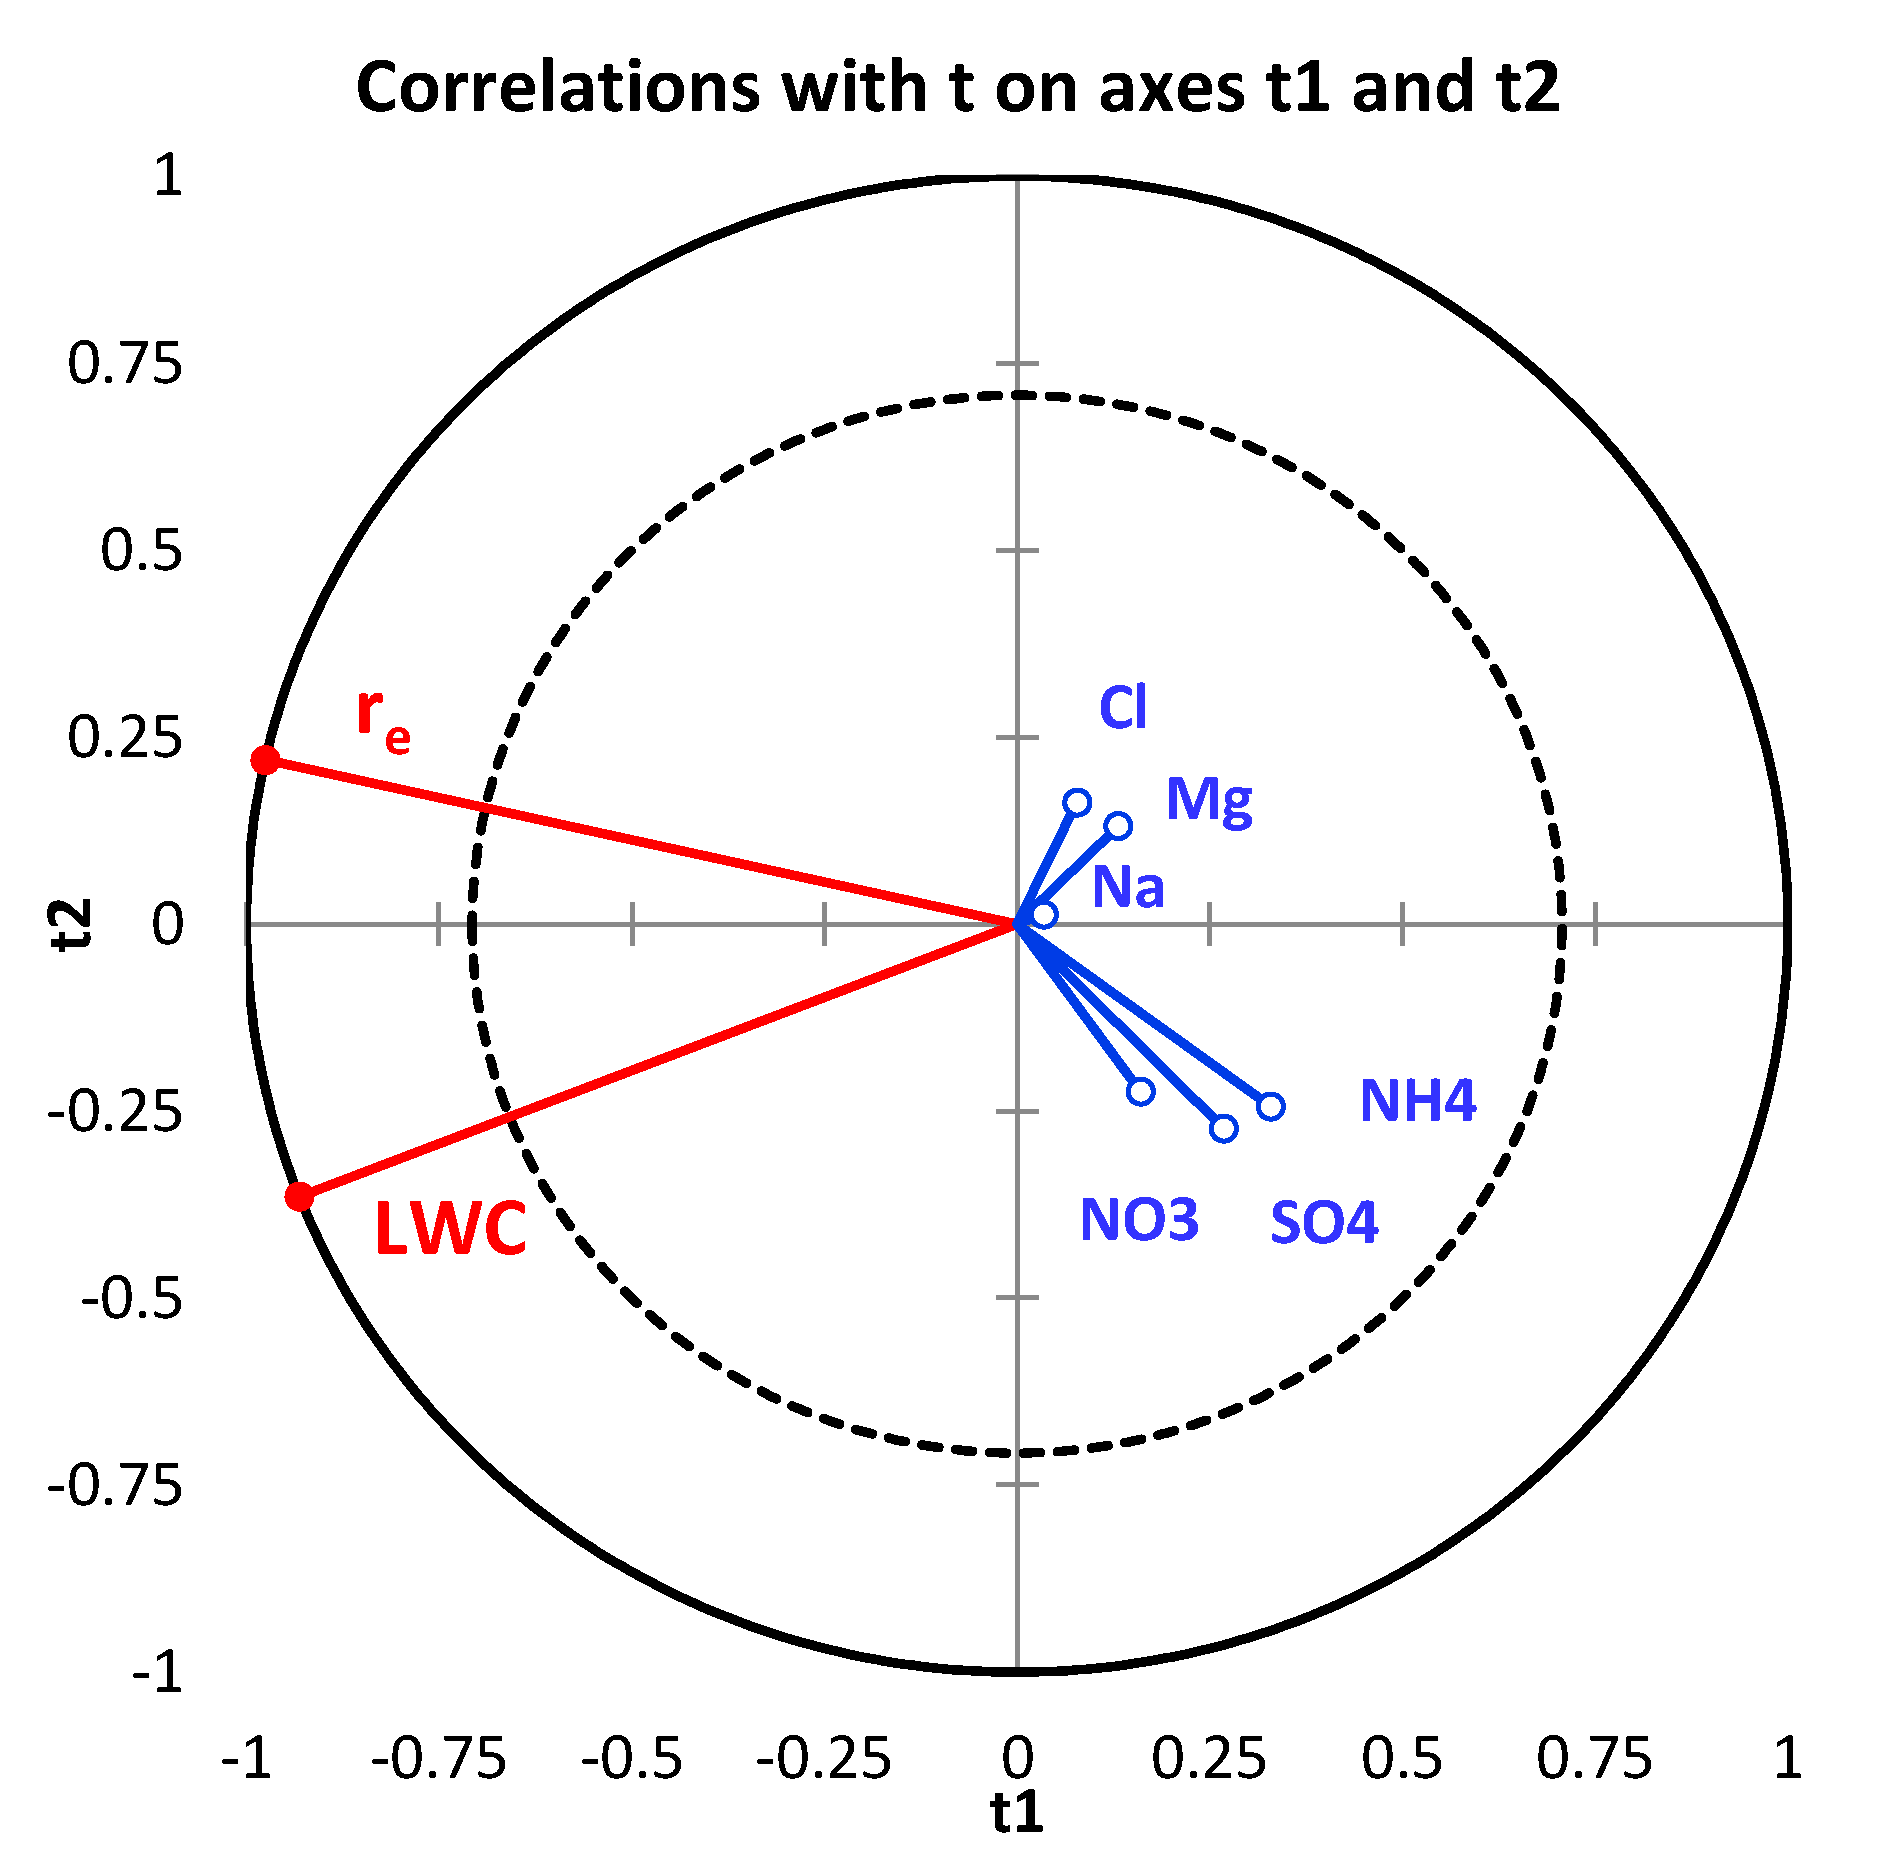
3.3. Influence of Cloud Microphysics at PUY

The air mass history can influence solute concentration by scavenging aerosol particles and gaseous species (as discussed in Section 3.2). This strongly depends on the CCN concentration related to the physicochemical properties of aerosol particles (size distribution and chemical composition) and on the gas phase chemical composition and corresponding phase equilibria. Microphysical cloud conditions such as liquid water content (LWC) and effective droplets radius (re) can also perturb solution concentration variability, as well as chemical reactions occurring within cloud waters. This section is devoted to the possible relationships between LWC and chemical variables.
For this, a PLS analysis was performed with the LWC and the re, as the matrix of the explanatory variables (the “Xs”), and the chemical matrix (the “Ys”). The PLS chart is presented in Figure 8, and Table S6 reports the correlation matrix between these variables. There are weak correlations between LWC and ion concentrations. The strongest anti-correlation is between NH4+ and re, i.e., r(NH4+, re) = −0.37. This analysis clearly demonstrates that at PUY, microphysical properties of the sampled clouds are almost not correlated with their chemical composition. This could be explained by the type of clouds that are collected; the majority are frontal clouds which were formed well before their arrival at the top of the mountain and which present a low variability in their microphysical properties.
A supplementary analysis (PCA) has also been performed (Table S7), demonstrating that correlations between microphysical variables and air mass history parameters (Section 3.2) are negligible. Thus, the influence of air mass history on the chemical composition of clouds cannot be attributed to the variability of microphysical parameters. In other words, there is an influence of microphysics, but it is statistically identical, whatever the zones or the sectors crossed by the air mass.
To remove any influence of LWC variation, cloud water loadings (CWLs) are commonly calculated to evaluate the solute content per volume of air. The statistical analysis, in this study, were conducted on solute concentrations in cloud water to get more robust results, because microphysical parameters are not always available, especially under winter conditions. However, LWC and re variations are not highly variable (Figure S2) at PUY, and CWL patterns resemble those of solute concentrations in cloud waters (Figure S3). This suggests that for clouds sampled at PUY, the air mass history can better explain the variability of cloud water solute concentrations than LWC variations.
A decrease of the solute concentrations from continental origin (NO3, SO42−, and NH4+) was observed between the periods 2001–2011 and 2012–2018, as mentioned in Section 3.1.3. In addition, a low decrease of its mean value (from 0.31 to 0.27 g·m−3) suggests that the CWLs for these species also significantly decreased. This trend could be explained by the aerological evolution highlighted by the CAT model and requires further investigation.
Previous field studies have investigated the dependency of cloud chemical composition with microphysical parameters [16,80,81,82]. It has been shown, for sites more exposed to anthropogenic emissions, that LWC could modulate solute concentrations. For example, clouds freshly formed by orography can have their chemical composition modulated by cloud microphysics [7,19,73]. Anthropic mean cloud water concentrations at PUY are notably low ([NH4+] = 91 µM, [NO3] = 70 µM, and [SO42−] = 27 µM, see Table S2) as compared with the literature data [19]. Polluted events are exceptionally observed at PUY and most likely originate from afar (northeast France, several hundred kilometers away). If we consider the synoptic scale, we should see higher concentrations of NH4+, NO3, and SO42−; however, these ions are involved in chemical and photochemical reactions [83,84,85,86]. Hence, more information on the chemical aging of the air masses is needed (chemical characterization in progress). Moreover, such a long-term monitoring, with varied air masses, smooths the microphysics (LWC and re) influence (Figure S2). Cloud water is a complex matrix resulting from the interaction of many factors. Nevertheless, it appears that the air mass history, despite reduced correlations, remains the prevailing parameter, with either western and oceanic clouds or northeastern anthropogenic clouds.

4. Conclusions

In this study, statistical analyses (AHC and PCA) were carried out on 208 cloud samples collected at the Puy de Dôme station (France) between 2001 and 2018, which resulted in clustering the cloud samples according to their chemical properties (concentrations of inorganic ions from marine and continental origins) into four categories as follows: “highly marine”, “marine”, “continental”, and “polluted”. Despite an evolution of the statistical treatment to classify the clouds samples, this work confirms those established in a previous study by Deguillaume et al. [46] for clouds sampled between 2001 and 2011. A change between the relative proportions of categories is however noticed and attributed to a significant decrease in the NH4+, NO3, and SO42− concentrations during the second period (2012–2018) of cloud sampling.
CAT models the history of the air masses arriving at PUY, providing for each air mass the time spent above the eight cardinal sectors and above continental or sea surfaces. The CAT model specifies whether the air mass is in a free troposphere or in an atmospheric boundary layer. From these in silico zone and sector matrices and in situ chemical characteristics, PLS analysis highlights two main relationships between air mass origins and ion concentrations. A type of air mass comes predominantly from western sectors and from the “sea surface” (> ABLH) zone, with the highest concentrations of sea salts (Cl, Mg2+, and Na+). A total of 31 cloud samples are gathered in the “highly marine” AHC category, which are characteristic of this air mass. Slightly linked to the latter, the “marine” AHC category, which is named for its air mass history and its low ion concentrations, is the most important (113 cloud samples) and the most “homogeneous”. The second main air mass type arrives from the northeast sector and from the “continental surface” (> ABLH) zone, with the highest concentrations of potentially anthropogenic ions (NH4+, NO3, and SO42−). Only nine cloud samples are grouped in the “polluted” AHC category, characteristic of this air mass. With less extreme values and 55 cloud samples, the “continental” category represents the body of this set.
Finally, the influence of cloud microphysical properties (LWC and re) on the cloud water composition is investigated using PLS analysis in a similar way. This indicates no robust statistical correlations between cloud microphysics and cloud water chemical composition. This suggests that cloud chemical composition at PUY is influenced by air mass history which includes several physicochemical processes (CCN physical and chemical processes, mass transfer of soluble species, multiphase reactivity, etc.).
Clearly, this study highlights parameters that could drive the chemical composition of clouds at PUY; this statement cannot be generalized to other observation sites presenting different environmental scenarios. However, in a remote site, it appears that without major and immediate urban or marine influence, an air mass coming from the ocean or from a polluted area would be observed more or less loaded, according to complex biophysicochemical processes. In addition, much of the oceanic influence (i.e., Cl, Mg2+, and Na+ concentrations) seems to decrease quickly (78% of the clouds coming from the ocean appear “cleaned”), and much of the anthropic influence seems more persistent (NH4+, NO3, and SO42− concentrations) which remain significant.
The PUY site is a reference European station for the study of gases, aerosols, and clouds. International field campaigns have been conducted there in the past and future campaigns would especially target cloud biophysicochemical processes. Cloud waters collected at PUY for various air mass histories also serve for laboratory investigations that consider the following: (1) characterizing the complex chemical composition and its environmental variability by innovative analytical methods, and (2) quantifying photochemical and biological transformations occurring in this complex liquid medium. Cloud field investigations performed at PUY also help to build relevant chemical scenarios that help to better constrain cloud chemistry models [87]. For the dynamical frame, the CAT model makes it possible to give an overview of the air mass history; this helps to constrain cloud chemistry models but also makes it possible to compare the PUY station to other observatories where cloud studies are conducted.

Supplementary Materials

The following are available online at https://www.mdpi.com/2073-4433/11/7/732/s1, Figure S1: Category distribution within each zone (a) and sector (b), Figure S2: LWC distribution at PUY, Figure S3: Comparison of normalized concentrations and normalized CWLs, Table S1: PuyCloud data (“TableS1.xlsm”), Table S2: Ion concentrations of the categories; Table S3: Spearman chemical correlation matrix of PCA, Table S4: Squared cosines of the variables, Table S5: Squared cosines of the variables (sectors, zones, and chemistry), Table S6: PLS correlation matrix between microphysics and chemistry, Table S7: PCA correlation matrix between microphysics and parameters related to air mass history.

Author Contributions

Conceptualization L.D. and P.R.; statistical analysis P.R.; dynamical analysis J.-L.B. and P.R.; writing—original draft preparation P.R. and L.D.; writing—review and editing, P.R., L.D., A.B., J.-L.B., A.-M.D. and M.B. All authors agreed with the submission of the manuscript. All authors have read and agreed to the published version of the manuscript.

Funding

This research received no external funding.

Acknowledgments

This work on the long-term analysis of the cloud water chemical composition was supported by the French Ministry and CNRS-INSU. Authors acknowledge additional financial support from the Observatoire de Physique du globe de Clermont-Ferrand (OPGC), from the Regional Council of Auvergne, and from the Fédération de Recherche en Environnement through the CPER Environnement founded by Région Auvergne−Rhône-Alpes, the French ministry, and the FEDER from the European community. This work was supported by CEA/CNRS contracts. The authors thank Jean-Marc Pichon and Mickaël Ribeiro for technical support and discussions.

Conflicts of Interest

The authors declare no conflict of interest.

References

  1. Herckes, P.; Valsaraj, K.T.; Collett, J.L. A review of observations of organic matter in fogs and clouds: Origin, processing and fate. Atmos. Res. 2013, 132–133, 434–449. [Google Scholar] [CrossRef]
  2. Herrmann, H.; Schaefer, T.; Tilgner, A.; Styler, S.A.; Weller, C.; Teich, M.; Otto, T. Tropospheric aqueous-phase chemistry: Kinetics, mechanisms, and its coupling to a changing gas phase. Chem. Rev. 2015, 115, 4259–4334. [Google Scholar] [CrossRef] [PubMed]
  3. Bianco, A.; Riva, M.; Baray, J.-L.; Ribeiro, M.; Chaumerliac, N.; George, C.; Bridoux, M.; Deguillaume, L. Chemical characterization of cloud water collected at puy de Dôme by FT-ICR MS reveals the presence of SOA components. ACS Earth Space Chem. 2019, 3, 2076–2087. [Google Scholar] [CrossRef]
  4. Vaïtilingom, M.; Deguillaume, L.; Vinatier, V.; Sancelme, M.; Amato, P.; Chaumerliac, N.; Delort, A.-M. Potential impact of microbial activity on the oxidant capacity and organic carbon budget in clouds. Proc. Natl. Acad. Sci. USA 2013, 110, 559–564. [Google Scholar] [CrossRef] [Green Version]
  5. Wei, M.; Xu, C.; Chen, J.; Zhu, C.; Li, J.; Lv, G. Characteristics of bacterial community in cloud water at Mt Tai: Similarity and disparity under polluted and non-polluted cloud episodes. Atmos. Chem. Phys. 2017, 17, 5253–5270. [Google Scholar] [CrossRef] [Green Version]
  6. Bianco, A.; Passananti, M.; Perroux, H.; Voyard, G.; Mouchel-Vallon, C.; Chaumerliac, N.; Mailhot, G.; Deguillaume, L.; Brigante, M. A better understanding of hydroxyl radical photochemical sources in cloud waters collected at the puy de Dôme station—Experimental versus modelled formation rates. Atmos. Chem. Phys. 2015, 15, 9191–9202. [Google Scholar] [CrossRef] [Green Version]
  7. Li, J.; Wang, X.; Chen, J.; Zhu, C.; Li, W.; Li, C.; Liu, L.; Xu, C.; Wen, L.; Xue, L.; et al. Chemical composition and droplet size distribution of cloud at the summit of Mount Tai, China. Atmos. Chem. Phys. 2017, 17, 9885–9896. [Google Scholar] [CrossRef] [Green Version]
  8. Chen, J.; Griffin, R.J.; Grini, A.; Tulet, P. Modeling secondary organic aerosol formation through cloud processing of organic compounds. Atmos. Chem. Phys. 2007, 7, 5343–5355. [Google Scholar] [CrossRef] [Green Version]
  9. Schurman, M.I.; Boris, A.; Desyaterik, Y.; Jeffrey, L.; Collett, J. Aqueous secondary organic aerosol formation in ambient cloud water photo-oxidations. Aerosol Air Qual. Res. 2017, 18, 15–25. [Google Scholar] [CrossRef] [Green Version]
  10. Pye, H.O.T.; Nenes, A.; Alexander, B.; Ault, A.P.; Barth, M.C.; Clegg, S.L.; Collett, J.L., Jr.; Fahey, K.M.; Hennigan, C.J.; Herrmann, H.; et al. The acidity of atmospheric particles and clouds. Atmos. Chem. Phys. 2020, 20, 4809–4888. [Google Scholar] [CrossRef] [Green Version]
  11. Hegg, D.A.; Hobbs, P.V. Cloud water chemistry and the production of sulfates in clouds. Atmos. Environ. 1967 1981, 15, 1597–1604. [Google Scholar] [CrossRef]
  12. Vong, R.J.; Hansson, H.-C.; Covert, D.S.; Charlson, R.J. Acid rain: Simultaneous observations of a natural marine background and its acidic sulfate aerosol precursor. Geophys. Res. Lett. 1988, 15, 338–341. [Google Scholar] [CrossRef]
  13. Ervens, B.; Turpin, B.J.; Weber, R.J. Secondary organic aerosol formation in cloud droplets and aqueous particles (aqSOA): A review of laboratory, field and model studies. Atmos. Chem. Phys. 2011, 11, 11069–11102. [Google Scholar] [CrossRef] [Green Version]
  14. Ervens, B.; Sorooshian, A.; Aldhaif, A.M.; Shingler, T.; Crosbie, E.; Ziemba, L.; Campuzano-Jost, P.; Jimenez, J.L.; Wisthaler, A. Is there an aerosol signature of chemical cloud processing? Atmos. Chem. Phys. 2018, 18, 16099–16119. [Google Scholar] [CrossRef] [Green Version]
  15. Quinn, P.K.; Bates, T.S.; Coffman, D.J.; Covert, D.S. Influence of particle size and chemistry on the cloud nucleating properties of aerosols. Atmos. Chem. Phys. 2008, 8, 1029–1042. [Google Scholar] [CrossRef] [Green Version]
  16. Bator, A.; Collett, J.L. Cloud chemistry varies with drop size. J. Geophys. Res. Atmos. 1997, 102, 28071–28078. [Google Scholar] [CrossRef]
  17. Moore, K.F.; Sherman, D.E.; Reilly, J.E.; Collett, J.L. Drop size-dependent chemical composition in clouds and fogs. Part I. Observations. Atmos. Environ. 2004, 38, 1389–1402. [Google Scholar] [CrossRef]
  18. Hao, L.; Romakkaniemi, S.; Kortelainen, A.; Jaatinen, A.; Portin, H.; Miettinen, P.; Komppula, M.; Leskinen, A.; Virtanen, A.; Smith, J.N.; et al. Aerosol chemical composition in cloud events by high resolution time-of-flight aerosol mass spectrometry. Environ. Sci. Technol. 2013, 47, 2645–2653. [Google Scholar] [CrossRef]
  19. Van Pinxteren, D.; Fomba, K.W.; Mertes, S.; Müller, K.; Spindler, G.; Schneider, J.; Lee, T.; Collett, J.L.; Herrmann, H. Cloud water composition during HCCT-2010: Scavenging efficiencies, solute concentrations, and droplet size dependence of inorganic ions and dissolved organic carbon. Atmos. Chem. Phys. 2016, 16, 3185–3205. [Google Scholar] [CrossRef] [Green Version]
  20. Triesch, N.; van Pinxteren, M.; Engel, A.; Herrmann, H. Concerted measurements of free amino acids at the Cape Verde Islands: High enrichments in submicron sea spray aerosol particles and cloud droplets. Atmos. Chem. Phys. Discuss. 2020, 1–24. [Google Scholar] [CrossRef] [Green Version]
  21. Van Pinxteren, D.; Plewka, A.; Hofmann, D.; Müller, K.; Kramberger, H.; Svrcina, B.; Bächmann, K.; Jaeschke, W.; Mertes, S.; Collett, J.L.; et al. Schmücke hill cap cloud and valley stations aerosol characterisation during FEBUKO (II): Organic compounds. Atmos. Environ. 2005, 39, 4305–4320. [Google Scholar] [CrossRef]
  22. Wang, M.; Perroux, H.; Fleuret, J.; Bianco, A.; Bouvier, L.; Colomb, A.; Borbon, A.; Deguillaume, L. Anthropogenic and biogenic hydrophobic VOCs detected in clouds at the puy de Dôme station using Stir Bar Sorptive Extraction: Deviation from the Henry’s law prediction. Atmos. Res. 2020, 237, 104844. [Google Scholar] [CrossRef]
  23. Atlas, E.; Giam, C.S. Ambient concentration and precipitation scavenging of atmospheric organic pollutants. Water. Air. Soil Pollut. 1988, 38, 19–36. [Google Scholar] [CrossRef]
  24. Levsen, K.; Behnert, S.; Prieß, B.; Svoboda, M.; Winkeler, H.-D.; Zietlow, J. Organic compounds in precipitation. Chemosphere 1990, 21, 1037–1061. [Google Scholar] [CrossRef]
  25. Bianco, A.; Deguillaume, L.; Vaïtilingom, M.; Nicol, E.; Baray, J.-L.; Chaumerliac, N.; Bridoux, M. Molecular characterization of cloud water samples collected at the puy de Dôme (France) by Fourier Transform Ion Cyclotron Resonance Mass Spectrometry. Environ. Sci. Technol. 2018, 52, 10275–10285. [Google Scholar] [CrossRef] [PubMed]
  26. Löflund, M.; Kasper-Giebl, A.; Schuster, B.; Giebl, H.; Hitzenberger, R.; Puxbaum, H. Formic, acetic, oxalic, malonic and succinic acid concentrations and their contribution to organic carbon in cloud water. Atmos. Environ. 2002, 36, 1553–1558. [Google Scholar] [CrossRef]
  27. Petrenchuk, O.P.; Drozdova, V.M. On the chemical composition of cloud water. Tellus 1966, 18, 280–286. [Google Scholar] [CrossRef]
  28. Fuzzi, S.; Facchini, M.C.; Decesari, S.; Matta, E.; Mircea, M. Soluble organic compounds in fog and cloud droplets: What have we learned over the past few years? Atmos. Res. 2002, 64, 89–98. [Google Scholar] [CrossRef]
  29. Ghauri, B.M.; Ishaq Mirza, M.; Richter, R.; Dutkiewicz, V.A.; Rusheed, A.; Khan, A.R.; Husain, L. Composition of aerosols and cloud water at a remote mountain site (2.8 kms) in Pakistan. Chemosphere Glob. Chang. Sci. 2001, 3, 51–63. [Google Scholar] [CrossRef]
  30. Guo, J.; Wang, Y.; Shen, X.; Wang, Z.; Lee, T.; Wang, X.; Li, P.; Sun, M.; Collett, J.L.; Wang, W.; et al. Characterization of cloud water chemistry at Mount Tai, China: Seasonal variation, anthropogenic impact, and cloud processing. Atmos. Environ. 2012, 60, 467–476. [Google Scholar] [CrossRef]
  31. Wang, Z.; Wang, T.; Gao, R.; Xue, L.; Guo, J.; Zhou, Y.; Nie, W.; Wang, X.; Xu, P.; Gao, J.; et al. Source and variation of carbonaceous aerosols at Mount Tai, North China: Results from a semi-continuous instrument. Atmos. Environ. 2011, 45, 1655–1667. [Google Scholar] [CrossRef]
  32. Aleksic, N.; Roy, K.; Sistla, G.; Dukett, J.; Houck, N.; Casson, P. Analysis of cloud and precipitation chemistry at Whiteface Mountain, NY. Atmos. Environ. 2009, 43, 2709–2716. [Google Scholar] [CrossRef]
  33. Gioda, A.; Mayol-Bracero, O.L.; Scatena, F.N.; Weathers, K.C.; Mateus, V.L.; McDowell, W.H. Chemical constituents in clouds and rainwater in the Puerto Rican rainforest: Potential sources and seasonal drivers. Atmos. Environ. 2013, 68, 208–220. [Google Scholar] [CrossRef]
  34. Weathers, K.C.; Likens, G.E.; Bormann, F.H.; Bicknell, S.H.; Bormann, B.T.; Daube, B.C.; Eaton, J.S.; Galloway, J.N.; Keene, W.C. Cloudwater chemistry from ten sites in North America. Environ. Sci. Technol. 1988, 22, 1018–1026. [Google Scholar] [CrossRef]
  35. Crosbie, E.; Brown, M.D.; Shook, M.; Ziemba, L.; Moore, R.H.; Shingler, T.; Winstead, E.; Thornhill, K.L.; Robinson, C.; MacDonald, A.B.; et al. Development and characterization of a high-efficiency, aircraft-based axial cyclone cloud water collector. Atmos. Meas. Tech. 2018, 11, 5025–5048. [Google Scholar] [CrossRef] [Green Version]
  36. Skarżyńska, K.; Polkowska, Ż.; Namieśnik, J. Sample handling and determination of physico-chemical parameters in rime, hoarfrost, dew, fog and cloud water samples—A review. Pol. J. Environ. Stud. 2005, 15, 185–209. [Google Scholar]
  37. Wieprecht, W.; Acker, K.; Mertes, S.; Collett, J.; Jaeschke, W.; Brüggemann, E.; Möller, D.; Herrmann, H. Cloud physics and cloud water sampler comparison during FEBUKO. Atmos. Environ. 2005, 39, 4267–4277. [Google Scholar] [CrossRef]
  38. Zhao, Y.; Hallar, A.G.; Mazzoleni, L.R. Atmospheric organic matter in clouds: Exact masses and molecular formula identification using ultrahigh-resolution FT-ICR mass spectrometry. Atmos. Chem. Phys. 2013, 13, 12343–12362. [Google Scholar] [CrossRef] [Green Version]
  39. Baray, J.-L.; Deguillaume, L.; Colomb, A.; Sellegri, K.; Freney, E.; Rose, C.; Baelen, J.V.; Pichon, J.-M.; Picard, D.; Fréville, P.; et al. Cézeaux-Aulnat-Opme-Puy De Dôme: A multi-site for the long term survey of the tropospheric composition and climate change. Atmos. Meas. Tech. 2020, 13, 3413–3445. [Google Scholar] [CrossRef]
  40. Acker, K. Mt. Brocken, a site for a cloud chemistry measurement programme in Central Europe. Water Air Soil Pollut. 1995, 4, 6. [Google Scholar]
  41. Takeuchi, M.; Okochi, H.; Igawa, M. Characteristics of water-soluble components of atmospheric aerosols in Yokohama and Mt. Oyama, Japan from 1990 to 2001. Atmos. Environ. 2004, 38, 4701–4708. [Google Scholar] [CrossRef]
  42. Science, G. Experimental evidence of the feeding of the free troposphere with aerosol particles from the mixing layer. Aerosol Air Qual. Res. 2016, 16, 702–716. [Google Scholar] [CrossRef] [Green Version]
  43. Putaud, J.-P.; Raes, F.; Van Dingenen, R.; Brüggemann, E.; Facchini, M.-C.; Decesari, S.; Fuzzi, S.; Gehrig, R.; Hüglin, C.; Laj, P.; et al. A European aerosol phenomenology—2: Chemical characteristics of particulate matter at kerbside, urban, rural and background sites in Europe. Atmos. Environ. 2004, 38, 2579–2595. [Google Scholar] [CrossRef]
  44. Clain, G.; Baray, J.-L.; Delmas, R.; Keckhut, P.; Cammas, J.-P. A lagrangian approach to analyse the tropospheric ozone climatology in the tropics: Climatology of stratosphere–troposphere exchange at Reunion Island. Atmos. Environ. 2010, 44, 968–975. [Google Scholar] [CrossRef]
  45. Hondula, D.M.; Sitka, L.; Davis, R.E.; Knight, D.B.; Gawtry, S.D.; Deaton, M.L.; Lee, T.R.; Normile, C.P.; Stenger, P.J. A back-trajectory and air mass climatology for the Northern Shenandoah Valley, USA. Int. J. Climatol. 2010, 30, 569–581. [Google Scholar] [CrossRef]
  46. Deguillaume, L.; Charbouillot, T.; Joly, M.; Vaïtilingom, M.; Parazols, M.; Marinoni, A.; Amato, P.; Delort, A.-M.; Vinatier, V.; Flossmann, A.; et al. Classification of clouds sampled at the puy de Dôme (France) based on 10 yr of monitoring of their physicochemical properties. Atmos. Chem. Phys. 2014, 14, 1485–1506. [Google Scholar] [CrossRef] [Green Version]
  47. Deininger, C.K.; Saxena, V.K. A validation of back trajectories of air masses by principal component analysis of ion concentrations in cloud water. Atmos. Environ. 1997, 31, 295–300. [Google Scholar] [CrossRef]
  48. Kim, M.-G.; Lee, B.-K.; Kim, H.-J. Cloud/fog water chemistry at a high elevation site in South Korea. J. Atmos. Chem. 2006, 55, 13–29. [Google Scholar] [CrossRef]
  49. Yue, Y.; Niu, S.; Zhao, L.; Zhang, Y.; Xu, F. The influences of macro- and microphysical characteristics of sea-fog on fog-water chemical composition. Adv. Atmos. Sci. 2014, 31, 624–636. [Google Scholar] [CrossRef]
  50. Baray, J.-L.; Bah, A.; Cacault, P.; Sellegri, K.; Pichon, J.-M.; Deguillaume, L.; Montoux, N.; Noel, V.; Seze, G.; Gabarrot, F.; et al. Cloud occurrence frequency at puy de Dôme (France) deduced from an automatic camera image analysis: Method, validation, and comparisons with larger scale parameters. Atmosphere 2019, 10, 808. [Google Scholar] [CrossRef] [Green Version]
  51. Brantner, B.; Fierlinger, H.; Puxbaum, H. Cloudwater chemistry in the subcooled droplet regime at Mount Sonnblick (3106 M A.S.L., Salzburg, Austria). Water Air Soil Pollut. 1993, 74, 362–384. [Google Scholar]
  52. Lebedev, A.T.; Polyakova, O.V.; Mazur, D.M.; Artaev, V.B.; Canet, I.; Lallement, A.; Vaïtilingom, M.; Deguillaume, L.; Delort, A.-M. Detection of semi-volatile compounds in cloud waters by GC×GC-TOF-MS. Evidence of phenols and phthalates as priority pollutants. Environ. Pollut. 2018, 241, 616–625. [Google Scholar] [CrossRef] [PubMed]
  53. Wirgot, N.; Vinatier, V.; Deguillaume, L.; Sancelme, M.; Delort, A.-M. H2O2 modulates the energetic metabolism of the cloud microbiome. Atmos. Chem. Phys. 2017, 17, 14841–14851. [Google Scholar] [CrossRef] [Green Version]
  54. Renard, P.; Canet, I.; Sancelme, M.; Wirgot, N.; Deguillaume, L.; Delort, A.-M. Screening of cloud microorganisms isolated at the Puy de Dôme (France) station for the production of biosurfactants. Atmos. Chem. Phys. 2016, 16, 12347–12358. [Google Scholar] [CrossRef] [Green Version]
  55. Lallement, A.; Besaury, L.; Tixier, E.; Sancelme, M.; Amato, P.; Vinatier, V.; Canet, I.; Polyakova, O.V.; Artaev, V.B.; Lebedev, A.T.; et al. Potential for phenol biodegradation in cloud waters. Biogeosciences 2018, 15, 5733–5744. [Google Scholar] [CrossRef] [Green Version]
  56. Stookey, L.L. Ferrozine—A new spectrophotometric reagent for iron. Anal. Chem. 1970, 42, 779–781. [Google Scholar] [CrossRef] [Green Version]
  57. Amato, P.; Joly, M.; Besaury, L.; Oudart, A.; Taib, N.; Moné, A.I.; Deguillaume, L.; Delort, A.-M.; Debroas, D. Active microorganisms thrive among extremely diverse communities in cloud water. PLoS ONE 2017, 12, e0182869. [Google Scholar] [CrossRef] [Green Version]
  58. Amato, P.; Besaury, L.; Joly, M.; Penaud, B.; Deguillaume, L.; Delort, A.-M. Metatranscriptomic exploration of microbial functioning in clouds. Sci. Rep. 2019, 9, 4383. [Google Scholar] [CrossRef] [Green Version]
  59. Bianco, A.; Voyard, G.; Deguillaume, L.; Mailhot, G.; Brigante, M. Improving the characterization of dissolved organic carbon in cloud water: Amino acids and their impact on the oxidant capacity. Sci. Rep. 2016, 6, 37420. [Google Scholar] [CrossRef] [Green Version]
  60. Bianco, A.; Vaïtilingom, M.; Bridoux, M.; Chaumerliac, N.; Pichon, J.-M.; Piro, J.-L.; Deguillaume, L. Trace metals in cloud water sampled at the puy de Dôme station. Atmosphere 2017, 8, 225. [Google Scholar] [CrossRef] [Green Version]
  61. Bianco, A.; Deguillaume, L.; Chaumerliac, N.; Vaïtilingom, M.; Wang, M.; Delort, A.-M.; Bridoux, M.C. Effect of endogenous microbiota on the molecular composition of cloud water: A study by Fourier-transform ion cyclotron resonance mass spectrometry (FT-ICR MS). Sci. Rep. 2019, 9, 7663. [Google Scholar] [CrossRef] [PubMed]
  62. Martinsson, J.; Monteil, G.; Sporre, M.K.; Kaldal Hansen, A.M.; Kristensson, A.; Eriksson Stenström, K.; Swietlicki, E.; Glasius, M. Exploring sources of biogenic secondary organic aerosol compounds using chemical analysis and the FLEXPART model. Atmos. Chem. Phys. 2017, 17, 11025–11040. [Google Scholar] [CrossRef] [Green Version]
  63. Van Pinxteren, D.; Brüggemann, E.; Gnauk, T.; Müller, K.; Thiel, C.; Herrmann, H. A GIS based approach to back trajectory analysis for the source apportionment of aerosol constituents and its first application. J. Atmos. Chem. 2010, 67, 1–28. [Google Scholar] [CrossRef]
  64. Hoffmann, L.; Günther, G.; Li, D.; Stein, O.; Wu, X.; Griessbach, S.; Heng, Y.; Konopka, P.; Müller, R.; Vogel, B.; et al. From ERA-Interim to ERA5: The considerable impact of ECMWF’s next-generation reanalysis on Lagrangian transport simulations. Atmos. Chem. Phys. 2019, 19, 3097–3124. [Google Scholar] [CrossRef] [Green Version]
  65. Bezdek, A.; Sebera, J. MATLAB script for visualizing geoid height and other elevation data on rotating 3D globe. Comput. Geosci. 2013, 56, 127–130. [Google Scholar] [CrossRef]
  66. Ilin, A.; Raiko, T. Practical Approaches to principal component analysis in the presence of missing values. J. Mach. Learn. Res. 2010, 11, 1957–2000. [Google Scholar]
  67. Addinsoft Addinsoft. XLSTAT Statistical and Data Analysis Solution. New York, NY, USA, 2020. Available online: https://www.xlstat.com (accessed on 23 May 2020).
  68. Błaś, M.; Polkowska, Ż.; Sobik, M.; Klimaszewska, K.; Nowiński, K.; Namieśnik, J. Fog water chemical composition in different geographic regions of Poland. Atmos. Res. 2010, 95, 455–469. [Google Scholar] [CrossRef]
  69. Collett, J.L.; Bator, A.; Sherman, D.E.; Moore, K.F.; Hoag, K.J.; Demoz, B.B.; Rao, X.; Reilly, J.E. The chemical composition of fogs and intercepted clouds in the United States. Atmos. Res. 2002, 64, 29–40. [Google Scholar] [CrossRef]
  70. Nieberding, F.; Breuer, B.; Braeckevelt, E.; Klemm, O.; Song, Q.; Zhang, Y. Fog Water Chemical Composition on Ailaoshan Mountain, Yunnan Province, SW China. Aerosol Air Qual. Res. 2017, 18, 37–48. [Google Scholar] [CrossRef]
  71. Wang, Y.; Zhang, J.; Marcotte, A.R.; Karl, M.; Dye, C.; Herckes, P. Fog chemistry at three sites in Norway. Atmos. Res. 2015, 151, 72–81. [Google Scholar] [CrossRef]
  72. Xu, X.; Chen, J.; Zhu, C.; Li, J.; Sui, X.; Liu, L.; Sun, J. Fog composition along the Yangtze River basin: Detecting emission sources of pollutants in fog water. J. Environ. Sci. 2018, 71, 2–12. [Google Scholar] [CrossRef] [PubMed]
  73. Möller, D.; Acker, K.; Wieprecht, W. A relationship between liquid water content and chemical composition in clouds. Atmos. Res. 1996, 41, 321–335. [Google Scholar] [CrossRef]
  74. Collett, J.L.; Daube, B.C.; Gunz, D.; Hoffmann, M.R. Intensive studies of Sierra Nevada cloudwater chemistry and its relationship to precursor aerosol and gas concentrations. Atmos. Environ. Part Gen. Top. 1990, 24, 1741–1757. [Google Scholar] [CrossRef]
  75. Watanabe, K.; Ishizaka, Y.; Takenaka, C. Chemical characteristics of cloud water over the Japan Sea and the Northwestern Pacific Ocean near the central part of Japan: Airborne measurements. Atmos. Environ. 2001, 35, 645–655. [Google Scholar] [CrossRef]
  76. Bourcier, L.; Sellegri, K.; Chausse, P.; Pichon, J.M.; Laj, P. Seasonal variation of water-soluble inorganic components in aerosol size-segregated at the puy de Dôme station (1465 m a.s.l.), France. J. Atmos. Chem. 2012, 69, 47–66. [Google Scholar] [CrossRef]
  77. Fu, P.; Kawamura, K.; Kobayashi, M.; Simoneit, B.R.T. Seasonal variations of sugars in atmospheric particulate matter from Gosan, Jeju Island: Significant contributions of airborne pollen and Asian dust in spring. Atmos. Environ. 2012, 55, 234–239. [Google Scholar] [CrossRef] [Green Version]
  78. Shapiro, J.B.; Simpson, H.J.; Griffin, K.L.; Schuster, W.S.F. Precipitation chloride at West Point, NY: Seasonal patterns and possible contributions from non-seawater sources. Atmos. Environ. 2007, 41, 2240–2254. [Google Scholar] [CrossRef]
  79. Kundu, S.; Kawamura, K.; Andreae, T.W.; Hoffer, A.; Andreae, M.O. Diurnal variation in the water-soluble inorganic ions, organic carbon and isotopic compositions of total carbon and nitrogen in biomass burning aerosols from the LBA-SMOCC campaign in Rondônia, Brazil. J. Aerosol Sci. 2010, 41, 118–133. [Google Scholar] [CrossRef] [Green Version]
  80. Elbert, W.; Krämer, M.; Andreae, M.O. Reply to discussion on “Control of solute concentrations in cloud and fog water by liquid water content”. Atmos. Environ. 2002, 11, 1909–1910. [Google Scholar] [CrossRef]
  81. Fahey, K.M.; Pandis, S.N.; Collett, J.L.; Herckes, P. The influence of size-dependent droplet composition on pollutant processing by fogs. Atmos. Environ. 2005, 39, 4561–4574. [Google Scholar] [CrossRef]
  82. Reilly, J.E.; Rattigan, O.V.; Moore, K.F.; Judd, C.; Eli Sherman, D.; Dutkiewicz, V.A.; Kreidenweis, S.M.; Husain, L.; Collett, J.L. Drop size-dependent S(IV) oxidation in chemically heterogeneous radiation fogs. Atmos. Environ. 2001, 35, 5717–5728. [Google Scholar] [CrossRef]
  83. Herrmann, H.; Exner, M.; Zellner, R. Reactivity trends in reactions of the nitrate radical (NO3) with inorganic and organic cloudwater constituents. Geochim. Cosmochim. Acta 1994, 58, 3239–3244. [Google Scholar] [CrossRef]
  84. Heuvel, A.P.V.D.; Mason, B.J. The formation of ammonium sulphate in water droplets exposed to gaseous sulphur dioxide and ammonia. Q. J. R. Meteorol. Soc. 1963, 89, 271–275. [Google Scholar] [CrossRef]
  85. Hung, H.-M.; Hoffmann, M.R. Oxidation of Gas-Phase SO2 on the Surfaces of Acidic Microdroplets: Implications for Sulfate and Sulfate Radical Anion Formation in the Atmospheric Liquid Phase. Environ. Sci. Technol. 2015, 49, 13768–13776. [Google Scholar] [CrossRef] [PubMed]
  86. Kwong, K.C.; Chim, M.M.; Davies, J.F.; Wilson, K.R.; Chan, M.N. Importance of sulfate radical anion formation and chemistry in heterogeneous OH oxidation of sodium methyl sulfate, the smallest organosulfate. Atmos. Chem. Phys. Online 2018, 18. [Google Scholar] [CrossRef] [Green Version]
  87. Rose, C.; Chaumerliac, N.; Deguillaume, L.; Perroux, H.; Mouchel-Vallon, C.; Leriche, M.; Patryl, L.; Armand, P. Modeling the partitioning of organic chemical species in cloud phases with CLEPS (1.1). Atmos. Chem. Phys. 2018, 18, 2225–2242. [Google Scholar] [CrossRef] [Green Version]
Figure 1. Dendrogram representing the agglomerative hierarchical clustering (AHC) based on dissimilarities using the Ward’s method on 6 inorganic ion concentrations. The 208 cloud samples (without chemical missing values) were assigned to one of four automatically established categories (dissimilarities values displayed in bold). The six ions are the same as those used for principal component analysis (PCA).
Atmosphere 11 00732 g001
Figure 2. Profile plot established by the AHC from the six main inorganic ions (Na+, Cl, Mg2+, SO42−, NH4+, and NO3). The Y axis displays the normalized (([Cl] − [Cl]min)/([Cl]max − [Cl]min)) ion concentrations of the category centroids.
Atmosphere 11 00732 g002
Figure 3. Distribution of inorganic ions (Cl, Mg2+, Na+, NH4+, NO3, and SO42−) of the cloud waters sampled at PUY for each air mass category (marine, highly marine, continental, and polluted). The number of analyzed samples is 208 (samples with missing data were removed). One box plot per category is displayed for each ion. The mean values are displayed as red crosses. The central horizontal bars are the medians. The lower and upper limits of the box are the first and third quartiles, respectively. The ends of whiskers are 10th and 90th percentiles. Black diamonds are minimum and maximum for each species. The box plot’s horizontal width has no statistical meaning. Statistical differences (Kruskal–Wallis test; p value < 0.05) between groups are indicated above box plots.
Atmosphere 11 00732 g003
Figure 4. Principal component analysis (PCA) on a Spearman correlation chemical matrix. (a) Correlation circle and projection of the 6 ion concentrations; (b) Two-dimensional map of the colored observations according to the AHC category. The XLstat software automatically displayed confidence ellipses (interval 95%) around AHC categories, and resized points with squared cosines of the observations (i.e., the larger the point, the more it is related to a factor, F1 or F2).
Atmosphere 11 00732 g004
Figure 5. Mann–Whitney nonparametric tests on 154 clouds sampled from 2001 to 2011, the period covered by the previous study [46], and 88 clouds sampled from 2012 to 2018. We compare, for both periods, NH4+, NO3, and SO42−concentrations. The p-values of all pairwise comparisons are significant at level alpha = 0.05.
Atmosphere 11 00732 g005
Figure 6. (a) Natural logarithm of the number of CAT (computing advection-interpolation of atmospheric parameters and trajectory tool) back trajectories points arriving at the summit of the PUY station per square of 0.8° size for “highly marine” (top left), “marine” (bottom left), “polluted” (top right), and “continental” (bottom right) categories. The black lines separate the different sectors. Distributions of the parameters evaluated by the CAT model for all the 295 cloud events; (b) Percentage of the time spent over the “sea surface” (blue) and “continental surface” (brown), in pale blue and pale brown below the atmospheric boundary layer height (<ABLH) and dark above in the free troposphere (>ABLH); (c) Percentage of the time spent in the 8 forty-five degrees sectors (NNE, ENE, ESE, SSE, SSW, WSW, WNW and NNW). One box plot per zone/sector is displayed. The black crosses correspond to the means. The central horizontal bars are the medians. The lower and upper limits of the box are the first and third quartiles, respectively. The ends of whiskers are 10th and 90th percentiles. Black diamonds are minimum and maximum for each species.
Atmosphere 11 00732 g006
Figure 7. Partial least squares (PLS) chart with t component on axes t1 and t2. The correlations map superimposes the “Xs”, the “Ys” and the cloud events. The dependent variables from the chemical matrix are symbolized by a black “Y”; the explanatory variables from the “sector matrix” by a black “X”; and from the “zone matrix” by a blue, brown, light or dark “X”. The 208 cloud events are gathered by AHC category (red circle, “marine”; dark blue diamond, “highly marine”; yellow square, “continental”; and red triangle, “polluted”).
Atmosphere 11 00732 g007
Figure 8. Chemistry/Microphysics PLS chart of cloud samples with t component on axes t1 and t2. Correlations map allows superimposing the “Xs” and the “Ys” (observations are removed for clarity). PLS performed on 73 cloud events. The dependent variables from the chemical matrix are displayed in blue, the explanatory variables from the microphysics matrix in red.
Atmosphere 11 00732 g008
Table 1. PLS correlation matrix between clustered sector variables and zone variables. Highest correlation displayed in red and highest anti-correlation in blue.
Variables“Sea Surface” (<ABLH)“Sea Surface” (>ABLH)“Continental Surface” (<ABLH)“Continental Surface” (>ABLH)
WSW_WNW0.350.38−0.27−0.72
NNW_NNE_ENE−0.33−0.440.310.76
ESE_SSE_SSW−0.03−0.02−0.040.07
Table 2. PLS correlation matrix between chemical variables and both zone and clustered sector variables. Highest correlation displayed in dark red and highest anti-correlation in dark blue.
Variables“Sea Surface” (<ABLH)“Sea Surface” (>ABLH)“Continental Surface” (<ABLH)“Continental Surface” (>ABLH)WSW
WNW
NNW
NNE
ENE
ESE
SSE
SSW
Cl0.030.14−0.12−0.160.16−0.13−0.10
Mg2+0.060.14−0.13−0.190.18−0.15−0.10
Na+−0.090.25−0.16−0.160.20−0.18−0.08
NH4+−0.28−0.030.030.31−0.300.300.01
NO3−0.25−0.260.150.51−0.460.51−0.04
SO42−−0.18−0.060.120.21−0.350.300.09

