1. Introduction
The World Health Organization [
1] stated that around 6 million people living in cities die from environmental pollution, of which pollutants are presumably part of the problem because they can adhere to plant leaves and trees [
2,
3], on the soil [
2,
4,
5], and in road dust [
3,
6].
Road dust is composed of fine particles with presumably contaminating elements; it is a mixture of natural soil; soil brought from other places for the refurbishment of green areas; cars’ wear particles (combustion smoke, brakes, and oil, among others); and motor vehicles; and weathering particles of roads, mainly [
7,
8,
9,
10]. The prolonged exposure to particles with presumably contaminating elements and with sizes of 10 μm or smaller, can lead them to enter the respiratory system, deposit in the trachea and lungs, reach the bloodstream, and generate various health problems, including being precursors of cancer [
11].
Potentially toxic elements pollution in road dust is an issue that affects the population health; however, its continuous monitoring is disregarded because of the expensive studies and prolonged analysis time. Then, in the last decade, proxy technologies (fast and low cost) have emerged for diagnosis. Among the proxy techniques, environmental magnetism [
2,
3,
8,
12]; and the color of the particles [
6,
13,
14] stand out. In this sense, it will be of great help to have a type of proxy technology that allows the selection of tens and not hundreds or thousands of samples that could go to the laboratory to be analyzed.
Color is a physical property of particles that often correlates with chemical properties; for example, in soils, the color is related to organic matter [
15,
16], minerals [
17,
18,
19], humidity, and drainage regime [
20], among others. In road dust, the background on the subject is scarce, few authors have reported the relationship between road dust color and presumably contaminating elements [
6,
13,
14].
Technological advances have allowed the measurement of color with the traditional alphanumeric system [
21] to numerical measurements using the CIELab and RGB systems [
20,
22]. This fact has allowed the possibility of making mathematical relationships with the chemical properties of road dust [
6,
23].
On the other hand, for its exceptionally diverse components, each city is a particular case, because the color of road dust depends on the natural components (types of rock and soil), as well as on the types of the intensity of human activities and types of urban land use.
The objective of this study was to evaluate the use of color, a fast and low-cost proxy technique, as an indicator of potentially toxic element contamination in road dust samples from Mérida, México, as well as evaluating the concentration of potentially toxic elements by type of road.
2. Materials and Methods
2.1. Study Area
The city of Mérida Yucatán is located at coordinates 20°58′04″ N 89°37′18″ W, and is located on a structural karst plain with an average altitude of 9 m above sea level. The climate is warm subhumid (between 28–38 °C) with rains in summer Aw0 (i ‘) gw’ ‘is the driest subtype, with a thermal oscillation of 5 to 7 °C between the warmest month and the coldest month [
24]. The dominant soils are from the Leptosol group with Nudilthic, Lithic, and Rendzic qualifiers [
25].
Systematic sampling with homogeneously distributed samples was designed, 86 samples of road dust were taken on the streets, the sampling area was 1 m
2, and the geographical location of the sampling sites was taken. We select the place with the highest amount of road dust within a radius of 20 m around each sampling site, with the idea of having a sufficient amount of sample for chemical and mineralogical analyses (
Figure 1).
The samples of the road dust were dried in the shade, ground with an agate mortar, and screened with ten mesh (2 mm).
2.2. Chemical and Physical Analyses of Road Dust
With the road dust samples, we prepared tablets with 0.4 g. The sample of road dust was placed in a die of 5 mm in diameter and compressed at 4000 psi pressure for 2 min, without any chemical or binder treatment. The tablets were placed on the sample holder and sealed using Mylar film. The road dust was analyzed using X-ray fluorescence with dispersed energy (FRX-ED), in a Jordan Valley spectrometer (EX-6600) equipped with a Si (Li) detector with an active area of 20 mm
2 and a resolution of 140 eV to 5.9 keV, operating at a maximum of 54 keV and 4800 μA; international reference patterns were utilized for rocks and soils [
5,
26,
27].
As a quality control measure, the samples were analyzed five times. The calibration curve was made using the standards of the IGL series. The IGLsy-1 standard, which corresponds to a nepheline Syenite with a high content of Al and Si, was used as measurement control. The use of the XRF-DE technique is common and appropriate in pollution studies (soils and dust) in which the concentrations of potentially toxic elements are of the order of tenths and hundredths of mg/kg, as was the case with this study [
5,
27].
The analyzed elements were those typically measured in contamination studies, such as copper (Cu), zinc (Zn), and lead (Pb). Those that come from the combustion of fossil fuels, such as iron oxides (Fe2O3) and titanium oxide (TiO2). Three elements that are commonly found in the soils of the study area, such as strontium (Sr), yttrium (Y), and rubidium (Rb), and the following major elements: CaO, Na2, K2O, MgO, MnO, Al2O3, and SiO2. The measurements were made in the National Laboratory of Nano and Biomaterials (LANNBIO), at CINVESTAV Mérida, Yucatán.
The samples of road dust were also analyzed using the Munsell table [
21]. The color of the road dust was also measured using diffuse reflectance spectroscopy with an optical reflectance in a spectral range of 380–1100 nm using a UV/VIS fiber-optic spectrophotometer (AvaSpec HS2048 XL model) coupled to an integration sphere (AvaSphere-50-REFL model). The integration sphere minimizes the specular/diffuse reflectance ratio of the captured radiation [
19]. In this configuration, a deuterium-halogen light source (AvaLight DH-S-BAL model) illuminates the sample, and the spectrometer receives the reflectance of the sample. Five measurements were done for each sample in order to obtain a representative value; the WS-2 standard (Avantes) was used as a blank standard. The results are generated in the color system X, Y, Z.
The X, Y, and Z color data were converted to the decimal RGB color system using the Color Slide Rule program, from this system, hue (HI), redness (RI), and saturation (SI) color indices were obtained. Color indices were obtained with the following equations, where R, G, and B, corresponding to red, green, and blue, respectively [
28]:
2.3. Mineralogy and Morphology of Road Dust Particles
XRD analyses were performed to identify minerals present in road dust. The particles were placed on a silicon sample holder coated with silicone grease suitable for XRD; subsequently, they were analyzed on a Siemens D-5000 diffractometer, Bragg-Brentano Mode, with a monochromatic Cu tube (l = 1.5418 Å), a step time of 3 s, step size 0.02 degrees, at 34 kV and 25 mA.
The shape, size, and composition of the particles were determined with a Philips ESEM XL30 scanning electron microscope coupled with EDAX GENESIS with SiLi detector, 10 L, 204 Bt (SEM-EDS). The particles were mounted on a double-sided (0.5 cm2) carbon adhesive tape attached to a sample holder. Then, the micrographs were obtained to determine the size and the elemental composition of the particles by X-ray energy dispersion spectrometry (EDS). A total of 10 samples were analyzed by XRD and SEM-EDS.
2.4. Data Analyses
The color groups visually identified with the Munsell table were validated in two ways. The first using the color indices (HI, RI, and SI) as classification variables. The second validation was carried out using potentially toxic element concentrations as classification variables. For both, Statgraphic Plus 5.1 software was used [
29].
The discriminant analysis was used to validate, or not, the formation of groups by color. This type of multivariate statistical analysis also identifies the number of correctly classified cases, as well as the variables that allow differentiating groups of objects. The groups of the road dust samples formed by color using the Munsell table were used as dependent variables or discriminant variables [
6].
The medium concentrations of each potentially toxic element and major elements per road dust color group were compared using the Kruskal–Wallis test, considering statistically significant differences with
p < 0.05, as it is the best method to compare populations where there is no Gaussian distribution of the data. This test evaluates the hypothesis that the medians of each group are equal, combines the data of all the groups, and orders them from least to greatest, then calculates the average range for the data of each group [
30].
3. Results
3.1. Formation of the Grouping of Road Dust Samples by Color
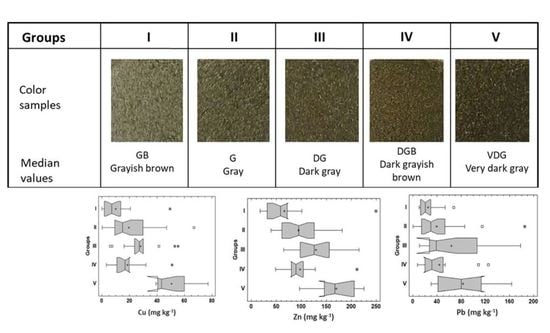
Five groups of road dust colors were identified: I, GB, greyish brown; II, G, gray; III, DG, dark gray; IV, DGB, dark grayish brown; and V, VDG, very dark gray (
Figure 2). Group I that corresponds to the greyish brown road dust had higher RGB values than the darkest color groups.
The comparison analysis of medians reveals that the formation of the five groups of the road dust samples by color, using the Munsell table, as a discriminant variable and the three-color indices (IH, IR, and IS) used as classification variables give a total of 93% of correctly assigned cases, which validates the formation of these five groups of road dust samples (
Table 1).
On the other hand, when presumably contaminating elements were used as dependent or classification variables, the discriminant analysis had 47% correctly classified cases. The very dark gray and greyish brown color samples reached 87.5% and 77.5% of correctly assigned cases, respectively (
Table 2). On the contrary, gray colors obtained the lowest value of the percentage of correctly assigned cases. That is the formation of road dust groups by color, and considering the concentration of presumably contaminating elements makes sense only in the case of very dark gray and grayish brown groups.
3.2. Color Indices and Presumably Contaminating Elements by Color Groups of Road Dust Samples
Figure 3 shows significant differences (
p < 0.05) in HI, SI, and RI. HI and SI values show a downward trend in groups I < II < III < V, only group IV does not follow the sequence. The trend ranges from the lightest to the darkest. The RI allows differentiating group IV, and it is the most blown group.
Potentially toxic element concentrations had significant differences with
p values < 0.05), except for the Rb that had
p values < 0.1 (
Figure 4). There is a tendency to increase potentially toxic element concentrations (Y, Cu, Zn, Pb, TiO
2, and Fe
2O
3), according to the darkest color groups, that is, a sequence of I < II < III < V (
Figure 4). Only in the case of Sr, road dust of group IV (dark grayish brown) reached the highest concentrations. This group of road dust samples is different from the other groups, probably with very different minerals.
The primary roads had higher concentrations of Cu, Ni, Pb, and Zn in the road dust than the secondary and tertiary roads, as a consequence of the traffic of a greater number of cars (
Figure 5). On the contrary, major elements such as CaO dominate on tertiary roads where fewer cars travel but where there is more dust of natural origin. Other elements as Na
2, K
2O, MgO, MnO, Al
2O
3, and SiO
2 did not show differences between types of roads.
The percentages of Fe2O3 and TiO2 in road dust were higher in primary roads because these elements come from the wear and tear of cars and are also found in combustion fumes.
Calcite, quartz, ankerite, anorthoclase, and albite were the main minerals of road dust (
Figure 6). These minerals are generally white, colorless, and gray. In smaller quantities, natural minerals were found such as hematite (red), goethite (brown), boehmite (white), dikite (white), sanidine (white), tosidite (white, light yellow, light green), and yeelimite (colorless).
Maghemite (black, blackish-brown) is a mineral of anthropogenic origin in road dust [
31,
32,
33] (
Figure 6), it comes from car fumes, and which blackens dust. Maghemite is also the mineral that gives the highest magnetic signal to road dust, a property widely reported as a rapid diagnostic technique for heavy metals.
Observations of the dust in the scanning electron microscope allowed the identification of spherical and laminar particles, both of anthropogenic origin. The spherical ones from the combustion of gasoline (
Figure 7), and the laminar ones from car brakes.
The shape of the particles has been studied since the 1980s, to recognize the morphology of magnetic particles of anthropic origin [
34]. For those studies, it has been concluded that spherical particles come from vehicle emissions, these are associated with the burning of gasoline [
35].
4. Discussion
Previous studies conducted in Murcia, Spain [
13] and Mexico City [
14,
36] reported that dark-colored samples were those with the highest concentrations of presumably contaminating elements; however, in a study conducted in the city of Ensenada, Mexico [
6] it did not happen in the same way, in that case, the gray road dust was the most contaminated with presumably contaminating elements. In the same way, in this study, the road dust of groups IV and V were the darkest, but the dust of group IV was not the most contaminated.
The significant variability in the chemical and mineralogical properties of the soils of the city of Mérida with soils of red, brown, black, and gray [
25] may be the cause of which not all dark soils in this study are the most contaminated with presumably contaminating elements.
Dark colors in road dust can occur naturally by mixing with soils with high organic matter content (fertilizers applied in gardens or with high humus contents) [
25,
37]. However, the dark color in road dust can also be acquired anthropically, by contamination with magnetite and maghemite products from the use of fossil fuels in industries, homes, and cars [
36,
38,
39].
Smaller particles, such as carbon, magnetite, and maghemite nanoparticles produced in car smoke that are black, can have a profound effect on the color of road dust, despite not being the dominant particles in quantity or weight [
40].
Rock magnetism techniques, such as magnetic susceptibility, have been used to discern whether the dark color is from anthropic contamination (high values) or due to natural causes (low values) resulting from organic matter [
2,
8,
39,
40,
41].
On the other hand, with the idea of establishing a system for monitoring potentially toxic elements in road dust in the city of Mérida, it is recommended to make a color chart of road dust with the results of this work to be used in future road dust sampling. Although there are other more precise tools to measure the color of road dust, such as colorimeters in mobile equipment and digital cameras [
6,
28] and other color measurement systems [
14,
41,
42,
43], there will be nothing less expensive than a simple color chart especially designed for the road dust of each city.
With this technique of grouping road dust samples by color it will now be possible to implement a monitoring system in cities, many samples (hundreds or thousands) can be taken and then selected, by color, road dust samples to which will be analyzed presumably contaminating elements. In other words, it is necessary to go from the elaboration of isolated and punctual diagnoses to the instrumentation of a true monitoring system.
The measurement of color by comparison with a color chart of road dust made especially for each city would allow people to use it to assess the degree of potentially toxic element contamination of road dust inside their homes, and thus make decisions to reduce the risk of harm to health [
44].
5. Conclusions
The five colors of road dust samples from the city of Mérida, Mexico, can be used as a guide to discard or select samples contaminated with presumably contaminating elements and oxides of Ti and Fe. That is, the color of road dust can be used as a proxy technique.
We conclude that there is low contamination by presumably contaminating elements, and oxides in both road dust samples of greyish brown (I) and dark grayish brown (IV) colors; medium contamination in gray (II) road dust samples; and high pollution in road dust samples with dark gray (III) and very dark gray (V) colors. Therefore, for monitoring the contamination of presumably contaminating elements in road dust, both samples of greyish brown and dark grayish brown colors can be discarded from the chemical analysis.
Munsell color charts and color indices (IH and IS) can be used as proxy indicators for samples of dust contaminated with metals such as lead, zinc, and copper.
The contamination is in descending order in the primary, secondary and tertiary roads. A strategy to avoid damage to health from road dust should begin by cleaning primary roads and areas with dark gray and very dark gray-colored dust.
Author Contributions
Y.A., participated in the design of the sampling, took the samples, and wrote the first version of the manuscript; F.B., was the project coordinator, designed the experiment, coordinated all project activities, and wrote the final version of the article; P.Q., performed the chemical analyses, and revised the text; D.A., assisted in the chemical analyses; R.T.-T., analyzed the color in the road dust samples; A.G., designed the experiment, and revised the text; R.C.-T., assisted in sampling, and observations of the particles in the SEM. All authors have read and agreed to the published version of the manuscript.
Funding
This study was financially supported by both the CONACYT project CB-2016-283135 and the project UNAM DGAPA-PAPIIT IN209218. The Laboratorio Nacional de Nano y Biomateriales, Cinvestav-IPN has been financed by FOMIX-Yucatán 2008-108160, CONACYT LAB-2009-01-123913, 292692, 294643, 188345 y 204822. Thanks to Ing. Emilio Corona for technical support.
Institutional Review Board Statement
Not applicable.
Informed Consent Statement
Not applicable.
Data Availability Statement
Not applicable.
Conflicts of Interest
The authors declare no conflict of interest.
References
- World Health Organization. Review of Evidence on Health Aspects of Air Pollution-REVIHAAPF; Technical Report; WHO Regional Office for Europe: Copenhagen, Denmark, 2013. [Google Scholar]
- Aguilar, B.; Bautista, F.; Goguitchaichvili, A.; Morton, O. Magnetic monitoring of top soils of Merida (Southern Mexico). Stud. Geophys. Geod. 2011, 55, 377–388. [Google Scholar]
- Aguilar, R.B.; Bautista, F.; Goguitchaichvili, A.; Quintana, P.; Carvallo, C.; Battu, J. Rock-Magnetic properties of topsoils and urban dust from Morelia, México: Implications for anthropogenic pollution monitoring in medium-size cities. Geofís. Int. 2013, 52, 121–133. [Google Scholar]
- Alcalá, J.; Sosa, M.; Moreno, M.; Rodríguez, J.C.; Quintana, C.; Terrazas, C.; Rivero, O. Metales pesados en suelo urbano como un indicador de la calidad ambiental: Ciudad de Chihuahua, México. Multequina 2009, 18, 53–69. [Google Scholar]
- Ihl, T.; Bautista, F.; Cejudo, R.; Delgado, C.; Quintana, P.; Aguilar, D.; Goguitchaichvili, A. Concentration of toxic elements in topsoils of the metropolitan area of México City: A spatial analysis using ordinary Kriging and indicator Kriging. Rev. Int. Contam. Ambie. 2015, 31, 47–62. [Google Scholar]
- Cortés, J.L.; Bautista, F.; Quintana, P.; Aguilar, D.; Goguichaishvili, A. The color of urban dust as an indicator of contamination by potentially toxic elements: The case of Ensenada, Baja California, Mexico. RCHSCFA 2015, 21, 255–266. [Google Scholar]
- Bautista, F.; Cram, S.; Sommer, I.S. Técnicas de muestreo para el estudio del manejo de recursos naturales y el cuidado del ambiente. In Editorial: Centro de Investigaciones en Geografía Ambiental, 2nd ed.; Bautista, F., Palacio, J.L., Delfín, H., Eds.; Universidad Nacional Autónoma de México: Mexico City, Mexico, 2011; pp. 227–258. [Google Scholar]
- Sánchez-Duque, A.; Bautista, F.; Goguichaishvili, A.; Cejudo-Ruiz, R.; Reyes-López, J.A.; Solís-Domínguez, F.A.; Morales-Contreras, J.J. Evaluación de la contaminación ambiental a partir del aumento magnético en polvos urbanos. Caso de estudio en la ciudad de Mexicali, México. RMCG 2015, 32, 501–513. [Google Scholar]
- Jiang, L.; Guang, A.; Mu, Z.; Zhan, H.; Wu, Y. Contamination levels and human health risk assessment of toxic heavy metals in street dust in an industrial city in Northwest China. Environ. Geochem. Health 2018, 40, 2007–2020. [Google Scholar] [CrossRef]
- Safiur, M.; Khan, M.D.H.; Jolly, Y.N.; Kabir, J.; Akter, S.; Salam, A. Assessing risk to human health for heavy metal contamination through street dust in the Southeast Asian Megacity: Dhaka, Bangladesh. Sci. Total Environ. 2019, 660, 1610–1622. [Google Scholar] [CrossRef]
- Sabath, D.E.; Osorio, L.R. Medio ambiente y riñón: Nefrotoxicidad por metales pesados. Nefrología. Publ. Soc. Esp. Nefrol. 2012, 32, 279–286. [Google Scholar]
- Wang, B.; Xia, D.; Yu, Y.; Jia, J.; Xu, S. Detection and differentiation of pollution in urban surface soils using magnetic properties in arid and semi-arid regions of northwestern China. Environ. Poll. 2014, 184, 335–346. [Google Scholar]
- Marín, P.; Sánchez, A.; Díaz-Pereira, E.; Bautista, F.; Romero, M.; Delgado, M.J. Assessment of Heavy Metals and Color as Indicators of Contamination in Street Dust of a City in SE Spain: Influence of Traffic Intensity and Sampling Location. Sustainability 2018, 10, 4105. [Google Scholar]
- García, R.; Delgado, C.; Cejudo, R.; Aguilera, A.; Gogichaishvili, A.; Bautista, F. The color of urban dust as an indicator of heavy metal pollution. RCHSCFA 2020, 26, 3–15. [Google Scholar]
- Dobos, R.R.; Ciolkosz, E.J.; Waltman, W.J. The effect of organic carbon, temperature, time, and redox conditions on soil color. Soil Sci. 1990, 150, 506–512. [Google Scholar]
- Schulze, D.G.; Nagel, J.L.; Van Scoyoc, G.E.; Henderson, T.L.; Baumgardner, M.F.; Stott, D.E. Significance of organic matter in determining soil colors. Soil Color 1993, 31, 71–90. [Google Scholar]
- Schwertmann, U. Relations between iron oxides, soil color, and soil formation. Soil Color 1993, 31, 51–69. [Google Scholar]
- Torrent, J.; Barrón, V. Laboratory measurement of soil color: Theory and practice. Soil Color 1993, 31, 21–33. [Google Scholar]
- Quintana, P.; Tiesler, V.; Conde, M.; Trejo-Tzab, R.; Bolio, C.; Alvarado-Gil, J.J.; Aguilar, D. Spectrochemical characterization of red pigments used in classic period maya funerary practices. Archaeometry 2014, 57, 1045–1059. [Google Scholar]
- Domínguez, J.M.; Román, A.D.; Prieto, F.; Acevedo, O. Sistema de Notación Munsell y CIELab como herramienta para evaluación de color en suelos. Rev. Mex. Cienc. Agríc. 2012, 3, 141–155. [Google Scholar]
- Color, M. Munsell Soil Color. Charts: Year 2000 Revised Washable Edition; GretagMacbeth: New York, NY, USA, 2000. [Google Scholar]
- Commision Internationale de l’Eclairage. Technical Report: Colorimetry, 2nd ed.; CIE: Vienna, Austria, 1986; pp. 1–68. [Google Scholar]
- Viscarra, R.A.; Fouad, Y.; Walter, C. Using a digital camera to measure soil organic carbon and iron contents. Biosyst. Eng. 2008, 100, 149–159. [Google Scholar]
- García, E. Modificaciones al Sistema de Clasificación Climática de köppen, 5th ed.; Universidad Nacional Autónoma de México: Urban, Mexico, 2004; p. 90. [Google Scholar]
- Bautista, F.; Díaz-Garrido, S.; Castillo-González, M.; Zinck, J.A. Spatial heterogeneity of the soil cover in the Yucatán Karst: Comparison of Mayan, WRB and numerical classification. Eurasian J. Soil Sci. 2005, 38, 80–87. [Google Scholar]
- Beckhoff, B.; Kanngießer, B.; Langhoff, N.; Wedell, R.; Wolff, H. Handbook of Practical X-Ray Fluorescence Analysis, 1st ed.; Springer: Berlin, Germany, 2006; pp. 1–410. [Google Scholar]
- Lozano, R.; Bernal, J.P. Characterization of a new set of eight geochemical reference materials for XRF major and trace element analysis. Rev. Mex. Cienc. Geol. 2005, 22, 329–344. [Google Scholar]
- Levin, N.; Ben-Dor, E.; Singer, A. A digital camera as a tool to measure color indices and related properties of sandy soils in semi-arid environments. Int. J. Rem. Sens. 2005, 26, 5475–5492. [Google Scholar]
- Statgraphics. Reference Manual, Manugistics; Statgraphics Plus, Version 5.1; Statpoint Technologies, Inc.: Rockville, MD, USA, 1992. [Google Scholar]
- Kruskal, W.H.; Wallis, W.A. Use of ranks in one-criterion variance analysis. J. Am. Stat. Assoc. 1952, 47, 583–621. [Google Scholar]
- Magiera, T.; Jabłońska, M.; Strzyszcz, Z.; Rachwal, M. Morphological and Mineralogical Forms of Technogenic Magnetic Particles in Industrial Dusts. Atmos. Environ. 2011, 45, 4281–4290. [Google Scholar] [CrossRef]
- Aguilera, A.; Armendariz, C.; Quintana, P.; García-Oliva, F.; Bautista, F. Influence of Land Use and Road Type on the Elemental Composition of Urban Dust in a Mexican Metropolitan Area. Pol. J. Environ. Stud. 2019, 28, 1535–1547. [Google Scholar] [CrossRef]
- Aguilera, A.; Bautista, F.; Gutiérrez-Ruiz, M.; Ceniceros-Gómez, A.; Cejudo, R.; Goguitchaichvili, A. Heavy metal pollution of street dust in the largest city of Mexico, sources and health risk assessment. Environ. Monit. Assess. 2021, 193, 1–16. [Google Scholar] [CrossRef]
- Liu, Q.; Roberts, A.; Larrasoaña, J.C.; Banerjee, S.K.; Guyodo, Y.; Tauxe, L.; Oldfield, F. Environmental Magnetism: Principles and Applications. Rev. Geophys. 2012, 50, RG4002. [Google Scholar] [CrossRef] [Green Version]
- Aguilera, A.; Morales, J.J.; Goguitchaichvili, A.; García-Oliva, F.; Armendariz-Arnez, C.; Quintana, P.; Bautista, F. Spatial distribution of magnetic material in urban road dust classified by land use and type of road in San Luis Potosí, Mexico. Air Qual. Atmos. Health 2020, 13, 951–963. [Google Scholar] [CrossRef]
- Bautista, F.; Gogichaishvili, A.; Delgado, C.; Quintana, P.; Aguilar, D.; Cejudo, R.; Cortés, J. El color como indicador de contaminación por metales pesados en suelos de la Ciudad de México. Boletín de la Soc. Geológica Mex. 2021, 73, A210920. [Google Scholar]
- Bautista, F.; Frausto, O.; Ihl, T.; Aguilar, Y. Actualización del mapa de suelos de Yucatán utilizando un enfoque geomorfopedológico y WRB. Ecosistemas y Recur. Agropecu. 2015, 2, 303–315. [Google Scholar]
- Maher, B.A.; Alekseev, A.; Alekseeva, T. Magnetic mineralogy of soils across the Russian Steppe: Climatic dependence of pedogenic magnetite formation. Palaeo3 2003, 201, 321–341. [Google Scholar]
- Bautista, F.; Cejudo-Ruiz, R.; Aguilar-Reyes, B.; Gogichaishvili, A. El potencial del magnetismo en la clasificación de suelos: Una revisión. Bol. Soc. Geol. Mex. 2014, 66, 365–376. [Google Scholar]
- Kumaravel, V.; Sangode, S.J.; Siddaiah, N.S.; Kumar, R. Interrelation of magnetic susceptibility, soil color, and elemental mobility in the Pliocene–Pleistocene Siwalik paleosol sequences of the NW Himalaya, India. Geoderma 2010, 154, 267–280. [Google Scholar]
- Liu, J.G.; Moore, J.M. Hue image RGB colour composition. A simple technique to suppress shadow and enhance spectral signature. Int. J. Remote Sens. 1990, 11, 1521–1530. [Google Scholar]
- Kirillova, N.P.; Vodyanitskii, Y.N.; Sileva, T.M. Conversion of soil color parameters from the Munsell system to the CIE-L*a*b* System, Genesis, and Geography of Soils. Eurasian J. Soil Sci. 2015, 48, 468–475. [Google Scholar]
- Schwertmann, U. Relationships between iron oxides, soil color, and soil formation. In Soil Color; Special publication 31; Bigham, J.M., Ciolkosz, E.J., Eds.; Soil Science Society of America: Madison, WI, USA, 1993; pp. 51–69. [Google Scholar]
- Aguilera, A.; Bautista, F.; Goguitchaichvili, A.; Garcia-Oliva, F. Health risk of heavy metals in street dust. Front. Biosci (Landmark Ed.) 2021, 1, 327–345. [Google Scholar]
Figure 1.
Geographical location of the road dust sampling sites.
Figure 1.
Geographical location of the road dust sampling sites.
Figure 2.
Grouping of road dust samples by color using the Munsell chart and with the average values in RGB.
Figure 2.
Grouping of road dust samples by color using the Munsell chart and with the average values in RGB.
Figure 3.
Comparison of medians of color indices (HI, RI, SI) by groups of road dust. I, GB, greyish brown; II, G, gray; III, DG, dark gray; IV, DGB, dark grayish brown; and V, VDG, very dark gray.
Figure 3.
Comparison of medians of color indices (HI, RI, SI) by groups of road dust. I, GB, greyish brown; II, G, gray; III, DG, dark gray; IV, DGB, dark grayish brown; and V, VDG, very dark gray.
Figure 4.
Comparison of medians of presumably contaminating elements and oxides by groups of road dust. I, GB, greyish brown; II, G, gray; III, DG, dark gray; IV, DGB, dark grayish brown; and V, VDG, very dark gray.
Figure 4.
Comparison of medians of presumably contaminating elements and oxides by groups of road dust. I, GB, greyish brown; II, G, gray; III, DG, dark gray; IV, DGB, dark grayish brown; and V, VDG, very dark gray.
Figure 5.
Comparison of medians of presumably contaminating elements and oxides by road dust. Primary road, 1; secondary roads, 2; tertiary roads, 3.
Figure 5.
Comparison of medians of presumably contaminating elements and oxides by road dust. Primary road, 1; secondary roads, 2; tertiary roads, 3.
Figure 6.
Major minerals in road dust with calcite and without calcite. A = albite, An = ankerite, At = anorthoclase, B = boehmite, Ca = calcite, D = dickite, G = goethite, H = hematite, M = maghemite, Q = quartz, S = sanidine, T = tosudite, Y = yeelimite.
Figure 6.
Major minerals in road dust with calcite and without calcite. A = albite, An = ankerite, At = anorthoclase, B = boehmite, Ca = calcite, D = dickite, G = goethite, H = hematite, M = maghemite, Q = quartz, S = sanidine, T = tosudite, Y = yeelimite.
Figure 7.
Anthropogenic particles in road dust.
Figure 7.
Anthropogenic particles in road dust.
Table 1.
Congruence matrix between the color groups of road dust based on the Munsell color cards (discriminant variable) and those groups formed based on the color indices (classification variables).
Table 1.
Congruence matrix between the color groups of road dust based on the Munsell color cards (discriminant variable) and those groups formed based on the color indices (classification variables).
| Current Color (Groups) | n | Predicted Color |
|---|
| I | II | III | IV | V |
|---|
| I | 17 | 16 | 1 | 0 | 0 | 0 |
| (GB) | 94% | 6% | 0% | 0% | 0% |
| II | 32 | 1 | 31 | 0 | 0 | 0 |
| (G) | 3% | 97% | 0% | 0% | 0% |
| III | 14 | 0 | 0 | 14 | 0 | 0 |
| (DG) | 0% | 0% | 100% | 0% | 0% |
| IV | 12 | 0 | 2 | 1 | 9 | 0 |
| (DGB) | 0% | 17% | 8% | 75% | 0% |
| V | 8 | 0 | 0 | 0 | 1 | 7 |
| (VDG) | 0% | 0% | 0% | 13% | 88% |
Table 2.
Congruence matrix between the color groups of road dust based (discriminant variables) and those groups formed based on the presumably contaminating elements (classification variables).
Table 2.
Congruence matrix between the color groups of road dust based (discriminant variables) and those groups formed based on the presumably contaminating elements (classification variables).
| Current Color (Groups) | n | Predicted Color |
|---|
| I | II | III | IV | V |
|---|
| I | 17 | 13 | 1 | 1 | 2 | 0 |
| (GB) | 76% | 6% | 6% | 12% | 0% |
| II | 32 | 10 | 8 | 6 | 5 | 3 |
| (G) | 31% | 25% | 19% | 16% | 9% |
| III | 14 | 0 | 5 | 6 | 1 | 2 |
| (DG) | 0% | 36% | 43% | 7% | 14% |
| IV | 12 | 4 | 2 | 0 | 5 | 1 |
| (DGB) | 33% | 17% | 0% | 42% | 8% |
| V | 8 | 0 | 0 | 1 | 0 | 7 |
| (VDG) | 0% | 0% | 13% | 0% | 88% |
| Publisher’s Note: MDPI stays neutral with regard to jurisdictional claims in published maps and institutional affiliations. |
© 2021 by the authors. Licensee MDPI, Basel, Switzerland. This article is an open access article distributed under the terms and conditions of the Creative Commons Attribution (CC BY) license (https://creativecommons.org/licenses/by/4.0/).


 ,
, 


