Article

Pacific and Atlantic Multidecadal Variability Relations with the Choco and Caribbean Low-Level Jets during the 1900–2015 Period

by
Wilmar L. Cerón
1,*,
Mary T. Kayano
2,
Rita V. Andreoli
3,4,
Alvaro Avila-Diaz
5,
Itamara Parente de Souza
4 and
Rodrigo A. F. Souza
3,4
1
Department of Geography, Faculty of Humanities, Universidad del Valle, Calle 13 # 100-00, P.O. Box 25360, Cali 760032, Colombia
2
Coordenação Geral de Ciências da Terra, Instituto Nacional de Pesquisas Espaciais, Avenida dos Astronautas, 1758, São José dos Campos 12227-010, Brazil
3
Escola Superior de Tecnologia, Universidade do Estado do Amazonas, Av. Darcy Vargas, 1200, Parque 10 de Novembro, Manaus 69065-020, Brazil
4
Programa de Pós-Gradução em Clima e Ambiente, Instituto Nacional de Pesquisa da Amazônia, Manaus 69065-020, Brazil
5
Natural Resources Institute, Universidade Federal de Itajubá, Itajubá 37500-903, Brazil
*
Author to whom correspondence should be addressed.
Atmosphere 2021, 12(9), 1120; https://doi.org/10.3390/atmos12091120
Submission received: 6 July 2021 / Revised: 25 August 2021 / Accepted: 27 August 2021 / Published: 31 August 2021
(This article belongs to the Special Issue Effects of Atmosphere and Ocean on Tropical Precipitation)

Abstract

:
This study analyzes the variability of the Choco jet (CJ) and Caribbean low-level jet (CLLJ) with consideration of the simultaneous Pacific interdecadal oscillation (PDO) and Atlantic multidecadal oscillation (AMO) low-frequency mean states and their effects on the atmospheric circulation and rainfall in northwestern South America and Central America for the 1900–2015 period, during the seasons with the highest intensities of the CJ (September–November (SON)) and the CLLJ (June–August). Variations in the sea surface temperature (SST) anomaly positioning in the eastern Pacific, tropical North Atlantic (TNA)/Caribbean Sea during different mean states restrict the anomalous circulation, and, consequently, the intensity of the CJ and CLLJ. During the warm AMO (WAMO)/cold PDO (CPDO), the SST gradient from the tropical Pacific into the TNA, accompanied by a cyclonic circulation near the east coast of the Americas, intensifies the west–east circulation in the region, strengthening the CJ and weakening the CLLJ during SON such that rainfall increases over Colombia, Central America and in adjacent oceans. During the cold AMO (CAMO)/warm PDO (WPDO) phase, a relative east/west SST gradient occurs in TNA, consistent with a cyclonic circulation in western TNA, establishing an anomalous southwest–northwestward circulation from the eastern Pacific into the Caribbean basin, forming a well-configured CJ, increasing precipitation over Central America and its adjacent oceans. For the CLLJ, during CAMO phases, the anticyclonic circulations extended over most of the TNA favor its intensification from 30° W to the Caribbean Sea. In contrast, during WAMO, the cyclonic circulation near the east coast of the United States restricts its intensification to the Caribbean Sea region. To the best of our knowledge, the results presented here are new and might be useful in atmospheric modeling and extreme event studies.

1. Introduction

It is well known that the rainfall in northwestern South America is strongly influenced by the Pacific and Atlantic Intertropical Convergence Zones (ITCZ) [1,2,3,4,5] and by two low-level regional jets (LLJs), one in the far eastern Pacific and western Colombia (the Choco jet (CJ)) and another formed by the easterlies in the Caribbean Sea (the Caribbean low-level jet (CLLJ)) [6,7,8,9] (Figure 1). The CJ is strong from September to November (SON) and weak from March to May (MAM) [10,11,12], with speeds in its core sector (centered at 5° N along 80° W) of 5–7 m s–1 during SON (Figure 1b) and less than 3 m s–1 from December to May [13]. The CLLJ features a semiannual cycle with maxima during the boreal summer (June to August (JJA); Figure 1c) and winter (December to February (DJF)), and minima during the other two seasons, and it is centered in the Caribbean Sea at 15° N without significant latitudinal migrations over the year [14,15,16]. After passing the Caribbean Sea, the CLLJ splits into two branches: one that turns towards the Gulf of Mexico and the United States, and the other that continues to the west across Central America towards the eastern North Pacific. The first CLLJ branch feeds the Great Plains LLJ, which transports moisture towards the Central United States [17,18], whereas the second transports moisture westward to Central America and the eastern Pacific [14,19].
Northwestern South America and Central America are climatologically interesting regions due to their geographical features and locations (Figure 1a). Ocean masses surround them within the tropical zone, where high energy availability drives fundamental thermodynamic and dynamic processes to determine the regional climate characterized by large amounts of precipitation [7,20,21]. Furthermore, the climate in these regions results from a land–atmosphere system that is strongly influenced by the varied topographical asymmetries imposed by the Andes Mountains (Figure 1a) and the regional LLJs with typical seasonal variations (Figure 1b,c). Consequently, diverse local and regional atmospheric circulation patterns interact with the ITCZ, the main system that modulates the annual precipitation cycle through its meridional migration [3,22,23]. In this regard, the CJ is forced to ascend to the western Andes in Colombia and interact with easterly trade winds, causing deep convection over the west and center of the country [3,6]. However, the Central American Andes block low-level airflow from the Caribbean Sea [23]. Nevertheless, the pressure gradient between the Caribbean Sea and eastern Pacific strengthens the CLLJ and allows its extension to the eastern Pacific, resulting in three LLJs, namely, the Tehuantepec (Isthmus of Tehuantepec), Papagayo (over Lake Nicaragua), and Panama [9,23,24,25]. Among these jets, the Tehuantepec and Papagayo jets merge with the northeast trade winds of the Pacific (that is, the CJ), mainly during SON [23,24].
Durán-Quesada et al. [12] documented contrasting CLLJ and CJ moisture transport patterns from the two main oceanic sources in the eastern tropical Pacific and the Caribbean Sea. As the easterly flow increases in the tropical North Atlantic (TNA), the CLLJ promotes moisture transport from the Caribbean Sea into northwestern South America, while the transport from the easternmost tropical Pacific is inhibited. In this case, moisture transport from the Caribbean Sea reaches 10 mm day–1, except during SON, where it decreases to 5 mm day–1. Conversely, moisture transport from the eastern Pacific into northwestern South America reaches a maximum intensity between August and September, when the CJ reaches its maximum strength and the easterly flow decreases (weak CLLJ). This behavior highlights the relationship between the CLLJ and CJ in regional moisture transport. As a result, CLLJ and CJ dynamics provide moisture for rainfall in Central America, northwestern South America, the Caribbean Sea, and the eastern tropical Pacific [6,9,12,20].
Since these two LLJs manifest mostly over oceanic water masses, their interannual variations are explained mainly by the sea surface temperature (SST) variations in the eastern tropical Pacific, TNA, and the Caribbean Sea [9,14,19,20,26,27], which induce regional anomalous atmospheric circulation patterns. The intensified thermal contrast between the El Niño 1+2 region and the Pacific Colombian coast during La Niña induces an anomalous strengthened CJ [9,10], which increases moisture transport into central and western Colombia [10,28] and settles anomalously wet conditions [3]. The opposite thermal, circulation, and rainfall patterns occur in association with El Niño events. On the other hand, the relations of the CLLJ to the Pacific and Atlantic SST variations on an interannual timescale are seasonally dependent, and the CLLJ variations are modulated by the El Niño-Southern Oscillation (ENSO)-related Pacific SST variability during boreal winter, and by the Pacific and Atlantic SST variability, during summer [14,29].
Figure 1. (a) Study area location. Elevation data were obtained from Shuttle Radar Topography Mission (SRTM), Available at http://www2.jpl.nasa.gov/srtm/ accessed on 26 August 2021; (b) SON pattern of wind at 925 hPa (m s−1) and sea surface temperature (SST); and (c) JJA pattern of wind at 925 hPa (m s−1) and SST.
Atmosphere 12 01120 g001
Arias et al. [20] found an inverse relation between the CJ and CLLJ intensities during the 2009–2010 and 2010–2011 La Niña events. In this context, Yepes et al. [9] observed a stronger than normal CJ and a weaker than normal CLLJ during a weak La Niña in October 2016. More recently, Cerón et al. [30] showed that these two LLJs hold an inverse relationship on a multidecadal timescale in terms of their intensities. They also showed that the intensities of the LLJs during the 1983–1997 and 2001–2016 periods are modulated by the multidecadal anomalous SST patterns in the tropical Pacific and Atlantic Oceans. The mean SST anomaly states in these two oceanic sectors defined by the Pacific interdecadal oscillation (PDO) and the Atlantic multidecadal oscillation (AMO) show contrasting features during these two periods. The first period (1983–1997) overlaps the low-frequency mean state under the warm PDO (WPDO) phase and cold AMO (CAMO) phase. In contrast, the second period overlaps the mean state under the cold PDO (CPDO) phase and the warm AMO (WAMO) phase [31,32]. Thus, these two periods present opposite direction low-frequency interbasin equatorial gradients between the Atlantic and eastern Pacific. Barichivich et al. [33] found an intensification of Walker’s circulation during the late 1990s, associated with strong warming of the tropical Atlantic and cooling of the tropical Pacific. Furthermore, Pattnayak et al. [34,35] analyzed the relationship of precipitation in northern and northwestern South America with SST anomalies in the Atlantic after 2000. Therefore, through these interbasin SST gradients, the PDO and AMO SST mean states modulated the CJ and CLLJ variations during the last three decades [30]. Therefore, through these interbasin SST gradients, the PDO and AMO SST mean states modulated the CJ and CLLJ variations during the last three decades [30].
However, two other distinct low-frequency SST mean states occur in the Pacific and Atlantic Oceans: the CAMO/CPDO and WAMO/WPDO. Kayano et al. [31,32] presented evidence that distinct low-frequency SST mean states lead to different ENSO-related climate anomalies. Therefore, the question is whether the CJ and CLLJ have distinct behaviors under different low-frequency mean states, in addition to those previously documented by [30]. To contribute to solving this research question, we analyzed the CJ and CLLJ features and their effects on the rainfall patterns over Central America and northwestern South America by considering the four possible low-frequency mean states defined by the PDO and AMO using 116 years of data (1900–2015). This study extends the analysis of Cerón et al. [30], which used only 33 years of climate information (1983–2016).

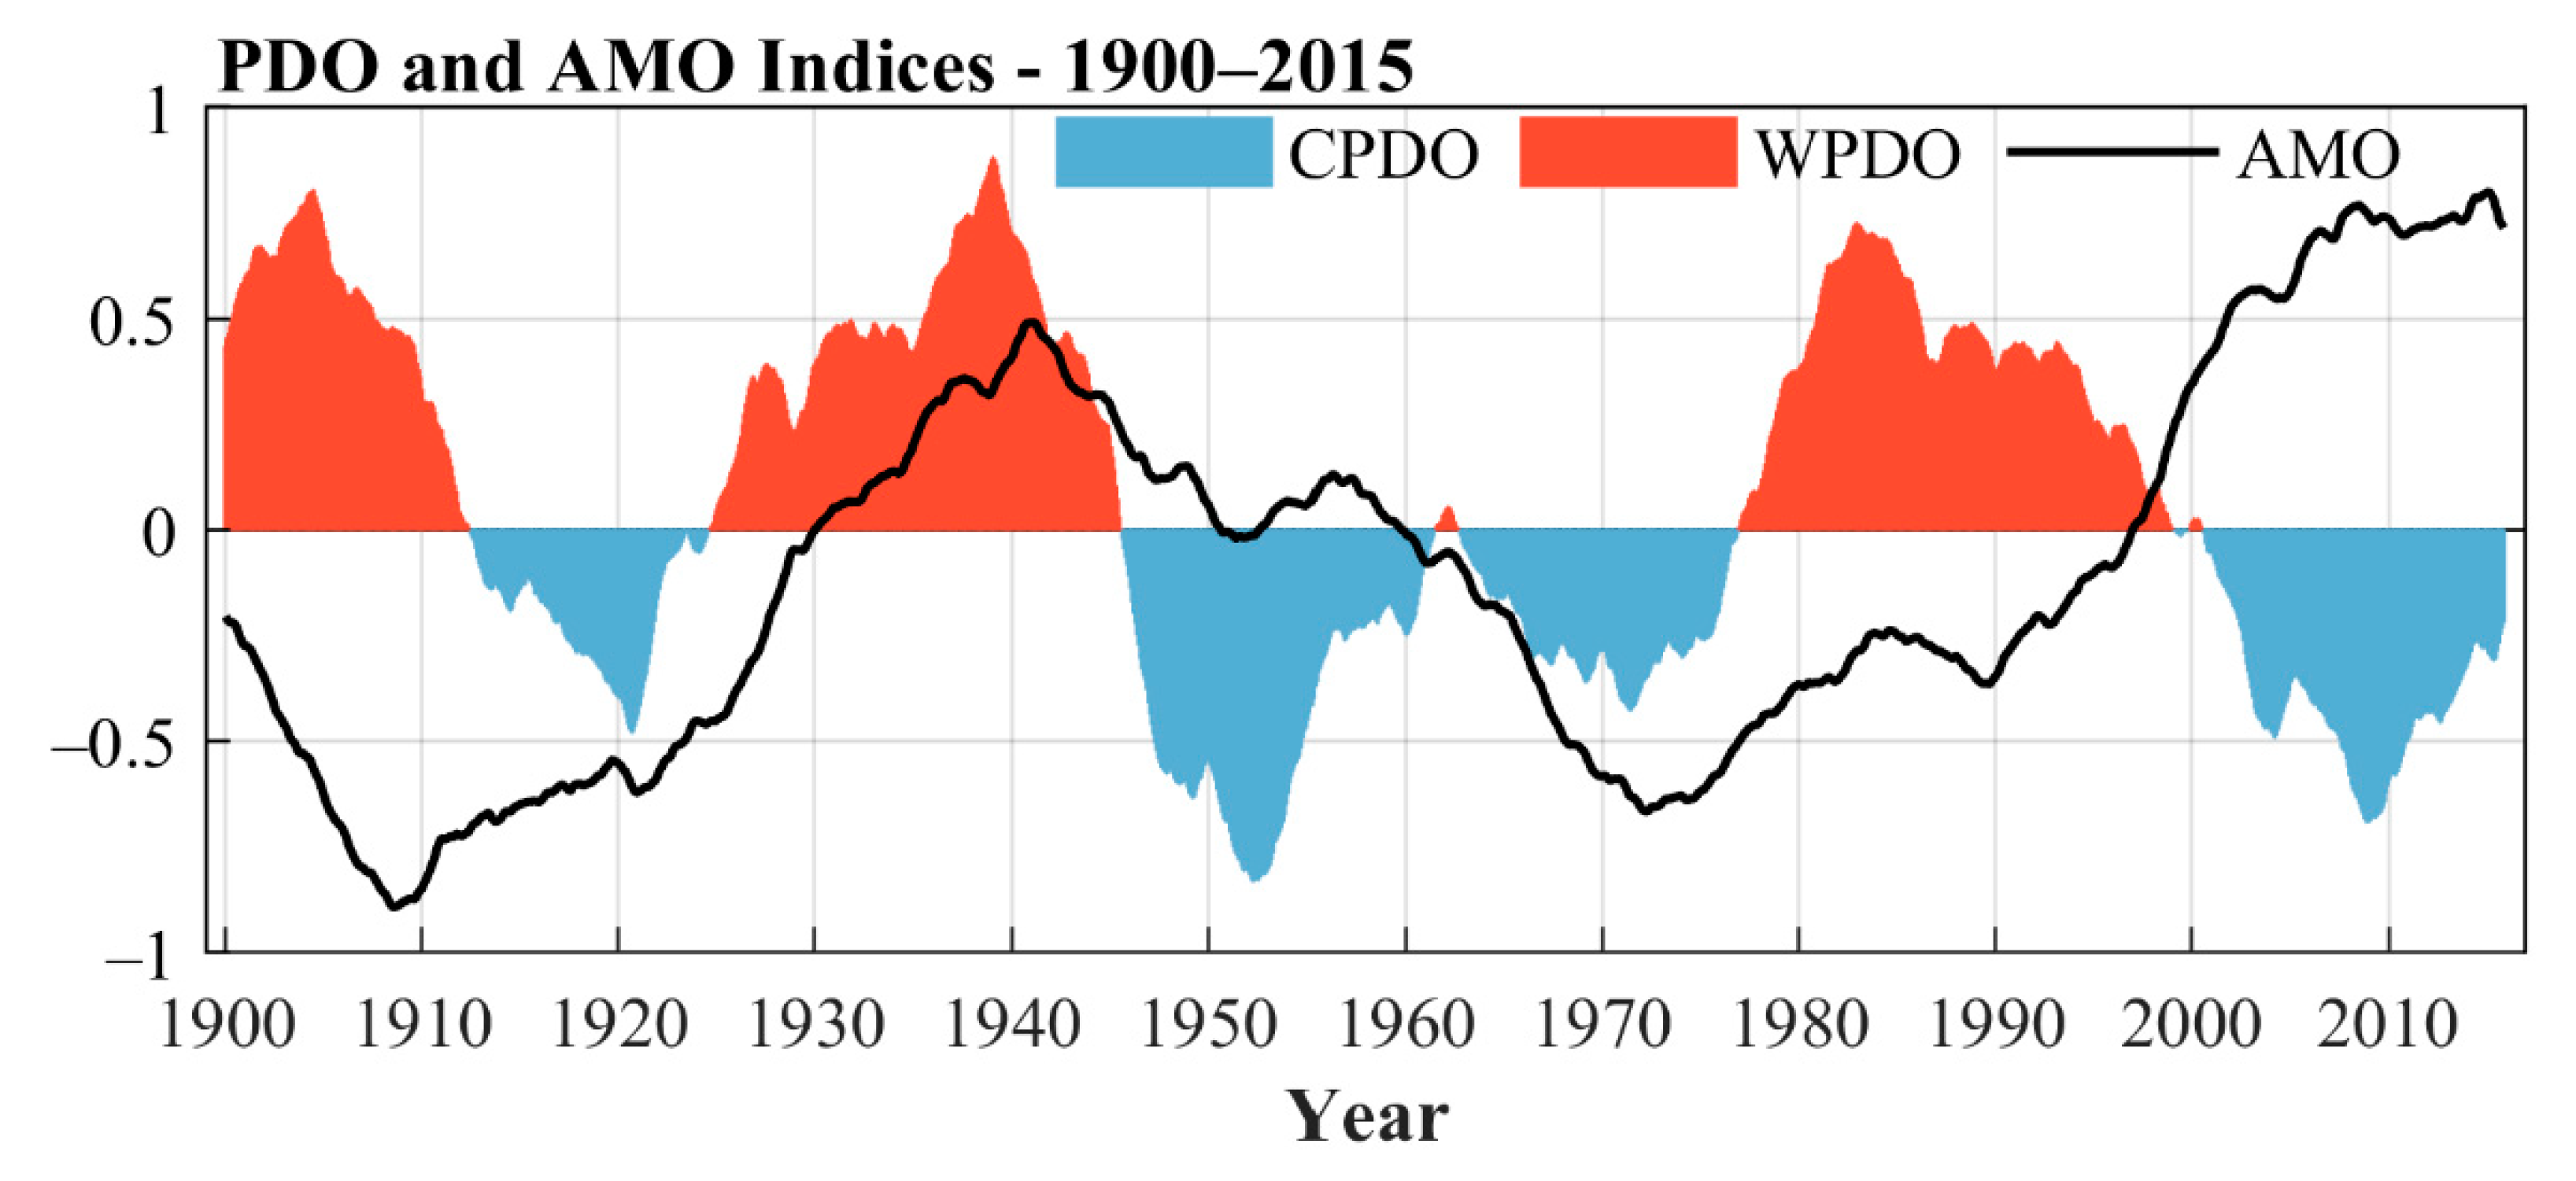
2. Data and Methodology
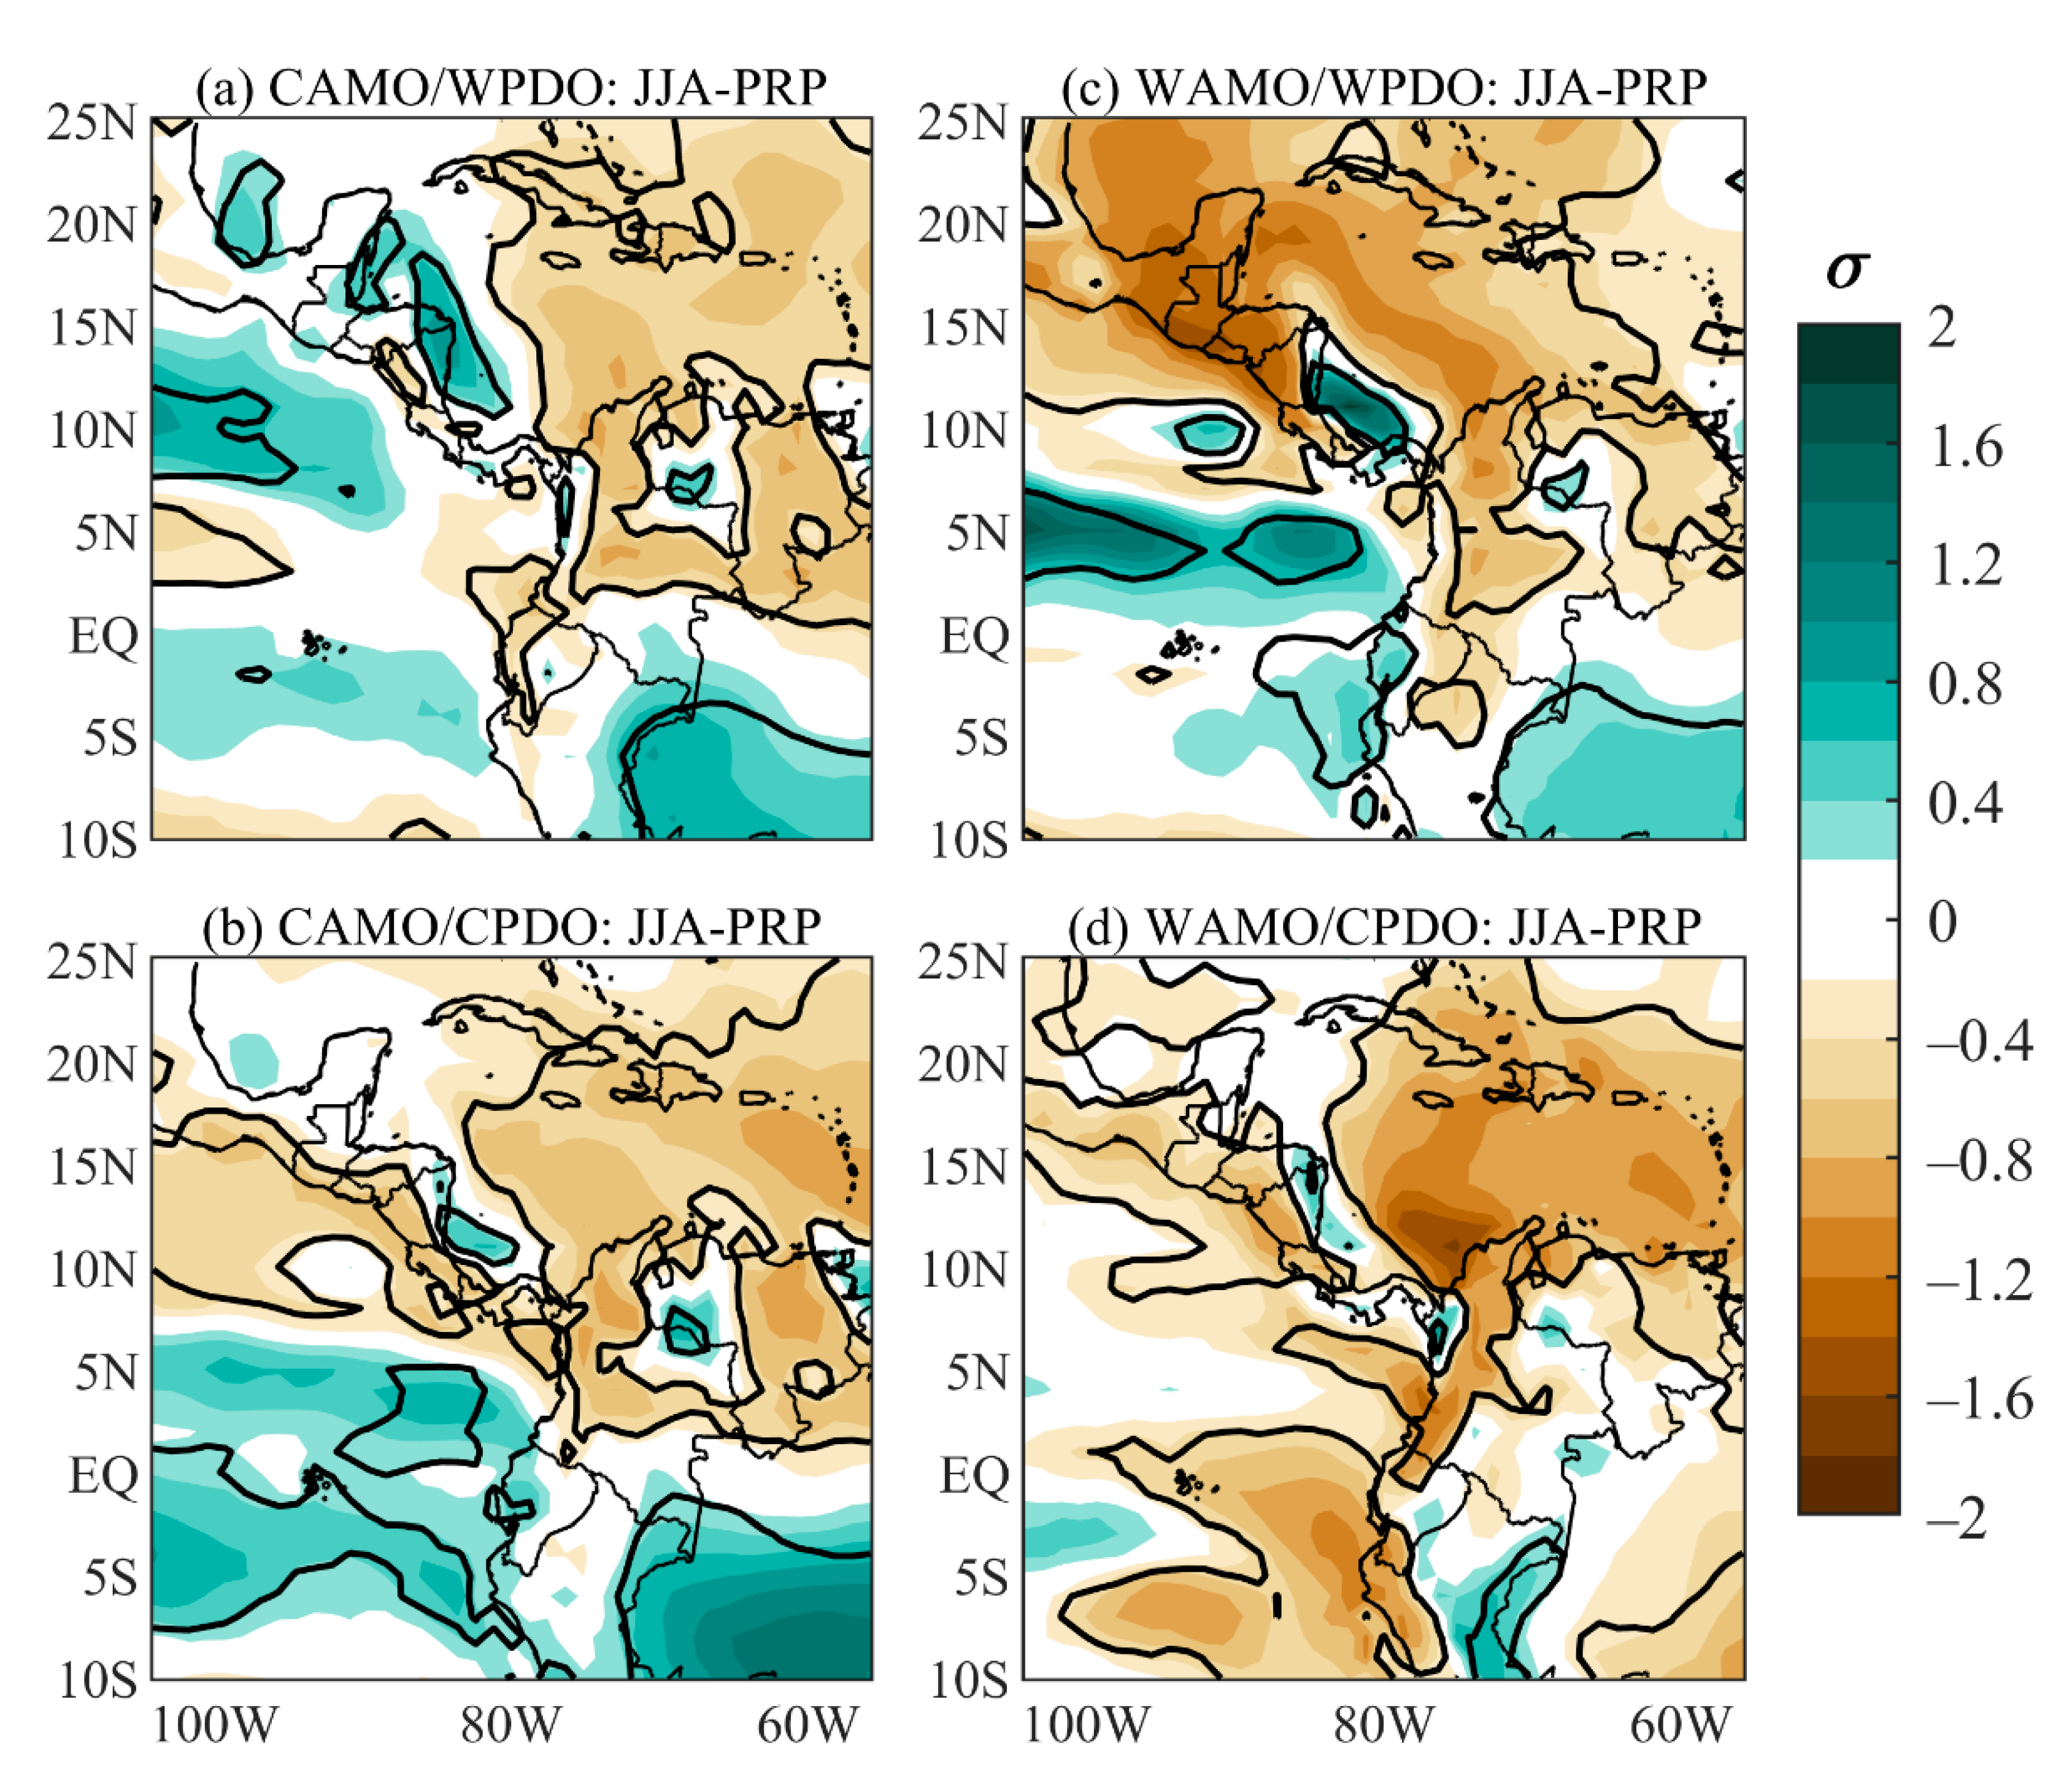
The data used in this study consist of monthly gridded sea surface temperature (SST), atmospheric circulation, and reanalyzed precipitation data. The National Oceanic and Atmospheric Administration/Extended Reconstructed Sea Surface Temperature SST version 5 data were used [36,37]. The zonal and meridional winds at 925 hPa and precipitation were derived from the NOAA-CIRES-DOE Twentieth Century Reanalysis Project version 3 (20CRv3; 2020) [38,39,40]; this dataset provides reliable long-term estimates for climate variables [41,42]. The atmospheric circulation and precipitation data time series have a 1° horizontal spatial resolution, and the SST time series have a 2° horizontal spatial resolution. All data were selected for the 1900–2015 period.
The years with low-frequency mean states were determined using the PDO and AMO indices established by Kayano et al. [32] over the 1865–2016 period. The PDO index is defined as the principal component of the empirical orthogonal function of the detrended monthly SST anomalies in the North Pacific Ocean (20°–70° N; 110° E–100° W) [43]. The AMO index is defined as the detrended monthly SST anomalies averaged in the North Atlantic Ocean (equator–70° N; 80°–0° W) [44]. In these calculations, the linear trend (straight line fit with the minimum squares method) and the monthly SST anomalies were obtained for the 1865–2016 base period. The PDO and AMO indices were smoothed with a 121-month running mean filter. The smoothed indices for the 1900–2015 period were used to determine the years with low-frequency mean states. The thresholds beyond which the PDO and AMO are considered in their cold or warm phases are 0.1 (without units) and 0.02 °C, respectively.
To determine the years with an intense CJ and CLLJ, corresponding indices for these LLJs were obtained for the 1900–2015 period. The CJ index, defined as the 925 hPa zonal wind anomalies averaged along 80° W and between 2° N and 7° N, was constructed as in several previous studies [10,20,27,30]. Furthermore, the CLLJ index was defined as the 925 hPa zonal wind anomalies averaged in the region of 12.5° N–17.5° N and 80° W–70° W, as in Wang [14] and Arias et al. [20]. These indices were obtained, respectively, during SON and JJA, which are the corresponding seasons of the greatest activities of the CJ and CLLJ [6,9,14,25]. The percentile time series were constructed by ranging the CJ and CLLJ indices from 1 to 116 and dividing them by 116 (total years in the 1900–2015 period). For both indices, the 75th percentile was the threshold for selecting the intense events, which were stratified according to the low-frequency mean states. In addition, the Oceanic Niño Index (ONI) was calculated for the 1900–2015 period as the running 3-month mean SST anomaly for the Niño 3.4 region (i.e., 5° N, 5° S, and 120°–170° W). Events were defined as five consecutive overlapping 3-month periods at or above the +0.5° anomaly for warm (El Niño) events and at or below the –0.5° anomaly for cold (La Niña) events.
For each low-frequency mean state, we constructed the seasonal SST anomaly pattern for SON and JJA, which consists of the average of the monthly detrended standardized SST anomalies considering all three months of the years within the mean state, calculated in the area between 60° N–60° S and 120° E–0°. In these calculations, the linear trends, means, and standard deviations of the variables refer to the 1900–2015 base period. For the significance of the mean states, we considered the degrees of freedom as the number of years, and the Student’s t-test for significance of the mean at the 95% confidence level was used [45].
The intense CJ and CLLJ-related patterns of selected variables were obtained for the 1900–2015 period using the composite analysis, following Boschat et al. [46]. First, the linear trends were removed from the variables, and then the detrended standardized monthly anomaly time series were calculated for the 1900–2015 base period. The variables were obtained in the following domains: 120°–0° and 40° N–40° S for the SST; 100° W–60° W and 25° N–10° S for precipitation; and 120° W–10° W and 40° N–10° S for the 925 hPa zonal and meridional winds. The statistical significance of the composites was tested with the Student’s t-test for the significance of the mean. We considered the degrees of freedom as the number of events, and significance tests were applied at the 95% confidence level.

3. Results

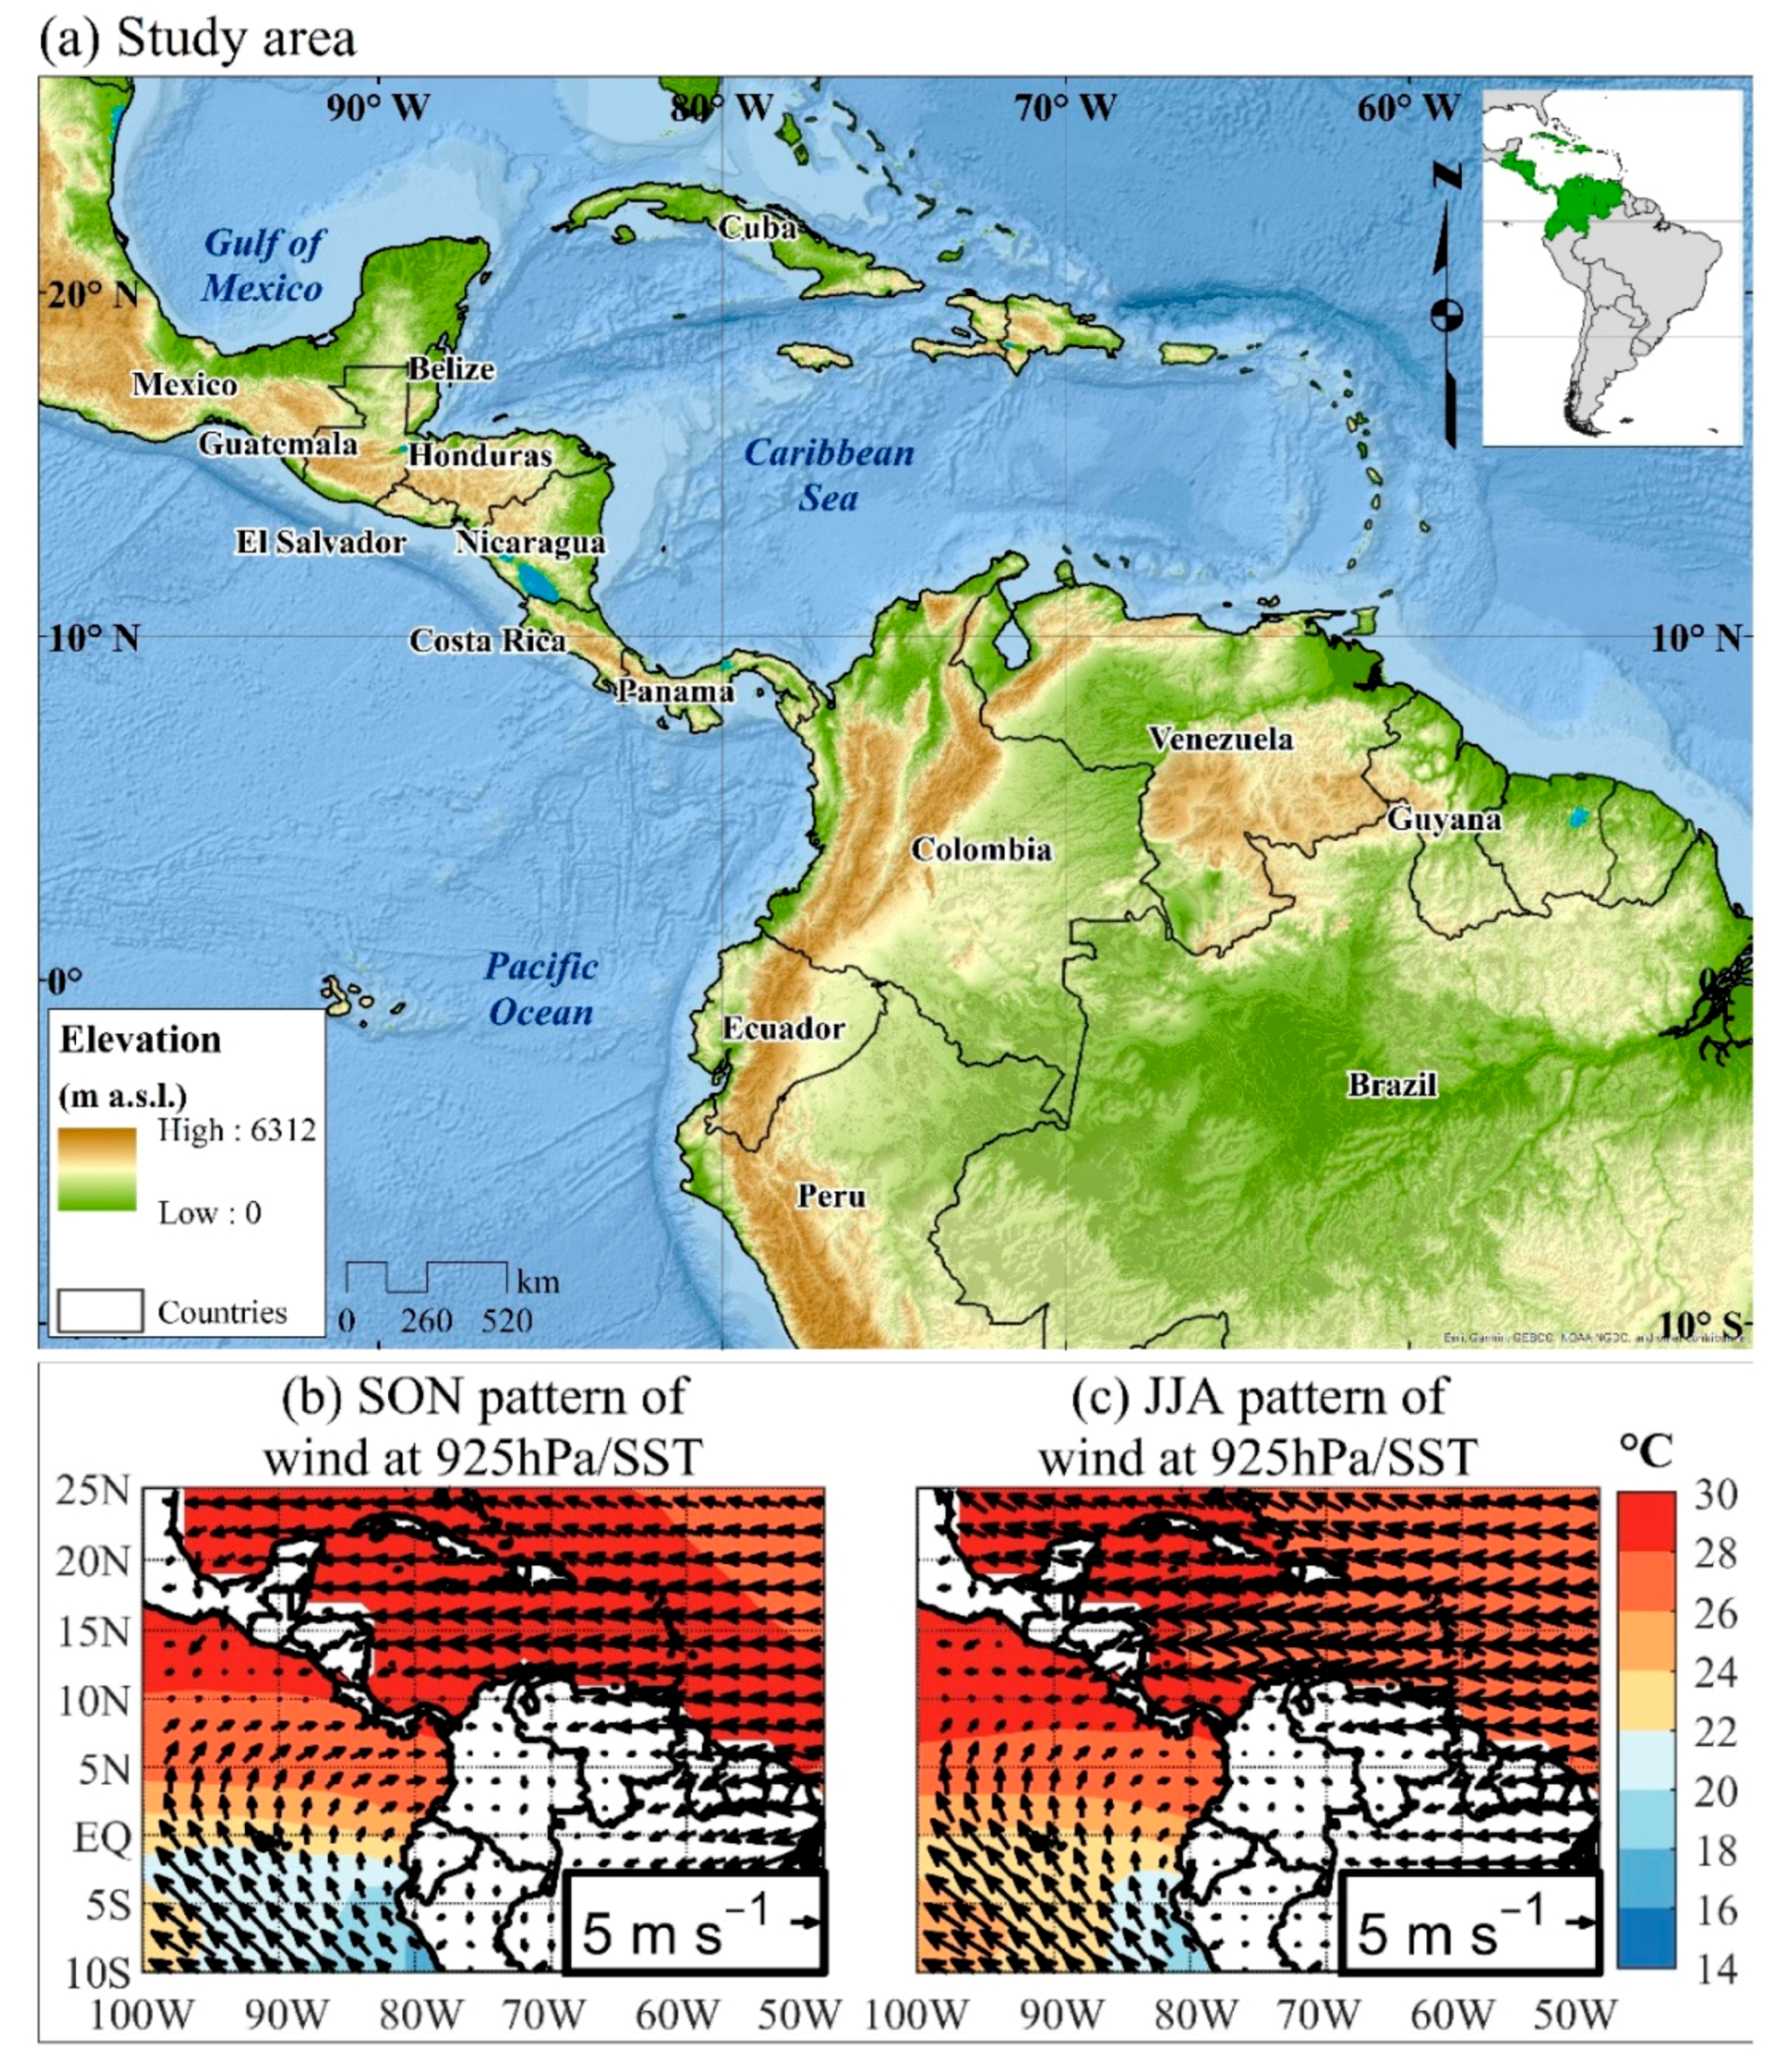
3.1. Low-Frequency Mean States

Using the same method as that in Kayano et al. [32], the PDO and AMO indices that are updated for the 1900–2015 period give the CAMO phase during 1900–1929 and 1960–1996; the WAMO phase during 1931–1958 and 1998–2015; the CPDO during 1913–1923, 1946–1960, 1963–1976, and 2001–2015; and the WPDO phase during 1900–1911, 1925–1944, and 1977–1998 (Figure 2). Therefore, the low-frequency mean states are defined as 1901–1911, 1925–1929, and 1977–1996 for the CAMO/WPDO; 1913–1923 and 1963–1976 for the CAMO/CPDO; 1931–1944 for the WAMO/WPDO; and 1946–1958 and 2001–2015 for the WAMO/CPDO. According to Kayano et al. [32], the 1925–1929 period for the CAMO/WPDO mean state is disregarded because an AMO index close to zero during this period means uncertainty in the AMO phase.
Once the periods for the low-frequency mean states have been identified, their SON and JJA SST anomaly patterns are constructed (Figure 3). Since the tropical features of the CAMO/WPDO and CAMO/CPDO SST mean states were previously analyzed in Kayano et al. [32], they are shown here for the sake of illustration and to facilitate the interpretation of the CJ and CLLJ composites. Additionally, the tropical features of the WAMO/CPDO SST mean state were analyzed in Kayano et al. [32]. However, since this mean state has been updated here, the differences between the two analyses are highlighted. Finally, the WAMO/WPDO SST mean state is analyzed in more detail. Overall, the mean states do not show significant seasonal changes between JJA and SON. During the CAMO/WPDO mean state (Figure 3a,e), negative SST anomalies are observed in most of the North Atlantic (NATL), extending southward along the northern coast of South America, the equatorial Atlantic, southeastward along the east coast of Brazil in the tropical South Atlantic (TSA), and in the subtropics in the western Pacific. Opposite sign anomalies are observed in most of the Atlantic south of 20° S, in the central and eastern tropical Pacific, and in the southern subtropical and extratropical sectors of the Pacific and Atlantic Oceans. Furthermore, the CAMO/WPDO features are consistent with the SON SST anomaly pattern shown by Cerón et al. [30], which covers the 1983–1996 period (featuring the CAMO/WPDO mean state).
The CAMO/CPDO mean state shows negative SST anomalies in most of the NATL and a horseshoe-shaped area in the tropical Pacific and along the western coasts of the Americas, and it is split by negative to positive weak anomalies in the eastern and central equatorial Pacific (Figure 3b,f). Moreover, positive anomalies are observed in the southwestern and subtropical northwestern Pacific; in this latter area they are significant only during JJA. Positive SST anomalies are also observed to the south of Australia. This pattern is consistent with the combined effects of the CAMO and the CPDO, according to Kayano et al. [32]. The pattern with negative anomalies in the NATL and positive anomalies in the extratropical South Atlantic is typical during the CAMO phase [44,47,48].
For the WAMO/WPDO mean state, the significant positive SST anomalies in the NATL and negative anomalies in the subtropical South Atlantic reflect the WAMO pattern (Figure 3c,g). Negative anomalies are observed in the northwestern and southwestern subtropical Pacific to the south of Australia and the central extratropical South Pacific. The positive SST anomalies in the tropical Pacific that are centered at 140° W–100° W and 20° S and between the equator and 20° N are indicative of the WPDO-associated pattern.
The WAMO/CPDO mean state shows SST anomalies over most of the NATL; in the southwestern Atlantic (20° S–40° S) and throughout most of the western tropical Pacific in a boomerang-shaped area, which extends over the Australasian region; and in the northern and southern subtropical Pacific (Figure 3d,h), which are possibly due to the WAMO effect [32]. Conversely, weak negative SST anomalies are found in the eastern tropical Pacific, near the South American coast, between the equator and 20° S, and in the southeastern Pacific.

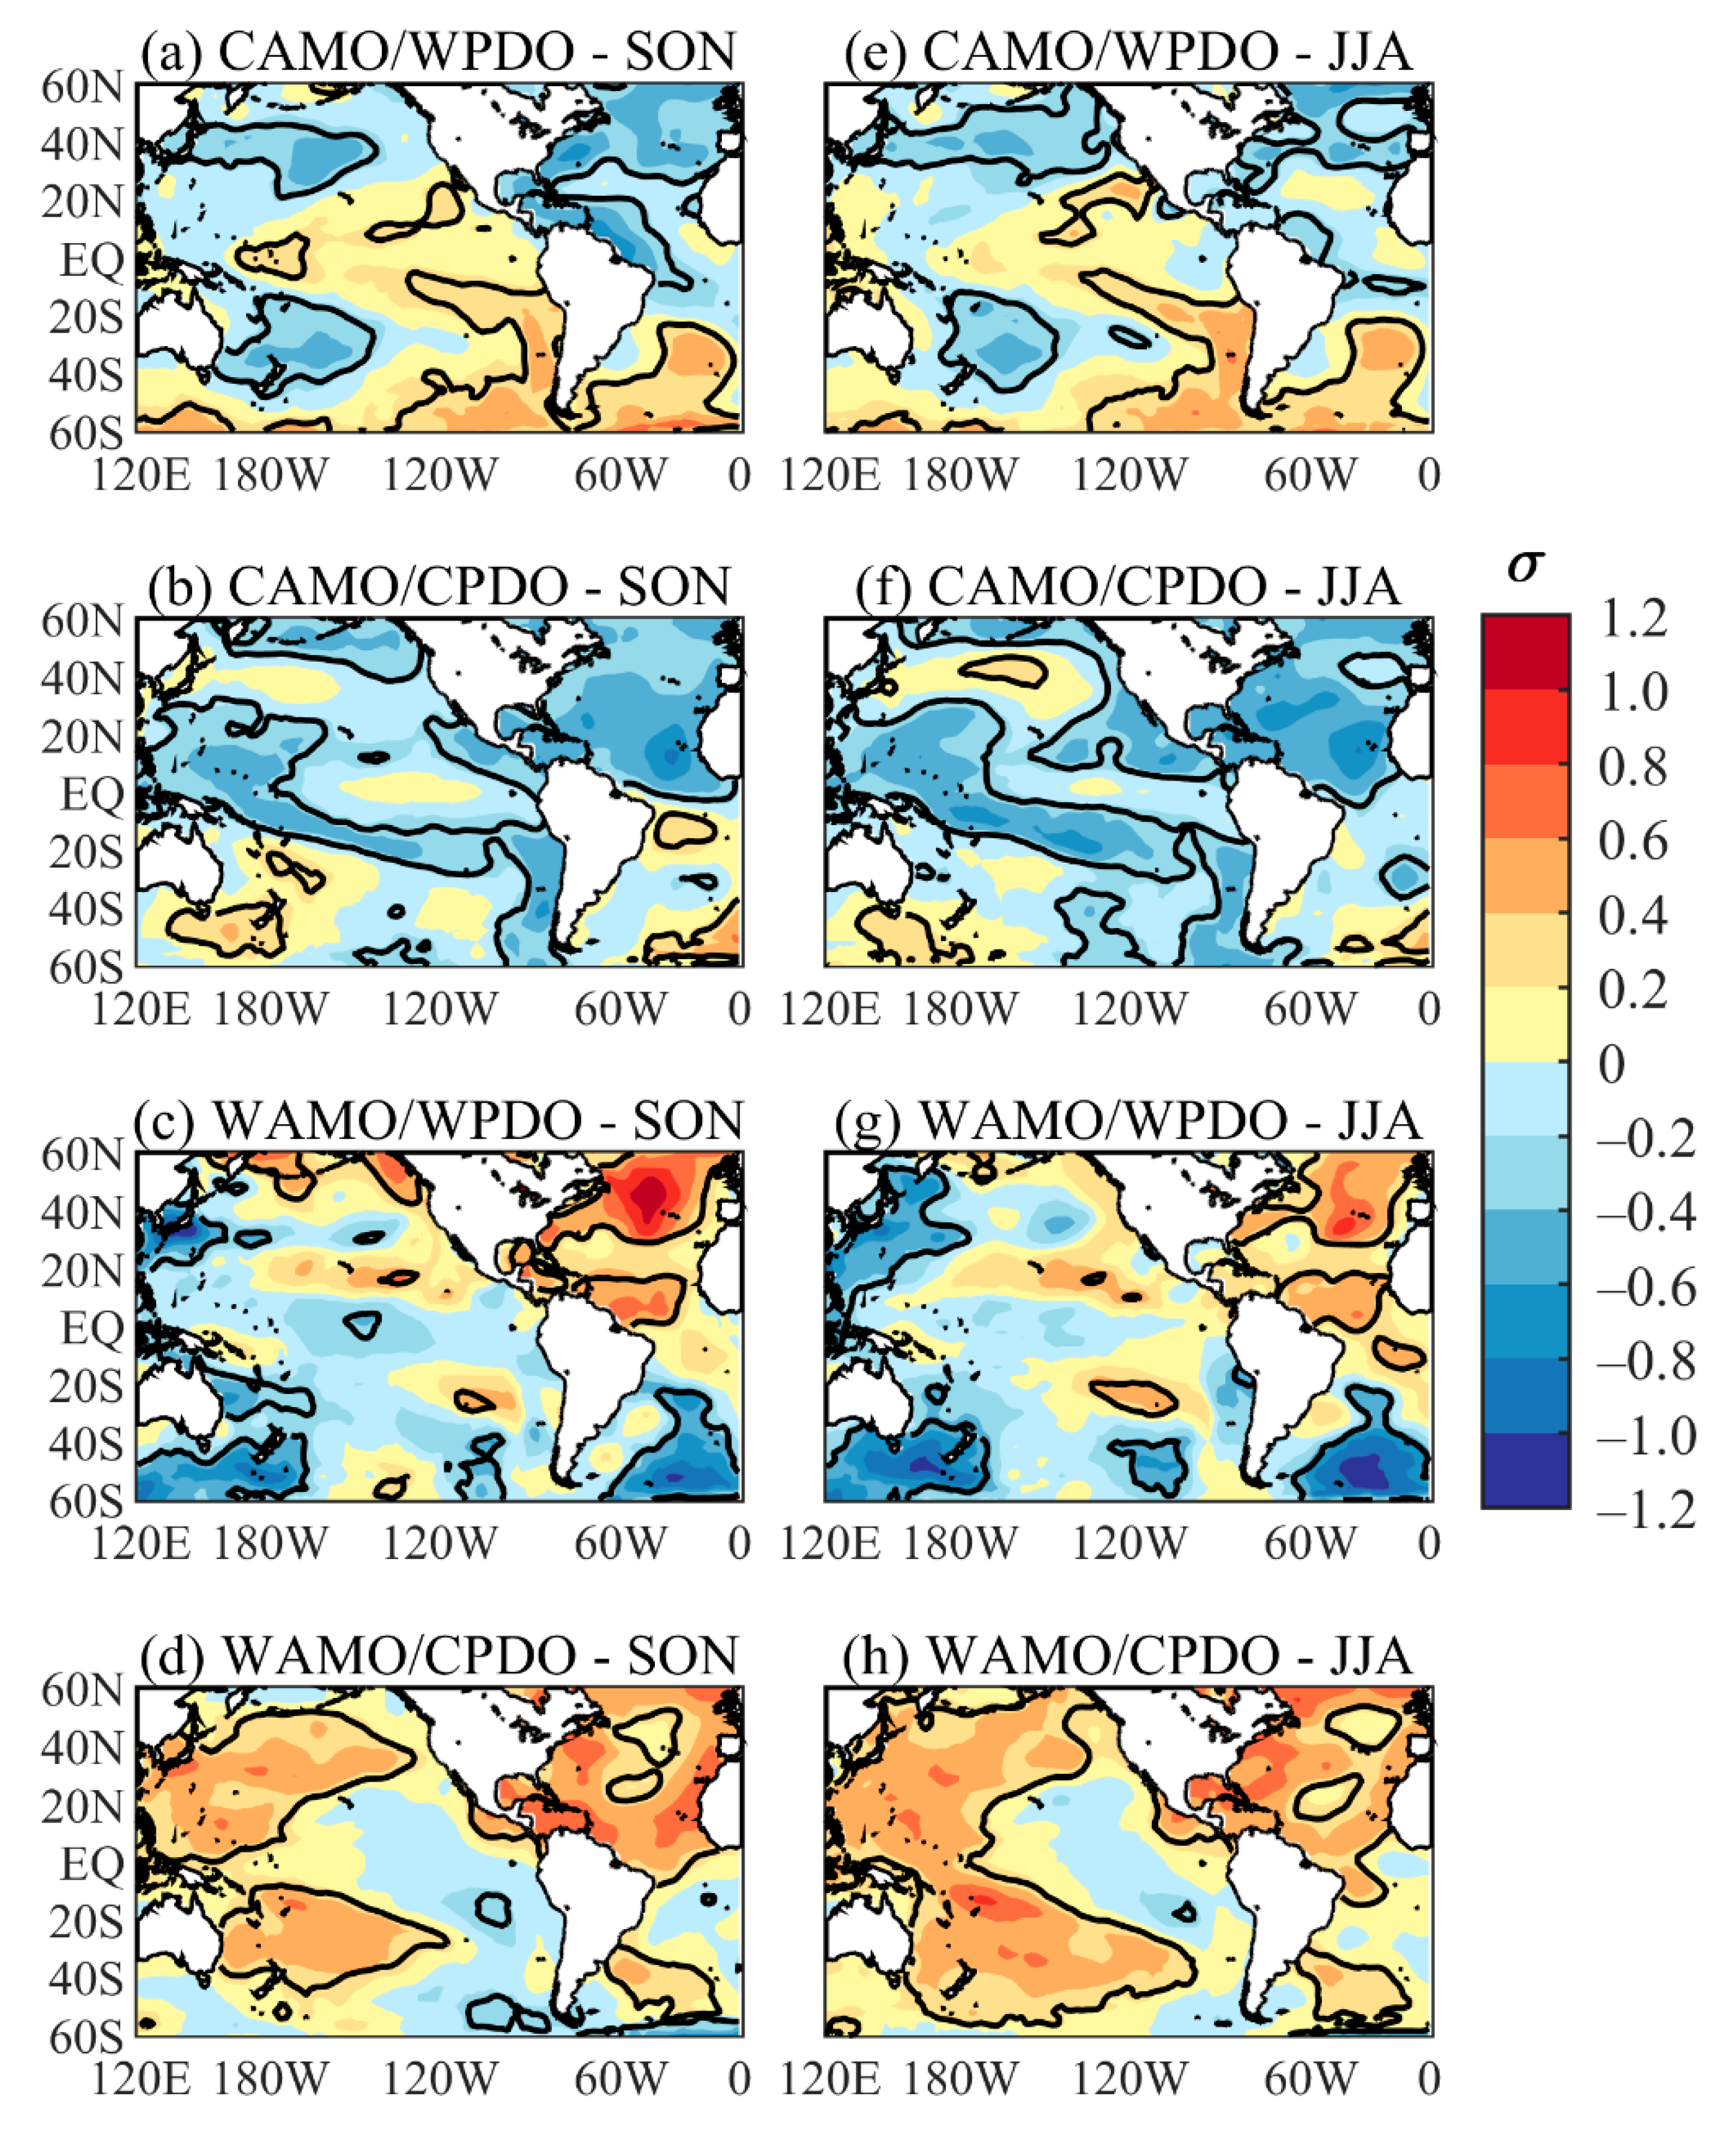
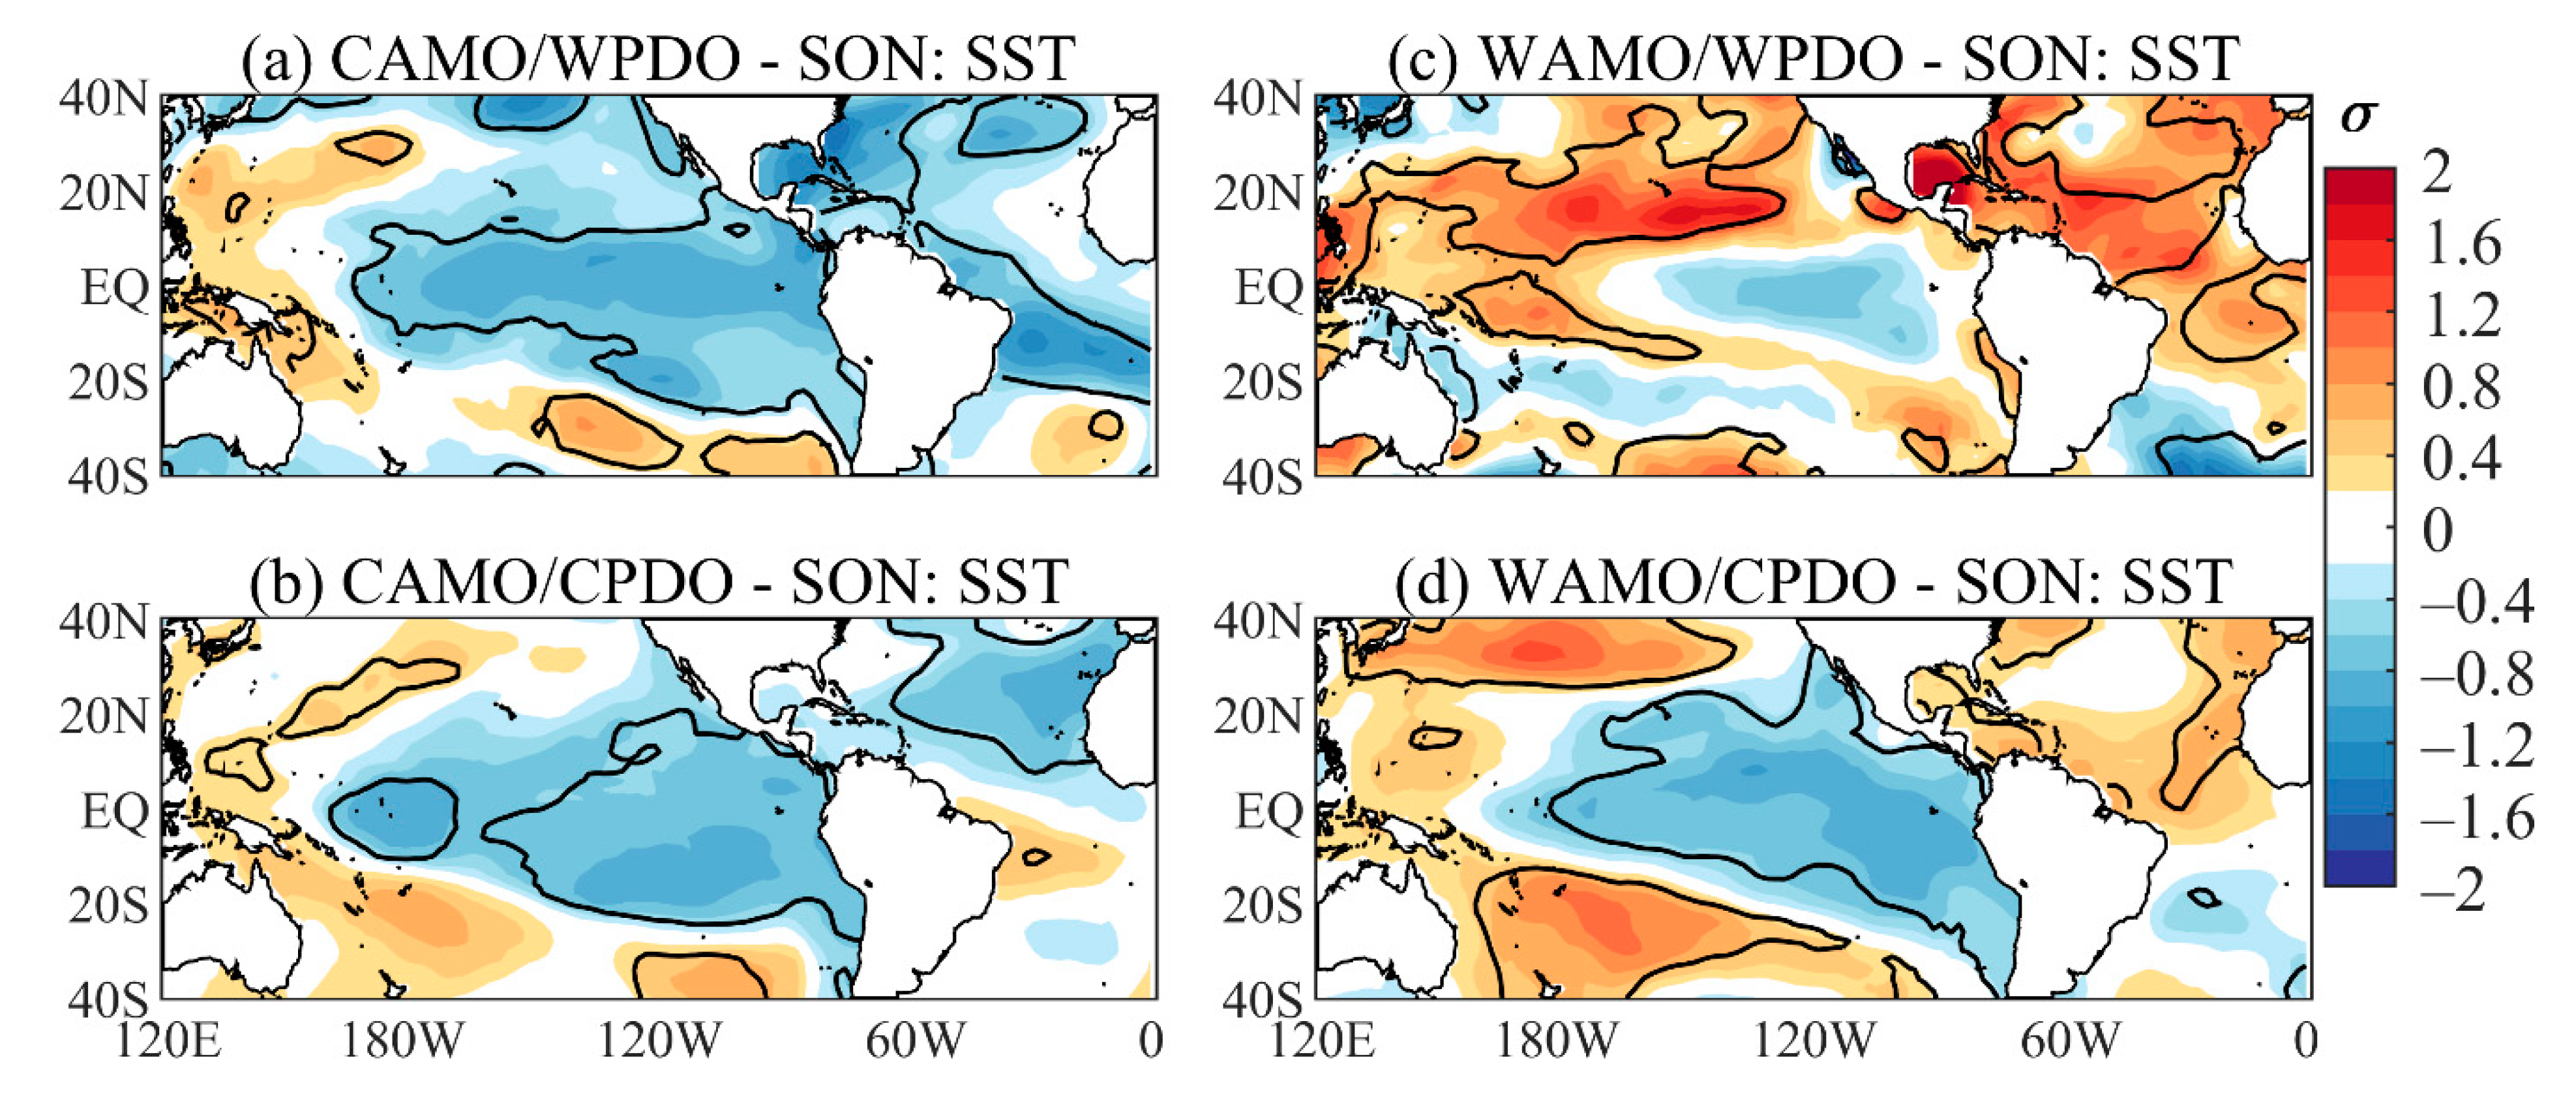
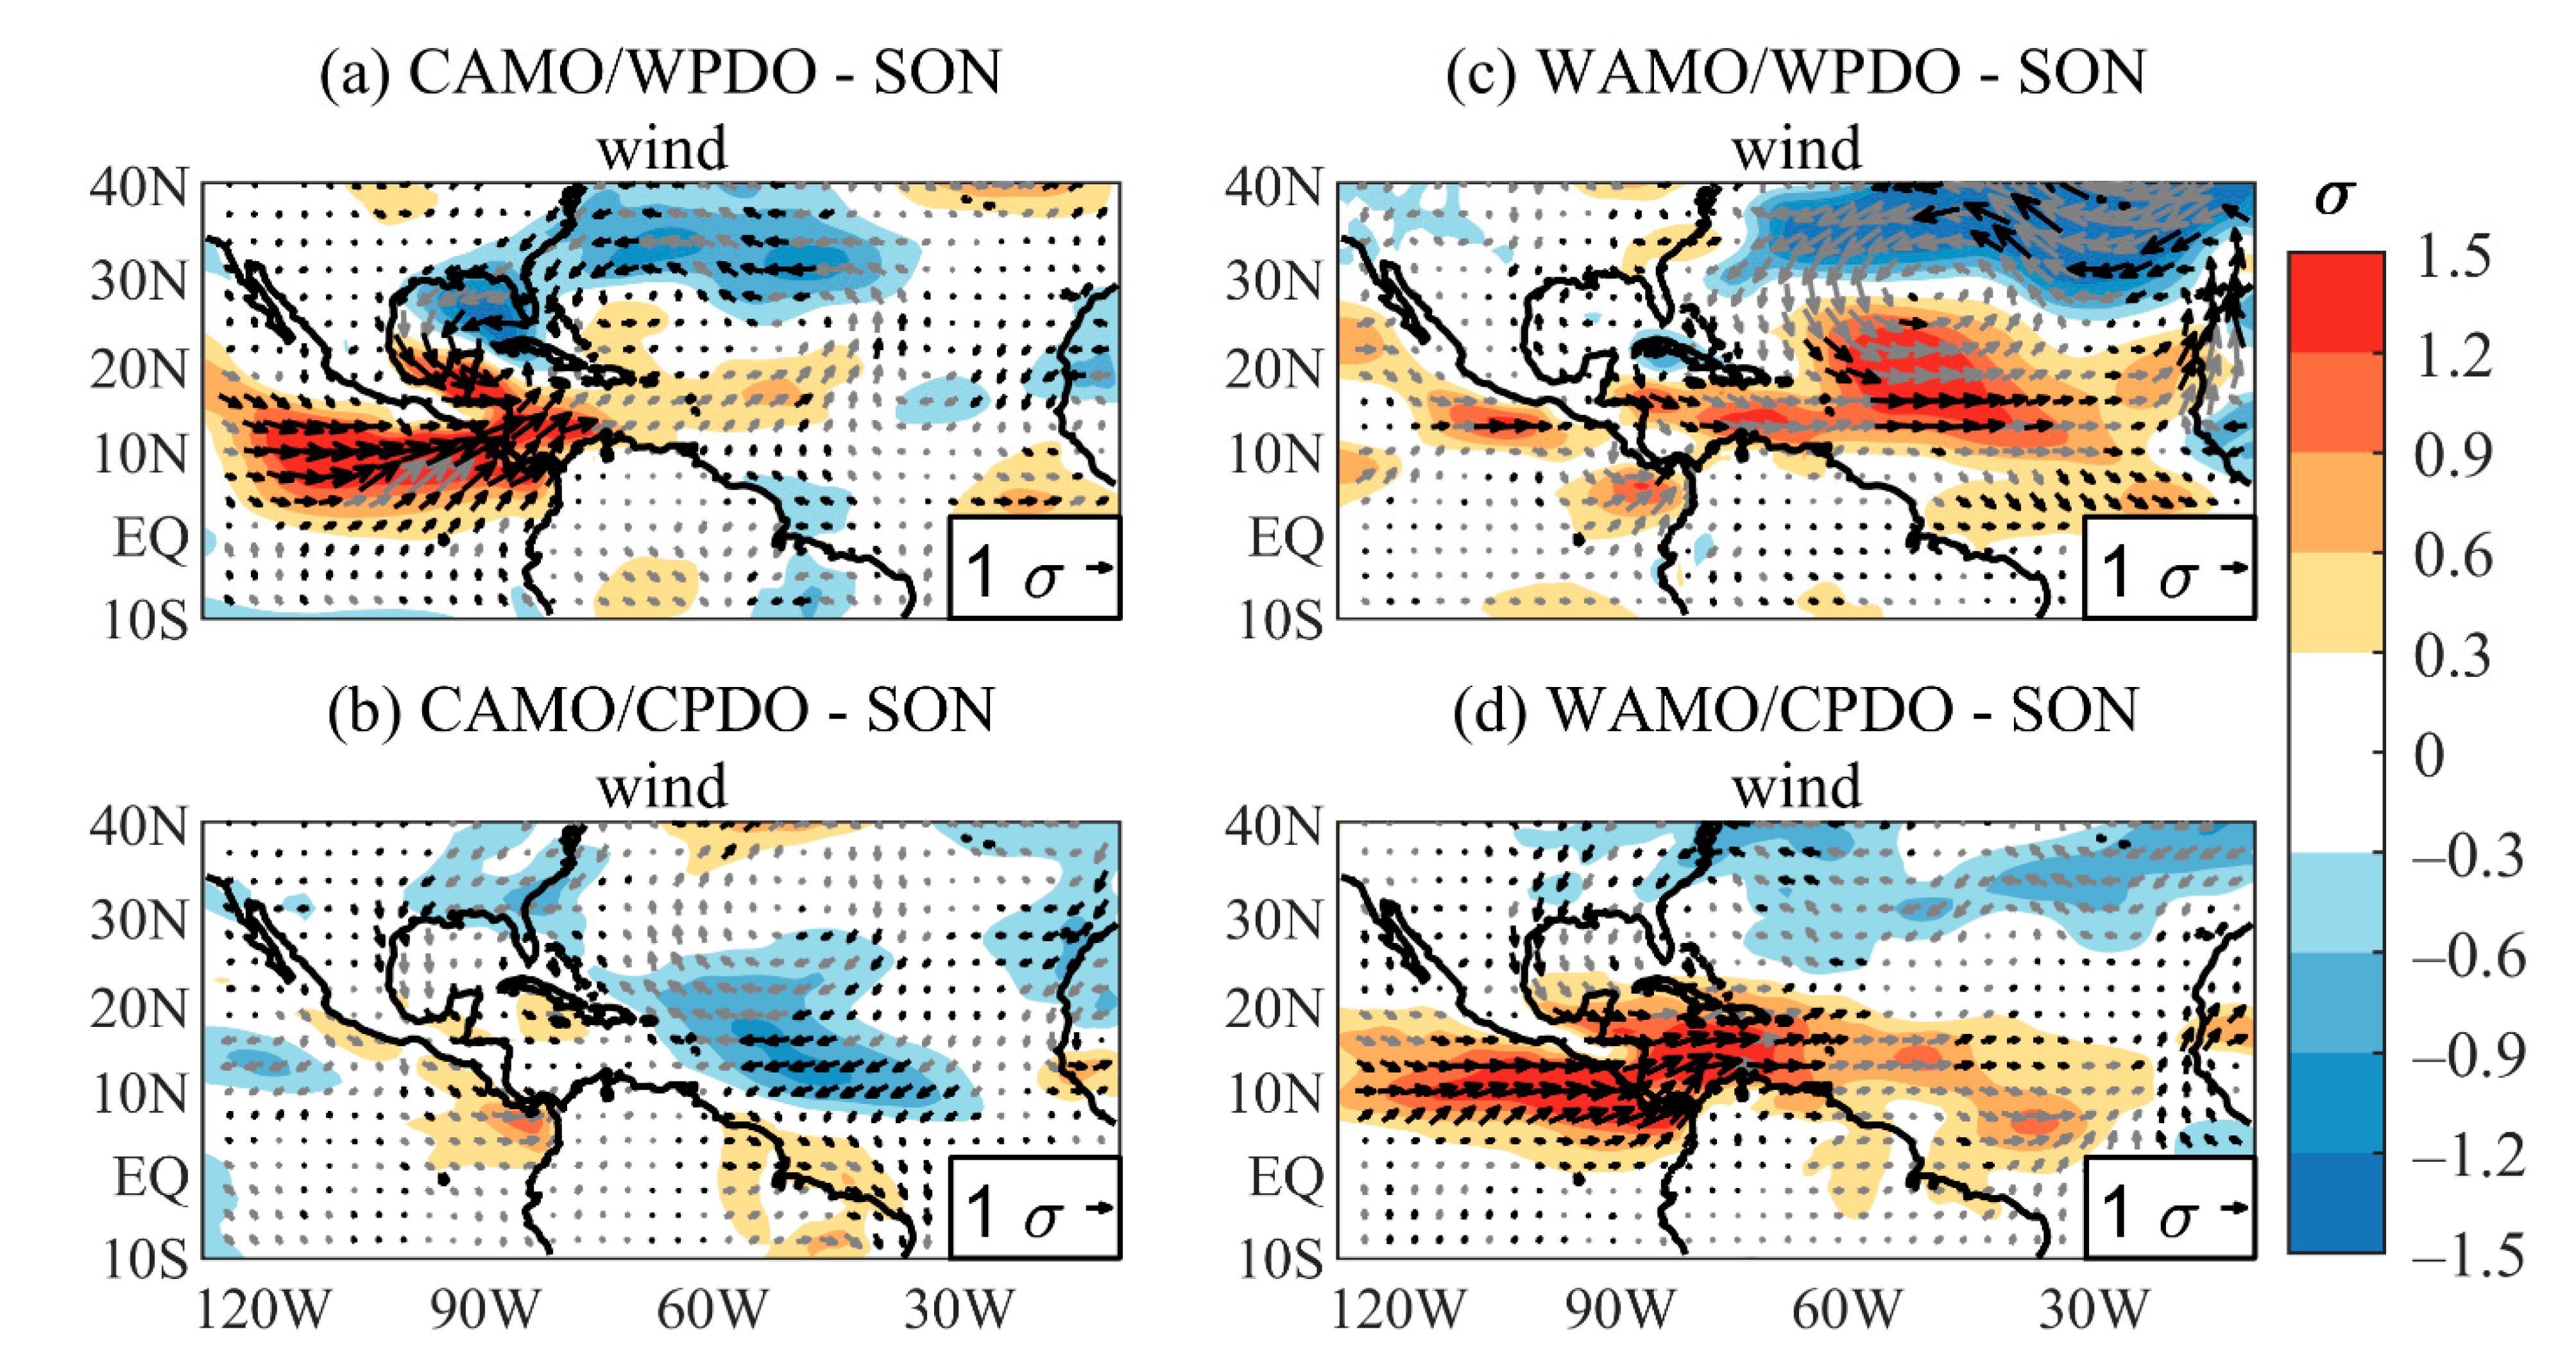
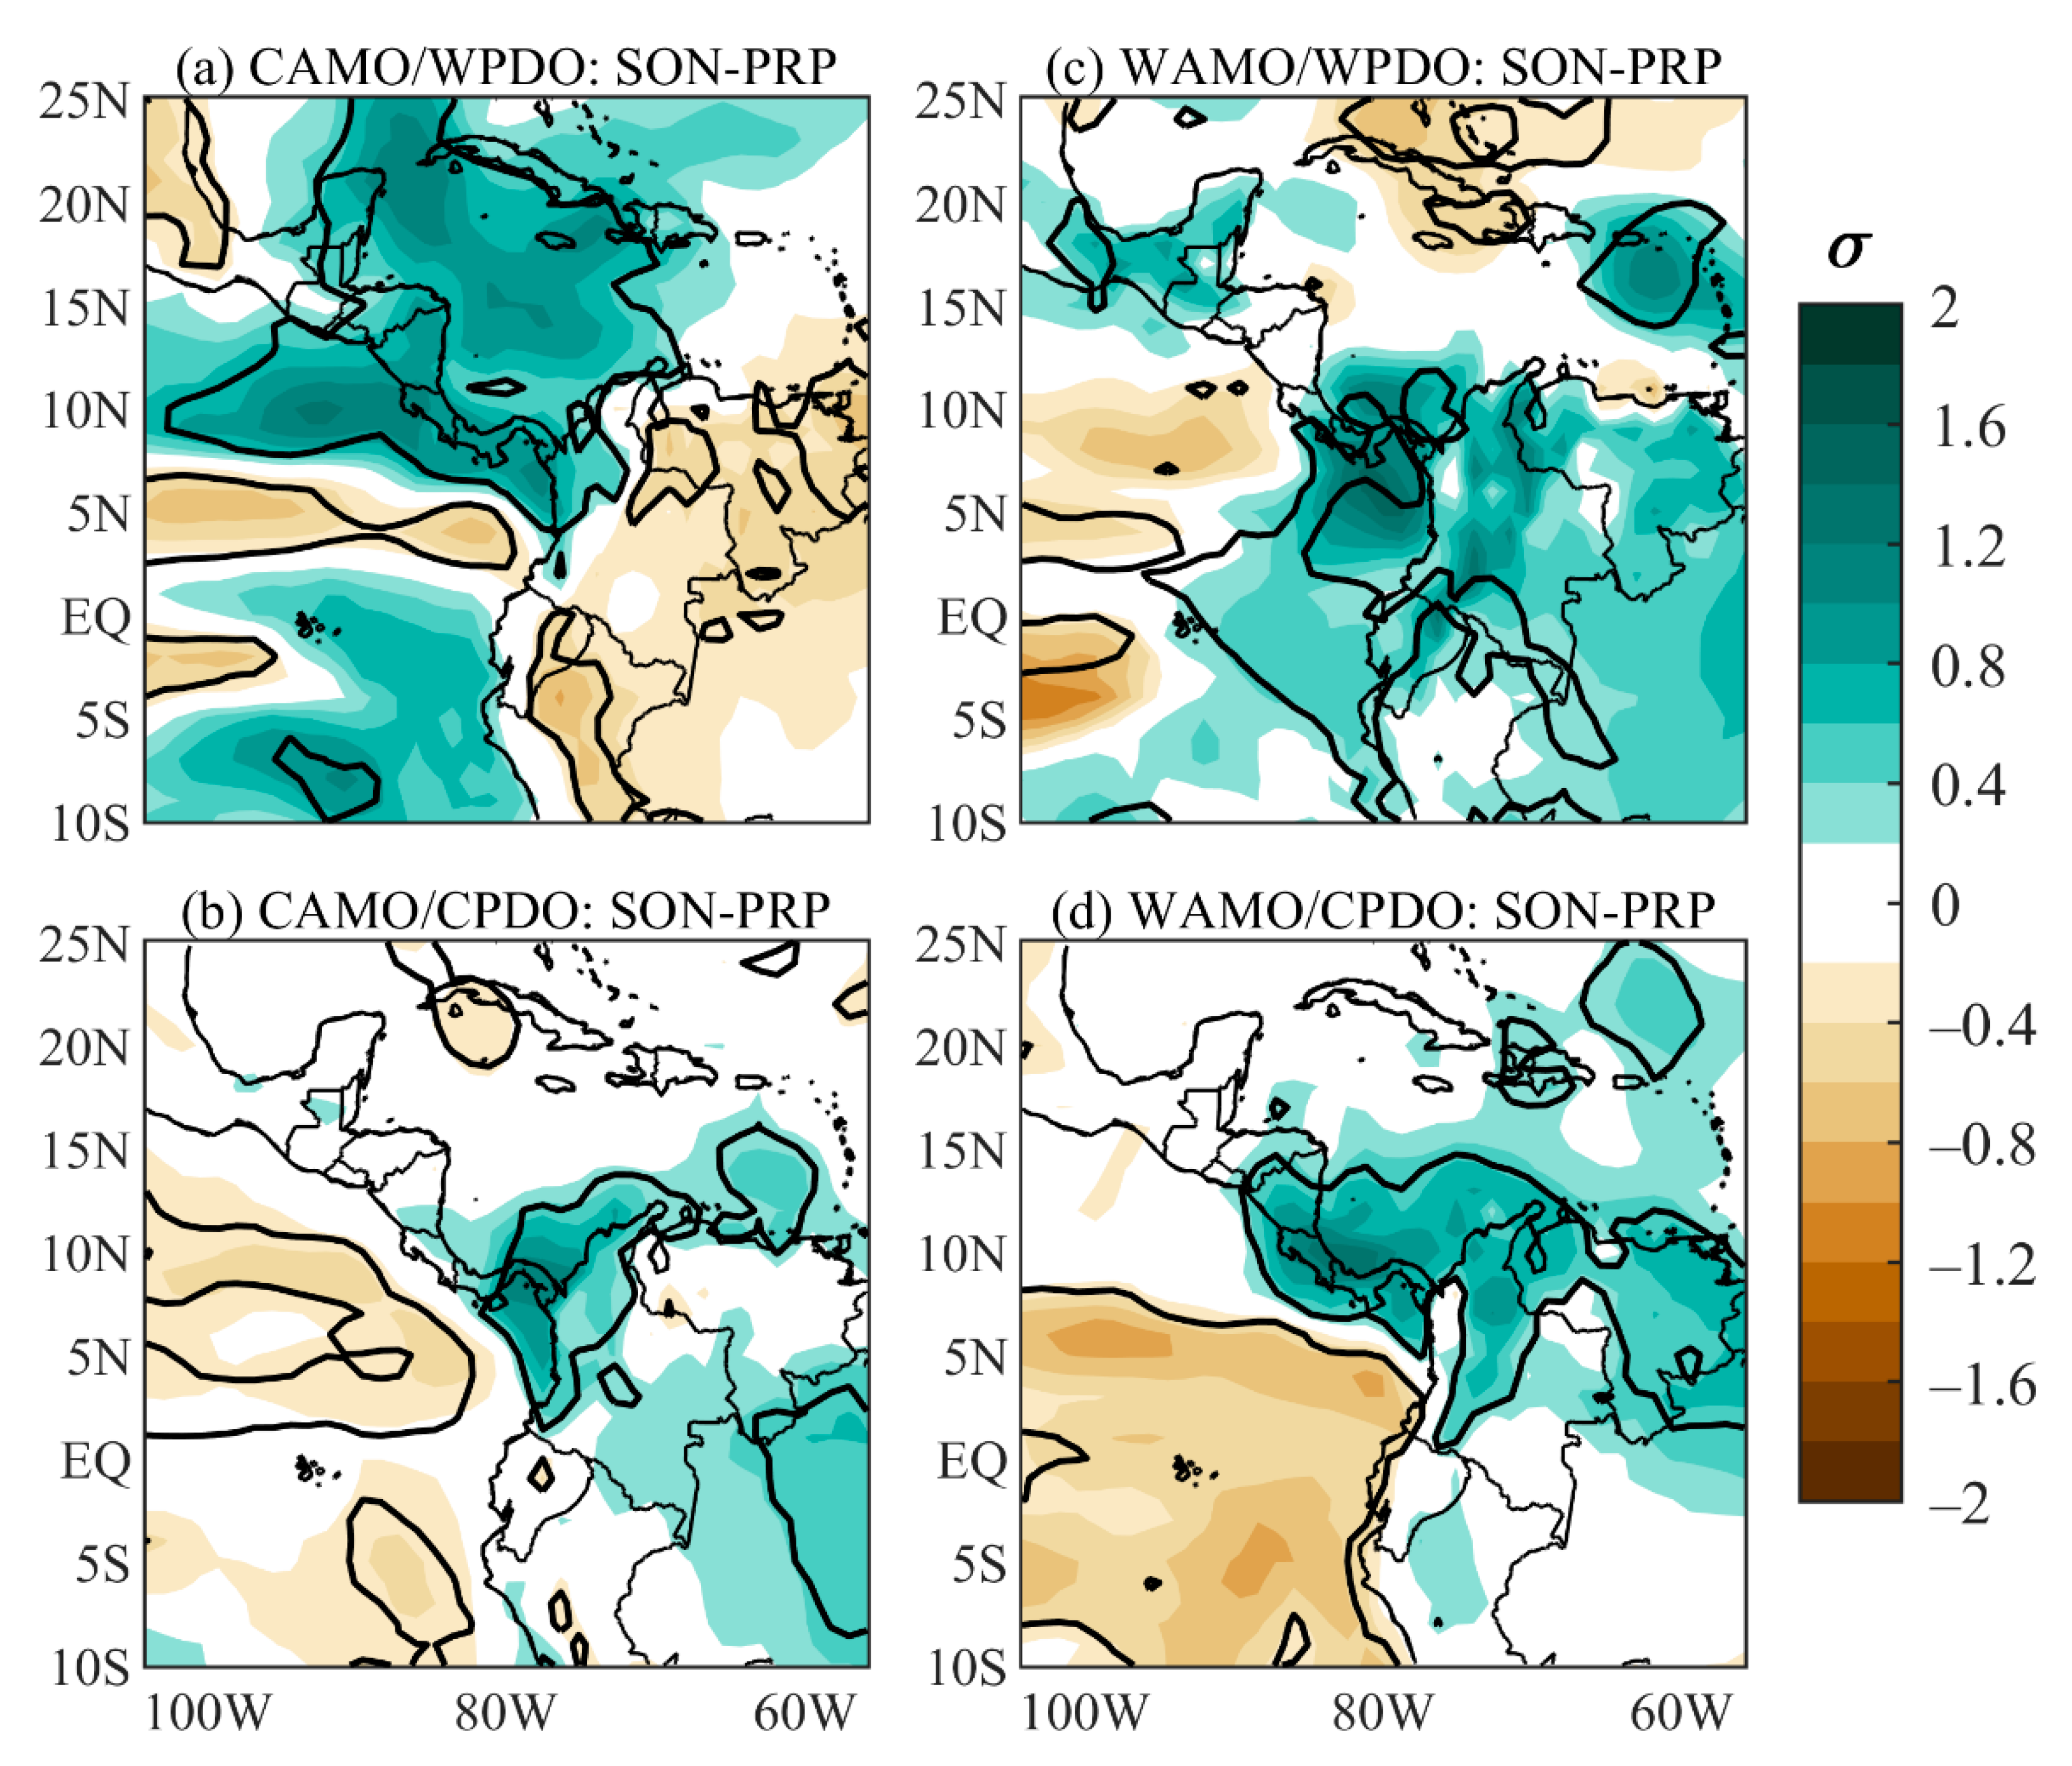
3.2. CJ-Related Oceanic and Atmospheric Patterns during SON under Distinct Low-Frequency Mean States

Table 1 lists the years with intense CJ events detected during the 1900–2015 period. Seven of them occur during the CAMO/WPDO, seven during the CAMO/CPDO, three during the WAMO/WPDO, and nine during the WAMO/CPDO.
The low-frequency mean states cause substantial differences in the CJ-related seasonal SST anomaly patterns in the tropical Pacific and Atlantic Oceans during SON (Figure 4). During the CAMO/WPDO (Figure 4a), negative SST anomalies prevail in the tropical Pacific over 180° W–90° W and in the tropical Atlantic sector (part of the TSA, Gulf of Mexico, and eastern coast of United States), approximately in the areas with negative anomalies in the tropical Atlantic corresponding mean state (Figure 3a) and weak cold conditions over the Caribbean Sea. During the CAMO/CPDO (Figure 4b), negative SST anomalies occur in the eastern tropical Pacific but are meridionally more extensive than those of the previous case. These results are consistent with Kayano et al. [31], who found that the southern winter negative SST anomalies in the eastern tropical Pacific associated with the La Niña during the CAMO/WPDO are meridionally more confined than those associated with La Niña during the CAMO/CPDO. However, there are considerable changes in the NATL, where neutral conditions prevail except for the negative SST anomalies centered at 20° N close to the western African coast between 60° W and 10° W.
During the WAMO/WPDO mean state, the SST anomaly pattern features anomalous warming over the Gulf of Mexico, Caribbean Sea, TNA between the equator and 20° N, and nonsignificant cold conditions in the tropical Pacific (Figure 4c). During the WAMO/CPDO phase (Figure 4d), the positive SST anomalies over the Caribbean Sea and TNA are weakened, and neutral conditions are observed in the Gulf of Mexico. In this case, the tropical Pacific Ocean displays anomalous cooling in its eastern sector between 20° N–20° S and anomalous warming over the subtropics to the west of 120° W. This anomalous warming overlaps the western Pacific regions with positive SST anomalies observed for the respective SST mean state during SON (Figure 4d).
Figure 4. September-November SST standardized anomalies during intense CJ events of the: (a) CAMO/WPDO; (b) CAMO/CPDO; (c) WAMO/WPDO, and (d) WAMO/CPDO mean states. Shades interval is every 0.2 SDs. The continuous line encompasses significant SST anomalies at a 95% confidence level based on the Student’s t-test.
Atmosphere 12 01120 g004
The SST anomaly patterns associated with the intense CJ show a common feature among the mean states, such as an anomalous cooling in the eastern tropical Pacific Ocean, whose intensity varies with the mean state. On the other hand, the SST anomaly patterns in the tropical Atlantic show distinct features. In addition, the CJ establishment is related to this cooling in the eastern tropical Pacific [9,20,30] as well as to the anomalous SST gradient between the eastern Pacific and western TNA and Caribbean Sea [27]. Figure 4 shows varying positions of the coldest or warmest SST cores in the TNA and the Caribbean Sea; as a consequence, the anomalous 925 hPa winds over northern South America and Central America during SON associated with the intense CJ show important variations during the mean states mentioned above (Figure 5). During the CAMO/WPDO (Figure 5a), a weak anticyclone occurs near the African coast due to this region’s small negative SST anomalies. However, the largest negative SST anomalies occur along the eastern coast of the United States and along the northern coast of South America. This relative east/west SST gradient in the TNA is consistent with a cyclonic circulation in the western TNA, which establishes an anomalous southwest–northeastward circulation from the eastern Pacific towards the Caribbean basin, forming a well-configured CJ from the Ecuadorian coast towards northwestern Colombia. Moreover, anomalous circulation is observed from the Gulf of Mexico towards the Caribbean Sea. It establishes an increase in precipitation over Central America and its adjacent oceans, centered over 95° W–75° W and 7° N–25° N, and northwestern Colombia (Figure 6a). Nevertheless, negative rainfall anomalies occur over the eastern Pacific, centered at 5° N, Central Mexico, northeastern parts of Colombia, eastern Ecuador, and northern Peru.
During the CAMO/CPDO (Figure 5b), the anomalous cooling in most central and eastern TNA promotes establishing an anticyclonic circulation in the TNA between 70° W and 30° W. Meanwhile, near-normal SST conditions in the Caribbean Basin and the Gulf of Mexico inhibit the westward circulation and the formation of the CJ in the eastern Pacific. The weak SST anomaly gradient between the eastern Pacific and the Caribbean Sea induces a weak anomalous circulation pattern from the eastern Pacific to the continent and the Caribbean Sea, highlighting only a nonsignificant northwest-southeast circulation along the west coast of Central America towards the western coast of Colombia and Panama. Therefore, the thermal conditions in the eastern Pacific and TNA induce competing anomalous circulation patterns in both oceanic areas. Consistent with these local circulation anomalies, negative precipitation anomalies are observed over the eastern Pacific Ocean west of 80° W and between the equator and 10° N in the Peruvian Pacific and positive anomalies over the northwestern and Caribbean coasts Colombia and Panama (Figure 6b).
Figure 5. September–November standardized wind anomalies at 925hPa during intense CJ events of the: (a) CAMO/WPDO; (b) CAMO/CPDO; (c) WAMO/WPDO; and (d) WAMO/CPDO mean states. Shades interval is every 0.3 SDs. Shaded areas indicate significant zonal wind anomalies at a 95% confidence level based on the Student’s t-test. Vectors are in bold only in regions where are significant at 95% based on the Student test. The arrow at the bottom of each panel illustrates the base magnitude of the wind vector in σ.
Atmosphere 12 01120 g005
During the WAMO/WPDO (Figure 5c), as normal SST conditions prevail in the North Atlantic between 20° N and 40° N and an anomalous warming in the adjacent regions (TNA and the Caribbean Sea), a cyclonic circulation is configured in the North Atlantic centered between 70° W and 30° W; at the same time, weak cooling prevails in the eastern tropical Pacific. Thus, a weak thermal contrast between the eastern Pacific and the Atlantic and cyclonic circulation in the North Atlantic weaken the CLLJ and do not cause an important strengthening of the zonal winds in the CJ region. Under these conditions, significant positive precipitation anomalies are found over Panama and their adjacent oceans, southern Colombia, and western Ecuador (Figure 6c). On the other hand, during the WAMO/CPDO (Figure 5d), the anomalous warming of the Caribbean Sea and Gulf of Mexico basins is weaker than during the WAMO/WPDO, but the cooling in the eastern tropical Pacific is stronger, and neutral SST anomalies prevail in the TNA approximately between 20° N and 40° N. These SST anomalies favor a cyclonic circulation near the eastern coast of the Americas and up to 60° W, which promotes the weakening of the CLLJ, the strengthening of westerly winds from the eastern Pacific towards the Caribbean Sea, and the strengthening of Pacific winds towards western Colombia. As a result of this circulation, negative precipitation anomalies are observed over most of the eastern Pacific 10° S–10° N band between 100° W and the South American coast; moreover, positive anomalies are observed over most of Central America and the Caribbean and Andean regions of Colombia and Venezuela (Figure 6d).
Figure 6. September–November precipitation standardized anomalies over Central America and northwestern South America during intense CJ events of the: (a) CAMO/WPDO; (b) CAMO/CPDO; (c) WAMO/WPDO; and (d) WAMO/CPDO mean states. Shades interval is every 0.2 SDs. The continuous line encompasses significant precipitation anomalies at a 95% confidence level based on the Student’s t-test.
Atmosphere 12 01120 g006

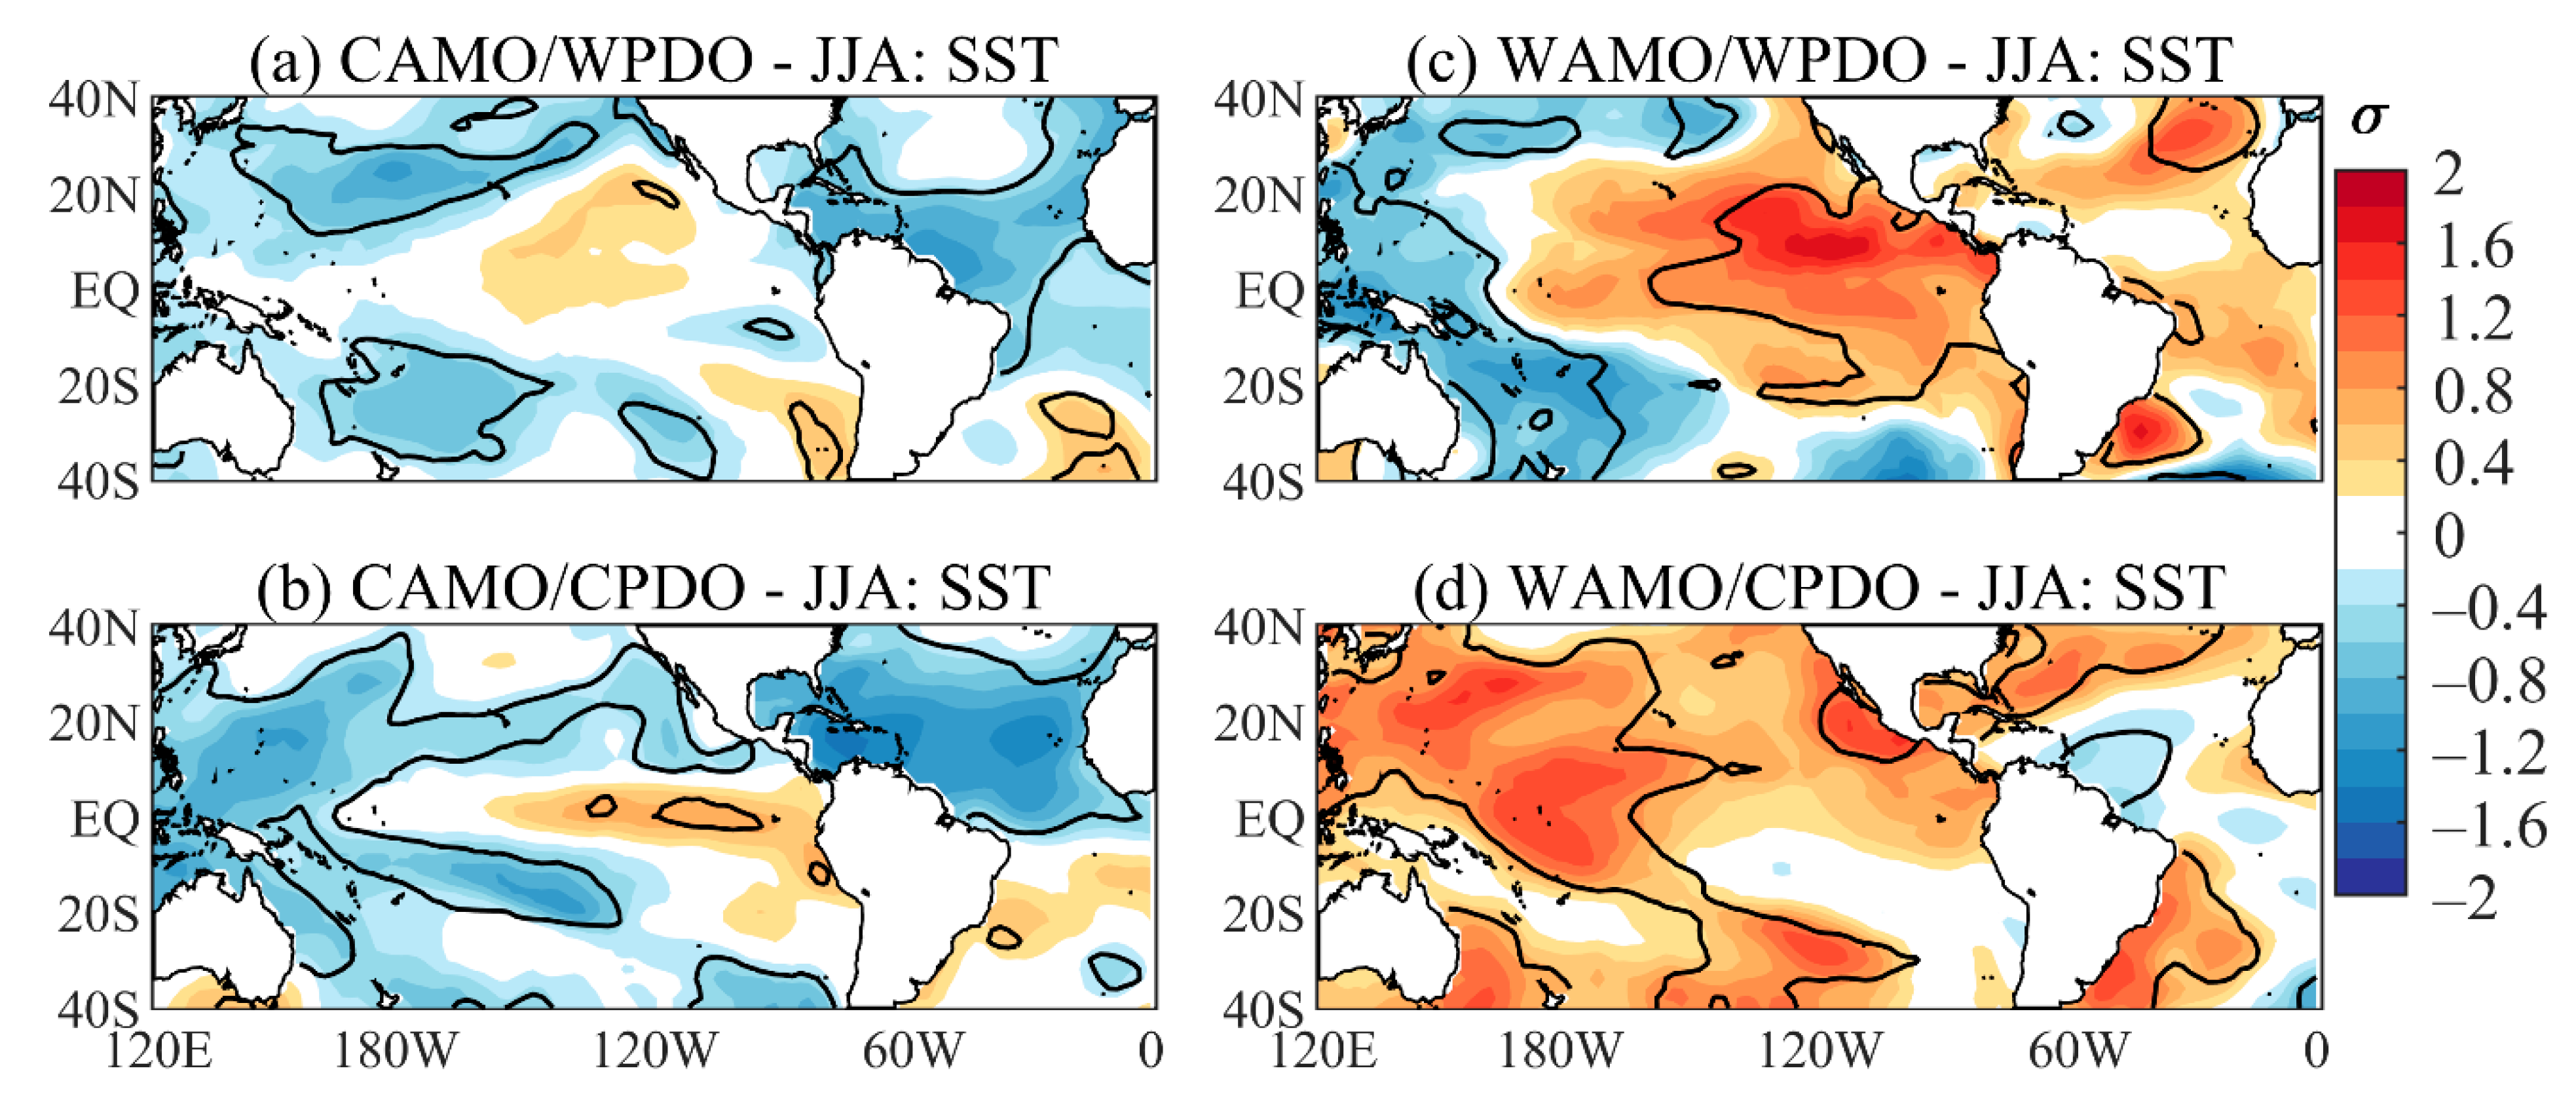
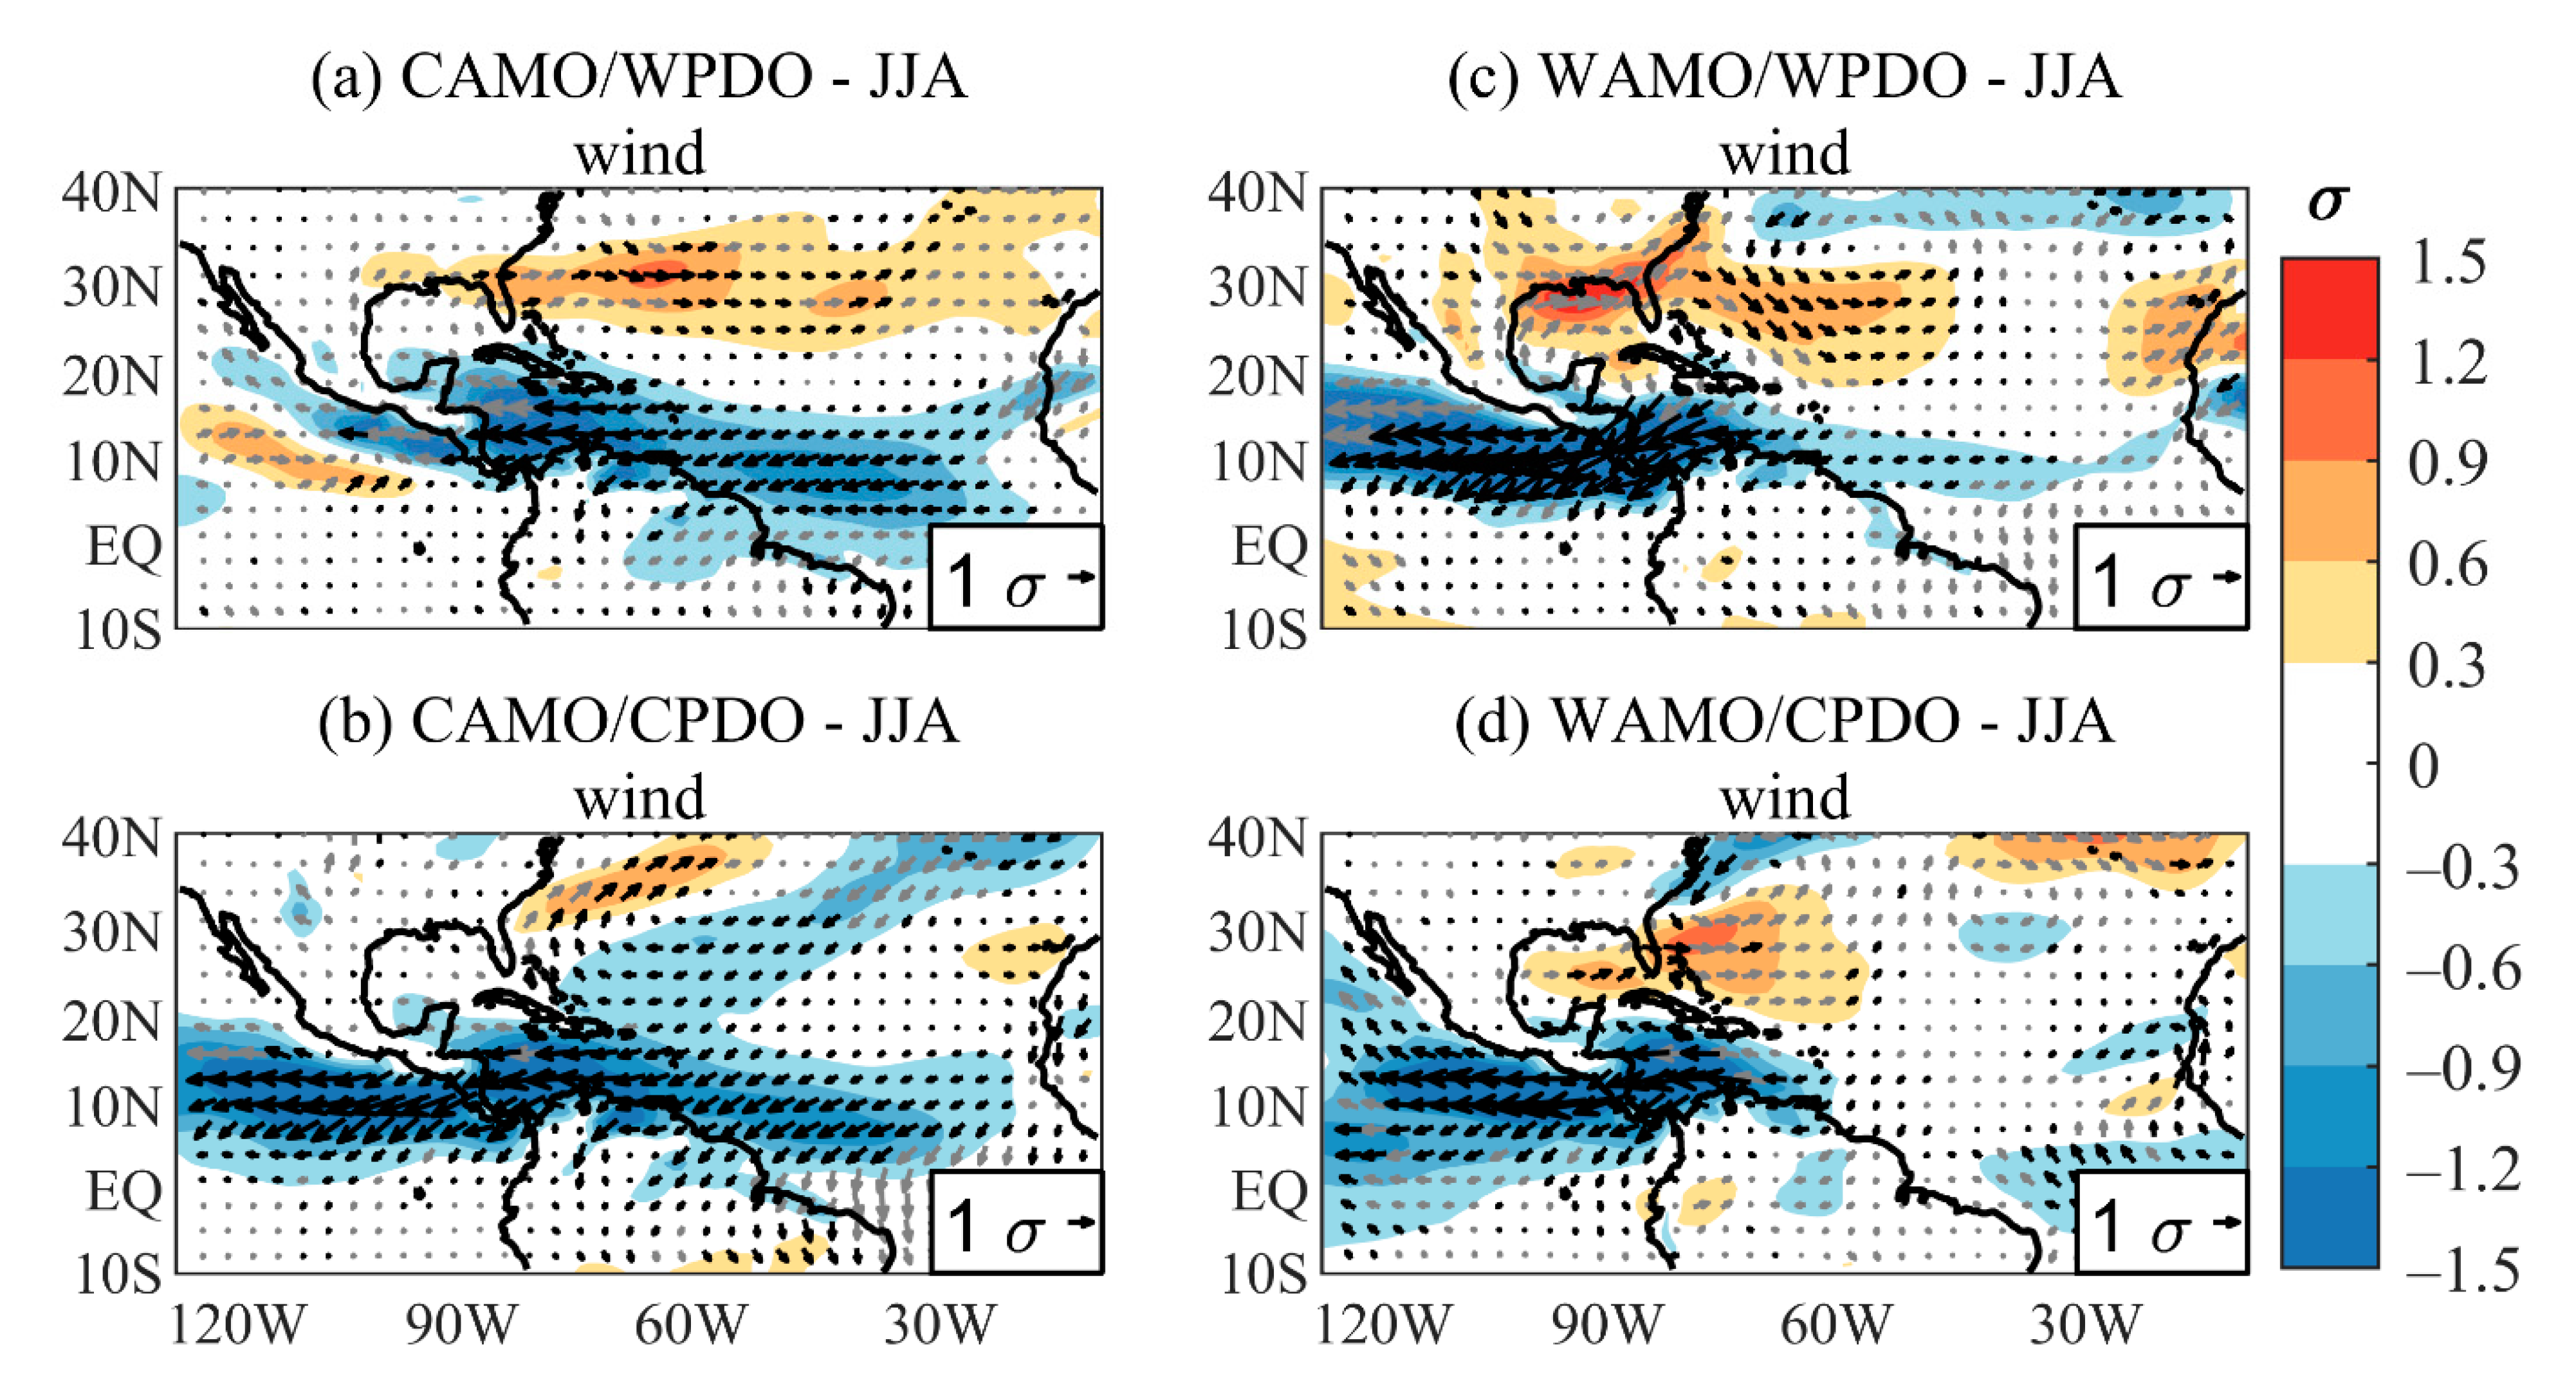
3.3. CLLJ-Related Oceanic and Atmospheric Patterns during JJA under Distinct Low-Frequency Mean States

Out of 26 intense CLLJ events detected during the 1900–2015 period, nine of them occur during the CAMO/WPDO, eight during the CAMO/CPDO, four during the WAMO/WPDO, and five during the WAMO/CPDO (Table 2). The intense CLLJ event of 1925 was disregarded for the CAMO/WPDO mean state because the AMO index that was close to zero during the 1925–1929 period implies uncertainty in the AMO phase.
The low-frequency mean states during JJA (Figure 3e–h) lead to substantial variations in the anomalous SST patterns related to intense CLLJ events (Figure 7). SST anomaly patterns in the tropical Pacific and Atlantic Oceans show differences among mean states. During the CAMO/WPDO and CAMO/CPDO mean states (Figure 7a,b), strong CLLJ events show negative SST anomalies in most of the TNA (equator–20° N) and Caribbean Sea. These anomalies present larger magnitudes and more spread during the CAMO/CPDO when the anomalies extend to 40° N and cover the Gulf of Mexico and in the tropical areas where the negative SST anomalies prevail in the corresponding mean state (Figure 3f). Moreover, weak warming prevails in the central tropical Pacific, which is surrounded by negative anomalies to the east and west during the CAMO/WPDO; positive anomalies are confined to the eastern equatorial Pacific during the CAMO/CPDO (Figure 7b), where small negative to positive weak anomalies occur in the mean state, as observed in Figure 3f. The negative SST anomalies surrounding the equatorial Pacific positive anomalies (Figure 3f) contribute to the more limited El Niño-related positive SST anomalies during the CAMO/CPDO mean state (Figure 7b).
During the WAMO/WPDO mean state (Figure 7c), neutral SST conditions remain in most of the tropical Atlantic, except for positive anomalies in two areas: one in the southwestern Atlantic along the southeastern coast of South America and another in the eastern TNA within 40° N–25° N. Positive anomalies are observed in the eastern Pacific within approximately 20° N–20° S (with the highest anomalies centered at 120° W) and negative anomalies are observed in the western tropical Pacific south of 20° N.
During the WAMO/CPDO, except for a small area along the western coast of Mexico and an area south of 20° S centered at 135° W, neutral SST anomalies in most areas of the eastern tropical Pacific to the east of 150° W are surrounded by positive anomalies in the tropical and subtropical western Pacific (Figure 7d), which overlap the areas with positive SST anomalies in the corresponding mean state (Figure 3h). Additionally, positive SST anomalies occur in the northwestern TNA, Gulf of Mexico, and TSA along the eastern coast of tropical South America. On the other hand, negative anomalies prevail in a small area between 60° W and 40° W along the northern coast of South America. Furthermore, normal conditions prevail in the Caribbean Sea.
Consistent with the above-described SST anomaly patterns for intense CLLJ events during JJA under distinct low-frequency mean states, the associated anomalous 925 hPa wind patterns show differences that reflect distinct CLLJ effects in rainfall in Central America and northwestern South America (Figure 8 and Figure 9). During the CAMO/WPDO and CAMO/CPDO (Figure 8a,b), the negative SST anomalies over most of the TNA, more widespread during CAMO/CPDO, result in an anticyclone over most of the North Atlantic, extending into the Caribbean region; however, the more significant anomalous warming of the eastern Pacific during CAMO/CPDO (Figure 7a,b), strengthens the thermal contrast between these two basins and the east-west circulation between the Caribbean and the eastern Pacific. Consequently, the CLLJ intensifies in the Caribbean region, and the trade winds split into two branches: one flowing into the Pacific basin through Central America and the other flowing into the North Atlantic near the eastern coast of the United States (Figure 8b). Moreover, anomalous warming in the eastern equatorial Pacific inhibits CJ development, and consequently, winds blow from the continent to the ocean in the Colombian Pacific region.
As a result, negative precipitation anomalies are observed in most of the Caribbean Sea east of 80° W, and dry conditions remain in Venezuela and in central, northern, and eastern Colombia during CAMO/WPDO (Figure 9a). Moreover, positive anomalies are observed over eastern Honduras and Nicaragua, Belize, northern Guatemala, the Yucatan Peninsula, and the Gulf of Mexico (Figure 9a). On the other hand, although during CAMO/CPDO (Figure 9b) the same conditions are maintained for Colombia, Venezuela, and the Caribbean Sea, in Central America, negative anomalies occur over the west coast and the surrounding Pacific Ocean (15° N–7° N); and positive anomalies occur over the eastern Pacific within 5° N–7° S.
Figure 8. June–August standardized wind anomalies at 925hPa during intense CLLJ events of the: (a) CAMO/WPDO; (b) CAMO/CPDO; (c) WAMO/WPDO; and (d) WAMO/CPDO mean states. Shades interval is every 0.3 SDs. Display is same as Figure 5.
Atmosphere 12 01120 g008
During the WAMO/WPDO and WAMO/CPDO, positive SST anomalies in the eastern Pacific and western North Atlantic play a major role in the strengthening and extension of the CLLJ (Figure 7c,d). In this respect, the warming in the western North Atlantic leads to a cyclonic circulation near the east coast of the United States and between 20° N and 40° N, restricting the strongest easterlies from the Caribbean Sea into the Pacific, different from the previous cases, in which the anticyclone extended over TNA (Figure 7a,b). Furthermore, the anomalous warming of the eastern Pacific, more pronounced during WAMO/WPDO, allows the strengthening of easterly winds towards the eastern Pacific, which translates into a strengthening of the CLLJ. Thus, easterlies flow from the Caribbean to the eastern Pacific, with the greatest intensity of the wind anomalies centered between 12° N and 5° N. Consequently, during WAMO/WPDO, negative precipitation anomalies are more intense and extensive over most Central America, such as the Gulf of Mexico and most of the Caribbean Sea, except for a region with positive precipitation anomalies in the southwestern corner near Panama and Costa Rica (Figure 9c). Furthermore, the strengthening of the eastern CLLJ weakens the western CJ, resulting in negative precipitation anomalies in northern and central Colombia and northern Peru. Positive rainfall anomalies can also be observed in the eastern Pacific, centered at 5° N, and on the Ecuadorian and Peruvian coasts. Although similar results are observed during the WAMO/CPDO, negative precipitation anomalies are more pronounced over the Colombian Pacific than in the previous case (Figure 9d). Moreover, positive rainfall anomalies occur over eastern Peru.
Figure 9. June–August precipitation standardized anomalies over Central America and northwestern South America during intense CLLJ events of the: (a) CAMO/WPDO; (b) CAMO/CPDO; (c) WAMO/WPDO; and (d) WAMO/CPDO mean states. Display is same as Figure 6.
Atmosphere 12 01120 g009

4. Discussion

Poveda and Mesa [10], Yepes et al. [9], and Sierra et al. [49] showed that the SST/SLP gradient between the eastern Pacific Ocean and northwestern South American landmass partially explains the existence of the CJ. Thus, stronger (weaker) SST/SLP differences are related to a stronger (weaker) intensity and a northward (southward) location of the CJ. Furthermore, several studies have associated the enhanced CJ with the La Niña event [9,20] and the intensified CLLJ with El Niño [14,21]. These findings imply that the anomalously cold eastern tropical Pacific is necessary for CJ intensification and the anomalously warm eastern Pacific for CLLJ intensification. Furthermore, previous studies have shown relations between ENSO variability and the combined PDO and AMO mean states [31,32]. The abovementioned outcomes imply that CJ and CLLJ variability depends on the combined PDO and AMO mean states. In addition, Cerón et al. [27,30] highlighted the important role of the low-frequency mean states on the modulation of the CJ and CLLJ intensities, such that the CJ weakens and the CLLJ intensifies during the CAMO/WPDO and vice versa during the WAMO/CPDO. The results in this study show that the anomalous SST gradient between the eastern tropical Pacific and the TNA and Caribbean Sea further explains the CJ and CLLJ variability among the four mean states. When this gradient is directed from the eastern tropical Pacific into the TNA and the Caribbean Sea, the CJ is strengthened, and when it is in the opposite direction, the CLLJ is strengthened. Therefore, our results complement the mechanisms previously discussed since they describe the dynamics on a larger scale, including the CLLJ and the multidecadal oscillations.
The WAMO/CPDO mean state has favorable conditions in the eastern tropical Pacific and the TNA and the Caribbean Sea to establish the SST gradient that intensifies the CJ. Thus, in this mean state, of nine selected intense CJ events, five coincide with La Niña years and four, with ENSO-neutral years (Table 1). Thus, under a favorable mean state, even in ENSO-neutral years, an intense CJ might occur. For the CJ composite during SON of the WAMO/CPDO, the well-established SST gradient (Figure 4d), accompanied by a cyclonic circulation near the east coast of the Americas, the Gulf of Mexico, and the Caribbean Sea (Figure 5d), weakens the CLLJ and strengthens the CJ in the Colombian region; As a result, there is an increase in rainfall over the Andes and the Colombian Caribbean, most of Central America south of Honduras and its adjacent oceans (Figure 6d).
On the other hand, the CAMO/WPDO mean state favors an anomalous SST gradient from the TNA/Caribbean Sea into the tropical Pacific, which is not favorable for CJ intensification. Nevertheless, our results show that all CJ events selected for this mean state overlap with La Niña events (Table 1), overcoming the mean state and promoting intense CJ development. Thus, in this mean state, the presence of a La Niña is a necessary condition for CJ intensification. For the CJ composite during SON of the CAMO/WPDO, the SST gradient related to cold conditions in the eastern Pacific and tropical Atlantic, except for the Caribbean, where weak cooling is observed (Figure 4a), thus, the development of an anticyclonic circulation in the western Atlantic, allows the establishment of a southwest-northeast circulation from the eastern Pacific to the Caribbean Sea, resulting in CJ intensification (Figure 5a) and increasing rainfall over most of Central America and the adjacent oceans (Figure 6a).
The CAMO/CPDO mean state diminishes the favorable conditions for the establishment of an SST gradient from the eastern Pacific to the Caribbean Sea, owing to the prevalence of anomalous cold conditions in both oceanic regions. In this case, five intense CJ events coincide with La Niña, another with El Niño and one with an ENSO-neutral year (Table 1). Thus, under unfavorable mean state conditions, intense CJ events occur mainly during La Niña years, even though they can also occur in ENSO-neutral or El Niño years. However, despite a well-established negative SST La Niña pattern, the anomalous cooling in most of the central and eastern North Atlantic promotes an anticyclonic circulation between 70° W and 30° W, while near-normal conditions prevail in the Caribbean Sea, inhibiting the thermal contrast between the eastern Pacific and the Caribbean Sea. As a result, the eastern Pacific circulation towards the Caribbean is reduced and, so that intense CJ events do not establish (Figure 5b). In this case, an increase in rainfall is confined in western and northern Colombia and Panama (Figure 6b).
The above results agree with Cerón et al. [27], who found an increase in Colombian and Central American rainfall due to an interbasin SST gradient between the eastern tropical Pacific and the Caribbean Sea during the WAMO, which is consistent with the WAMO/CPDO results. In this regard, anomalous warming in the North Atlantic and the Caribbean Sea and anomalous cooling in the tropical Pacific enhance the west-east circulation at 925 hPa, strengthening the CJ and weakening the CLLJ. Moreover, a weaker gradient is observed during the CAMO/CPDO, which coincides with the Cerón et al. [27] results during the cooling of the tropical Pacific and the CAMO phase.
Moreover, one of the most important aspects of the CLLJ variability is associated with the SST gradient between the eastern tropical Pacific and TNA (Figure 7); however, contrary to the SST patterns associated with the CJ (Figure 4), a reversed SST gradient is observed. Thus, positive SST anomalies are observed in the eastern tropical Pacific during the CAMO/CPDO, WAMO/WPDO, and WAMO/CPDO mean states, and negative anomalies in the TNA, during the CAMO/WPDO and CAMO/CPDO (Figure 7a,b) or lower than those in the Pacific, during the WAMO/WPDO and WAMO/CPDO (Figure 7c,d). Regarding the role of TNA in the intensity of the CLLJ, we found that the position of the cooling or warming in the North Atlantic plays an important role in restricting the circulation. During CAMO phases, extended anticyclonic circulations over most of TNA favor the intensification of the CLLJ, resulting in strengthened easterly winds from 30° W to the Caribbean Sea during CAMO/WPDO and CAMO/CPDO (Figure 8a,b). However, only during the latter mean state, the CLLJ continues to cross the Central American isthmus as a result of the warming of the eastern Pacific, which strengthens the thermal contrast between the basins; this generally reduces precipitation in Central America and in western, central and northern Colombia (Figure 9a,b). On the other hand, during the WAMO/WPDO and WAMO/CPDO events, the warming of the western North Atlantic generates a cyclonic circulation near the eastern coast of the United States, restricting the strongest easterlies to the Caribbean Sea (Figure 7a,b); however, the warming of the eastern Pacific allows the strengthening of easterly winds towards this region, which translates into a strengthening of the CLLJ.
This result is consistent with Wang’s [14] findings concerning the relationships between the CLLJ and the SST anomalies in the Caribbean Sea, which are linked to the variation in the North Atlantic subtropical high. Associated with cooling in the Caribbean Sea, the atmosphere shows high pressures near the Caribbean region, which is consistent with an anomalously strong easterly CLLJ. However, this study shows that the TNA cooling by itself is not enough to intensify the CLLJ and allows its advance in Central America and towards the eastern tropical Pacific.

5. Conclusions

This study analyzes the variability of the CJ and CLLJ with consideration of the simultaneous Pacific, and Atlantic SST low-frequency mean states and their effects on the atmospheric circulation and rainfall in northwestern South America and Central America for the 1900–2015 period. Oceanic and atmospheric features related to the LLJs are obtained using composites of intense CJ and CLLJ events during the corresponding seasons when they have the highest intensity, which are SON and JJA, respectively.
Our results suggest that part of the variability of the CJ and CLLJ might be due to differences in the combined low-frequency mean states between the AMO and PDO and the contrasts generated in the interbasin gradient between the eastern tropical Pacific and the TNA/Caribbean Sea. Thus, the interannual variability interacts with the low frequency, so that the cooling or warming more concentrated in the eastern Pacific and/or TNA and the Caribbean Sea restricts or strengthens the circulation associated with the CJ and the CLLJ.
Oher important findings of this study are:
  • Variations in the SST anomaly positioning in the eastern Pacific, tropical North Atlantic (TNA)/Caribbean Sea during different mean states restrict the circulation, and the intensity of the CJ and CLLJ.
  • The CJ intensification during WAMO/CPDO is associated with cyclonic circulation in the Caribbean region and the Gulf of Mexico, due to anomalous warming in the TNA and Caribbean Sea regions, and the thermal contrast between the eastern Pacific (cold) and TNA (warm). This pattern is less intense during WAMO/WPDO due to a weak thermal contrast between these oceanic regions, and the positioning of cyclonic circulation in the central TNA region.
  • For the CLLJ, during CAMO phases (cold TNA), the anticyclonic circulations extended over most of the TNA favor its intensification from 30° W to the Caribbean Sea. In contrast, during WAMO (warm TNA/ Caribbean Sea), the cyclonic circulation near the east coast of the United States restricts its intensification to the Caribbean Sea region.
The present analysis features the differences in SST anomaly patterns and large-scale circulation associated with the low-frequency mean states and the LLJ higher intensity seasons. To the best of our knowledge, these relationships have not been examined previously. Thus, they could be used for future diagnostic studies and atmospheric modeling of extreme climate events associated with extreme CJ and CLLJ events under different AMO and PDO settlings simultaneously. However, considering that our study implies that AMO/PDO interactions may be useful for diagnostic and modeling studies, it is important to note that, according to Mann et al. [50], AMO/PDO modes of variability may not co-occur in the future due to global warming.

Author Contributions

Conceptualization—W.L.C., M.T.K. and R.V.A. Methodology—W.L.C., A.A.-D., M.T.K., R.V.A. Software was managed by W.L.C., A.A.-D., I.P.d.S. and R.A.F.S. Validation—W.L.C., A.A.-D., R.V.A. and M.T.K. Formal analysis—W.L.C., R.V.A., I.P.d.S. and M.T.K. Investigation—W.L.C., M.T.K., R.V.A. and A.A.-D., Data curation—W.L.C., I.P.d.S., R.A.F.S. and A.A.-D. Original draft preparation—W.L.C., M.T.K., R.V.A. and A.A.-D. Reviewing and editing—W.L.C., M.T.K., R.V.A., A.A.-D. and I.P.d.S. Visualization—W.L.C. and A.A.-D. Supervision—M.T.K. and R.V.A. All authors have read and agreed to the published version of the manuscript.

Funding

The first author was supported by the Universidad del Valle (Cali-Colombia). The Conselho Nacional de Desenvolvimento Científico e Tecnológico (CNPq) of Brazil partially supported the second, third and fifth authors under grants 302322/2017-5, 305611/2019-4, and 141982/2019-5, respectively. The third author was partially supported by Universidade do Estado do Amazonas (grant, ordinance 086/2021—GR/UEA). The fourth author has received funding from the CNPq under a Post-doctoral scholarship. We thank the Coordenação de Aperfeiçoamento de Pessoal de Nível Superior CAPES (PROAP 1931/2017). Support for the Twentieth Century Reanalysis Project version 3 dataset is provided by the U.S. Department of Energy, Office of Science Biological and Environmental Research (BER), by the National Oceanic and Atmospheric Administration Climate Program Office, and by the NOAA Earth System Research Laboratories Physical Sciences Laboratory. The authors thank the four anonymous reviewers for their helpful comments.

Institutional Review Board Statement

Not applicable.

Informed Consent Statement

Not applicable.

Data Availability Statement

Not applicable.

Conflicts of Interest

The authors declare no conflict of interest. The founding sponsors had no role in the design, analysis and interpretation of data, in the writing manuscript, or in the decision to publish the results.

References

  1. Pabón-Caicedo, J.D.; Eslava-Ramírez, J.A.; Gómez-Torres, R.E. Generalidades de la distribución espacial y temporal de la temperatura del aire y de la precipitación en Colombia. Meteorol. Colomb. 2001, 4, 47–59. [Google Scholar]
  2. Hastenrath, S. The Intertropical Convergence Zone of the Eastern Pacific revisited. Int. J. Climatol. 2002, 22, 347–356. [Google Scholar] [CrossRef]
  3. Poveda, G.; Waylen, P.R.; Pulwarty, R.S. Annual and inter-annual variability of the present climate in northern South America and southern Mesoamerica. Palaeogeogr. Palaeoclimatol. Palaeoecol. 2006, 234, 3–27. [Google Scholar] [CrossRef]
  4. Hoyos, I.; Baquero-Bernal, A.; Jacob, D.; Rodríguez, B. Variability of extreme events in the Colombian Pacific and Caribbean catchment basins. Clim. Dyn. 2013, 40, 1985–2003. [Google Scholar] [CrossRef]
  5. Guzmán, D.; Ruíz, J.F.; Cadena, M. Regionalización de Colombia Según la Estacionalidad de la Precipitación Media Mensual, a Través Análisis de Componentes Principales (ACP); Instituto de Hidrología, Meteorología y Estudios Ambientales (IDEAM): Bogotá, Colombia, 2014. [Google Scholar]
  6. Poveda, G.; Jaramillo, L.; Vallejo, L.F. Seasonal precipitation patterns along pathways of South American low-level jets and aerial rivers. Water Resour. Res. 2014, 50, 98–118. [Google Scholar] [CrossRef]
  7. Morales, J.; Arias, P.; Martínez, J. Role of Caribbean low-level jet and Choco jet in the transport of moisture patterns towards Central America. In Proceedings of the 1st International Electronic Conference on Hydrological Cycle (CHyCle-2017), Online, 12–16 November 2017; Volume 1, p. 4861. [Google Scholar]
  8. Bedoya-Soto, J.M.; Aristizábal, E.; Carmona, A.M.; Poveda, G. Seasonal Shift of the Diurnal Cycle of Rainfall Over Medellin’s Valley, Central Andes of Colombia (1998–2005). Front. Earth Sci. 2019, 7, 92. [Google Scholar] [CrossRef]
  9. Yepes, J.; Poveda, G.; Mejía, J.F.; Moreno, L.; Rueda, C. Choco-jex: A research experiment focused on the Chocó low-level jet over the far eastern Pacific and western Colombia. Bull. Am. Meteorol. Soc. 2019, 100, 779–796. [Google Scholar] [CrossRef]
  10. Poveda, G.; Mesa, O.J. On the Existence of Lloró (the Rainiest Locality on Earth): Enhanced Ocean-Land-Atmosphere Interaction by a Low-Level Jet. Geophys. Res. Lett. 2000, 27, 1675–1678. [Google Scholar] [CrossRef] [Green Version]
  11. Sakamoto, M.S.; Ambrizzi, T.; Poveda, G. Moisture Sources and Life Cycle of Convective Systems over Western Colombia. Adv. Meteorol. 2011, 2011, 890759. [Google Scholar] [CrossRef]
  12. Durán-Quesada, A.M.; Gimeno, L.; Amador, J. Role of moisture transport for Central American precipitation. Earth Syst. Dyn. 2017, 8, 147–161. [Google Scholar] [CrossRef] [Green Version]
  13. Serna, L.M.; Arias, P.A.; Vieira, S.C. Las corrientes superficiales de chorro del Chocó y el Caribe durante los eventos de El Niño y El Niño Modoki. Rev. Acad. Colomb. Cienc. Exactas Físicas Nat. 2018, 42, 410. [Google Scholar] [CrossRef]
  14. Wang, C. Variability of the Caribbean Low-Level Jet and its relations to climate. Clim. Dyn. 2007, 29, 411–422. [Google Scholar] [CrossRef] [Green Version]
  15. Amador, J.A. A Climatic Feature of the Tropical Americas: The Trade Wind Easterly Jet. Top. Meteorol. Oceanogr. 1998, 5, 91–102. [Google Scholar]
  16. Amador, J.A. The Intra-Americas Sea low-level jet: Overview and future research. Ann. N. Y. Acad. Sci. 2008, 1146, 153–188. [Google Scholar] [CrossRef] [PubMed] [Green Version]
  17. Higgins, R.W.; Yao, Y.; Yarosh, E.S.; Janowiak, J.E.; Mo, K.C. Influence of the great plains low-level jet on summertime precipitation and moisture transport over the central United States. J. Clim. 1997, 10, 481–507. [Google Scholar] [CrossRef]
  18. Algarra, I.; Eiras-Barca, J.; Miguez-Macho, G.; Nieto, R.; Gimeno, L. On the assessment of the moisture transport by the Great Plains low-level jet. Earth Syst. Dyn. 2019, 10, 107–119. [Google Scholar] [CrossRef] [Green Version]
  19. Wang, C.; Lee, S.K. Atlantic warm pool, Caribbean low-level jet, and their potential impact on Atlantic hurricanes. Geophys. Res. Lett. 2007, 34, 1–5. [Google Scholar] [CrossRef] [Green Version]
  20. Arias, P.A.; Martínez, J.A.; Vieira, S.C. Moisture sources to the 2010–2012 anomalous wet season in northern South America. Clim. Dyn. 2015, 45, 2861–2884. [Google Scholar] [CrossRef]
  21. Gallego, D.; García-Herrera, R.; Gómez-Delgado, F.D.P.; Ordoñez-Perez, P.; Ribera, P. Tracking the moisture transport from the Pacific towards Central and northern South America since the late 19th century. Earth Syst. Dyn. 2019, 10, 319–331. [Google Scholar] [CrossRef] [Green Version]
  22. Stensrud, D.J. Importance of Low-Level Jets to Climate: A Review. J. Clim. 1996, 9, 1698–1711. [Google Scholar] [CrossRef]
  23. Xie, S.P.; Xu, H.; Kessler, W.S.; Nonaka, M. Air-sea interaction over the eastern Pacific warm pool: Gaps winds, thermocline dome, and atmospheric convection. J. Clim. 2005, 18, 5–20. [Google Scholar] [CrossRef]
  24. Chelton, D.B.; Freilich, M.H.; Esbensen, S.K. Satellite Observations of the Wind Jets off the Pacific Coast of Central America. Part I: Case Studies and Statistical Characteristics. Mon. Weather Rev. 2002, 128, 1993–2018. [Google Scholar] [CrossRef]
  25. Serra, Y.L.; Kiladis, G.N.; Hodges, K.I. Tracking and mean structure of easterly waves over the Intra-Americas Sea. J. Clim. 2010, 23, 4823–4840. [Google Scholar] [CrossRef]
  26. Wang, C.; Lee, S.K.; Enfield, D.B. Impact of the Atlantic warm pool on the summer climate of the Western Hemisphere. J. Clim. 2007, 20, 5021–5040. [Google Scholar] [CrossRef]
  27. Cerón, W.L.; Andreoli, R.V.; Kayano, M.T.; Avila-Diaz, A. Role of the eastern Pacific-Caribbean Sea SST gradient in the Choco low-level jet variations from 1900–2015. Clim. Res. 2021, 83, 61–74. [Google Scholar] [CrossRef]
  28. Poveda, G.; Jaramillo, A.; Gil, M.M.; Quiceno, N.; Mantilla, R.I. Seasonally in ENSO-related precipitation, river discharges, soil moisture, and vegetation index in Colombia. Water Resour. Res. 2001, 37, 2169–2178. [Google Scholar] [CrossRef]
  29. Amador, J.A.; Alfaro, E.J.; Lizano, O.G.; Magaña, V.O. Atmospheric forcing of the eastern tropical Pacific: A review. Prog. Oceanogr. 2006, 69, 101–142. [Google Scholar] [CrossRef]
  30. Cerón, W.L.; Andreoli, R.V.; Kayano, M.T.; Souza, R.A.F.; Jones, C.; Carvalho, L.M.V. The Influence of the Atlantic Multidecadal Oscillation on the Choco Low-Level Jet and Precipitation in Colombia. Atmosphere 2020, 11, 174. [Google Scholar] [CrossRef] [Green Version]
  31. Kayano, M.T.; Andreoli, R.V.; Souza, R.A.F. El Niño–Southern Oscillation related teleconnections over South America under distinct Atlantic Multidecadal Oscillation and Pacific Interdecadal Oscillation backgrounds: La Niña. Int. J. Climatol. 2019, 39, 1359–1372. [Google Scholar] [CrossRef]
  32. Kayano, M.T.; Andreoli, R.V.; Souza, R.A.F. Pacific and Atlantic multidecadal variability relations to the El Niño events and their effects on the South American rainfall. Int. J. Climatol. 2020, 40, 2183–2200. [Google Scholar] [CrossRef]
  33. Barichivich, J.; Gloor, E.; Peylin, P.; Brienen, R.J.W.; Schöngart, J.; Espinoza, J.C.; Pattnayak, K.C. Recent intensification of Amazon flooding extremes driven by strengthened Walker circulation. Sci. Adv. 2018, 4, eaat8785. [Google Scholar] [CrossRef] [Green Version]
  34. Pattnayak, K.C.; Gloor, E.; Tindall, J.C.; Brienen, R.J.W.; Barichivich, J.; Baker, J.C.A.; Spracklen, D.V.; Cintra, B.B.L.; Coelho, C.A.S. Adding new evidence to the attribution puzzle of the recent water shortage over São Paulo (Brazil). Tellus Ser. A Dyn. Meteorol. Oceanogr. 2018, 70, 1–14. [Google Scholar] [CrossRef] [Green Version]
  35. Pattnayak, K.C.; Tindall, J.C.; Brienen, R.J.W.; Barichivich, J.; Gloor, E. Can We Detect Changes in Amazon Forest Structure Using Measurements of the Isotopic Composition of Precipitation? Geophys. Res. Lett. 2019, 46, 14807–14816. [Google Scholar] [CrossRef]
  36. Huang, B.; Thorne, P.W.; Banzon, V.F.; Boyer, T.; Chepurin, G.; Lawrimore, J.H.; Menne, M.J.; Smith, T.M.; Vose, R.S.; Zhang, H.M. Extended reconstructed Sea surface temperature, Version 5 (ERSSTv5): Upgrades, validations, and intercomparisons. J. Clim. 2017, 30, 8179–8205. [Google Scholar] [CrossRef]
  37. National Oceanic and Atmospheric Administration. Extended Reconstructed Sea Surface Temperature (NOAA/ERSST) SST Data. Available online: https://www.esrl.noaa.gov/psd/data/gridded/ (accessed on 1 March 2018).
  38. Slivinski, L.C.; Compo, G.P.; Whitaker, J.S.; Sardeshmukh, P.D.; Giese, B.S.; McColl, C.; Allan, R.; Yin, X.; Vose, R.; Titchner, H.; et al. Towards a more reliable historical reanalysis: Improvements for version 3 of the Twentieth Century Reanalysis system. Q. J. R. Meteorol. Soc. 2019, 145, 2876–2908. [Google Scholar] [CrossRef] [Green Version]
  39. NOAA-CIRES-DOE Twentieth Century Reanalysis Project Version 3 Monthly Averaged Data from 1836/01 to 2015/12 (Combined SI-MO). Available online: https://psl.noaa.gov/data/gridded/data.20thC_ReanV3.html (accessed on 3 January 2020).
  40. Compo, G.P.; Whitaker, J.S.; Sardeshmukh, P.D.; Matsui, N.; Allan, R.J.; Yin, X.; Gleason, B.E.; Vose, R.S.; Rutledge, G.; Bessemoulin, P.; et al. The Twentieth Century Reanalysis Project. Q. J. R. Meteorol. Soc. 2011, 137, 1–28. [Google Scholar] [CrossRef]
  41. Gillespie, I.M.; Haimberger, L.; Compo, G.P.; Thorne, P.W. Assessing potential of sparse-input reanalyses for centennial-scale land surface air temperature homogenisation. Int. J. Climatol. 2021, 41, E3000–E3020. [Google Scholar] [CrossRef]
  42. Slivinski, L.C.; Compo, G.P.; Sardeshmukh, P.D.; Whitaker, J.S.; McColl, C.; Allan, R.J.; Brohan, P.; Yin, X.; Smith, C.A.; Spencer, L.J.; et al. An evaluation of the performance of the twentieth century reanalysis version 3. J. Clim. 2021, 34, 1417–1438. [Google Scholar] [CrossRef]
  43. Mantua, N.J.; Hare, S.R.; Zhang, Y.; Wallace, J.M.; Francis, R.C. A Pacific Interdecadal Climate Oscillation with Impacts on Salmon Production. Bull. Am. Meteorol. Soc. 1997, 78, 1069–1079. [Google Scholar] [CrossRef]
  44. Enfield, D.B.; Mestas-Nuñez, A.M.; Trimble, P.J. The Atlantic multidecadal oscillation and its relation to rainfall and river flows in the continental U.S. Geophys. Res. Lett. 2001, 28, 2077–2080. [Google Scholar] [CrossRef] [Green Version]
  45. Panofsky, H.G.; Brier, G.W. Some Applications of Statistics to Meteorology; College of Mineral Industries, Ed.; Mineral Industries Extension Services, Pennsylvania State University: State College, PA, USA, 1968. [Google Scholar]
  46. Boschat, G.; Simmonds, I.; Purich, A.; Cowan, T.; Pezza, A.B. On the use of composite analyses to form physical hypotheses: An example from heat wave—SST associations. Sci. Rep. 2016, 6, 29599. [Google Scholar] [CrossRef]
  47. Enfield, D.B.; Mestas-Nuñez, A.M. Multiscale variabilities in global sea surface temperatures and their relationships with tropospheric climate patterns. J. Clim. 1999, 12, 2734–2746. [Google Scholar] [CrossRef]
  48. Kayano, M.T.; Rosa, M.B.; Rao, V.B.; Andreoli, R.V.; Souza, R.A.F. Relations of the low-level extratropical cyclones in the southeast Pacific and South Atlantic to the Atlantic multidecadal oscillation. J. Clim. 2019, 32, 4167–4178. [Google Scholar] [CrossRef] [Green Version]
  49. Sierra, J.P.; Arias, P.A.; Durán-Quesada, A.M.; Tapias, K.A.; Vieira, S.C.; Martínez, J.A. The Choco low-level jet: Past, present and future. Clim. Dyn. 2021, 56, 2667–2692. [Google Scholar] [CrossRef]
  50. Mann, M.E.; Steinman, B.E.; Brouillette, D.J.; Miller, S.K. Multidecadal climate oscillations during the past millennium driven by volcanic forcing. Science 2021, 371, 1014–1019. [Google Scholar] [CrossRef] [PubMed]
Figure 2. The AMO and PDO indices for the 1900–2015 period. The AMO index was multiplied by three, and its unit is °C. The continuous ticker line is the AMO index, and the red and blue refer to the PDO index.
Atmosphere 12 01120 g002
Figure 3. September–November SST mean standardized anomaly pattern in the: (a) CAMO/WPDO; (b) CAMO/CPDO; (c) WAMO/WPDO; and (d) WAMO/CPDO mean states. June–August SST mean standardized anomaly pattern in the: (e) CAMO/WPDO; (f) CAMO/CPDO; (g) WAMO/WPDO; and (h) WAMO/CPDO mean states. Shades interval is every 0.2 SDs. The continuous line encompasses significant SST anomalies at a 95% confidence level based on the Student’s t-test.
Atmosphere 12 01120 g003
Figure 7. June–August SST standardized anomalies during intense CLLJ events of the: (a) CAMO/WPDO; (b) CAMO/CPDO; (c) WAMO/WPDO; and (d) WAMO/CPDO mean states. Display is same as Figure 4.
Atmosphere 12 01120 g007
Table 1. Intense years of the Choco jet (CJ) during indicated mean states. According to the criteria of the Oceanic Niño Index (ONI) years in bold are La Niña events, italic years are El Niño events, and the remaining years are neutral conditions.
Mean StateIntense CJ Years
CAMO/WPDO1903, 1906, 1908, 1909, 1910, 1988, 1995
CAMO/CPDO1963, 1964, 1966, 1970, 1973, 1974, 1975
WAMO/WPDO1941, 1942, 1944
WAMO/CPDO1948, 1949, 1950, 1955, 1956, 2003, 2005, 2007, 2010
Table 2. Intense years of the Caribbean low-level jet (CLLJ) during indicated mean states. According to the criteria of the Oceanic Niño Index (ONI) years in bold are La Niña events, italic years are El Niño events, and the remaining years are neutral conditions.
Mean StateIntense CLLJ Years
CAMO/WPDO1907, 1908, 1910, 1911, (1925), 1977, 1982, 1986, 1994
CAMO/CPDO1913, 1914, 1922, 1923, 1965, 1972, 1974, 1976
WAMO/WPDO1930, 1939, 1940, 1941
WAMO/CPDO1946, 2001, 2002, 2014, 2015
Publisher’s Note: MDPI stays neutral with regard to jurisdictional claims in published maps and institutional affiliations.

