
Concurrent Changepoints in Greenland Ice Core δ18O Records and the North Atlantic Oscillation over the Past Millennium


1
Institute for Geological and Geochemical Research, Research Centre for Astronomy and Earth Sciences, Eötvös Loránd Research Network (ELKH), Budaörsi út 45., H-1112 Budapest, Hungary
2
Doctoral School of Environmental Science, ELTE, Eötvös Loránd University, Pázmány P. stny. 1/C, H-1117 Budapest, Hungary
3
Department of Mathematics and Computer Science, College of the Holy Cross, 1 College Street, Worcester, MA 01610, USA
*
Author to whom correspondence should be addressed.
Atmosphere 2022, 13(1), 93; https://doi.org/10.3390/atmos13010093
Submission received: 6 September 2021
/
Revised: 28 December 2021
/
Accepted: 29 December 2021
/
Published: 7 January 2022
(This article belongs to the Special Issue Arctic Climate Change: Past, Present and Future)
Abstract
:Structural changes, or changepoints, coinciding in multiple ice core records over the Greenland Ice Sheet (GrIS) may reflect a widespread response of the GrIS to atmospheric forcing. Thus, to better understand how atmospheric circulation may regulate sudden changes in δ18O of Greenland precipitation, we seek synchronous changepoints occurring in ice core-derived δ18O time series across the GrIS and in the North Atlantic Oscillation (NAO) over the past millennium. By utilizing a Bayesian changepoint detection method, four changepoint horizons were revealed: at the beginning of the 20th century, in the late-15th century, and around the turn of the 11th and 10th centuries. Although the changepoints in ice core δ18O records exhibited distinctive spatial arrangements in each horizon, all corresponded to changepoints in the NAO, indicative of a consistent atmospheric influence on GrIS surface changes over the past millennium.
1. Introduction
Atmospheric circulation overlying the Greenland Ice Sheet (GrIS) shows marked interannual-to-decadal oscillations arising from large-scale natural oceanic/atmospheric modes of variability [1,2,3] such as the North Atlantic Oscillation (NAO; [4]). The NAO is the leading mode of atmospheric circulation variability in the North Atlantic [4] described by an index (NAO index), most often calculated from sea level pressure, and is widely used as a general indicator for the strength of the westerlies over the eastern North Atlantic [5]. It is known to influence the location of storm tracks across the North Atlantic and to regulate Greenland surface conditions by mediating opposing atmospheric circulation patterns in its different phases [6,7,8]. NAO phase changes may occur gradually or relatively abruptly in time, which, either way, can be interpreted as a change in the distribution of the NAO-index values. However, the detection of such changepoints’ abundancy and their typical magnitudes is constrained by relatively short observational records.
Thus, placing observed coupled changes in GrIS surface conditions and atmospheric circulation aloft into the context of paleoclimatic time scales is necessary to better understand the consistency of their co-variability with regard to synchronous sudden changes. A vast number of high-resolution ice core-derived paleoclimate proxy parameters are available from the GrIS [9,10,11], some of which approximate ambient temperatures—e.g., firn/ice δ18O records [12]—that altogether offer insights into past Greenland changes beyond the observational era [13]. The water stable isotopes from firn and ice profiles are one of the most studied geochemical parameters when it comes to investigating past climates [12]. Firn/ice stable isotope signature is known to be affected by changes in evaporation conditions and air mass trajectories [14], frequency of weather regimes [15], and circulation patterns [16,17].
Studies of glaciochemical and water isotopic parameters on single ice cores have shown that if atmospheric circulation changes, then the change in moisture source region [18] and transport path of precipitation [19] is rapidly reflected in the water stable isotopic composition of fallen snow. A small set of sea salt aerosol proxy records from the northern GrIS show a consistent relationship with large-scale pressure patterns and storm activity over the North Atlantic region [10]. However, the characteristics of this pattern could have not have been reconstructed from a single ice core due to the low signal-to-noise ratio. A dominant influence of the NAO was found on the west-central GrIS in the early 20th century by studying an extensive collection of ice core-derived annual accumulation histories [20]. The leading mode of variability of ice core δ18O for 1778–1970 CE of multiple ice cores (n = 14) was linked to the NAO primarily in the Southern region of the GrIS [11]. A subsequent study, spanning a slightly broader time interval compared to [11] and reinforced by isotope simulations, evaluated an extended set (n = 22) of shallow ice core derived δ18O series across the GrIS and pointed out spatially variable depletion/enrichment in the isotopic composition of ice/firn depending on the dominant NAO mode [15].
In an effort to complement previous studies, ice core-derived water stable isotope records available from the GrIS and its vicinity are explored to find concurrent changepoints that not only occur in multiple ice cores but are also coincident with structural changes in the NAO. Major centennial climate anomalies encompassed by the past millennium, such as the Medieval Climate Anomaly (from ~950 to ~1250 CE) or the Little Ice Age (from ~1450 to ~1850 CE) [21], might invite to query whether synchronous changes in ice core δ18O and the NAO reflect those periods in the past millennium.
If multiple objectively defined and statistically significant changes occur among different ice cores, it would clearly suggest that these oscillations are not merely artifacts of local variability of the GrIS but instead are triggered by larger-scale forcing(s) [22]. Hence, the present study complements previous efforts and elucidates the persistence of the observed strong physical link between precipitation δ18O variability and atmospheric circulation beyond the instrumental era. Although the underlying mechanisms causing abrupt Greenland climate changes are far from fully understood, the goal of this study is to explore statistical relationships instead of seeking driving mechanisms quantitatively.
2. Materials and Methods
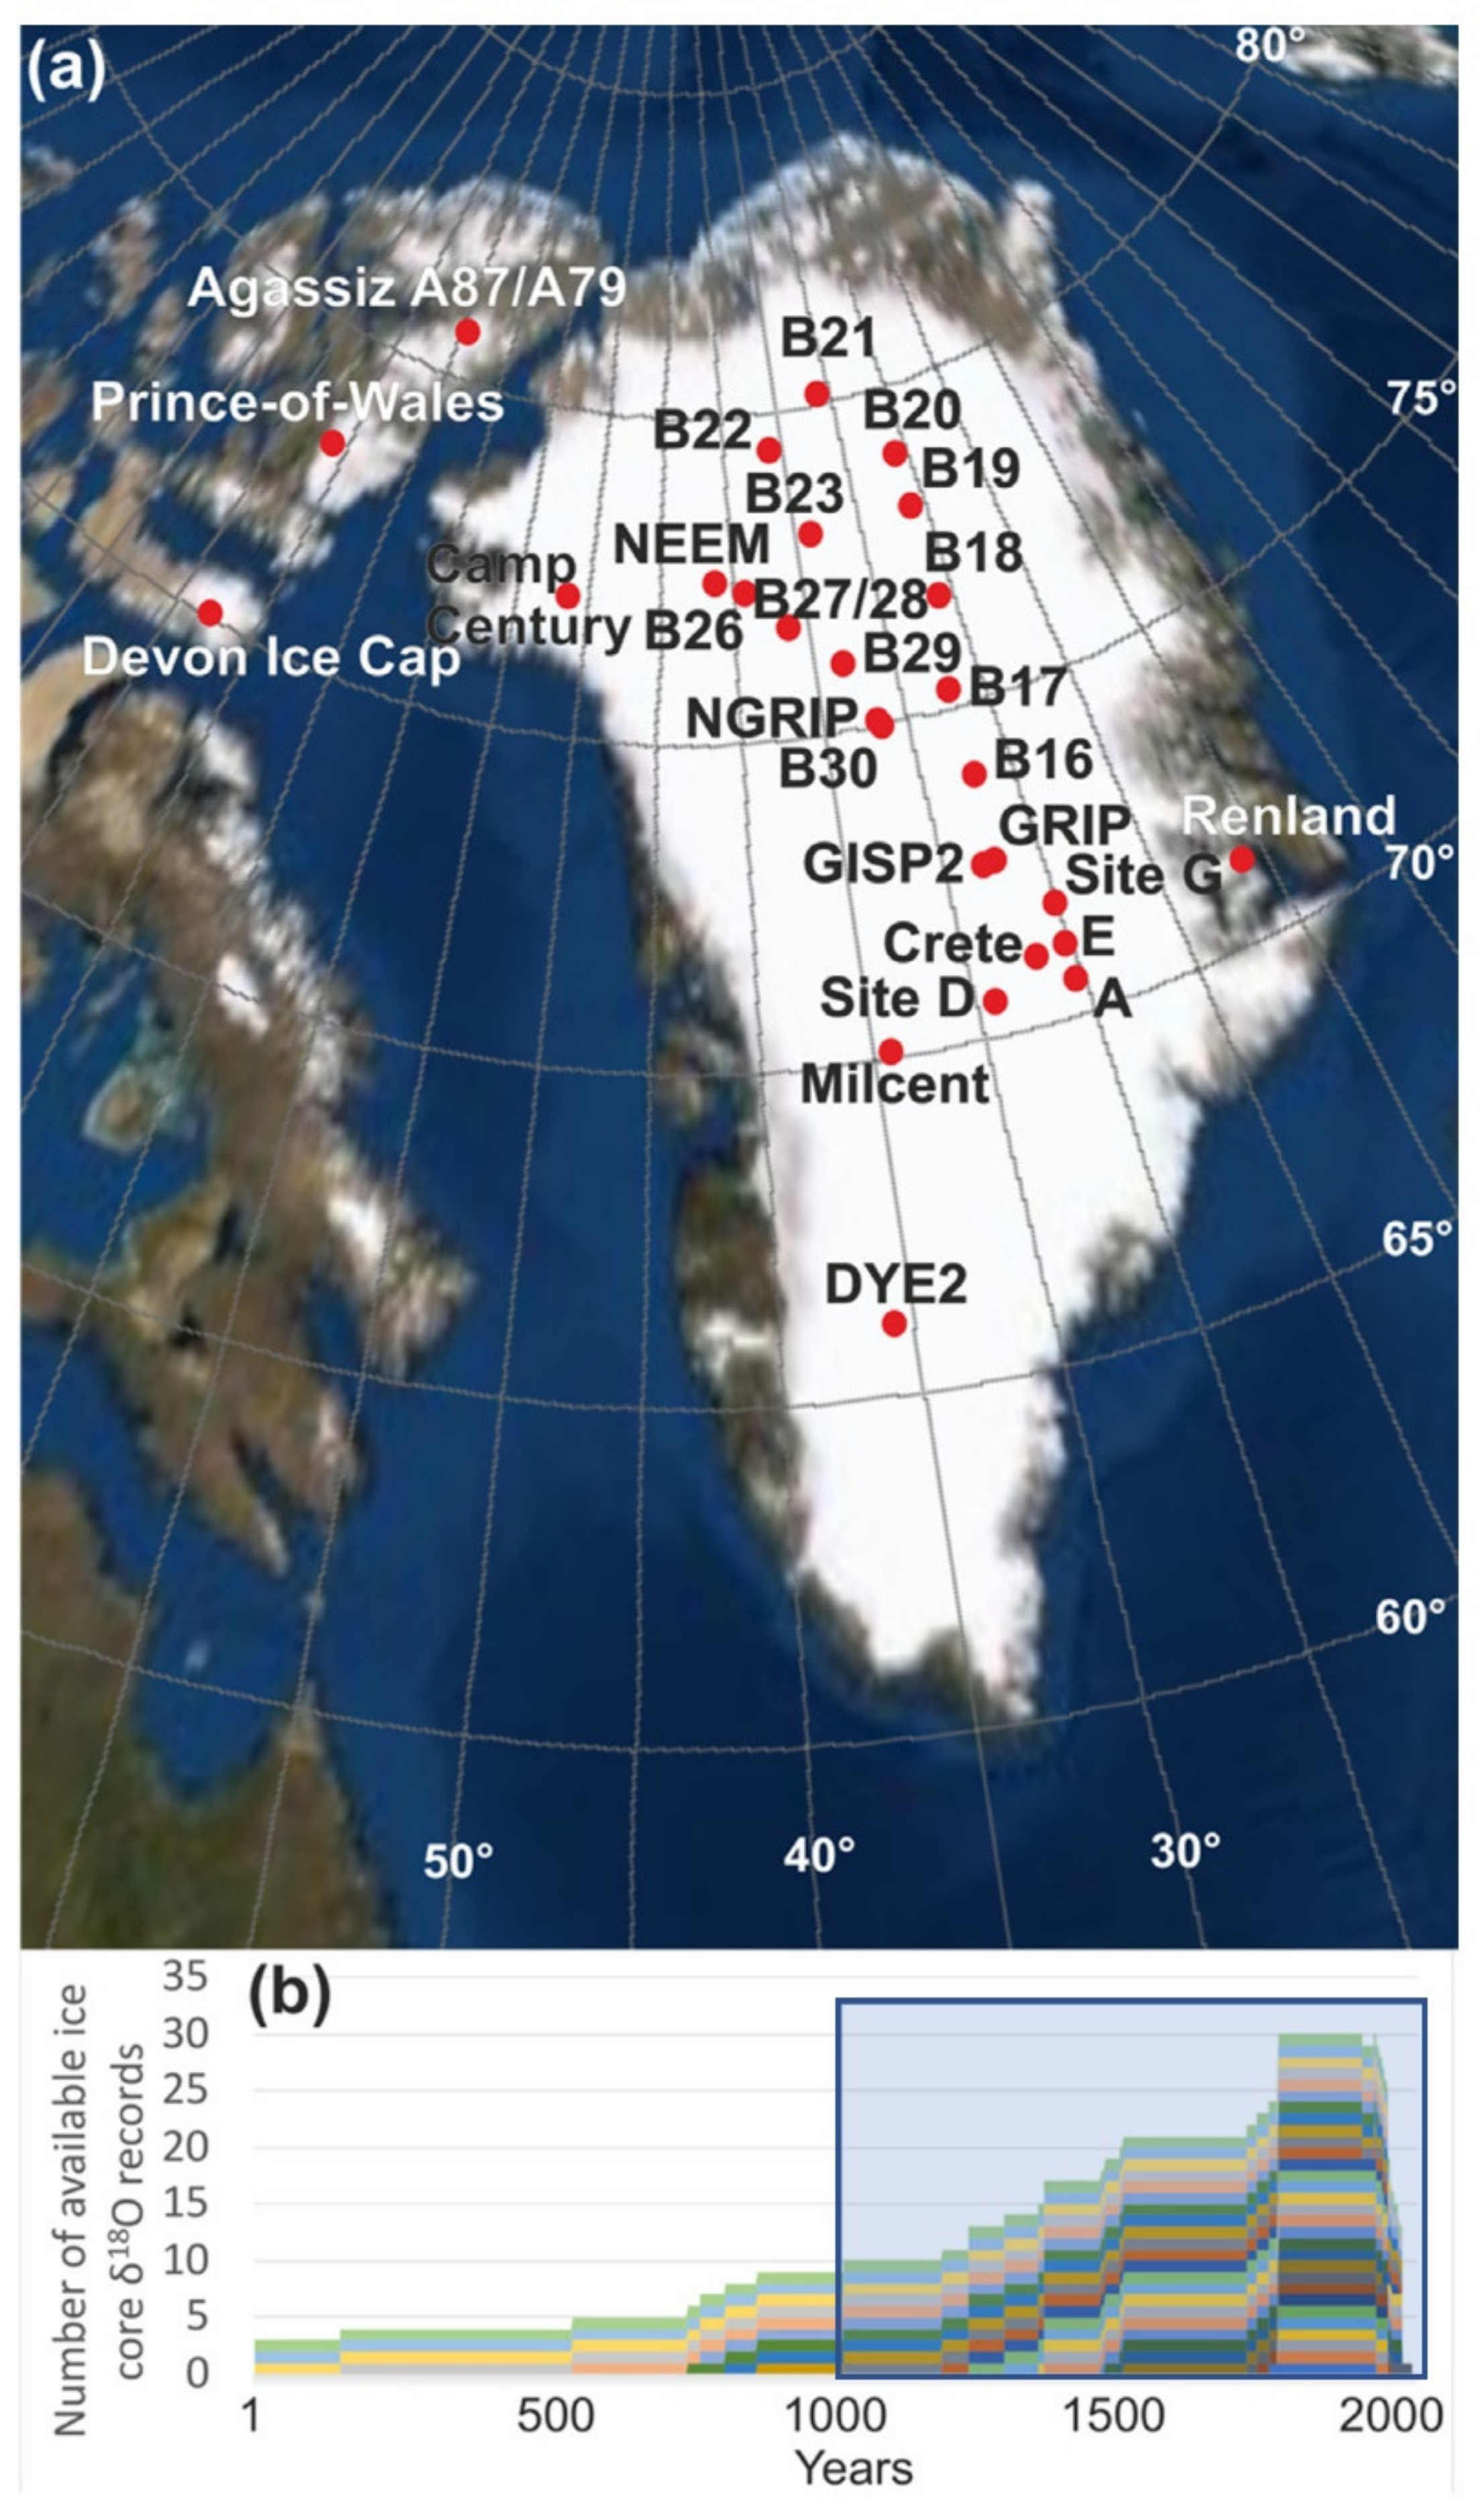
Ice core-derived δ18O records were obtained from the Iso2k database [23,24] utilizing all ice core-derived δ18O records with annual resolution poleward of 59° N from the GrIS and its vicinity (n = 30; Figure 1 and Figure S3). This improved spatial coverage compared with previous multi-ice core studies—e.g., Vinther et al. [11] and Ortega et al. [15]—helps to identify possible regional imprints inherent to the synoptic patterns influencing Greenland climate variability.
Ice core δ18O record availability steadily decreases from the 19th century backward (Figure 1). The five records available before 750 CE represent only the islands of the Canadian Arctic and the western part of Greenland. Therefore, our investigation is restricted to the past millennium, where available records () provided complete coverage for the study area (Figure 1) that overlap with instrumental climate observations with the density of ice core records being maximal, permitting to take advantage of the spatio-temporal structure of the isotopic variability [15]. The extended instrumental winter (DJF) North Atlantic Oscillation record (1865–2002 CE; [25]) calculated as the difference in mean monthly surface pressure anomalies between Iceland and the Azores was used as an observational benchmark hereafter referred to as NAO.
Regarding the pre-instrumental era, there are multiple NAO reconstructions available based on different methodologies and predictors; however, reconstructions relying on single or “too few” proxy locations have a high risk of insufficiently describing the NAO variability [26]. Therefore, in the present study, only those reconstructions were considered, which used an extensive proxy network and fully covered the past millennium, sufficiently represented by the studied ice core dataset. This criterion yielded two NAO reconstructions that represent large-scale modes of atmospheric variability aloft the ice sheet: a model-tested NAO reconstruction [27] covering 1049–1969 CE (NAO*), and a winter NAO index using a network of 97 Euro–Mediterranean tree-ring series covering 910–2018 CE (NAOmed; [28]). The NAO is significantly correlated with the Greenland blocking index [11,29] calculated from 500 hPa geopotential heights. Thus, for simplicity, the analyses are restricted to the NAO and consider it as a proxy for changes in atmospheric forcing on the ice sheet while noting that similar analysis may be performed using other climate variability indices.
Since some of the records lacked high-frequency variability in the sub-decadal range (Figure S3), a 10-year lowpass filter was applied to all the ice core records to achieve common variability. If this had not been conducted, the different spectral characteristics of the original ice core δ18O records would have required different parameter settings causing unnecessary difficulties. The filtering also increases the signal-to-noise ratio relative to the magnitude of the supposed changes, which aids the detectability of valid changepoints [30,31]. The same lowpass filter was applied to the other indices for consistency. The 10-yr low-passed time series were then centered and subjected to the linear model of the Bayesian changepoint algorithm of Ruggieri [32] (BCPa for short), an approach that can generate the posterior distribution on both the number and location of changepoints in a data set.
The changepoint analysis has been an active area of statistical research for many years, e.g., Scott and Knott [33]. In every case, the goal is to perform a statistical test to determine if a homogeneous model or a piecewise model provides a more appropriate fit to the data, and if piecewise, how many breaks are appropriate. If a piecewise model provides the more appropriate fit, then the point at which the model changes is known as a “changepoint”. The actual model used in each approach varies by application ranging from a constant model (which can be used to detect changes in the mean signal) to a more general regression model.
Applications of changepoint detection in a climate setting are numerous and include NAO [34], carbon dioxide concentrations [35], tropical cyclones [36], precipitation [37], storm intensity [38], temperature proxy records ([39]: Sect. 4.1. therein) and global surface temperatures [32], among others. The literature on changepoint models (generally) and their applications to climate data are vast, so a full review is beyond the scope of this paper.
We define the point at which the statistical properties of a model change as a “changepoint”. For example, when using a linear (e.g., trend) model, any change to the slope (, intercept (), or variance () in the time series indicates the presence of a changepoint. Ultimately, the goal is to fit a piecewise regression model to each time series. BCPa assumes that the parameters of the model for any two segments of the data are independent (i.e., a product partition model [40]). In this context, each segment of the data represents a different climate regime, and a “changepoint” represents the boundary between.
BCPa has three steps:
- Calculate the probability of the data given the model between any two time points, P(i,j). This represents all possible climate regimes (in terms of timing) in the data set;
- Using the probabilistic calculations from step (1) as building blocks, recursively piece together these segments, adding one changepoint at a time. Specifically, if we define Pk(j) to be the probability that the first j data points contain k changepoints, thenfor k = 1 to kmax, where P(v + 1, j) was calculated in step (1);
- Using Bayes’ rule, sample from the posterior distribution on the number and location of the changepoints, as well as the parameters of the model in each segment.
The specific parameters applied were as follows: minimum distance between the possible changepoints dmin= 10 steps (years in the present case), hyper parameter for the prior on the regression coefficients k0 = (0.001, 0.01), prior on the variance of the residuals, v0 = 1, σ0 = variance of each time series, the maximum number of changepoints kmax = 50, and the number of sampled solutions num.samp = 10,000.
The reader interested in a general overview of changepoint analysis is referred to Ruggieri [41], while those interested in a more technical derivation of BCPa are referred to Ruggieri [32] and SOM Sect. 1 (Figure S1).Those interested in the description of the specific parameters are referred to SOM Sect. 2 (Figure S2), while the software used is described in SOM Sect. 3.
A Bayesian approach to the changepoint problem provides a posterior distribution, i.e., uncertainty estimates, on the location of changepoints. Therefore, the obtained changepoint time series were passed through a 5-yr centralized rolling summary function in order to cumulate the probability dispersed between consecutive years. The use of this function assumes that the uncertainty in the location of a changepoint is less than 5 years. Allowing for a larger window could increase the overall probability of a changepoint (depending on how abrupt and how “obvious” the change is) in a certain region of the data. This cumulative probability is the probability of the changepoint(s) shown in the study. Only “practically certain” changepoints with a 5-yr sum probability >99% were considered in the evaluation.
In addition, since “paleoData_chronologyIntegrationTimeUncertainty” was determined as between “1 and 10” years in > 90% of the number of assessed ice cores, a 10-year window was considered when searching for coinciding changepoints. These coinciding changepoints were taken as a “changepoint horizon” if at least ~25% of the ice cores available at that time indicated a changepoint. Here, the assumption is that if changepoints are correlated, then they should occur at a (relatively) similar point in time. For example, if a changepoint centered in one ice core in the year 1921 with a 99.4% probability and a different ice core in 1929 with a 99.1%, then these were considered to fall into the same so-called changepoint horizon. It was also investigated how the ice cores representative of a changepoint horizon are clustered in space.
3. Results and Discussion
The main goal of the study was to reveal how concurrent changes in Greenland surface conditions and the NAO may have occurred synchronously over and beyond the instrumental era.
We began by describing the timing of the events associated with synchronous changes in the GrIS ice core δ18O records. These constitute four changepoint horizons over the last millennium centered at years 1933 (Figure 2), 1460, 1190, and 1085 CE (Figure 3) referred to hereinafter as CpH1933, CpH1460, CpH1190, and CpH1085, respectively. Out of these, the relatively most abundant was the CpH1190 with 40% of the available ice cores (ntotal = 10), indicating a changepoint at > 99% probability. Another 20% indicated a changepoint at >85% probability. Meanwhile, CpH1933 was indicated by the greatest number of ice cores (seven out of ntotal = 30). Five additional ice core δ18O records show a changepoint between 1928 and 1937 CE with a posterior probability > 90%, reinforcing the presence and spatial representativity of the CpH1933. These results are robust in terms of the chosen lowpass filter, as the same set of ice core δ18O changepoints were found using 13-yr filtering; 78% with the same probability (>99%) as in the case of the 10-yr lowpass, and 22% with a slightly lower probability (~95%).
The individual ice cores defining a changepoint horizon were clustered in space. These reflect the three major regions of the GrIS delineated based on a synoptic survey of precipitation and possible effects of orography on moving cyclones [42]. This regional division is used to describe the spatial pattern(s) of the CpHs. The most recent changepoint horizon found in the second quarter of the 20th century (CpH1933) is well represented by more than half of the ice core δ18O records from the Southern Region (Figure 2). The horizon from the mid-15th century (CpH1460) covers the North Central Region together with an additional ice core δ18O record from the Northern region (B21) (Figure 3b). Meanwhile, in the oldest horizons, CpH1190 and CpH1085, ice cores from the Central region were involved, accompanied by a core from the Ellesmere Island (A79; Figure 3c,d).
A single ice core (B19) located in the NE sector of the GrIS can be considered the “most responsive”, since it is in all CpHs (Figure 2b and Figure 3b–d). This is in line with the expectation that precipitation δ18O in this area is relatively more sensitive to changes in moisture uptake conditions compared with other parts of the island [43].
3.1. Common Changepoint in Ice Core δ18O and Atmospheric Circulation in the 1930s
The most recent changepoint horizon is centered in the year 1933 CE (CpH1933, Figure 2) and is the only one found since the beginning of the industrial era. This changepoint corresponds to the well-known sharp regime shift in atmospheric circulation across the Atlantic–Arctic sector, indicating the end of a generally colder era in Greenland [44]. This, in the more recent literature, is referred to as the “early 20th century warming” [45,46,47]. Taken together, concurrent changes in both the NAO and NAO* and in the ice core δ18O records mark a transition towards generally warmer Greenland conditions starting from the early 20th century up until the 1960s (Figure 2a). As for the ice cores, the 1933 horizon is defined by seven (probability > 99%) and five (probability > 90%) out of 30 cores across the GrIS (Figure 2b).
At CpH1933, the ice core δ18O records from the Southern Region show a unanimous positive shift, while the NAO shifts greatly from positive to negative (Figure 2). This is in harmony with simulations derived from an isotope-enabled general circulation model, where the negative NAO phase is accompanied by positive δ18O anomalies characterizing the complete southern region and West Central Greenland [15], and can be explained by the NAO’s influence on storm tracks [4,48]; thus on the moisture source regions and distillation pathways. Such fluctuations are expected to be reflected in the firn/ice δ18O signal representing the different sectors of the GrIS [43,49].
The dominant moisture source location is known to vary with the NAO phase across the GrIS most strongly for the northeastern and southeastern sectors of the GrIS. During the NAO+ phase, uptake locations are shifted to the Arctic region (north of 60° N), while in NAO– phase, more long-range moisture transport from the Atlantic (south of 50° N) was identified [43]. However, different regions of the GrIS experience distinct changes in the average moisture source locations, which is manifested in the stable isotopic signal of ice/firn. The strength and direction of this relationship vary across Greenland and its surroundings [15].
3.2. Common Changepoints in Ice Core δ18O and the NAO over the Past Millennium
Changepoint horizons prior to the instrumental era are also explored to elucidate the persistency of coupled changes in Greenland ice cores and the NAO. The mid-15th century horizon (CpH1460) was formed by 25% of the available ice core δ18O records (n = 4) (Figure 3b). At CpH1460, NAO* shows a recovery from a decadal negative excursion (Figure 3a). In the North and North Central Region of the GrIS, where the ice cores indicating the CpH1460 are located (Figure 3b), the moisture source region shifts from more distant to closer as a result of the NAO changing phase from negative to positive [43]. The timing of the CpH1460 matches the decadal shift in broad-scale moisture variability on both sides of the Atlantic, a shift that has also been linked to a negative NAO anomaly in the middle of the 15th century [50] associated with the start of the Little Ice Age. Moreover, this corresponds to a regime shift of atmospheric processes at centennial time scales, i.e., to the transition from a more probable NAO– epoch (1500–1800 CE) to a more probable NAO+ epoch (1200–1400 CE) [51]. Furthermore, CpH1460 is spatially distinct from CpH1933, as it is the only one showing changepoints in the northern GrIS.
In the penultimate documented horizon (CpH1190), 40% of the available ice core δ18O records show a changepoint at a rather common negative peak, which is followed by a multidecadal period of less variability with a relatively higher mean (Figure 3c). In the case of the earliest horizon (CpH1085), the time series of ice core δ18O show a common negative shift (Figure 3d). The two CpHs correspond closely to the modeled change in the multidecadal probabilistic distribution of NAO modes. The two pre-13th century changepoint horizons (CpH1190 and 1085) were also mirrored in the NAOmed reconstruction. The timing of the CpH1190 is in harmony with the change from more probable NAO+ epoch (1200–1400 CE) to more probable NAO– epoch (1100–1200 CE), and CpH1085 matches the transition from a more probable NAO− epoch, i.e., 1100–1200 CE, to a more probable NAO+ epoch, i.e., 1000–1100 CE [51].
The CpH1190 (Figure 3a,c) shows an opposite NAO phase change compared with the CpH1460 (Figure 3a,b), and hence the corresponding coupled changes in atmospheric circulation imprinted in ice core water stable isotopes [15,17,52] are likely to feature similarly contrasting patterns between the two CpHs.
The characteristic difference between the industrial and pre-industrial era changepoint is manifested in the spatial clustering of the corresponding ice cores in, basically, the south and north part of the GrIS. This divide is also mirrored in the dichotomic character of the modeled stable isotope maps of Greenland [15].
It should be noted that there were three additional changepoints detected in the NAO* time series besides the previously mentioned ones. One of these was found in the mid-19th century and two in the 12th century. The oldest of these, occurring in the mid-12th century, is the most noteworthy since it coincides with changepoints in the NAO (1147 CE) and both the Crete and GISP2 records (posterior probability > 99.5%), which are in relatively close vicinity ~150 km apart (Figure 1a). Although only two out of the ten available ice cores indicated a changepoint, which does not meet the 25% criteria of the study to be considered a CpH, this finding reinforces the systematic and spatially clustered response of Greenland ice core δ18O records to changes in the NAO. The proportion of ice cores showing a changepoint was lower for the other two NAO* changepoints, but still greater than zero in both cases.
4. Summary
This study shows the first joint assessment for detecting changepoint horizons in the ice core derived water stable isotope records with annual resolution available from the GrIS and its vicinity for the past millennium, and also explores if any coinciding abrupt changes exist in the dominant mode of large-scale atmospheric circulation in the North Atlantic Basin. The four detected changepoint horizons (centered at years 1933, 1460, 1190, and 1085 CE) were accompanied by changepoints in the North Atlantic Oscillation, confirming the hypothesized consistency of the link between large-scale atmospheric circulation regimes and Greenland ice/firn δ18O on a decadal time scale. The 20th century changepoint horizon detected in the Greenland ice/firn δ18O records was reflected in both the instrumental and the reconstructed NAO index time series, while the pre-instrumental changepoint horizons corresponded to the explicit change in the multidecadal probabilistic distribution of NAO [51] modes lending further credibility to the presented results.
Moreover, the spatial clustering of the ice core δ18O records indicates that a given changepoint horizon was found to have an encouraging consensus with subregions of the GrIS delineated with (isotope enabled) moisture source models. Specifically, the E–NE areas, which are recognized in the literature as the most sensitive and responsive to changes in moisture source regions, were found to be represented in all changepoint horizons.
Supplementary Materials
The following are available online at https://www.mdpi.com/article/10.3390/atmos13010093/s1, Supplementary online materials (SOM) Section S1: What is a changepoint?, Section S2: Explanation of the parameters applied in the analysis, Section S3: Software used. Figure S1: Simulated data with changepoints and an attempt to fit the data with a single function, either constant or linear, Figure S2: Simulated data with a “less-obvious” changepoint, Figure S3: Raw and 10-yr low-passed time series of the 30 ice core δ18O records assessed in the study gathered from the Iso2k database. Dating is mentioned in the supplementary material reference.
Author Contributions
Conceived and designed the study: Z.K., I.G.H. and D.T. Analyzed the data: I.G.H. with input from E.R. Produced the figures: I.G.H. Wrote the first draft: I.G.H., Z.K. and D.T., all authors took part in the finalization of the paper. We applied the FLAE approach for the sequence of authors; see https://doi.org/10.1371/journal.pbio.0050018 (accessed on 27 December 2021). All authors have read and agreed to the published version of the manuscript.
Funding
This research was funded by the Ministry of Human Capacities grant number: NTP-NFTÖ-20-B-0043 and is supported by the ÚNKP-20-3 New National Excellence Program of the Ministry for Innovation and Technology financed from the National Research, Development and Innovation Fund. The project was prepared with the professional support of the Doctoral Student Scholarship Program of the Co-operative Doctoral Program of the Ministry of Innovation and Technology financed from the National Research, Development and Innovation Fund.
Institutional Review Board Statement
Not applicable.
Informed Consent Statement
Not applicable.
Data Availability Statement
The data presented in this study are openly available in NOAA/WDS Paleoclimatology at https://doi.org/10.25921/57j8-vs18 (accessed on 27 December 2021), reference name ‘Iso2k Database Global Common Era Paleo-d18O and d2H Records’. Further data availability is referred to in the main text where necessary.
Conflicts of Interest
The authors declare no conflict of interest.
References
- Delhasse, A.; Fettweis, X.; Kittel, C.; Amory, C.; Agosta, C. Brief communication: Impact of the recent atmospheric circulation change in summer on the future surface mass balance of the Greenland Ice Sheet. Cryosphere 2018, 12, 3409–3418. [Google Scholar] [CrossRef] [Green Version]
- Hanna, E.; Jones, J.M.; Cappelen, J.; Mernild, S.H.; Wood, L.; Steffen, K.; Huybrechts, P. The influence of North Atlantic atmospheric and oceanic forcing effects on 1900–2010 Greenland summer climate and ice melt/runoff. Int. J. Climatol. 2013, 33, 862–880. [Google Scholar] [CrossRef]
- Ballinger, T.J.; Hanna, E.; Hall, R.J.; Carr, J.R.; Brasher, S.; Osterberg, E.C.; Cappelen, J.; Tedesco, M.; Ding, Q.; Mernild, S.H. The role of blocking circulation and emerging open water feedbacks on Greenland cold-season air temperature variability over the last century. Int. J. Climatol. 2021, 41, E2778–E2800. [Google Scholar] [CrossRef]
- Hurrell, J.W.; Kushnir, Y.; Ottersen, G.; Visbeck, M. An Overview of the North Atlantic Oscillation. In The North Atlantic Oscillation: Climatic Significance and Environmental Impact; American Geophysical Union: Washington, DC, USA, 2003; pp. 1–35. [Google Scholar]
- Wanner, H.; Brönnimann, S.; Casty, C.; Gyalistras, D.; Luterbacher, J.; Schmutz, C.; Stephenson, D.B.; Xoplaki, E. North Atlantic Oscillation—Concepts And Studies. Surv. Geophys. 2001, 22, 321–381. [Google Scholar] [CrossRef]
- Tedesco, M.; Fettweis, X. Unprecedented atmospheric conditions (1948–2019) drive the 2019 exceptional melting season over the Greenland ice sheet. Cryosphere 2020, 14, 1209–1223. [Google Scholar] [CrossRef] [Green Version]
- Hahn, L.C.; Storelvmo, T.; Hofer, S.; Parfitt, R.; Ummenhofer, C.C. Importance of Orography for Greenland Cloud and Melt Response to Atmospheric Blocking. J. Clim. 2020, 33, 4187–4206. [Google Scholar] [CrossRef] [Green Version]
- Bevis, M.; Harig, C.; Khan, S.A.; Brown, A.; Simons, F.J.; Willis, M.; Fettweis, X.; van den Broeke, M.R.; Madsen, F.B.; Kendrick, E.; et al. Accelerating changes in ice mass within Greenland, and the ice sheet’s sensitivity to atmospheric forcing. Proc. Natl. Acad. Sci. USA 2019, 116, 1934–1939. [Google Scholar] [CrossRef] [PubMed] [Green Version]
- Johnsen, S.J.; Clausen, H.B.; Dansgaard, W.; Fuhrer, K.; Gundestrup, N.; Hammer, C.U.; Iversen, P.; Jouzel, J.; Stauffer, B.; Steffensen, J.P. Irregular glacial interstadials recorded in a new Greenland ice core. Nature 1992, 359, 311–313. [Google Scholar] [CrossRef]
- Fischer, H.; Mieding, B. A 1000-year ice core record of interannual to multidecadal variations in atmospheric circulation over the North Atlantic. Clim. Dyn. 2005, 25, 65–74. [Google Scholar] [CrossRef] [Green Version]
- Vinther, B.M.; Jones, P.D.; Briffa, K.R.; Clausen, H.B.; Andersen, K.K.; Dahl-Jensen, D.; Johnsen, S.J. Climatic signals in multiple highly resolved stable isotope records from Greenland. Quat. Sci. Rev. 2010, 29, 522–538. [Google Scholar] [CrossRef]
- Steig, E.J. PALEOCLIMATOLOGY|Ice Cores. In Encyclopedia of Atmospheric Sciences; Holton, J.R., Ed.; Academic Press: Oxford, UK, 2003; pp. 1673–1680. [Google Scholar]
- Cappelen, J.; Laursen, E.; Jørgensen, P.; Kern-Hansen, C. DMI Monthly Climate Data Collection 1768–2010, Denmark, the Faroe Islands and Greenland; DMI Technical Report 11-05; DMI: Copenhagen, Denmark, 2011. [Google Scholar]
- Masson-Delmotte, V.; Kageyama, M.; Braconnot, P.; Charbit, S.; Krinner, G.; Ritz, C.; Guilyardi, E.; Jouzel, J.; Abe-Ouchi, A.; Crucifix, M.; et al. Past and future polar amplification of climate change: Climate model intercomparisons and ice-core constraints. Clim. Dyn. 2006, 26, 513–529. [Google Scholar] [CrossRef]
- Ortega, P.; Swingedouw, D.; Masson-Delmotte, V.; Risi, C.; Vinther, B.; Yiou, P.; Vautard, R.; Yoshimura, K. Characterizing atmospheric circulation signals in Greenland ice cores: Insights from a weather regime approach. Clim. Dyn. 2014, 43, 2585–2605. [Google Scholar] [CrossRef]
- Rimbu, N.; Lohmann, G. Decadal Variability in a Central Greenland High-Resolution Deuterium Isotope Record and Its Relationship to the Frequency of Daily Atmospheric Circulation Patterns from the North Atlantic Region. J. Clim. 2010, 23, 4608–4618. [Google Scholar] [CrossRef] [Green Version]
- Rimbu, N.; Lohmann, G. Winter and summer blocking variability in the North Atlantic region—evidence from long-term observational and proxy data from southwestern Greenland. Clim. Past 2011, 7, 543–555. [Google Scholar] [CrossRef] [Green Version]
- Thomas, E.R.; Wolff, E.W.; Mulvaney, R.; Johnsen, S.J.; Steffensen, J.P.; Arrowsmith, C. Anatomy of a Dansgaard-Oeschger warming transition: High-resolution analysis of the North Greenland Ice Core Project ice core. J. Geophys. Res. Atmos. 2009, 114. [Google Scholar] [CrossRef] [Green Version]
- Steffensen, J.P.; Andersen, K.K.; Bigler, M.; Clausen, H.B.; Dahl-Jensen, D.; Fischer, H.; Goto-Azuma, K.; Hansson, M.; Johnsen, S.J.; Jouzel, J.; et al. High-Resolution Greenland Ice Core Data Show Abrupt Climate Change Happens in Few Years. Science 2008, 321, 680–684. [Google Scholar] [CrossRef] [Green Version]
- Mosley-Thompson, E.; Readinger, C.R.; Craigmile, P.; Thompson, L.G.; Calder, C.A. Regional sensitivity of Greenland precipitation to NAO variability. Geophys. Res. Lett. 2005, 32. [Google Scholar] [CrossRef] [Green Version]
- Masson-Delmotte, V.; Schulz, M.; Abe-Ouchi, A.; Beer, J.; Ganopolski, A.; González Rouco, J.F.; Jansen, E.; Lambeck, K.; Luterbacher, J.; Naish, T.; et al. Information from Paleoclimate Archives. In Climate Change 2013: The Physical Science Basis. Contribution of Working Group I to the Fifth Assessment Report of the Intergovernmental Panel on Climate Change; Stocker, T.F., Qin, D., Plattner, G.-K., Tignor, M., Allen, S.K., Boschung, J., Nauels, A., Xia, Y., Bex, V., Midgley, P.M., Eds.; Cambridge University Press: Cambridge, UK; New York, NY, USA, 2013; p. 1552. [Google Scholar]
- Charles, C.D.; Rind, D.; Jouzel, J.; Koster, R.D.; Fairbanks, R.G. Glacial-Interglacial Changes in Moisture Sources for Greenland: Influences on the Ice Core Record of Climate. Science 1994, 263, 508–511. [Google Scholar] [CrossRef]
- Konecky, B.L.; McKay, N.P.; Churakova, O.V.; Comas-Bru, L.; Dassié, E.P.; DeLong, K.L.; Falster, G.M.; Fischer, M.J.; Jones, M.D.; Jonkers, L.; et al. The Iso2k Database: A global compilation of Paleo-δ18O and δ2H records to aid understanding of Common Era climate. Earth Syst. Sci. Data. 2020, 12, 2261–2288. [Google Scholar] [CrossRef]
- McKay, N.; Konecky, B. Iso2k Database Global Common Era Paleo-δ18O and δ2H Records. 2020. Available online: https://www.ncei.noaa.gov/metadata/geoportal/rest/metadata/item/noaa-recon-29593/html (accessed on 4 June 2021).
- Jones, P.D.; Jonsson, T.; Wheeler, D. Extension to the North Atlantic oscillation using early instrumental pressure observations from Gibraltar and south-west Iceland. Int. J. Climatol. 1997, 17, 1433–1450. [Google Scholar] [CrossRef]
- Lehner, F.; Raible, C.C.; Stocker, T.F. Testing the robustness of a precipitation proxy-based North Atlantic Oscillation reconstruction. Quat. Sci. Rev. 2012, 45, 85–94. [Google Scholar] [CrossRef]
- Ortega, P.; Lehner, F.; Swingedouw, D.; Masson-Delmotte, V.; Raible, C.C.; Casado, M.; Yiou, P. A model-tested North Atlantic Oscillation reconstruction for the past millennium. Nature 2015, 523, 71–74. [Google Scholar] [CrossRef]
- Cook, E.R.; Kushnir, Y.; Smerdon, J.E.; Williams, A.P.; Anchukaitis, K.J.; Wahl, E.R. A Euro-Mediterranean tree-ring reconstruction of the winter NAO index since 910 C.E. Clim. Dyn. 2019, 53, 1567–1580. [Google Scholar] [CrossRef]
- Hanna, E.; Cropper, T.E.; Hall, R.J.; Cappelen, J. Greenland Blocking Index 1851–2015: A regional climate change signal. Int. J. Climatol. 2016, 36, 4847–4861. [Google Scholar] [CrossRef] [Green Version]
- Ruggieri, E. A pruned recursive solution to the multiple change point problem. Comput. Stat. 2018, 33, 1017–1045. [Google Scholar] [CrossRef]
- Ruggieri, E.; Antonellis, M. An exact approach to Bayesian sequential change point detection. Comput. Stat. Data Anal. 2016, 97, 71–86. [Google Scholar] [CrossRef] [Green Version]
- Ruggieri, E. A Bayesian approach to detecting change points in climatic records. Int. J. Climatol. 2013, 33, 520–528. [Google Scholar] [CrossRef]
- Scott, A.J.; Knott, M. A Cluster Analysis Method for Grouping Means in the Analysis of Variance. Biometrics 1974, 30, 507–512. [Google Scholar] [CrossRef] [Green Version]
- Schwing, F.B.; Jiang, J.; Mendelssohn, R. Coherency of multi-scale abrupt changes between the NAO, NPI, and PDO. Geophys. Res. Lett. 2003, 30. [Google Scholar] [CrossRef] [Green Version]
- Lund, R.; Reeves, J. Detection of Undocumented Changepoints: A Revision of the Two-Phase Regression Model. J. Clim. 2002, 15, 2547–2554. [Google Scholar] [CrossRef]
- Robbins, M.W.; Lund, R.B.; Gallagher, C.M.; Lu, Q. Changepoints in the North Atlantic Tropical Cyclone Record. J. Am. Stat. Assoc. 2011, 106, 89–99. [Google Scholar] [CrossRef]
- Tomé, A.R.; Miranda, P.M.A. Piecewise linear fitting and trend changing points of climate parameters. Geophys. Res. Lett. 2004, 31, 19100. [Google Scholar] [CrossRef] [Green Version]
- Gregow, H.; Laaksonen, A.; Alper, M.E. Increasing large scale windstorm damage in Western, Central and Northern European forests, 1951–2010. Sci. Rep. 2017, 7, 46397. [Google Scholar] [CrossRef] [PubMed] [Green Version]
- Topál, D.; Matyasovszky, I.; Kern, Z.; Hatvani, I.G. Detecting breakpoints in artificially modified- and real-life time series using three state-of-the-art methods. Open Geosci. 2016, 8, 78. [Google Scholar] [CrossRef] [Green Version]
- Barry, D.; Hartigan, J.A. A Bayesian Analysis for Change Point Problems. J. Am. Stat. Assoc. 1993, 88, 309–319. [Google Scholar]
- Ruggieri, E.; Yu, M.; Qiang, R. Change Point Models: What are They and Why Do We Need Them? Undergrad. Math. Its Appl. 2020, 41, 61–80. [Google Scholar]
- Chen, Q.-s.; Bromwich, D.H.; Bai, L. Precipitation over Greenland Retrieved by a Dynamic Method and Its Relation to Cyclonic Activity. J. Clim. 1997, 10, 839–870. [Google Scholar] [CrossRef]
- Sodemann, H.; Schwierz, C.; Wernli, H. Interannual variability of Greenland winter precipitation sources: Lagrangian moisture diagnostic and North Atlantic Oscillation influence. J. Geophys. Res. Atmos. 2008, 113. [Google Scholar] [CrossRef] [Green Version]
- Rogers, J.C. Atmospheric Circulation Changes Associated with the Warming over the Northern North Atlantic in the 1920s. J. Appl. Meteorol. Climatol. 1985, 24, 1303–1310. [Google Scholar] [CrossRef]
- Hegerl, G.C.; Brönnimann, S.; Schurer, A.; Cowan, T. The early 20th century warming: Anomalies, causes, and consequences. WIREs Clim. Chang. 2018, 9, e522. [Google Scholar] [CrossRef] [Green Version]
- Svendsen, L.; Keenlyside, N.; Bethke, I.; Gao, Y.; Omrani, N.-E. Pacific contribution to the early twentieth-century warming in the Arctic. Nat. Clim. Chang. 2018, 8, 793–797. [Google Scholar] [CrossRef]
- Tokinaga, H.; Xie, S.-P.; Mukougawa, H. Early 20th-century Arctic warming intensified by Pacific and Atlantic multidecadal variability. Proc. Natl. Acad. Sci. USA 2017, 114, 6227–6232. [Google Scholar] [CrossRef] [Green Version]
- Hanna, E.; Mernild, S.H.; Cappelen, J.; Steffen, K. Recent warming in Greenland in a long-term instrumental (1881–2012) climatic context: I. Evaluation of surface air temperature records. Environ. Res. Lett. 2012, 7, 045404. [Google Scholar] [CrossRef]
- Rimbu, N.; Lohmann, G.; Werner, M.; Ionita, M. Links between central Greenland stable isotopes, blocking and extreme climate variability over Europe at decadal to multidecadal time scales. Clim. Dyn. 2017, 49, 649–663. [Google Scholar] [CrossRef] [Green Version]
- Anchukaitis, K.J.; Cook, E.R.; Cook, B.I.; Pearl, J.; D’Arrigo, R.; Wilson, R. Coupled Modes of North Atlantic Ocean-Atmosphere Variability and the Onset of the Little Ice Age. Geophys. Res. Lett. 2019, 46, 12417–12426. [Google Scholar] [CrossRef] [Green Version]
- Franke, J.G.; Werner, J.P.; Donner, R.V. Reconstructing Late Holocene North Atlantic atmospheric circulation changes using functional paleoclimate networks. Clim. Past 2017, 13, 1593–1608. [Google Scholar] [CrossRef] [Green Version]
- Rimbu, N.; Ionita, M.; Lohmann, G. A Synoptic Scale Perspective on Greenland Ice Core δ18O Variability and Related Teleconnection Patterns. Atmosphere 2021, 12, 294. [Google Scholar] [CrossRef]
Figure 1.
Study area and data availability. Location (a) and temporal availability (b) of the ice cores from Greenland and the neighboring islands for the last 2 millennia from the Iso2k database. The different colors represent the different ice cores. The blue rectangle indicates the focus time period.

Figure 2.
Time series of the studied ice core δ18O records and the instrumental NAO and NAO* reconstruction indices since 1800 CE with the most recent changepoint horizon centered at year 1933 (orange vertical rectangle) (a) and the location of the ice cores providing information from 1933 (b). The filled circles refer to the cores that indicated a changepoint in 1933, while the empty circles mark the ice cores not showing a changepoint. The codes next to the circles represent their “siteName” in the Iso2k database [23,24]. The colors of the markers in (b) match a corresponding time series in (a). The red arrow indicates a changepoint in the NAO* with a posterior probability above 99% that did not match any changepoint in the ice core δ18O records.

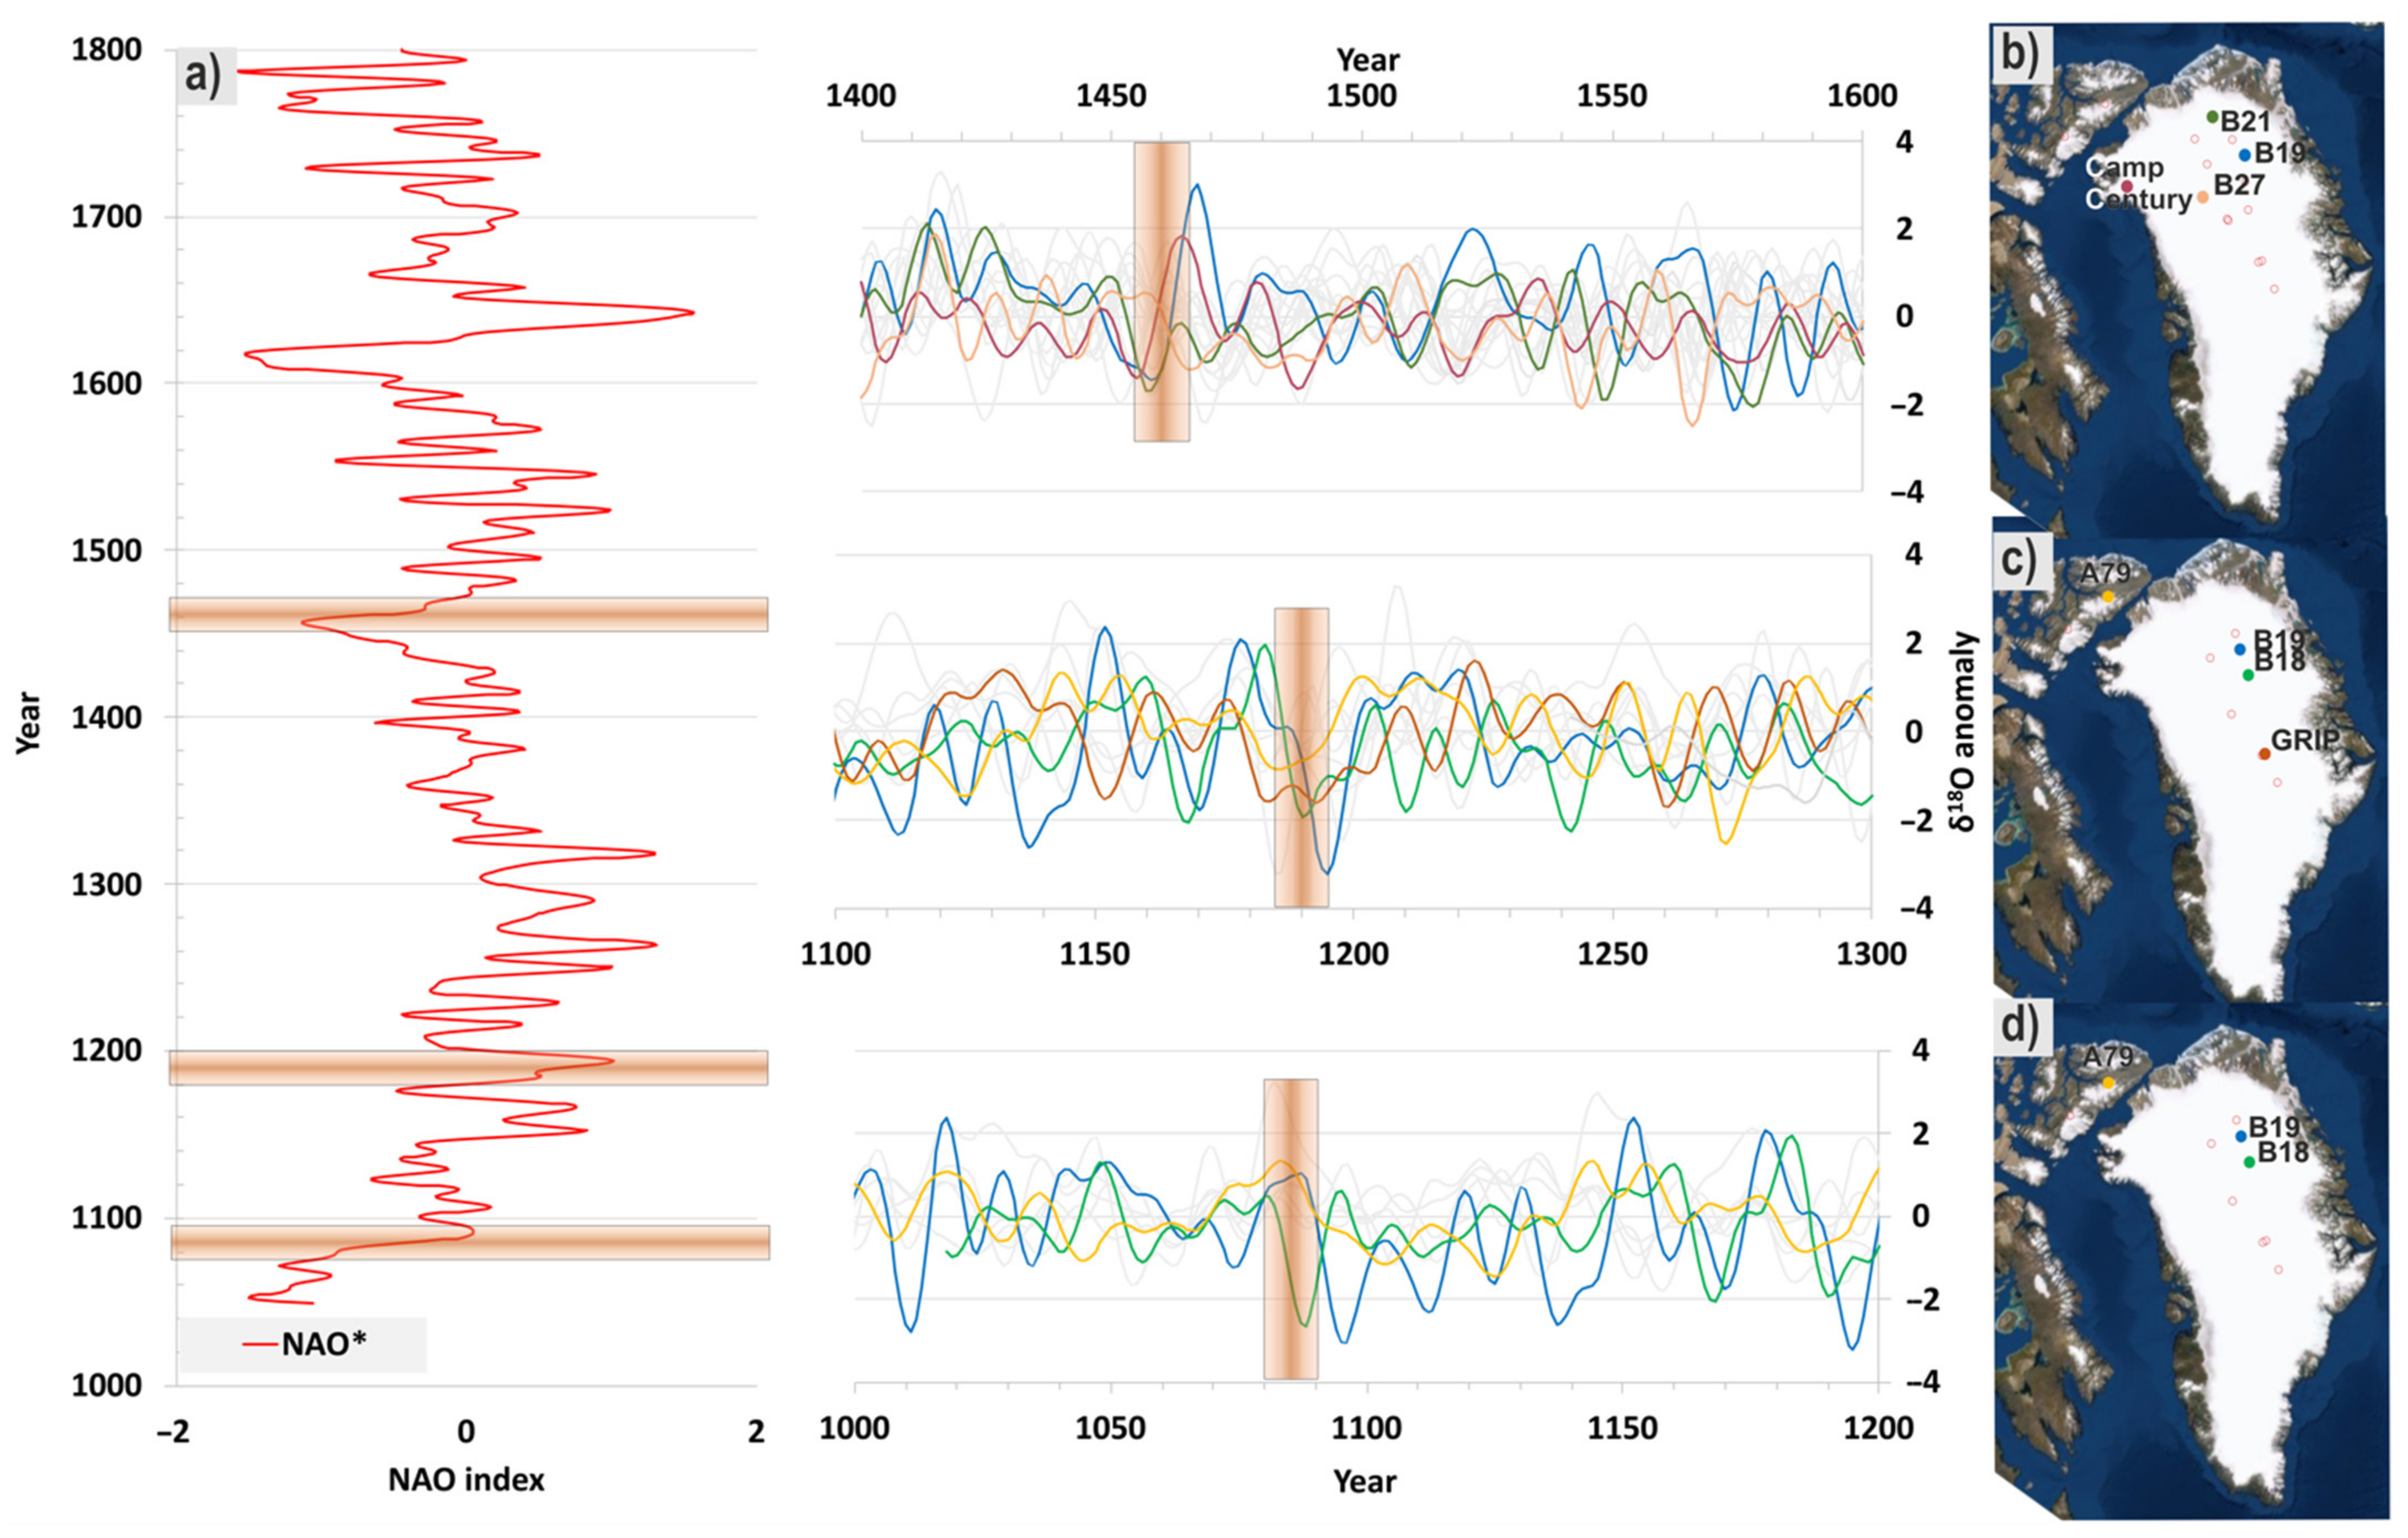
Figure 3.
Pre-industrial changepoint horizons in the (a) reconstructed NAO (NAO*) time series and in the ice cores centering in years (b) 1460, (c) 1190, and (d) 1085 CE. The orange horizontal (a) and vertical (b) rectangles mark the CpHs. The maps next to the time series show the ice cores, which provided information at the time of the given CpH. The empty circles on the map mark the ice cores providing information from the time of the given CpH but not indicating a changepoint. The filled circles indicate a changepoint, and their colors match a corresponding time series (a). The code next to the circles represents their “siteName” in the Iso2k database [23,24].

Publisher’s Note: MDPI stays neutral with regard to jurisdictional claims in published maps and institutional affiliations. |
© 2022 by the authors. Licensee MDPI, Basel, Switzerland. This article is an open access article distributed under the terms and conditions of the Creative Commons Attribution (CC BY) license (https://creativecommons.org/licenses/by/4.0/).
Share and Cite
MDPI and ACS Style
Hatvani, I.G.; Topál, D.; Ruggieri, E.; Kern, Z. Concurrent Changepoints in Greenland Ice Core δ18O Records and the North Atlantic Oscillation over the Past Millennium. Atmosphere 2022, 13, 93. https://doi.org/10.3390/atmos13010093
AMA Style
Hatvani IG, Topál D, Ruggieri E, Kern Z. Concurrent Changepoints in Greenland Ice Core δ18O Records and the North Atlantic Oscillation over the Past Millennium. Atmosphere. 2022; 13(1):93. https://doi.org/10.3390/atmos13010093
Chicago/Turabian StyleHatvani, István Gábor, Dániel Topál, Eric Ruggieri, and Zoltán Kern. 2022. "Concurrent Changepoints in Greenland Ice Core δ18O Records and the North Atlantic Oscillation over the Past Millennium" Atmosphere 13, no. 1: 93. https://doi.org/10.3390/atmos13010093
Note that from the first issue of 2016, this journal uses article numbers instead of page numbers. See further details here.