
Multi-Scale Spatiotemporal Variations and Drivers of PM2.5 in Beijing-Tianjin-Hebei from 2015 to 2020

1
State Key Laboratory of Loess and Quaternary Geology, Institute of Earth Environment, Chinese Academy of Sciences, Xi’an 710061, China
2
University of Chinese Academy of Sciences, Beijing 100049, China
3
School of Geography and Resources, Guizhou Education University, Guiyang 550018, China
4
Guizhou Provincial Key Laboratory of Geographic State Monitoring, Guiyang 550018, China
5
School of Management, Chongqing University of Technology, Chongqing 400054, China
*
Author to whom correspondence should be addressed.
Atmosphere 2022, 13(12), 1993; https://doi.org/10.3390/atmos13121993
Submission received: 4 November 2022
/
Revised: 22 November 2022
/
Accepted: 25 November 2022
/
Published: 28 November 2022
(This article belongs to the Section Air Quality)
Abstract
:Understanding the spatiotemporal heterogeneity and complex drivers of PM2.5 concentration variations has important scientific value for sustainable urban development. Taking Beijing-Tianjin-Hebei (BTH) as the research area, and using spatial analysis techniques and wavelet methods to explore the spatiotemporal heterogeneity of variations in PM2.5 concentrations, the research shows that in the past six years (2015–2020), the PM2.5 concentrations in the BTH area have a downward trend, and the mean is 59.41 μg/m3; however, the distribution pattern of PM2.5 pollution has changed very little, and the concentration in the south and southwest is still generally high. The continuous wavelet transform revealed that the PM2.5 concentrations in the study area have a short period of about a week to a half a month and a long period dominated by annual cycle. The effect of a single meteorological factor on PM2.5 concentrations is weak, but this effect has obvious spatial differentiation characteristics from coastal to inland and has a double-sided effect due to different geographical locations. The wavelet transform coherence revealed that dewpoint temperature at 2 m (TED), meridional wind at 10 m (WV) and air temperature at 2 m (TEM) are important single meteorological factors that affect the variation of PM2.5 concentrations. The multiple wavelet coherence reveals that in scenarios where two meteorological factors are combined, the combination of TED-mean wind speed (WS) is the best combination to explain the variation in PM2.5 concentrations (AWC = 0.77, PASC = 41%). In the combination of three meteorological factors, TEM-WV-WS explained the variations of PM2.5 concentrations in the BTH region to the greatest degree (AWC = 0.89, PASC = 45%). Finally, the research shows that the variations of PM2.5 concentrations in the BTH region can be better explained by a combination of 2–3 meteorological factors, among which temperature and wind are the key meteorological factors. This research will provide a new window for the multi-scale variation characteristics and multi-factor control relationship of PM2.5 concentrations in the BTH region and provide a new insight for the prevention and control of air pollution.
1. Introduction
PM2.5 has caused huge damage to human health and sustainable socio-economic development in various regions of the world and in China [1,2,3]. Focusing on China in East Asia, China is the largest developing country in the world. In the past few decades, the rapid development of energy-intensive industries has led to a series of environmental problems, including serious air pollution [4]. Air pollution in China has brought huge economic losses and horrific environmental damage [5]. The problem of particle pollution with a diameter of less than or equal to 2.5 microns has received extensive attention in China and may cause damage from the human respiratory system to the nervous system, by exposure to the PM2.5 concentrations [6,7]. Effective control of PM2.5 will bring considerable economic benefits to densely populated and heavily polluted areas [8]. In addition to economic benefits, the environmental benefits brought by mitigating PM2.5 pollution are also huge. Although the industrial activities slowed down due to strict policies in the early stage, the improvement of air quality in the later stage will help promote the urban economy, and healthy development and ecological protection between regions [9].
Exploring the factors of changes in PM2.5 concentration has important guiding significance for the prevention and control of air pollution, and previous studies have shown that changes in PM2.5 concentrations will be affected by other atmospheric pollutants and meteorological conditions [10]. PM10, SO2, NO2, CO and O3 in air pollutants are often confirmed to have a close relationship with PM2.5 in some statistical models, but the relationship between them is very complex in physical and chemical mechanisms [11]. For meteorological factors, the air temperature, precipitation, air pressure, relative humidity and wind component are more considered [12,13]. Beijing-Tianjin-Hebei is an important industrial area and one of the largest urban agglomerations in northern China; it has a significant radiating effect on the surrounding economic development, and its strategic location is very important [14]. However, the past industrial activities of Beijing-Tianjin-Hebei have brought serious air pollution problems; in the 2019 national air quality assessment, Beijing-Tianjin-Hebei accounted for 16 of the 20 worst cities [15]. Therefore, PM2.5 is widely regarded as the primary pollutant in the Beijing-Tianjin-Hebei region [16]. Previous studies have shown that changes in PM2.5 concentrations in the Beijing-Tianjin-Hebei region are significantly affected by factors such as temperature and relative humidity [17]. In addition, there are related studies that suggest that technological innovation, foreign trade investment and environmental supervision and other methods or policies are very conducive to the reduction of PM2.5 concentration in the region [18].
Although there is no lack of research on the relationship between Beijing-Tianjin-Hebei PM2.5 concentrations and various environmental factors, most of the results are based on averaging [19], which may ignore the spatial heterogeneity of the influence of environmental factors on PM2.5 concentrations to a certain degree. Even the impact of the same influencing factor on PM2.5 may show a completely opposite relationship in different geographical location [20,21]. Additionally, the previous studies used simple correlation statistics to describe the overall relationship between a single meteorological factor and PM2.5 concentrations [22]. However, in the real surface geographical environment, the change of PM2.5 concentrations will be controlled by multiple influencing factors at the same time, and this relationship may change with time. In addition, the relationship between PM2.5 and influencing factors may vary greatly on different time scales [23]. Finally, we also found that many studies focus on the evolution of PM2.5 over a short period of time such as months and weeks, and it is undoubtedly very valuable to analyze the evolution of PM2.5 over a longer period of time [24]. Understanding the multi-scale evolution process of PM2.5 concentrations is of great significance for short-term and long-term air pollution control, to control the economic cost of air pollution control more flexibly. Understanding the multi-scale characteristics of PM2.5 concentration changes and the real state of multi-factor control will be more conducive to reducing PM2.5 pollution and improving air quality globally and regionally. At the same time, addressing the scientific problem that PM2.5 pollution is driven by multiple environmental factors has very important practical significance for future air pollution control work. Of course, this will also help us to deepen our understanding of the evolution pattern of PM2.5 concentrations to make more accurate predictions.
2. Materials and Methods
2.1. Study Area
The Beijing-Tianjin-Hebei (BTH) region is in the North China Plain of China (Figure 1), with a warm temperate continental monsoon climate. It consists of 11 municipal-level administrative districts including Beijing, Tianjin, Hebei, Shijiazhuang, Tangshan and Cangzhou, with a total area of 218,000 km2; it is densely populated with a population of over 100 million [25]. The BTH region is the cultural and political center of China, as well as the economic center of northern China. This region plays an important role in radiating and driving the economic development of northern China and even the entire northern region [26]. Additionally, due to the special geographical location of BTH in the core region of the Bohai Rim and Northeast Asia, it has had a profound impact on China and even the world. The industrial structure of the BTH area is dominated by the secondary industry, and the energy consumption is mainly coal [27]. There is also the Beijing-Tianjin-Tangshan Industrial Base, which is one of the four major industrial bases in China. Due to the constraints of terrain conditions and unfavorable meteorological conditions, the serious air pollution problems caused by a large amount of energy consumption emissions often arouse the attention of the government, news media and other sectors of society [28,29]. The economic cost of environmental problems such as air pollution caused by the heavy industry-led industrial structure in the Beijing-Tianjin-Hebei region is huge [30].
2.2. Data Sources
The PM2.5 concentration data used in this research was acquired from China National Environmental Monitoring Centre (http://www.cnemc.cn, accessed on 20 July 2022). We selected data from a total of 67 ground air quality monitoring stations in the BTH region (Figure 1). The temporal resolution is hourly, and the time range is from 2015 to 2020. For a small number of missing values, we applied the mean imputation to ensure the integrity and continuity of the PM2.5 concentration data. In general, the PM2.5 concentration will be affected by meteorological factors, and compared with the station meteorological data with uneven spatial distribution, it is more reasonable and scientific to use grid meteorological reanalysis data [31]. Therefore, we extracted the hourly ERA5 land reanalysis meteorological data of the same period through the Google Earth Engine (GEE) remote sensing big data platform, and the spatial resolution of ERA5 data is 11,132 m, about 0.1° [32]. Specific meteorological elements include air temperature at 2 m (TEM, unit = °C), dewpoint temperature at 2 m (TED, unit = °C), zonal wind at 10 m (WU, unit = m/s), meridional wind at 10 m (WV, unit = m/s), surface pressure (PRS, unit = hPa), total precipitation (PRE, unit = m), and relative humidity (REH, unit = %), which is further calculated according to TEM and TED, and mean wind speed (WS, unit = m/s) is obtained by vector synthesis of WU and WV.
2.3. Methods
2.3.1. Kriging Interpolation & Spatial Spearman
Different from the deterministic spatial interpolation method, the Kriging interpolation as an advanced geo-statistical method (Geo-statistical/Stochastic) was originally used in geological research, and is the best linear unbiased estimator [33,34], because it can comprehensively capture the spatial structure characteristics of the distribution of geographical elements, and can obtain relatively accurate results [35]. Ordinarily Kriging is a variant of Kriging and is the most basic version, which is currently used in air quality research [36,37]. Therefore, this study uses the Ordinary Kriging (OK) method to analyze the spatial differentiation feature of PM2.5 concentrations in the study area and the spearman spatial correlation between meteorological factors.
2.3.2. Wavelet Transform & Wavelet Transform Coherence
The continuous wavelet transform (WT) is used to reveal the multi-scale periodic signal of a single time series signal in the time frequency space (period). The morlet wavelet base function is widely used because of its unique advantages. The basic form is shown in the following formula, where and indicate the dimensionless frequency and time, respectively, and = 6 [38,39,40,41].
According to the description of [39], when we give a time series xn with time steps δt, WT is defined as the convolution of xn with the scaled and normalized wavelet, and its mathematical expression formula is as follows:
Similar to a band-pass filter, WT can only decompose one single time sequence into time frequency space. Therefore, if we want to analyze the co-movement relationship of two series in time-frequency space, we need to expand it to analyze the relationship between two time series [42]. The wavelet transform coherence (WTC) is then developed from WT, and its application value in the aspect of geoscience is also increasing [41,43,44]. As follows, indicates wavelet squared coherence and its value ranges from zero to one, S indicates smoothing factor, and represent the wavelet transform (WT) of the X and Y time sequence respectively, and indicates the cross wavelet transform [41,44].
2.3.3. Multiple Wavelet Coherence
The changes in the real surface geographical environments and geographical elements are always disturbed by multiple external factors at the same time, so a more powerful tool is needed to quantify the degree and direction of the influence of these factors, which is the limitation of the WTC. In a previous research, multiple wavelet transform coherence is obtained by extending the WTC [43], this allows an additional factor to be added to analyze the compound effect of the combination of predictors on the target. Then, the updated version of multiple wavelet coherence (MWC) was gradually developed and improved, which fully demonstrates the excellent performance of this method in revealing the multi-factor control of geographic elements [45,46]. However, considering that the significance threshold will increase with the increase of predictor variables, the selection of variables should be carefully considered in the concrete process [45,47]. The formula for MWC is as follows [45,48]:
Here, , , represents the smoothed cross-wavelet spectrum matrix between the predictor variable X (and itself) and the response variable Y, and is the complex conjugate of . We will consider factor combinations with actual physical connections to reveal the multiple factor control of PM2.5 concentration. Finally, the confidence level at 95% of wavelet methods were obtained by Monte Carlo simulation [39,45].
3. Results
3.1. Temporal Evolution of PM2.5 in the BTH from 2015 to 2020
Figure 2a–c is the temporal evolution process, average diurnal variation characteristics and periodic characteristics of PM2.5 concentration in the Beijing-Tianjin-Hebei (BTH) from 2015 to 2020, respectively. From Figure 2a, the average concentrations of PM2.5 in the BTH region in the past six years is 59.41 μg/m3, showing a downward trend. PM2.5 pollution in winter and summer has been significantly alleviated, and the most prominent winter PM2.5 pollution problem has been effectively controlled in the last three years. The higher PM2.5 concentrations in the winter of 2015 and 2016 contrasted sharply with the lower PM2.5 concentrations in the 2017–2020 winters. From the perspective of national environmental protection policies, the BTH region is one of the key areas in the “Three-Year Action Plan for Winning the Blue Sky War” issued by the China’s State Council at the end of June 2018. Therefore, it is inferred that the significant reduction of PM2.5 concentrations in the BTH region in the past three years is partly attributable to the direct contribution of government decision-making, and the government has made necessary efforts to improve the overall air quality level. Figure 2b shows the average diurnal variation of PM2.5 concentrations in the Beijing-Tianjin-Hebei region over the past six years. From Figure 2b, the PM2.5 concentration in August-September is the lowest throughout the day, especially around 15:00 in the afternoon, April-August is the second lowest, while in winter, the PM2.5 concentration is the highest throughout the day. Previous related simulation studies have shown that an average of 46% of the severe PM2.5 pollution in the Beijing-Tianjin-Hebei region in winter comes from coal burning [49]. In the diurnal variation pattern, PM2.5 concentrations were higher in the morning and evening, and relatively low in the afternoon, which is also the time when the temperature is relatively high in the day. In general, the high temperature promotes the movement of airflow, which diffuses and dilutes the PM2.5 concentrations. Figure 2c reveals that the PM2.5 concentrations in the BTH region in the last six years has two periods; one is a short and discontinuous period dominated by seven days and 15 days, and the other is dominated by continuous annual long period, and the color bar of Figure 2c represents the dimensionless energy spectrum.
3.2. Annual Spatial Variation of PM2.5 in the BTH from 2015–2020
Figure 3 reveals the annual mean variations of PM2.5 concentrations in the Beijing-Tianjin-Hebei (BTH) region from 2015 to 2020 from the spatial scale. In general, the PM2.5 concentration in this region has dropped significantly in the past six years. The highest concentration had dropped from 108.13 μg/m3 in 2015 to 60.25 μg/m3 in 2020, and the concentration nearly doubled. The minimum concentration shows a downward trend overall, but the decline was smaller. The highest value of PM2.5 concentrations in 2015 and 2016 both exceeded 100 μg/m3, and gradually improved in the following four years. From the perspective of change difference, the area extending from the central part of Beijing-Tianjin-Hebei to the southwest has the largest decline. This is also the area with the most serious pollution, namely Beijing and Baoding, Langfang, and eastern Shijiazhuang in the southwest of Hebei province, Hengshui, western Cangzhou, Xingtai and Handan. In the northern region and Tianjin, the decline was weaker. The spatial distribution range of higher concentrations of PM2.5 in 2018 was significantly smaller than that of other years, which may be a manifestation of the government’s response to environmental protection policies. Finally, although the PM2.5 concentrations in the Beijing-Tianjin-Hebei region have shown an overall downward trend in the past six years, the spatial distribution pattern of higher and lower concentrations is relatively stable, and the southern and southwestern parts of the region have long been affected by more severe PM2.5 pollution, while the level of pollution in the northern part of BTH region is generally lower. This contrasting pollution pattern is inseparable from the industrial layout in the study area.
3.3. Seasonal Spatial Change of PM2.5 in the BTH Region
Figure 4 reveals the seasonal distribution of PM2.5 concentrations in the BTH region from 2015 to 2020. The highest PM2.5 concentration in winter (131.0 μg/m3) was more than twice that in spring and summer (64.29 μg/m3 and 53.55 μg/m3). Winter is often faced with intensified anthropogenic activities and unfavorable meteorological conditions. In the environment of coal heating and slow airflow, winter is faced with more serious air pollution events than other seasons [50]. In addition, the degree of heavy pollution gradually deepens from autumn to winter. The increase in PM2.5 concentration caused by burning straw in autumn may aggravate the frequency of serious pollution events in winter if it is not dissipated in time. Serious PM2.5 pollution in winter is mainly distributed in Baoding, Shijiazhuang, Xingtai, Handan, Hengshui and other surrounding areas in the southwest of the BTH region, with a small and concentrated area of influence. Compared to winter, the distribution range of PM2.5 in spring has expanded, but the concentration is lower than that in winter. This may be due to the dust in spring bringing PM2.5 pollution, accompanied by relatively strong PM2.5 pollution, and under the function of wind, the concentration of PM2.5 is blown away and diluted, and its spatial distribution is expanded. During the transition from autumn to winter, under the stimulation of unfavorable meteorological conditions, the concentration may accumulate to aggravate PM2.5 pollution in winter. Overall, the degree of PM2.5 pollution in the four seasons increased from north to south, and the lower PM2.5 concentrations were basically distributed in the northern part of the BTH. The pollution was heavier and concentrated in autumn and winter, and the pollution in spring and summer was relatively high, and spring and summer is lighter, but the distribution area is larger.
3.4. Overall Correlation between PM2.5 and Meteorological Factors
First, we used the Spearman correlation analysis to analyze the relationship between PM2.5 concentration and meteorological elements (p < 0.05) on an hour scale. As shown in Figure 5, the correlation between meteorological elements and PM2.5 concentration is weak overall. PRS, REH and WV show a positive correlation with PM2.5 with correlation coefficients of 0.054, 0.093 and 0.098, respectively, while PRE, TEM, TED, WS and WU negatively correlated with PM2.5 concentrations. The correlation analysis between PM2.5 and meteorological conditions on different temporal resolution data may be different. Results based on hourly data show a generally weak link between meteorological conditions and PM2.5.
Second, meteorological conditions have different effects on the changes of PM2.5 concentrations in different geographical locations; therefore, to explore the spatial heterogeneity of meteorological conditions on PM2.5 concentrations more comprehensively, we further analyzed the spatial relationship between each meteorological factor and PM2.5 concentrations. As shown in Figure 6, the impact of meteorological factors on PM2.5 concentrations in the Beijing-Tianjin-Hebei region has obvious spatial differentiation characteristics, and their impact on PM2.5 concentrations can be either positive or negative. The positive correlations between PRE, TEM, TED, WV and REH and PM2.5 concentrations are mainly distributed in the northern and northwestern parts of the Beijing-Tianjin-Hebei region, while negative correlations are shown in the southern region. PRS and PM2.5 showed a positive correlation in the southwest of Beijing-Tianjin-Hebei, but a negative correlation in the northeast. The relationship between WS and WU and PM2.5 is similar in spatial distribution shape, showing a positive correlation in the eastern part of the Beijing-Tianjin-Hebei region, and a negative correlation in the western part. WV is an important factor affecting the change of PM2.5 concentrations in the BTH area. The positive effect of WV on PM2.5 is mainly distributed in the northwest of Beijing, including the whole region. In general, the impact of meteorological factors on PM2.5 concentrations varies by geographic location. Compared with the correlation analysis using the entire one-dimensional sequence in most studies, the correlation analysis on the two-dimensional spatial scale will be more beneficial for us to understand the meteorological heterogeneity affecting PM2.5 concentration.
3.5. Wavelet Transform Coherence between PM2.5 and Single Factor
Using wavelet transform coherence (WTC) can better capture the multi-scale dependence of meteorological factors and PM2.5 concentrations on time frequency space (Figure 7 and Table 1). Meanwhile, we use average wavelet coherence (AWC) and percent area of significant coherence (PASC) to assess the degree of this interaction [45]. Figure 7 shows the wavelet coherence results between a single meteorological factor and PM2.5. Overall, the multi-scale correlation between meteorological factors and PM2.5 is mainly reflected in the larger cycle scale (~annual cycle), consistent with previous findings in China’s Yangtze River Delta region [36]. In this research, WTC revealed the most important meteorological factor affecting the change of PM2.5 concentrations in the BTH region is TED, whose AWC and PASC on all time scales are 0.54 and 34%, respectively. In addition, WV is also a key meteorological factor that affects the change of PM2.5 concentrations, its AWC and PASC are 0.55 and 32%, respectively. TEM is the third key factor affecting the change of PM2.5 concentrations in the BTH region, and its AWC and PASC are 0.51 and 29%, respectively. There is a positive correlation between TED and PM2.5 on short and medium time scales, and the increase of TED on this timescale may lead to a concomitant increase in PM2.5 concentrations, but on longer time scales (~annual cycle) shows an anti-phase relationship, indicating that a long-term increase in TED may lead to a decrease in PM2.5 concentrations. The WV of north-south flow is consistent with the change of PM2.5 concentration on short and medium time scales, and its AWC and PASC are second only to TED, which are 0.55 and 32%, respectively, but show the opposite behavior on one-year time scales, which indicate that the strengthening of WV in the short term may lead to an increase in PM2.5 concentration, while the long-term effect is to dilute the PM2.5 concentration. Judging from the low altitude in the southeastern part of the Beijing-Tianjin-Hebei region and the relatively high-altitude terrain on the other three sides, as well as the characteristics of WV flow trajectory, WV increased PM2.5 concentration in the short and medium term, but with the continuous effect of WV, this will alleviate the regional PM2.5 pollution. The AWC of PRE and WU and PM2.5 were 0.39 and 0.40, respectively, and the PASC was 16% and 15%, respectively. Although the effects of PRE and WU on PM2.5 concentrations are comparable, their phase relationships on long-term scales are opposite, with WU being in phase with PM2.5 concentrations on a one-year time scale, while PRE has a negative impact on PM2.5 on a one-year time scale. Another important wind element is wind speed(WS), and the dilution effect of wind on PM2.5 concentration mainly occurs on shorter time scales [36]; WS in the Beijing-Tianjin-Hebei region is negatively correlated with PM2.5 on a shorter time scale, which is beneficial to alleviating PM2.5 pollution. TEM is the third important meteorological factor affecting the change of PM2.5 concentration in the BTH area, and its AWC and PASC are 0.51 and 29%, respectively. The negative correlation between TEM and PM2.5 mainly occurs on a longer period scale, which has the same performance characteristics as other meteorological factors, and is consistent with previous research results [36]. Based on this, it is speculated that a long-term appropriate TEM may lead to a decrease in PM2.5 concentration, while a shorter time scale may not necessarily improve the pollution level of PM2.5, and there may be other natural and human factors affecting PM2.5 change in concentration. Both TEM and REH may lead to the increase of PM2.5 concentrations on medium and short time scales, which may be affected by the climate characteristics of the rain and heat in the study area during the same period, and the high temperature and high humidity weather environment is more conducive to the accumulation of fine particles, resulting in PM2.5 pollution. The positive correlation between PRS and PM2.5 concentration mainly exists on longer time scales; PM2.5 pollution may be aggravated by the increase of PRS on this time scale, but it cannot be arbitrarily assumed that the two have a simple linear relationship. Finally, we observe from Figure 7 that WV, TED, TEM and REH are all significantly positively correlated with PM2.5 concentrations on short and medium time scales; therefore, it is not sufficient to consider only a single factor to explain the driving factors of changes in PM2.5 concentrations in the BTH region. In summary, meteorological conditions are changing rapidly, and the influence of a single meteorological condition on the change of PM2.5 concentrations mainly exists on a large time scale. The impact of complex interactions between meteorological conditions on PM2.5 concentrations requires further analysis. Black and thick lines indicate a 95% significance level against red noise, a thin line indicates the cone of influence (COI), arrows indicate a phase relationship, an arrow pointed right indicates in-phase and pointed left indicates anti-phase, and the colorbar indicates wavelet squared coherence.
3.6. Multiple Wavelet Coherence between PM2.5 and Meteorological Factors
It is well known that the changes of PM2.5 concentrations cannot be affected by only a single meteorological factor, so we further used the multiple wavelet coherence (MWC) method to analyze the joint control of the combination of two and three meteorological factors on the PM2.5 concentrations in the BTH region (Figure 8 and Table 2). First, in the binary combination of meteorological factors, the MWC revealed that the most important combination affecting the variation of PM2.5 concentrations in the BTH area is TED-WS, whose AWC and PASC are 0.77 and 41%, respectively, which indicate that the TED and WS are the most important combination. The combination has the strongest explanation for the changes in PM2.5 concentrations in the BTH region on all time scales. Secondly, the combination of WS-TEM also explained the variation of PM2.5 concentration in the study area to a certain extent, and its AWC and PASC were 0.76 and 40%, respectively. Previous studies have also shown that PM2.5 concentrations in northern China are largely controlled by temperature and wind [51]. In contrast, the combination of PRE-WU has the weakest explanation for the change in PM2.5 concentrations in the study area, as its AWC is only 0.63, and PASC is only 18%. Finally, under the three scenarios of the combination of three meteorological elements, we found that the combination of TEM-WV-WS can best explain the variation of PM2.5 concentration in the study area on all time scales (AWC = 0.89, PASC = 45%). Under the combination of WV-TEM, a new combination formed by adding WS (TEM-WV-WS), its AWC increased by 0.13 and PASC increased by 8%, which more profoundly explained that the PM2.5 concentrations in the study area were affected by multiple meteorological factors, which also shows that wind and temperature have a very important effect on PM2.5 concentrations in typical areas of northern China.
4. Discussion
In this research, the PM2.5 concentrations in the BTH area show a downward trend in the last six years, especially since 2018, and has remained at a relatively low level, which is closely related to environmental protection policy implemented by the government. However, the spatial distribution pattern of PM2.5 pollution in the study area has changed less in the last six years; this stable distribution pattern is largely affected by geographical location, industrial layout and population distribution and, at the same time, frequent unfavorable meteorological conditions have increased pollution levels [52]. In addition, we used the Ordinary Kriging method in ArcGIS and the wavelet method to analyze the spatiotemporal heterogeneity and multi-scale periodic characteristics of PM2.5 concentrations in the Beijing-Tianjin-Hebei region in the last six years, but there are some limitations. The Ordinary Kriging method is the most basic geostatistical method, and there are other variants. For example, the Empirical Bayesian Kriging method (EBK) is a more advanced technique that can be considered. The second is regarding the MWC; although the multi-factor control of PM2.5 can be found by combining different meteorological factors, the problem faced is the combination and introduction of more factors that may directly lead to an increase in the difficulty of PM2.5 physical and chemical interpretability and serious collinearity problem. Therefore, it requires filtering out some redundant variable combinations from the physical and chemical mechanism, which is why we did not analyze the relationship between PM2.5 and other air pollutants (e.g., PM10, SO2, NO2, O3, CO), because statistical analysis cannot completely present the complex physical and chemical mechanisms among air pollutants. On the contrary, different from the interaction of air pollutants, the impact of meteorological conditions on changes in PM2.5 concentrations is relatively easier to understand, and at least part of the noise caused by human activities can be eliminated effectively, which allows us to more clearly explore the fact that variations of PM2.5 concentrations are simultaneously driven by multiple meteorological factors. This is consistent with our original goal of untangling the fact that PM2.5 concentrations are controlled by multiple meteorological conditions.
5. Conclusions
The spatiotemporal evolution characteristics and multi-scale relationship of PM2.5 concentrations were explored using the collected meteorological data from 67 air quality monitoring stations in the Beijing-Tianjin-Hebei region from 2015 to 2020, and the ERA5 reanalysis meteorological data during the same period. In the past six years, the concentration of PM2.5 in the Beijing-Tianjin-Hebei region has shown an obvious downward trend, but the overall distribution pattern has changed little. PM2.5 concentrations in the Beijing-Tianjin-Hebei region have a short intermittent period of weekly and half a month and a long continuous period dominated by an annual period. The relationship between meteorological factors and PM2.5 is generally weak and has a two-sided influence in hour scale and shows obvious spatial differentiation from coastal to inland. The WTC reveal that the time scale dependence of meteorological elements and PM2.5 was mainly reflected in longer periods. TED, WV and TEM are three very important meteorological factors that affect the change of PM2.5 concentration in the BTH area, explaining 34%, 32% and 29% of the variation in PM2.5 concentration in this area, respectively. In the combination of the two meteorological conditions, TED-WS was the most important factor to explain the variation of PM2.5 concentrations in the study area (AWC = 0.77, PASC = 41%). Meanwhile, the combination of WS and TEM is also noteworthy (AWC = 0.76, PASC = 40%). In the combination of three meteorological conditions, TEM-WV-WS explained the reasons for the variation of PM2.5 concentration in the study area to the greatest extent (AWC = 0.89, PASC = 45%). Both the WTC and MWC indicate that variations in PM2.5 concentrations in the BTH region are largely controlled by temperature and wind, this also shows that, to a certain extent, the changes of PM2.5 concentrations in the study area is controlled by multiple meteorological factors.
Author Contributions
Conceptualization, S.L. and N.L.; software, N.L.; formal analysis, S.L. and N.L.; writing—original draft preparation, N.L.; writing—review and editing, S.L. and F.Z.; visualization, N.L. All authors have read and agreed to the published version of the manuscript.
Funding
The research was supported by the National Natural Science Foundation of China (41861035) and the Science and Technology Foundation of Guizhou Province (Qiankehe Zhicheng [2018] 2776).
Institutional Review Board Statement
Not applicable.
Informed Consent Statement
Not applicable.
Data Availability Statement
The PM2.5 concentration data and meteorological data is available at (http://www.cnemc.cn, accessed on 20 July 2022) and Google Earth Engine (ERA5-Land Hourly Dataset), respectively.
Conflicts of Interest
The authors declare no conflict of interest.
References
- Etchie, T.O.; Sivanesan, S.; Adewuyi, G.O.; Krishnamurthi, K.; Rao, P.S.; Etchie, A.T.; Pillarisetti, A.; Arora, N.K.; Smith, K.R. The health burden and economic costs averted by ambient PM2.5 pollution reductions in Nagpur, India. Environ. Int. 2017, 102, 145–156. [Google Scholar] [CrossRef] [PubMed] [Green Version]
- Rao, S.; Chirkov, V.; Dentener, F.; Van Dingenen, R.; Pachauri, S.; Purohit, P.; Amann, M.; Heyes, C.; Kinney, P.; Kolp, P.; et al. Environmental Modeling and Methods for Estimation of the Global Health Impacts of Air Pollution. Environ. Model. Assess. 2012, 17, 613–622. [Google Scholar] [CrossRef]
- Wu, J.S.; Zhu, J.; Li, W.F.; Xu, D.; Liu, J.Z. Estimation of the PM2.5 health effects in China during 2000–2011. Environ. Sci. Pollut. Res. 2017, 24, 10695–10707. [Google Scholar] [CrossRef]
- Lu, X.; Zhang, S.J.; Xing, J.; Wang, Y.J.; Chen, W.H.; Ding, D.; Wu, Y.; Wang, S.X.; Duan, L.; Hao, J.M. Progress of Air Pollution Control in China and Its Challenges and Opportunities in the Ecological Civilization Era. Engineering 2020, 6, 1423–1431. [Google Scholar] [CrossRef]
- Gu, Y.; Wong, T.W.; Law, C.K.; Dong, G.H.; Ho, K.F.; Yang, Y.; Yim, S.H.L. Impacts of sectoral emissions in China and the implications: Air quality, public health, crop production, and economic costs. Environ. Res. Lett. 2018, 13, 084008. [Google Scholar] [CrossRef]
- Xing, Y.F.; Xu, Y.H.; Shi, M.H.; Lian, Y.X. The impact of PM2.5 on the human respiratory system. J. Thorac. Dis. 2016, 8, E69–E74. [Google Scholar] [CrossRef]
- Kim, H.; Kim, W.H.; Kim, Y.Y.; Park, H.Y. Air Pollution and Central Nervous System Disease: A Review of the Impact of Fine Particulate Matter on Neurological Disorders. Front. Public Health 2020, 8, 575330. [Google Scholar] [CrossRef]
- Zhou, Z.; Tan, Z.B.; Yu, X.H.; Zhang, R.T.; Wei, Y.M.; Zhang, M.J.; Sun, H.X.; Meng, J.; Mi, Z.F. The health benefits and economic effects of cooperative PM2.5 control: A cost-effectiveness game model. J. Clean. Prod. 2019, 228, 1572–1585. [Google Scholar] [CrossRef]
- Zhang, H.F.; Hu, J.; Qi, Y.X.; Li, C.L.; Chen, J.M.; Wang, X.M.; He, J.W.; Wang, S.X.; Hao, J.M.; Zhang, L.L.; et al. Emission characterization, environmental impact, and control measure of PM2.5 emitted from agricultural crop residue burning in China. J. Clean Prod. 2017, 149, 629–635. [Google Scholar] [CrossRef]
- Yang, H.M.; Peng, Q.; Zhou, J.; Song, G.J.; Gong, X.Q. The unidirectional causality influence of factors on PM2.5 in Shenyang city of China. Sci. Rep. 2020, 10, 8403. [Google Scholar] [CrossRef]
- Chen, Y.C.; Zang, L.; Du, W.; Xu, D.; Shen, G.F.; Zhang, Q.; Zou, Q.L.; Chen, J.Y.; Zhao, M.R.; Yao, D.F. Ambient air pollution of particles and gas pollutants, and the predicted health risks from long-term exposure to PM2.5 in Zhejiang province, China. Environ. Sci. Pollut. Res. 2018, 25, 23833–23844. [Google Scholar] [CrossRef] [PubMed]
- Huang, F.F.; Li, X.; Wang, C.; Xu, Q.; Wang, W.; Luo, Y.X.; Tao, L.X.; Gao, Q.; Guo, J.; Chen, S.P.; et al. PM2.5 Spatiotemporal Variations and the Relationship with Meteorological Factors during 2013–2014 in Beijing, China. PLoS ONE 2015, 10, e0141642. [Google Scholar] [CrossRef]
- Yang, Q.Q.; Yuan, Q.Q.; Li, T.W.; Shen, H.F.; Zhang, L.P. The Relationships between PM2.5 and Meteorological Factors in China: Seasonal and Regional Variations. Int. J. Environ. Res. Public Health 2017, 14, 1510. [Google Scholar] [CrossRef] [PubMed] [Green Version]
- Kang, L.; Ma, L. Expansion of Industrial Parks in the Beijing-Tianjin-Hebei Urban Agglomeration: A Spatial Analysis. Land 2021, 10, 1118. [Google Scholar] [CrossRef]
- Xiao, C.C.; Zhou, J.B.; Wang, X.; Zhang, S.M. Industrial agglomeration and air pollution: A new perspective from enterprises in Atmospheric Pollution Transmission Channel Cities (APTCC) of Beijing-Tianjin-Hebei and its surrounding areas, China. PLoS ONE 2021, 16, e0255036. [Google Scholar] [CrossRef]
- Zhao, M.L.; Liu, F.Y.; Song, Y.J.; Geng, J.B. Impact of Air Pollution Regulation and Technological Investment on Sustainable Development of Green Economy in Eastern China: Empirical Analysis with Panel Data Approach. Sustainability 2020, 12, 3073. [Google Scholar] [CrossRef]
- Wang, S.X.; Gao, J.B.; Guo, L.H.; Nie, X.J.; Xiao, X.M. Meteorological Influences on Spatiotemporal Variation of PM2.5 Concentrations in Atmospheric Pollution Transmission Channel Cities of the Beijing-Tianjin-Hebei Region, China. Int. J. Environ. Res. Public Health 2022, 19, 1607. [Google Scholar] [CrossRef]
- Li, Q.Y.; Li, X.C.; Li, H.T. Factors Influencing PM2.5 Concentrations in the Beijing-Tianjin-Hebei Urban Agglomeration Using a Geographical and Temporal Weighted Regression Model. Atmosphere 2022, 13, 407. [Google Scholar] [CrossRef]
- Liu, H.; Fang, C.; Huang, J.; Zhu, X.; Wang, Z. The spatial-temporal characteristics and influencing factors of air pollution in Beijing-Tianjin-Hebei urban agglomeration. J. Geogr. Sci. 2018, 73, 177–191. [Google Scholar] [CrossRef]
- Chen, Z.Y.; Chen, D.L.; Zhao, C.F.; Kwan, M.P.; Cai, J.; Zhuang, Y.; Zhao, B.; Wang, X.Y.; Chen, B.; Yang, J.; et al. Influence of meteorological conditions on PM2.5 concentrations across China: A review of methodology and mechanism. Environ. Int. 2020, 139, 105558. [Google Scholar] [CrossRef]
- Zhang, H.; Yuan, H.O.; Liu, X.H.; Yu, J.Y.; Jiao, Y.L. Impact of synoptic weather patterns on 24 h-average PM2.5 concentrations in the North China Plain during 2013–2017. Sci. Total Environ. 2018, 627, 200–210. [Google Scholar] [CrossRef] [PubMed]
- Tian, D.Y.; Fan, J.H.; Jin, H.B.; Mao, H.C.; Geng, D.; Hou, S.G.; Zhang, P.; Zhang, Y.F. Characteristic and Spatiotemporal Variation of Air Pollution in Northern China Based on Correlation Analysis and Clustering Analysis of Five Air Pollutants. J. Geophys. Res.-Atmos. 2020, 125, e2019JD031931. [Google Scholar] [CrossRef]
- Zhang, X.X.; Xu, H.D.; Liang, D. Spatiotemporal variations and connections of single and multiple meteorological factors on PM2.5 concentrations in Xi’an, China. Atmos. Environ. 2022, 275, 119015. [Google Scholar] [CrossRef]
- Zhang, H.Y.; Cheng, S.Y.; Li, J.B.; Yao, S.; Wang, X.Q. Investigating the aerosol mass and chemical components characteristics and feedback effects on the meteorological factors in the Beijing-Tianjin-Hebei region, China. Environ. Pollut. 2019, 244, 495–502. [Google Scholar] [CrossRef] [PubMed]
- Xu, J.H.; Wang, X.S.; Zhang, S.Q. Risk-based air pollutants management at regional levels. Environ. Sci. Policy 2013, 25, 167–175. [Google Scholar] [CrossRef]
- Yan, D.; Lei, Y.L.; Shi, Y.K.; Zhu, Q.; Li, L.; Zhang, Z. Evolution of the spatiotemporal pattern of PM2.5 concentrations in China—A case study from the Beijing-Tianjin-Hebei region. Atmos. Environ. 2018, 183, 225–233. [Google Scholar] [CrossRef] [Green Version]
- Zhang, J.; Zheng, Y.N. The flexibility pathways for integrating renewable energy into China’s coal dominated power system: The case of Beijing-Tianjin-Hebei Region. J. Clean. Prod. 2020, 245, 118925. [Google Scholar] [CrossRef]
- Yang, X.H.; Xiao, D.P.; Bai, H.Z.; Tang, J.Z.; Wang, W. Spatiotemporal Distributions of PM2.5 Concentrations in the Beijing-Tianjin-Hebei Region from 2013 to 2020. Front. Environ. Sci. 2022, 10, 842237. [Google Scholar] [CrossRef]
- Lv, B.L.; Hu, Y.T.; Chang, H.H.; Russell, A.G.; Cai, J.; Xu, B.; Bai, Y.Q. Daily estimation of ground-level PM2.5 concentrations at 4 km resolution over Beijing-Tianjin-Hebei by fusing MODIS AOD and ground observations. Sci. Total Environ. 2017, 580, 235–244. [Google Scholar] [CrossRef]
- Zhao, H.Y.; Zhang, Q.; Huo, H.; Lin, J.T.; Liu, Z.; Wang, H.K.; Guan, D.B.; He, K.B. Environment-economy tradeoff for Beijing-Tianjin-Hebei’s exports. Appl. Energy 2016, 184, 926–935. [Google Scholar] [CrossRef]
- Zhao, W.F.; Lin, R.S.; Tang, W.; Zhou, Y. Forecasting Model of Short-Term PM2.5 Concentration Based on Deep Learning. J. Nanjing Norm. Univ. 2019, 42, 32–41. [Google Scholar] [CrossRef]
- Munoz-Sabater, J.; Dutra, E.; Agusti-Panareda, A.; Albergel, C.; Arduini, G.; Balsamo, G.; Boussetta, S.; Choulga, M.; Harrigan, S.; Hersbach, H.; et al. ERA5-Land: A state-of-the-art global reanalysis dataset for land applications. Earth Syst. Sci. Data 2021, 13, 4349–4383. [Google Scholar] [CrossRef]
- Krige, D.G. A statistical approach to some basic mine valuation problems on the Witwatersrand. J S. Afr Inst. Min. Metall. 1951, 52, 119–139. [Google Scholar]
- Matheron, G. Principles of geostatistics. Econ. Geol. 1963, 58, 1246–1266. [Google Scholar] [CrossRef]
- Ali, G.; Sajjad, M.; Kanwal, S.; Xiao, T.Y.; Khalid, S.; Shoaib, F.; Gul, H.N. Spatial-temporal characterization of rainfall in Pakistan during the past half-century (1961–2020). Sci. Rep. 2021, 11, 6935. [Google Scholar] [CrossRef]
- Wang, J.J.; Lu, X.M.; Yan, Y.T.; Zhou, L.G.; Ma, W.C. Spatiotemporal characteristics of PM2.5 concentration in the Yangtze River Delta urban agglomeration, China on the application of big data and wavelet analysis. Sci. Total Environ. 2020, 724, 138134. [Google Scholar] [CrossRef]
- Zou, B.; Luo, Y.Q.; Wan, N.; Zheng, Z.; Sternberg, T.; Liao, Y.L. Performance comparison of LUR and OK in PM2.5 concentration mapping: A multidimensional perspective. Sci. Rep. 2015, 5, 8698. [Google Scholar] [CrossRef] [Green Version]
- Grossmann, A.; Morlet, J. Decomposition of Hardy Functions into Square Integrable Wavelets of Constant Shape. Siam J. Math. Anal. 1984, 15, 723–736. [Google Scholar] [CrossRef] [Green Version]
- Grinsted, A.; Moore, J.C.; Jevrejeva, S. Application of the cross wavelet transform and wavelet coherence to geophysical time series. Nonlinear Process Geophys 2004, 11, 561–566. [Google Scholar] [CrossRef]
- Morlet, J.; Arens, G.; Fourgeau, E.; Glard, D. Wave propagation and sampling theory—Part I: Complex signal and scattering in multilayered media. Geophysics 1982, 47, 203–221. [Google Scholar] [CrossRef] [Green Version]
- Torrence, C.; Compo, G.P. A Practical Guide to Wavelet Analysis. Bull. Amer. Meteor. Soc. 1998, 79, 61–78. [Google Scholar] [CrossRef]
- Anusasananan, P. Wavelet spectrum analysis of PM10 data in Bangkok, Thailand. J. Phys. Conf. Ser. 2019, 1380, 012017. [Google Scholar] [CrossRef]
- Mihanovic, H.; Orlic, M.; Pasaric, Z. Diurnal thermocline oscillations driven by tidal flow around an island in the Middle Adriatic. J. Mar. Syst. 2009, 78, S157–S168. [Google Scholar] [CrossRef]
- Torrence, C.; Webster, P.J. Interdecadal changes in the ENSO–monsoon system. J. Clim. 1999, 12, 2679–2690. [Google Scholar] [CrossRef]
- Hu, W.; Si, B.C. Technical note: Multiple wavelet coherence for untangling scale-specific and localized multivariate relationships in geosciences. Hydrol. Earth Syst. Sci. 2016, 20, 3183–3191. [Google Scholar] [CrossRef] [Green Version]
- Hu, W.; Si, B.C.; Biswas, A.; Chau, H.W. Temporally stable patterns but seasonal dependent controls of soil water content: Evidence from wavelet analyses. Hydrol. Process. 2017, 31, 3697–3707. [Google Scholar] [CrossRef]
- Ng, E.K.W.; Chan, J.C.L. Geophysical Applications of Partial Wavelet Coherence and Multiple Wavelet Coherence. J. Atmos. Ocean. Technol. 2012, 29, 1845–1853. [Google Scholar] [CrossRef]
- Koopmans, L.H. The Spectral Analysis of Time Series; Academic Press: New York, NY, USA, 1974; pp. 119–164. [Google Scholar]
- Zhang, Z.Z.; Wang, W.X.; Cheng, M.M.; Liu, S.J.; Xu, J.; He, Y.J.; Meng, F. The contribution of residential coal combustion to PM2.5 pollution over China’s Beijing-Tianjin-Hebei region in winter. Atmos. Environ. 2017, 159, 147–161. [Google Scholar] [CrossRef]
- Bao, C.Z.; Chai, P.F.; Lin, H.B.; Zhang, Z.Y.; Ye, Z.H.; Gu, M.J.; Lu, H.C.; Shen, P.; Jin, M.J.; Wang, J.B.; et al. Association of PM2.5 pollution with the pattern of human activity: A case study of a developed city in eastern China. J. Air Waste Manag. Assoc. 2016, 66, 1202–1213. [Google Scholar] [CrossRef] [Green Version]
- Chen, Z.Y.; Xie, X.M.; Cai, J.; Chen, D.L.; Gao, B.B.; He, B.; Cheng, N.L.; Xu, B. Understanding meteorological influences on PM2.5 concentrations across China: A temporal and spatial perspective. Atmos. Chem. Phys. 2018, 18, 5343–5358. [Google Scholar] [CrossRef] [Green Version]
- Li, H.; Wang, S.L.; Zhang, W.J.; Wang, H.; Wang, S.B.; Li, H.S. Characteristics and Influencing Factors of Urban Air Quality in Beijing-Tianjin-Hebei and Its Surrounding Areas (‘2 + 26’ Cities). Res. Environ. Sci. 2021, 34, 172–184. [Google Scholar] [CrossRef]
Figure 1.
Location of the BTH and distribution of air quality monitoring stations. The map is based on the standard map number GS (2019) 1822 downloaded from the standard map service website of the National Bureau of Mapping Geographic Information, and the base map is not modified.
Figure 1.
Location of the BTH and distribution of air quality monitoring stations. The map is based on the standard map number GS (2019) 1822 downloaded from the standard map service website of the National Bureau of Mapping Geographic Information, and the base map is not modified.

Figure 2.
Temporal, diurnal variation and WT of PM2.5 in the BTH from 2015 to 2020.
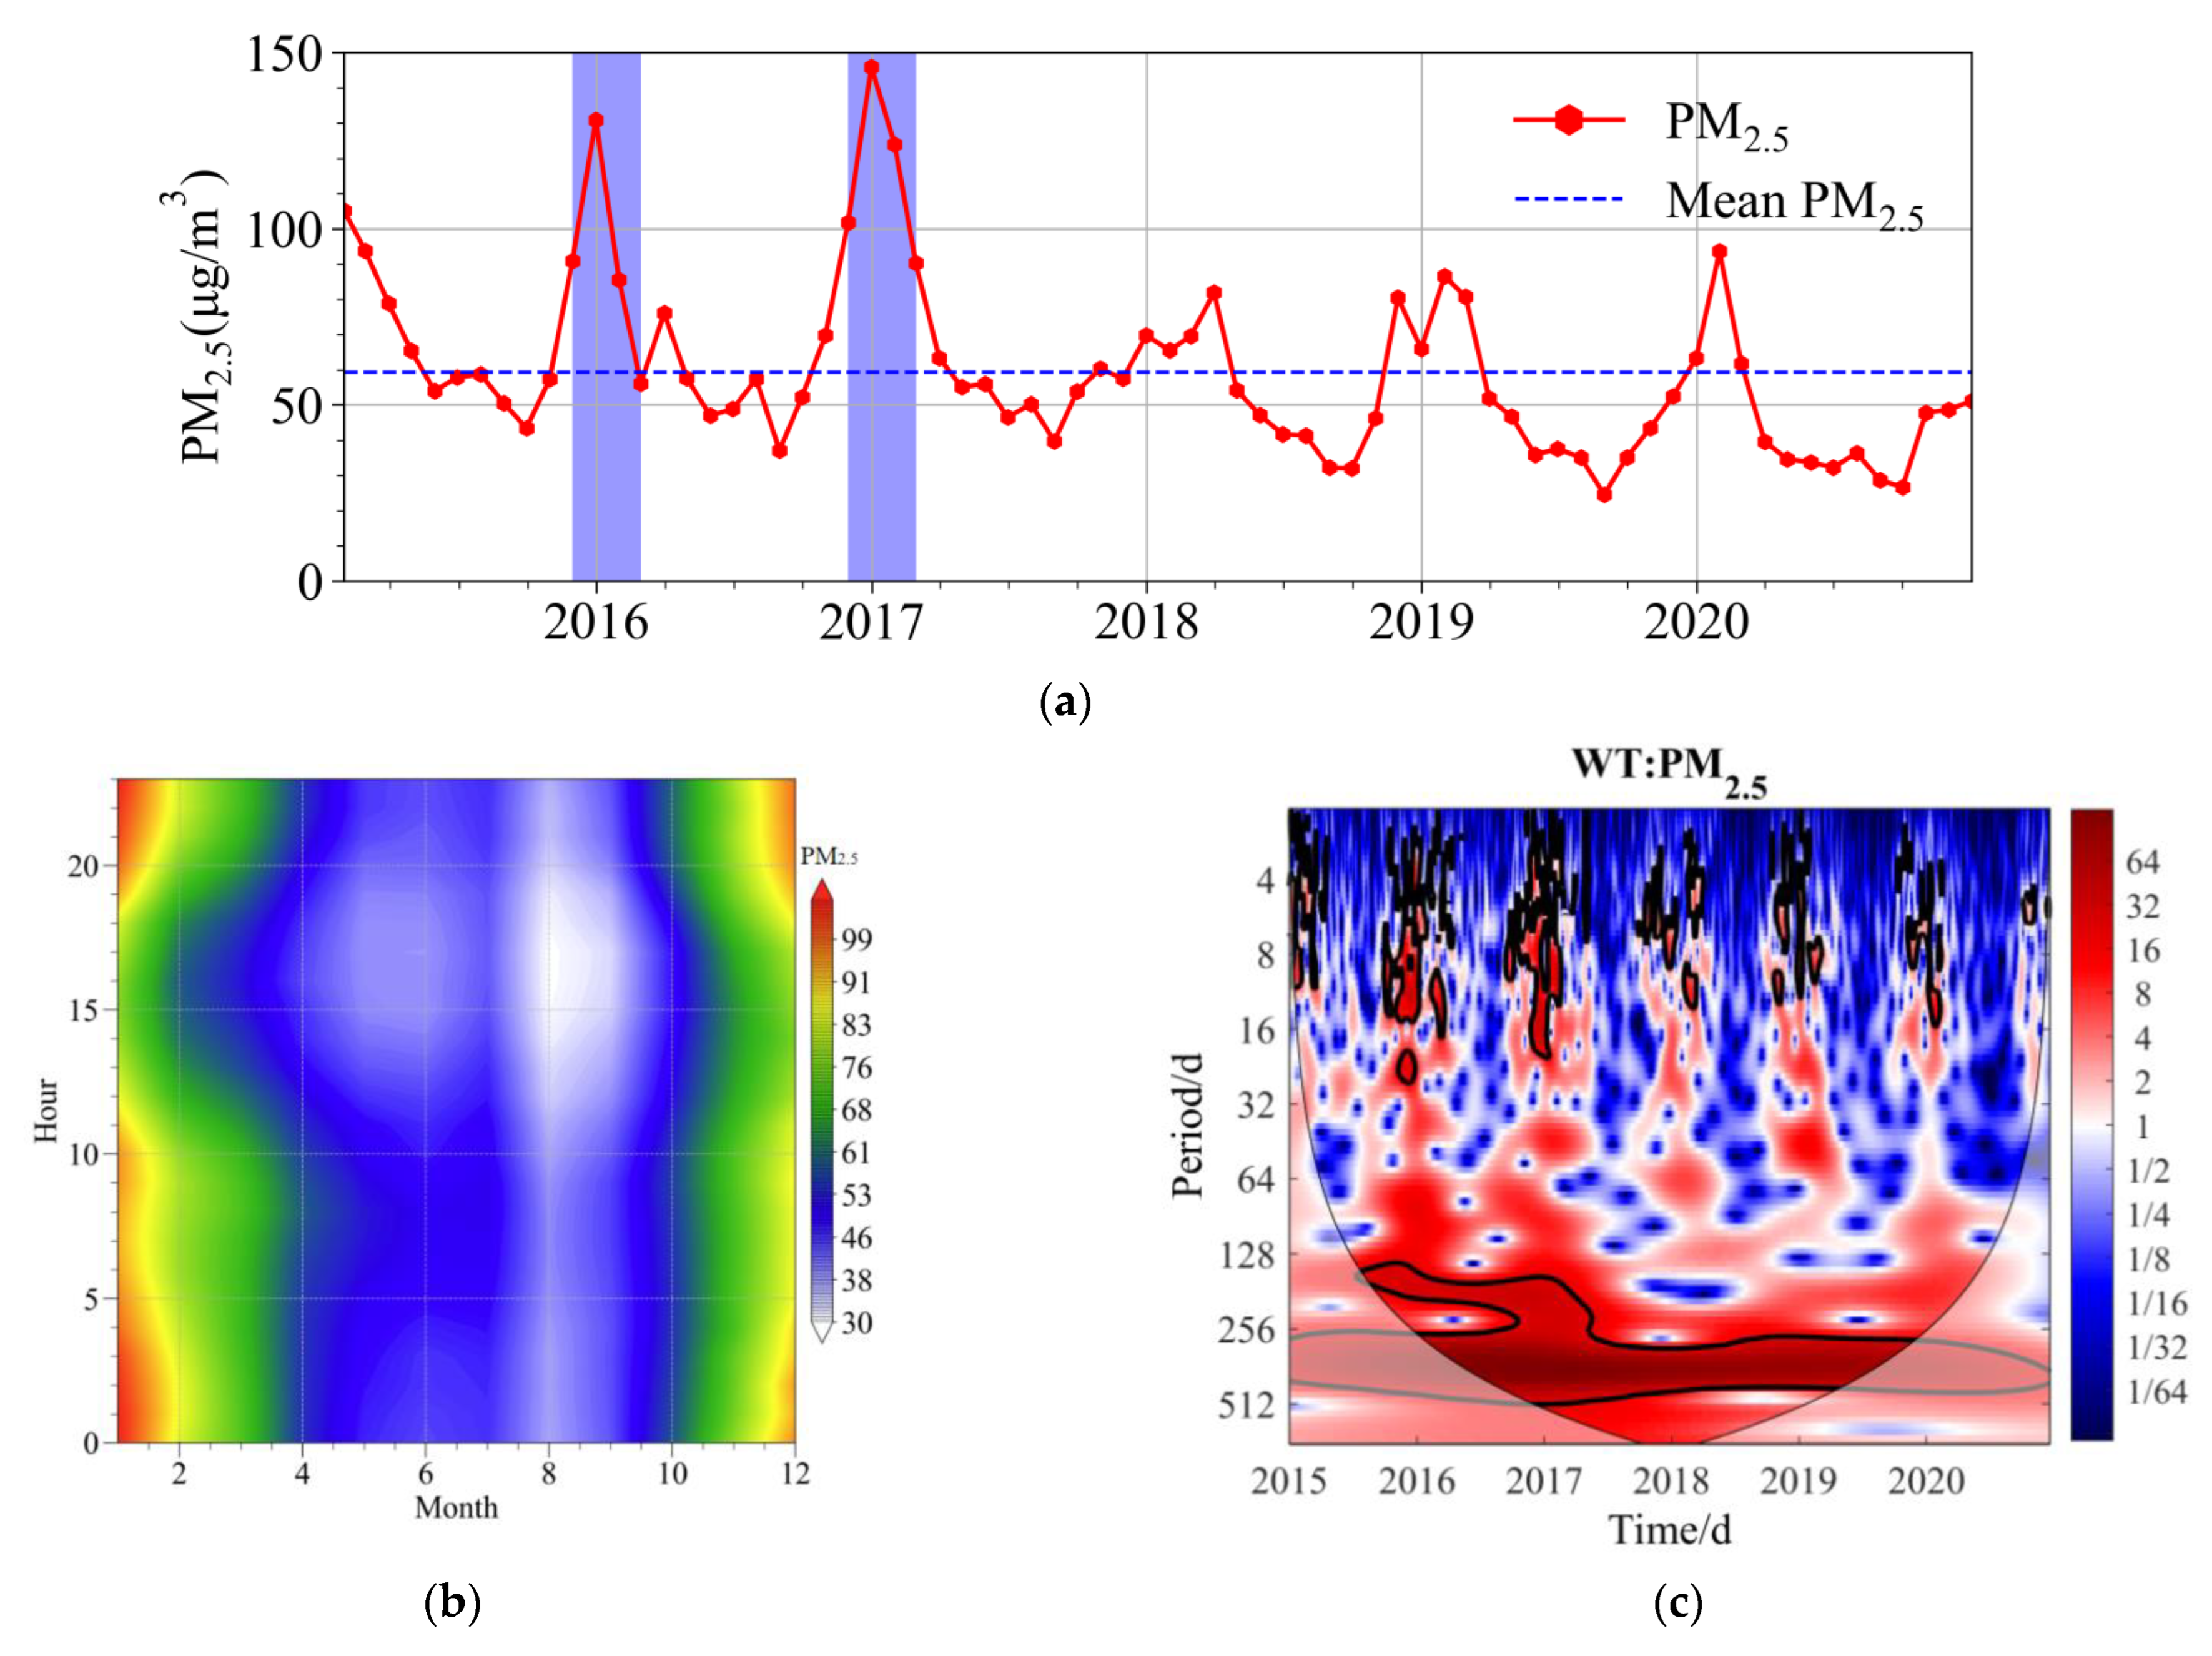
Figure 3.
Annual spatial change of PM2.5 in the BTH.
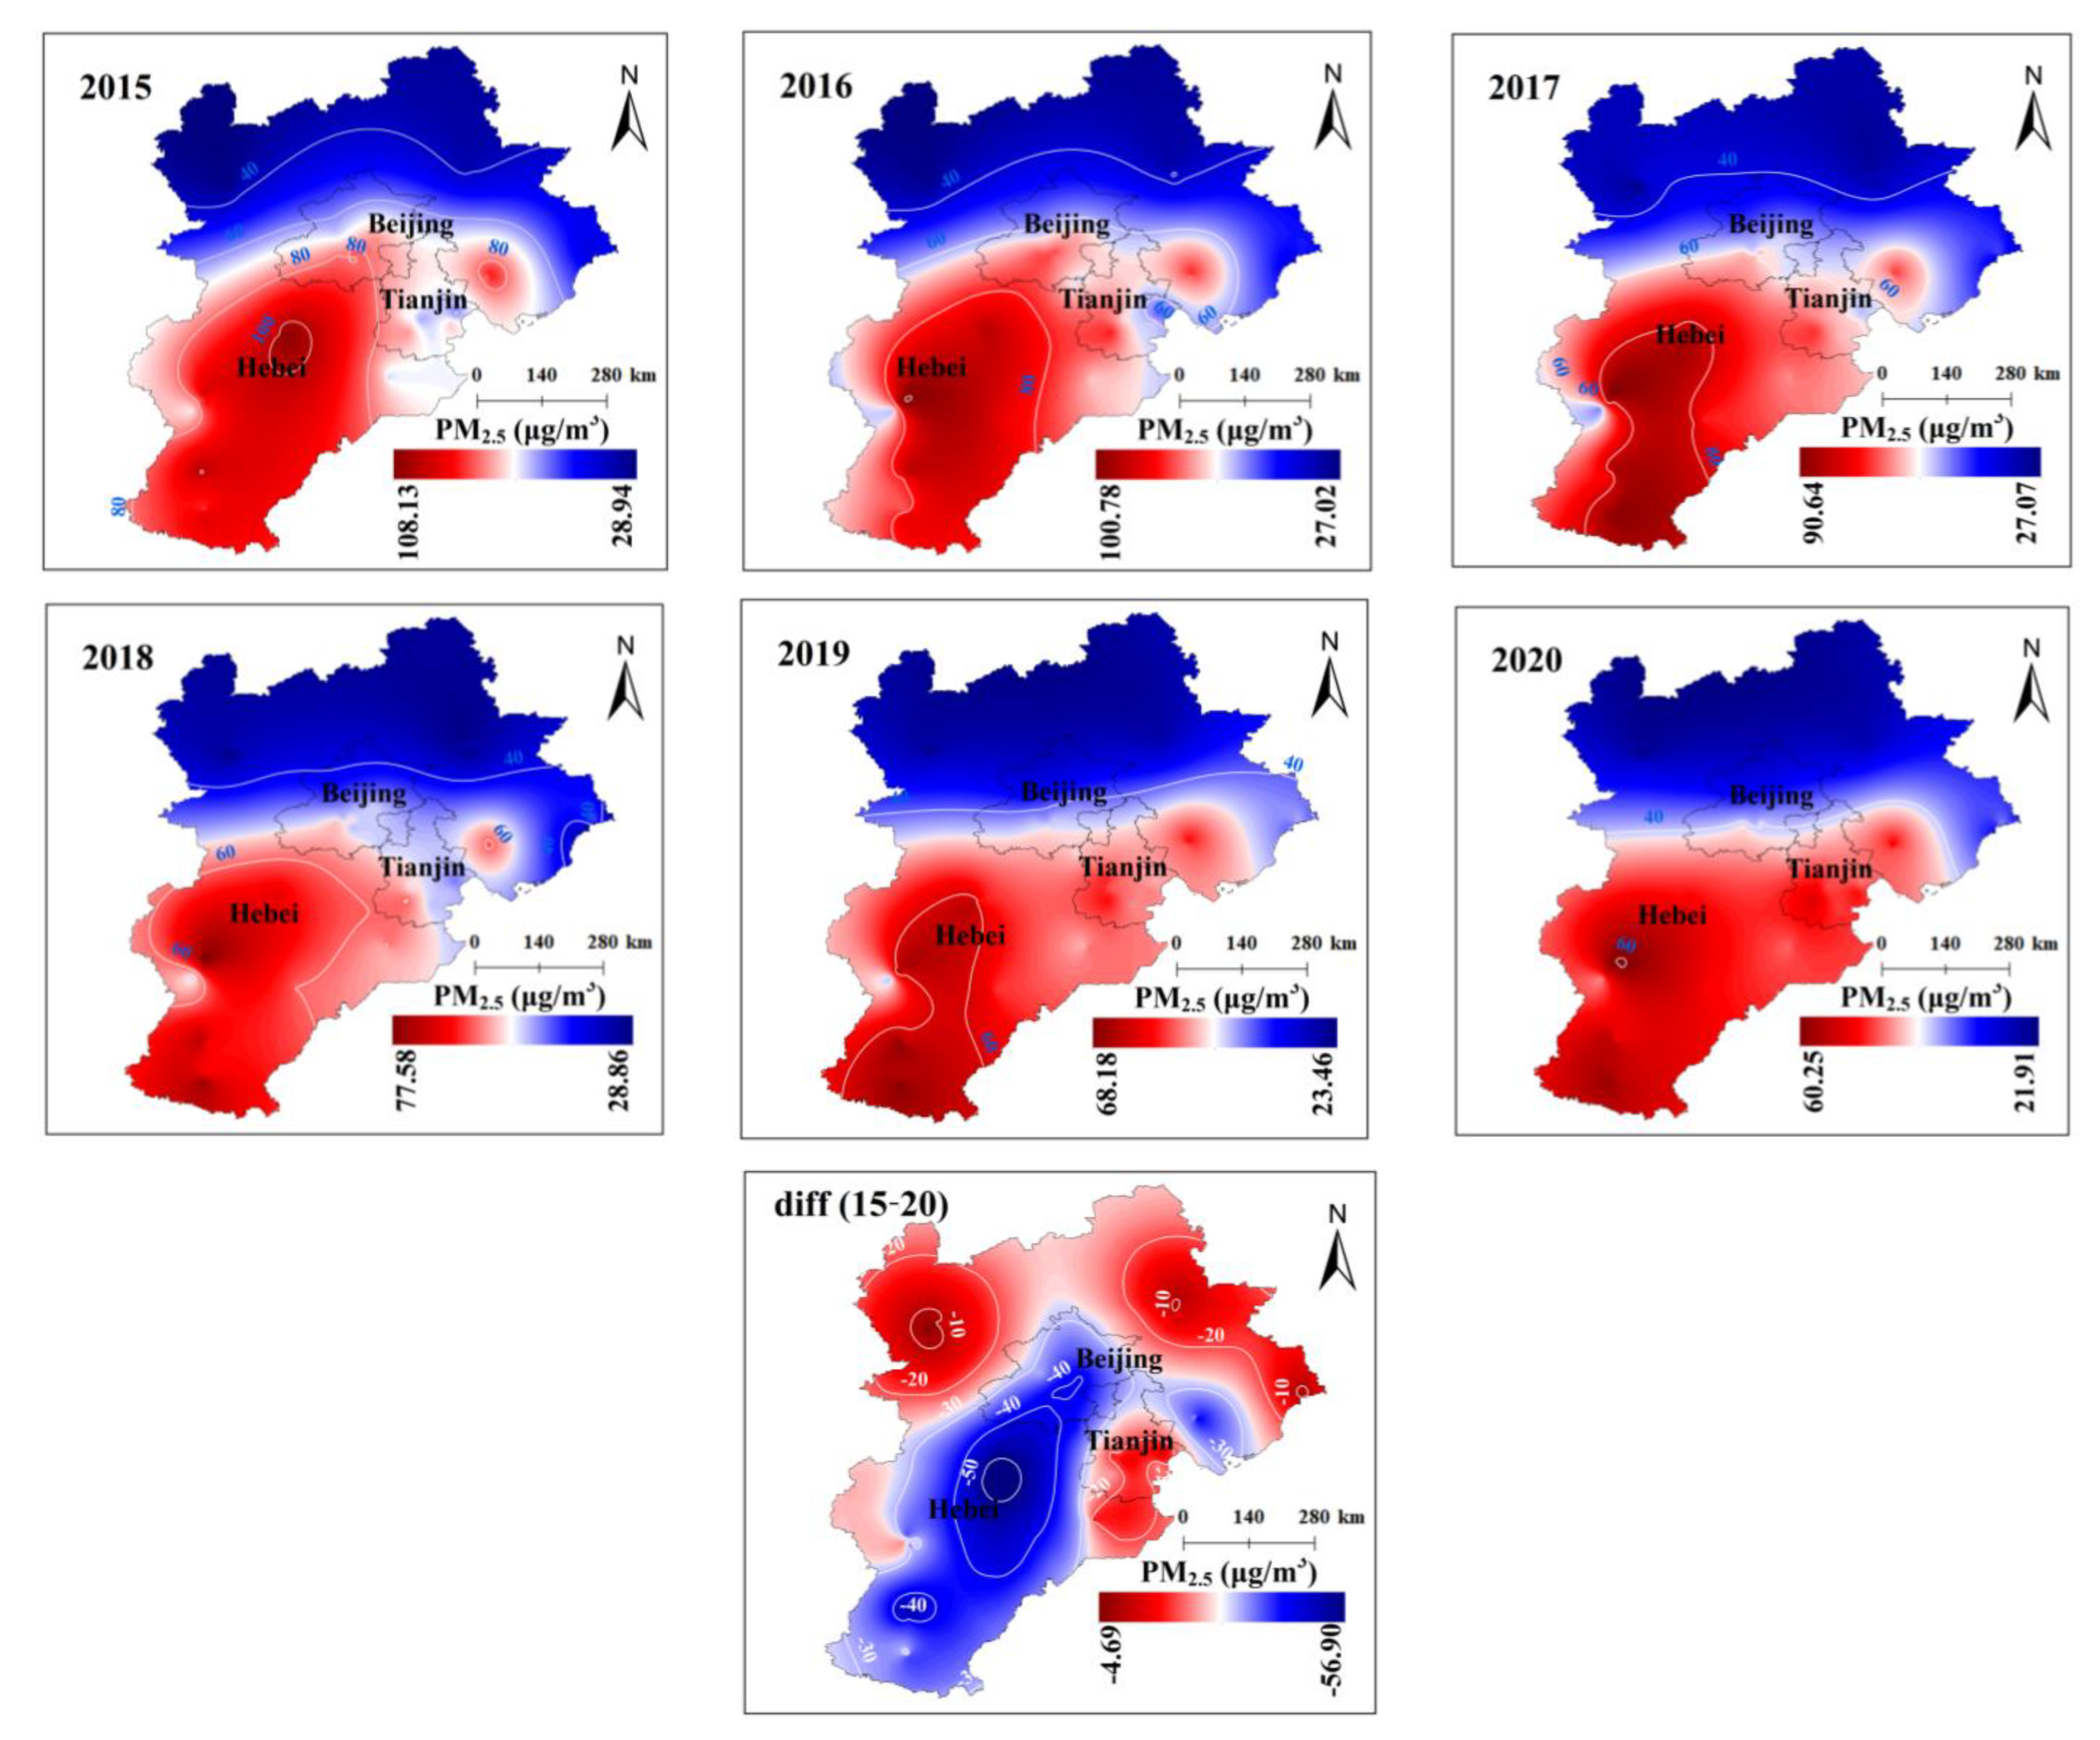
Figure 4.
Seasonal variation of PM2.5 concentrations in the BTH region.
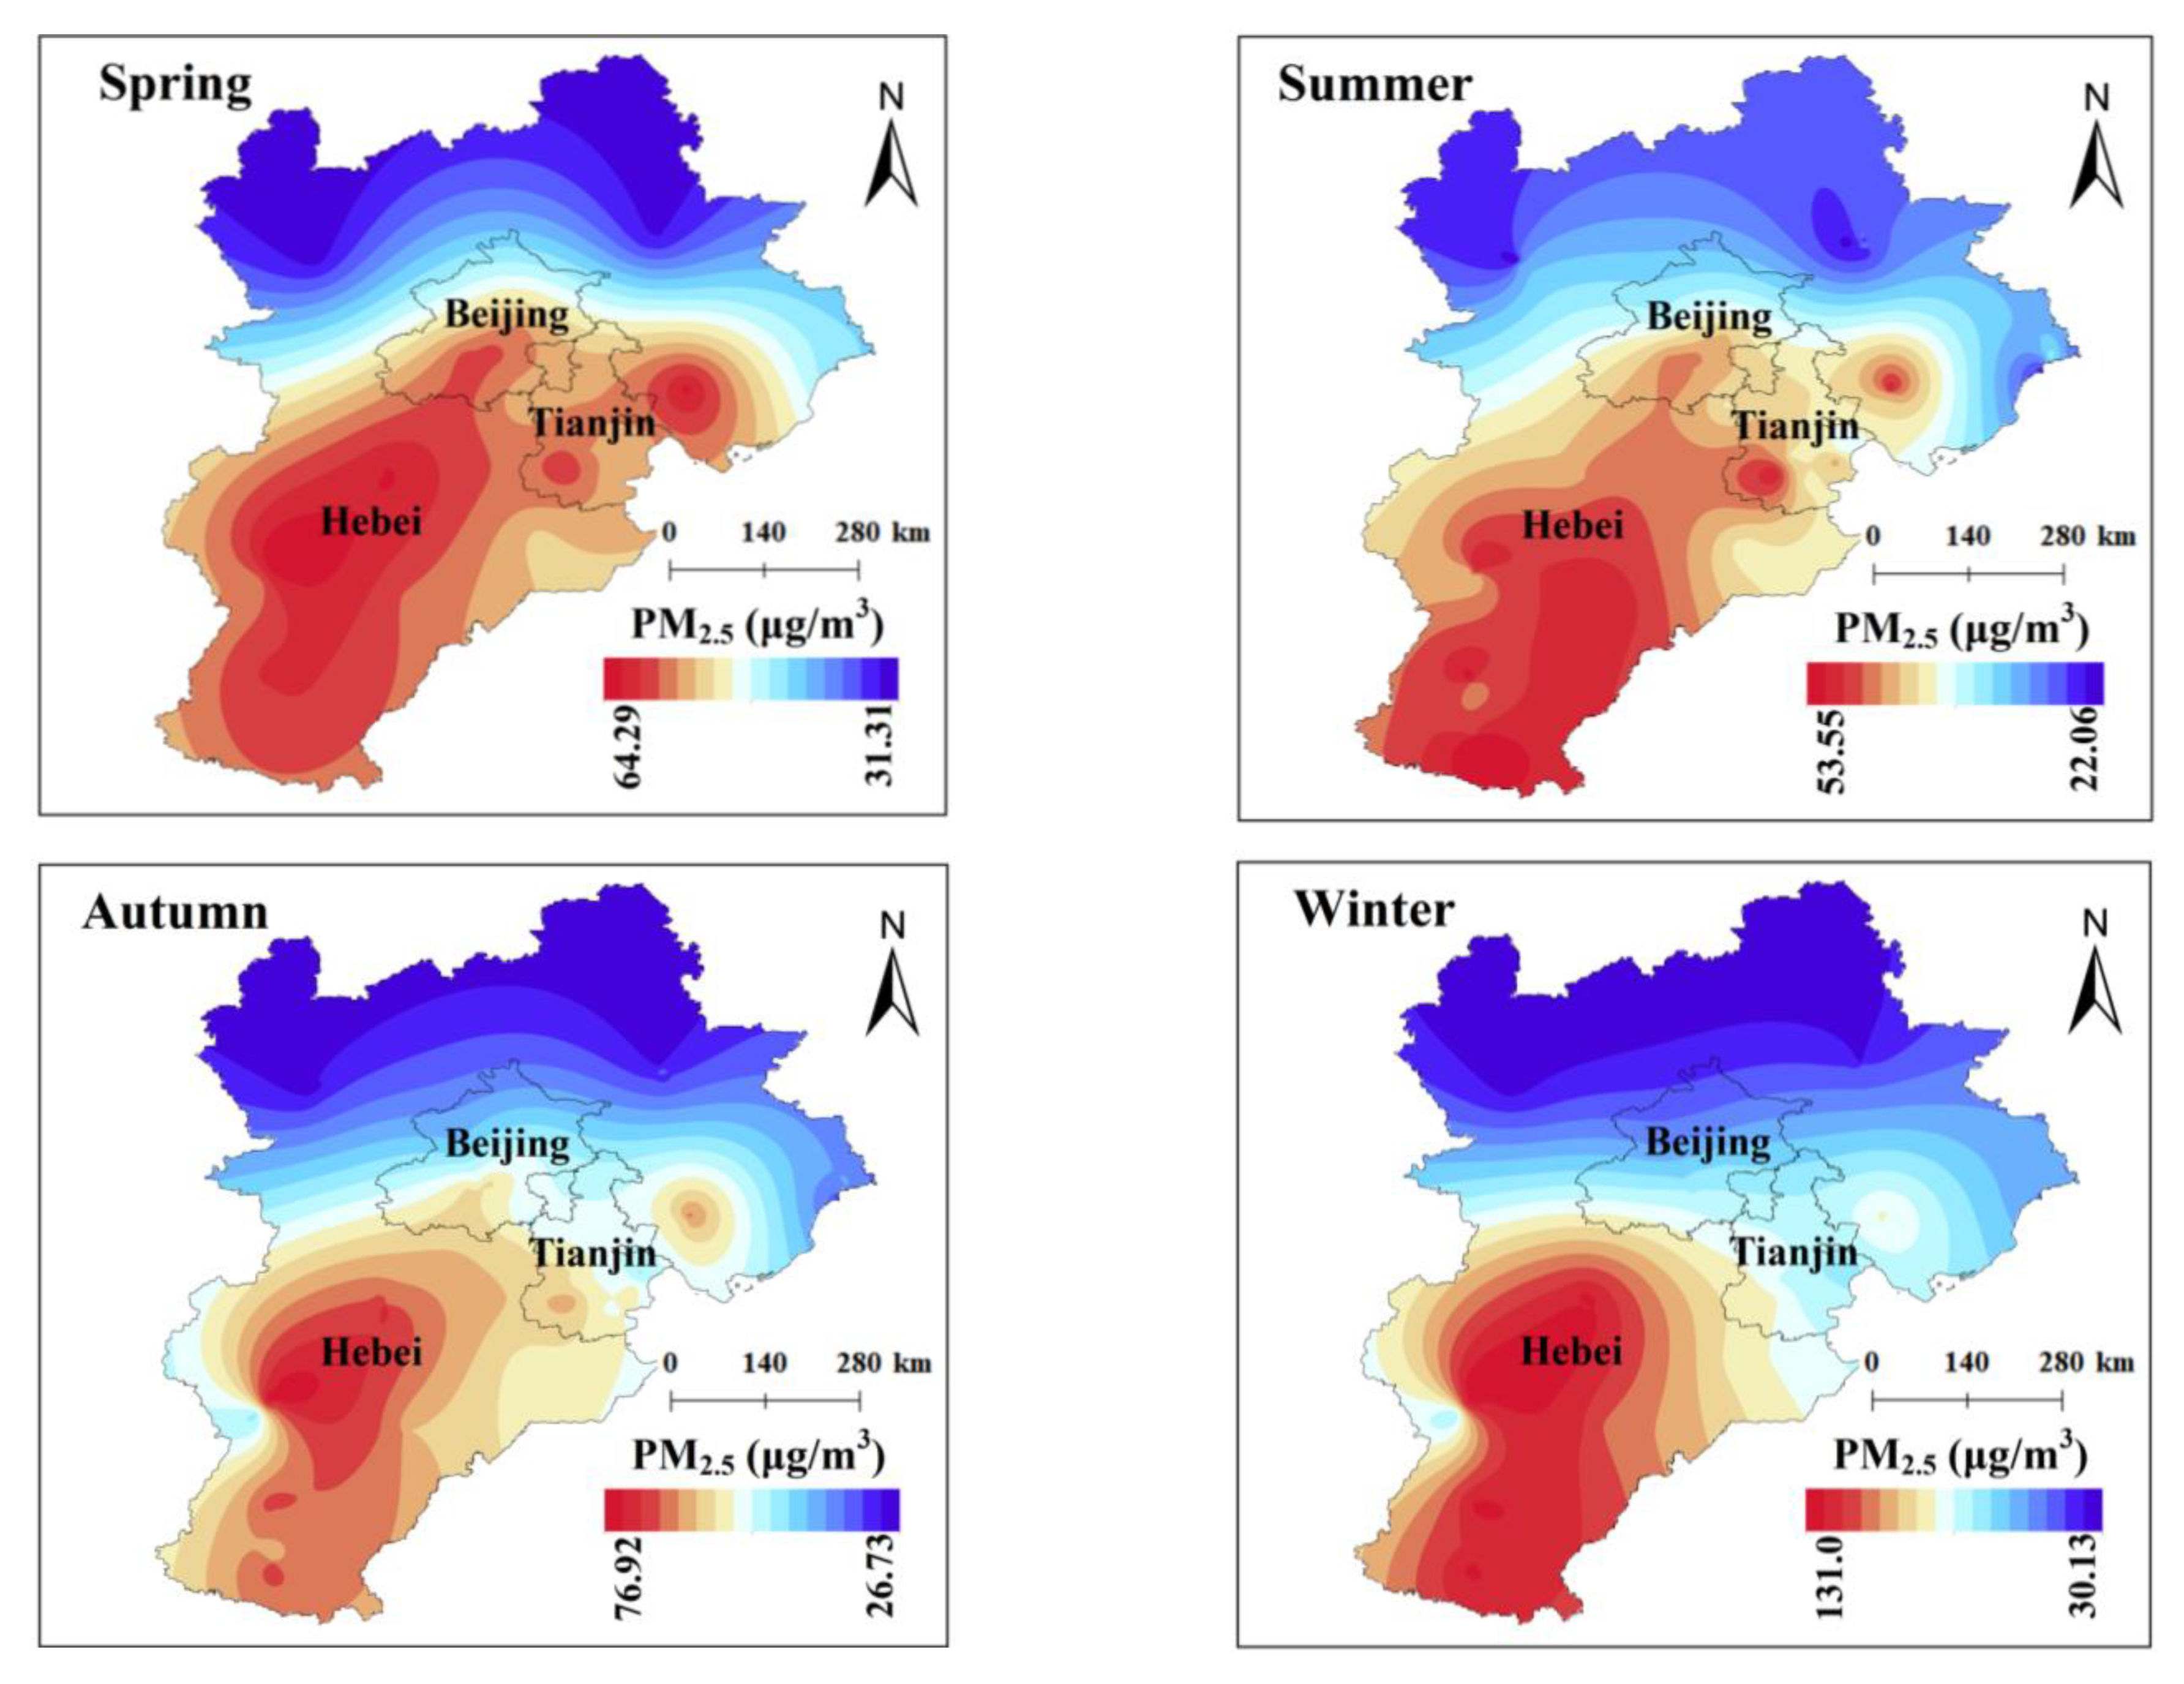
Figure 5.
Overall correlation between PM2.5 and meteorological factors.
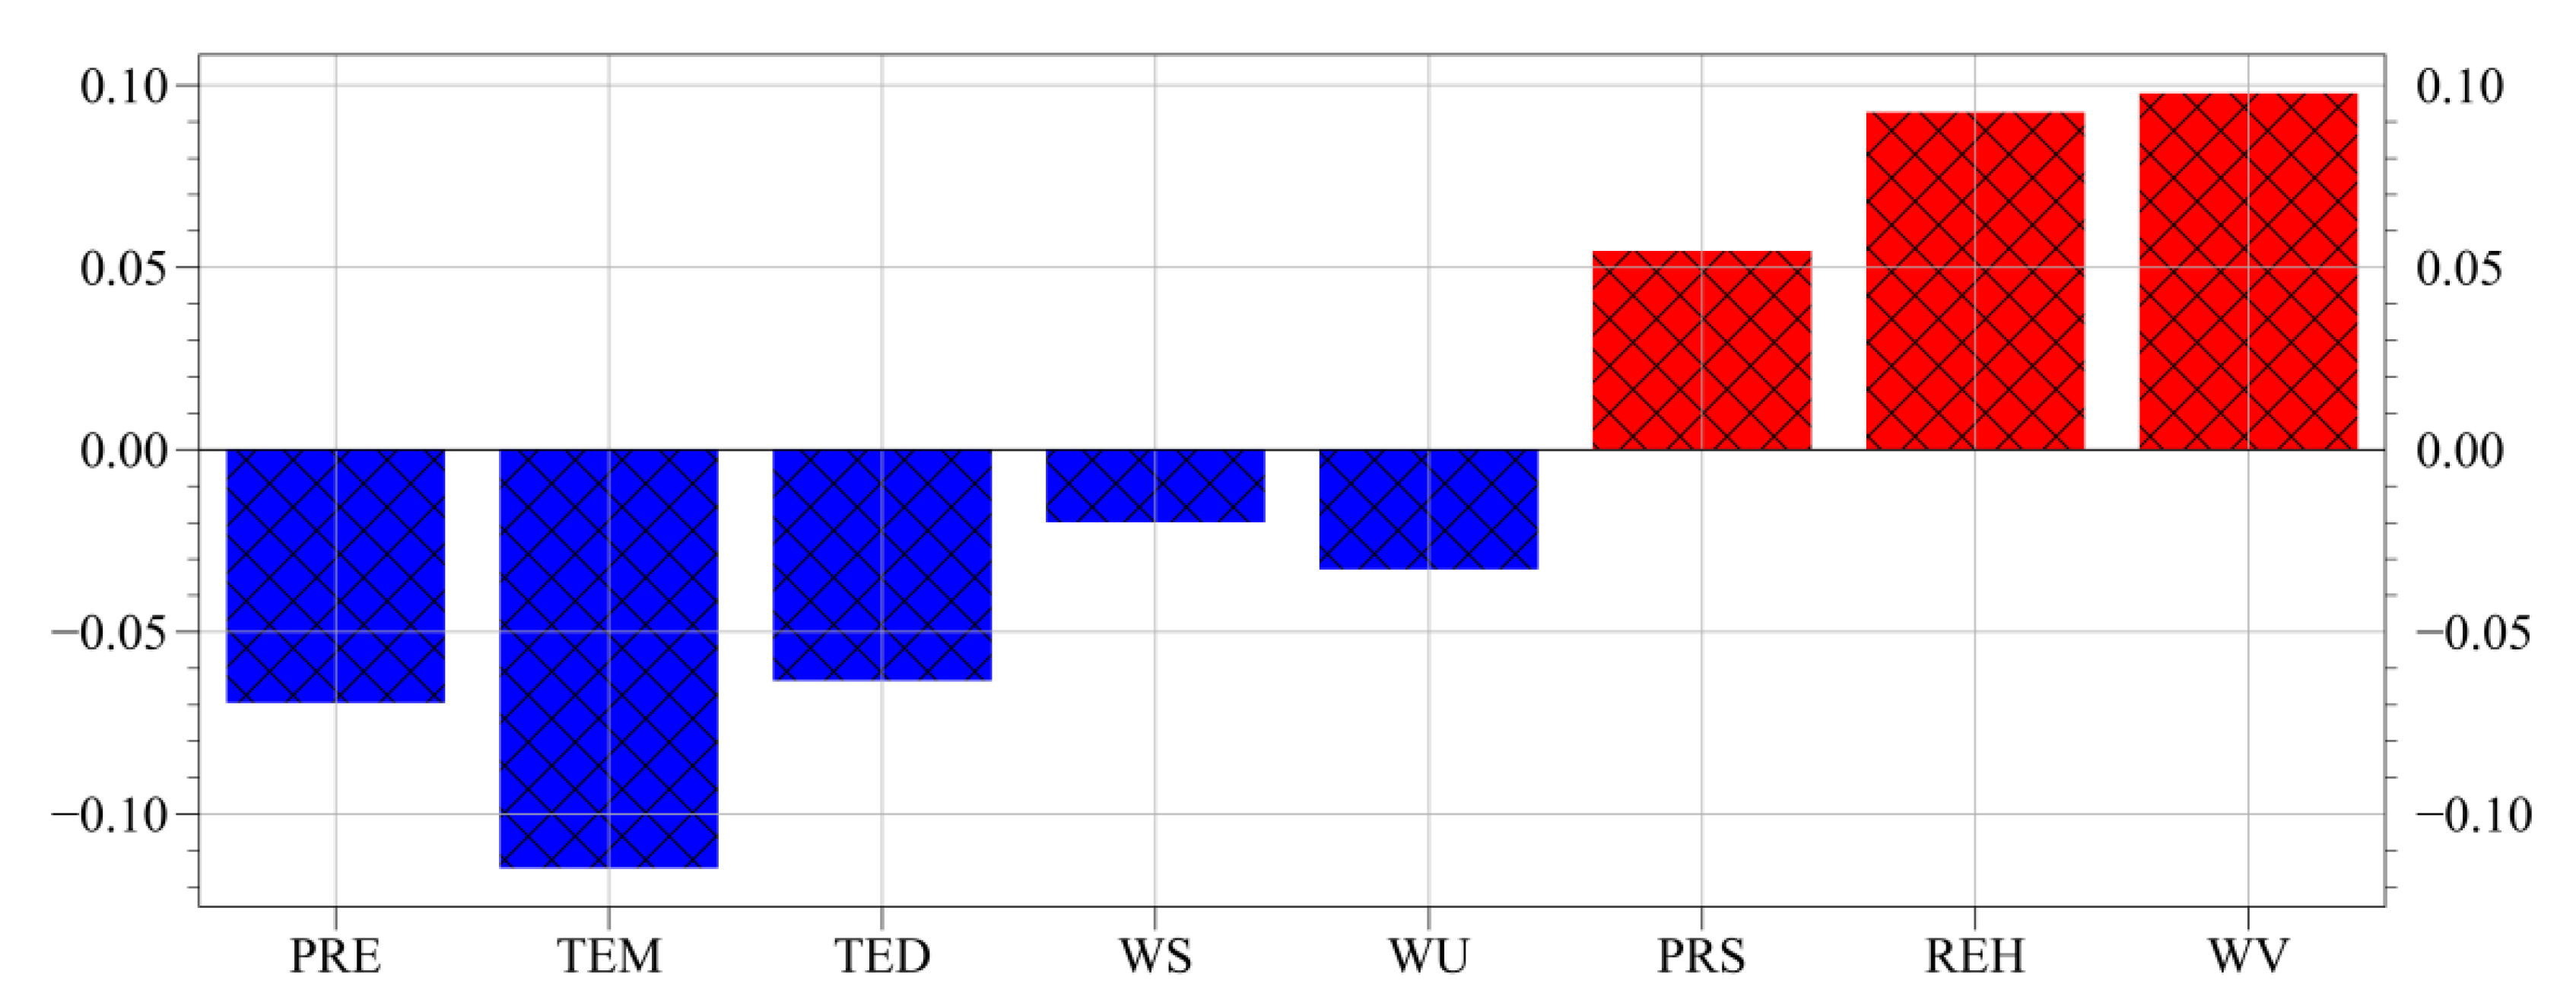
Figure 6.
Spatial correlation between PM2.5 and meteorological factors.
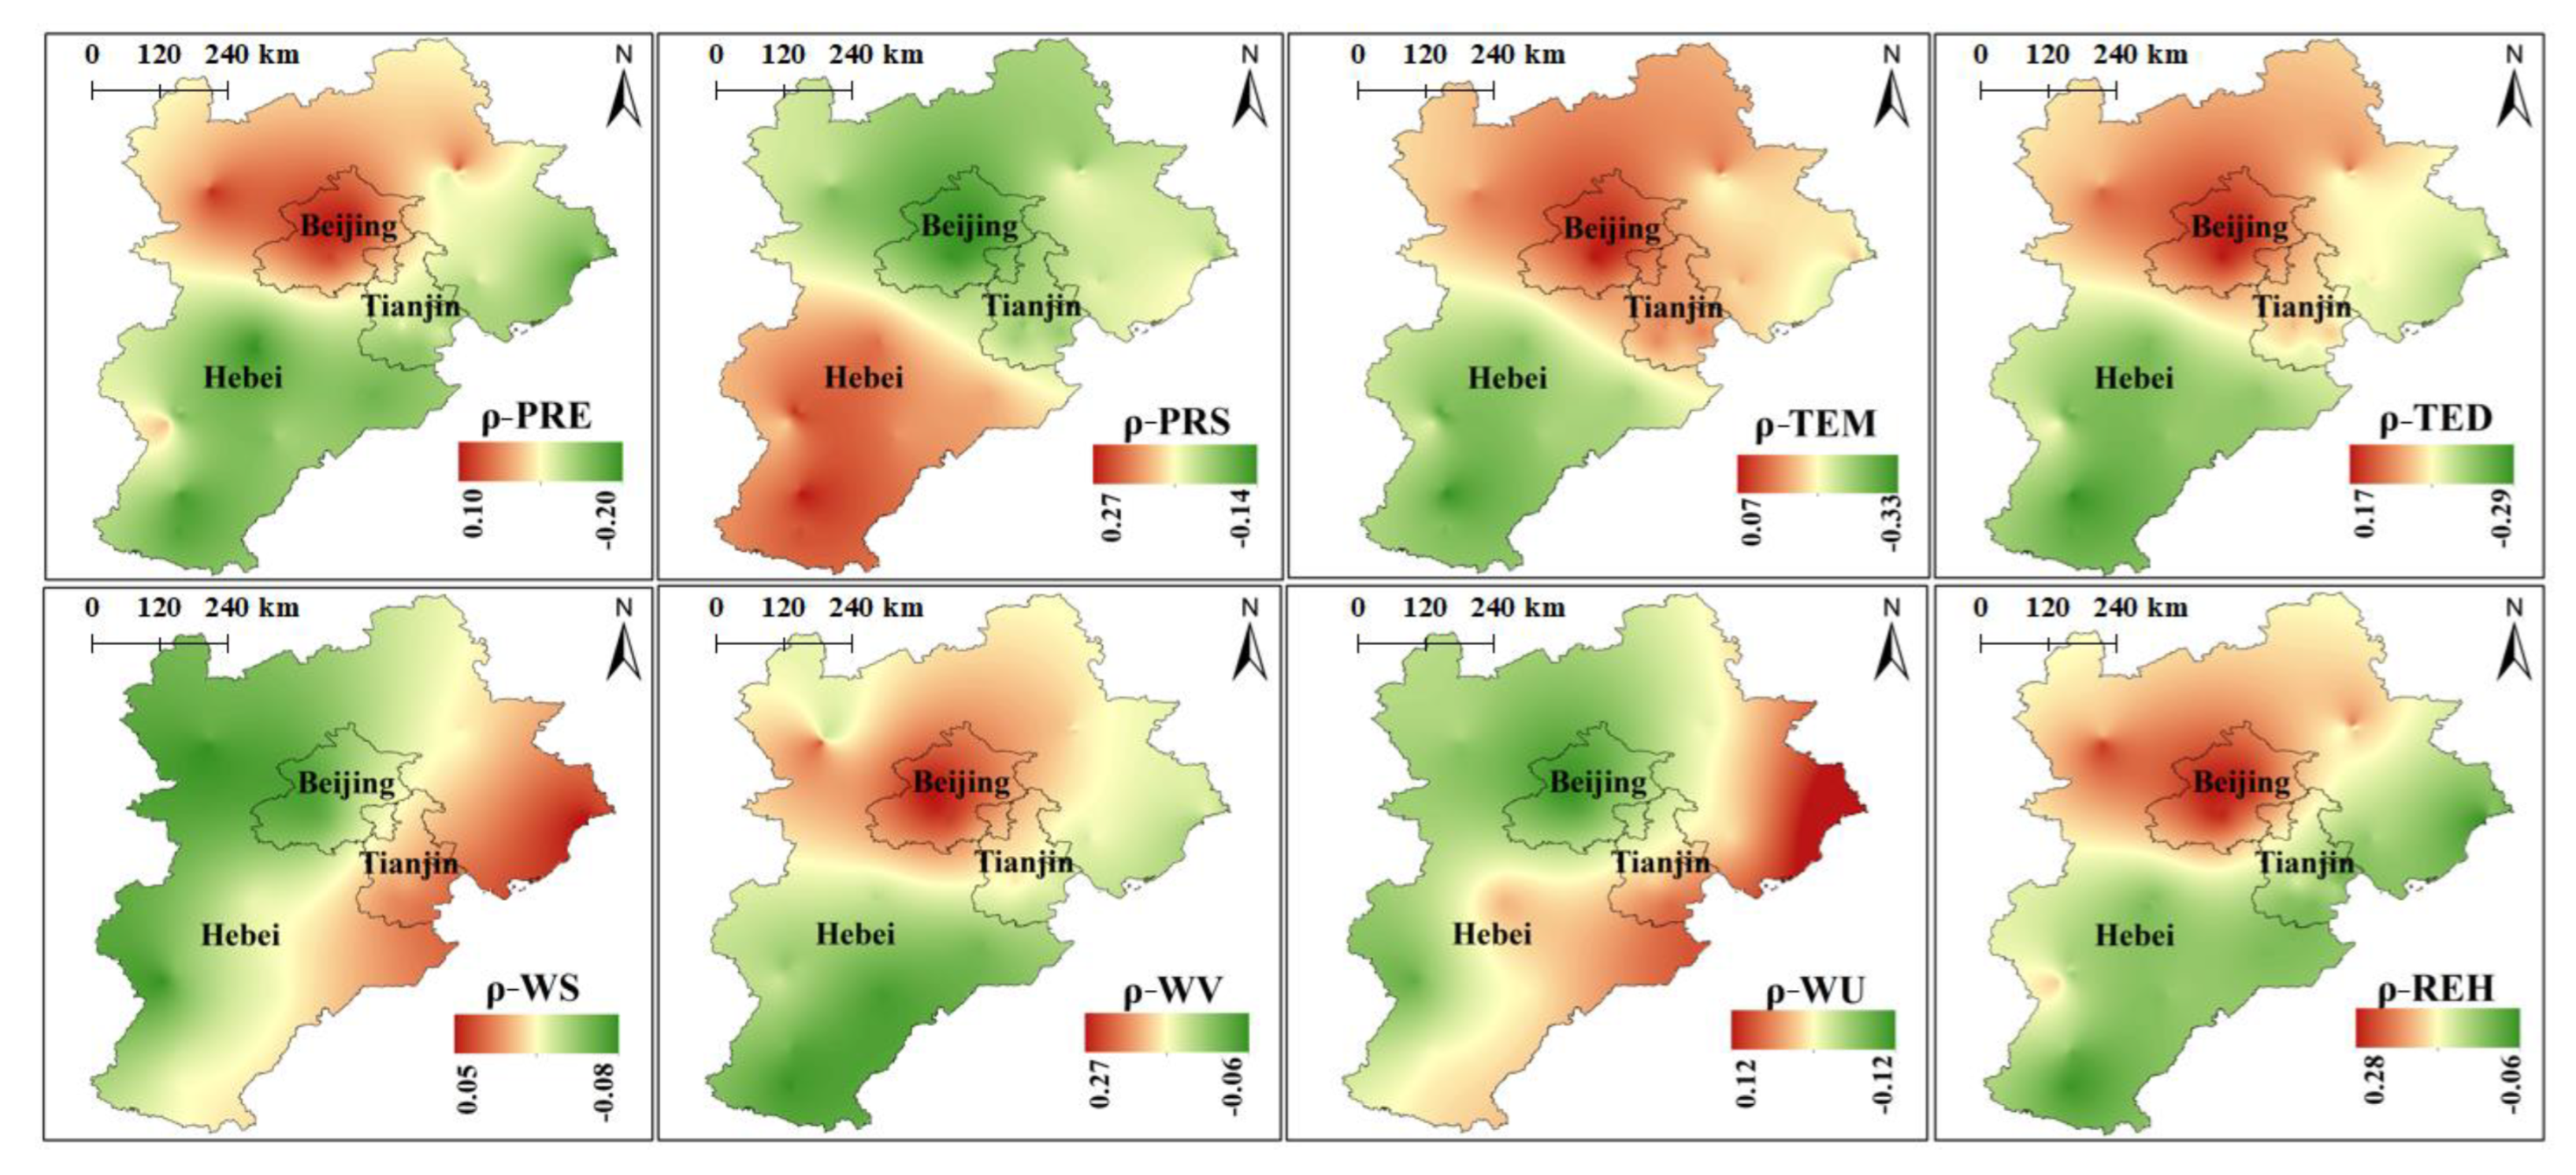
Figure 7.
Wavelet transform coherence of PM2.5 and single meteorological factor.
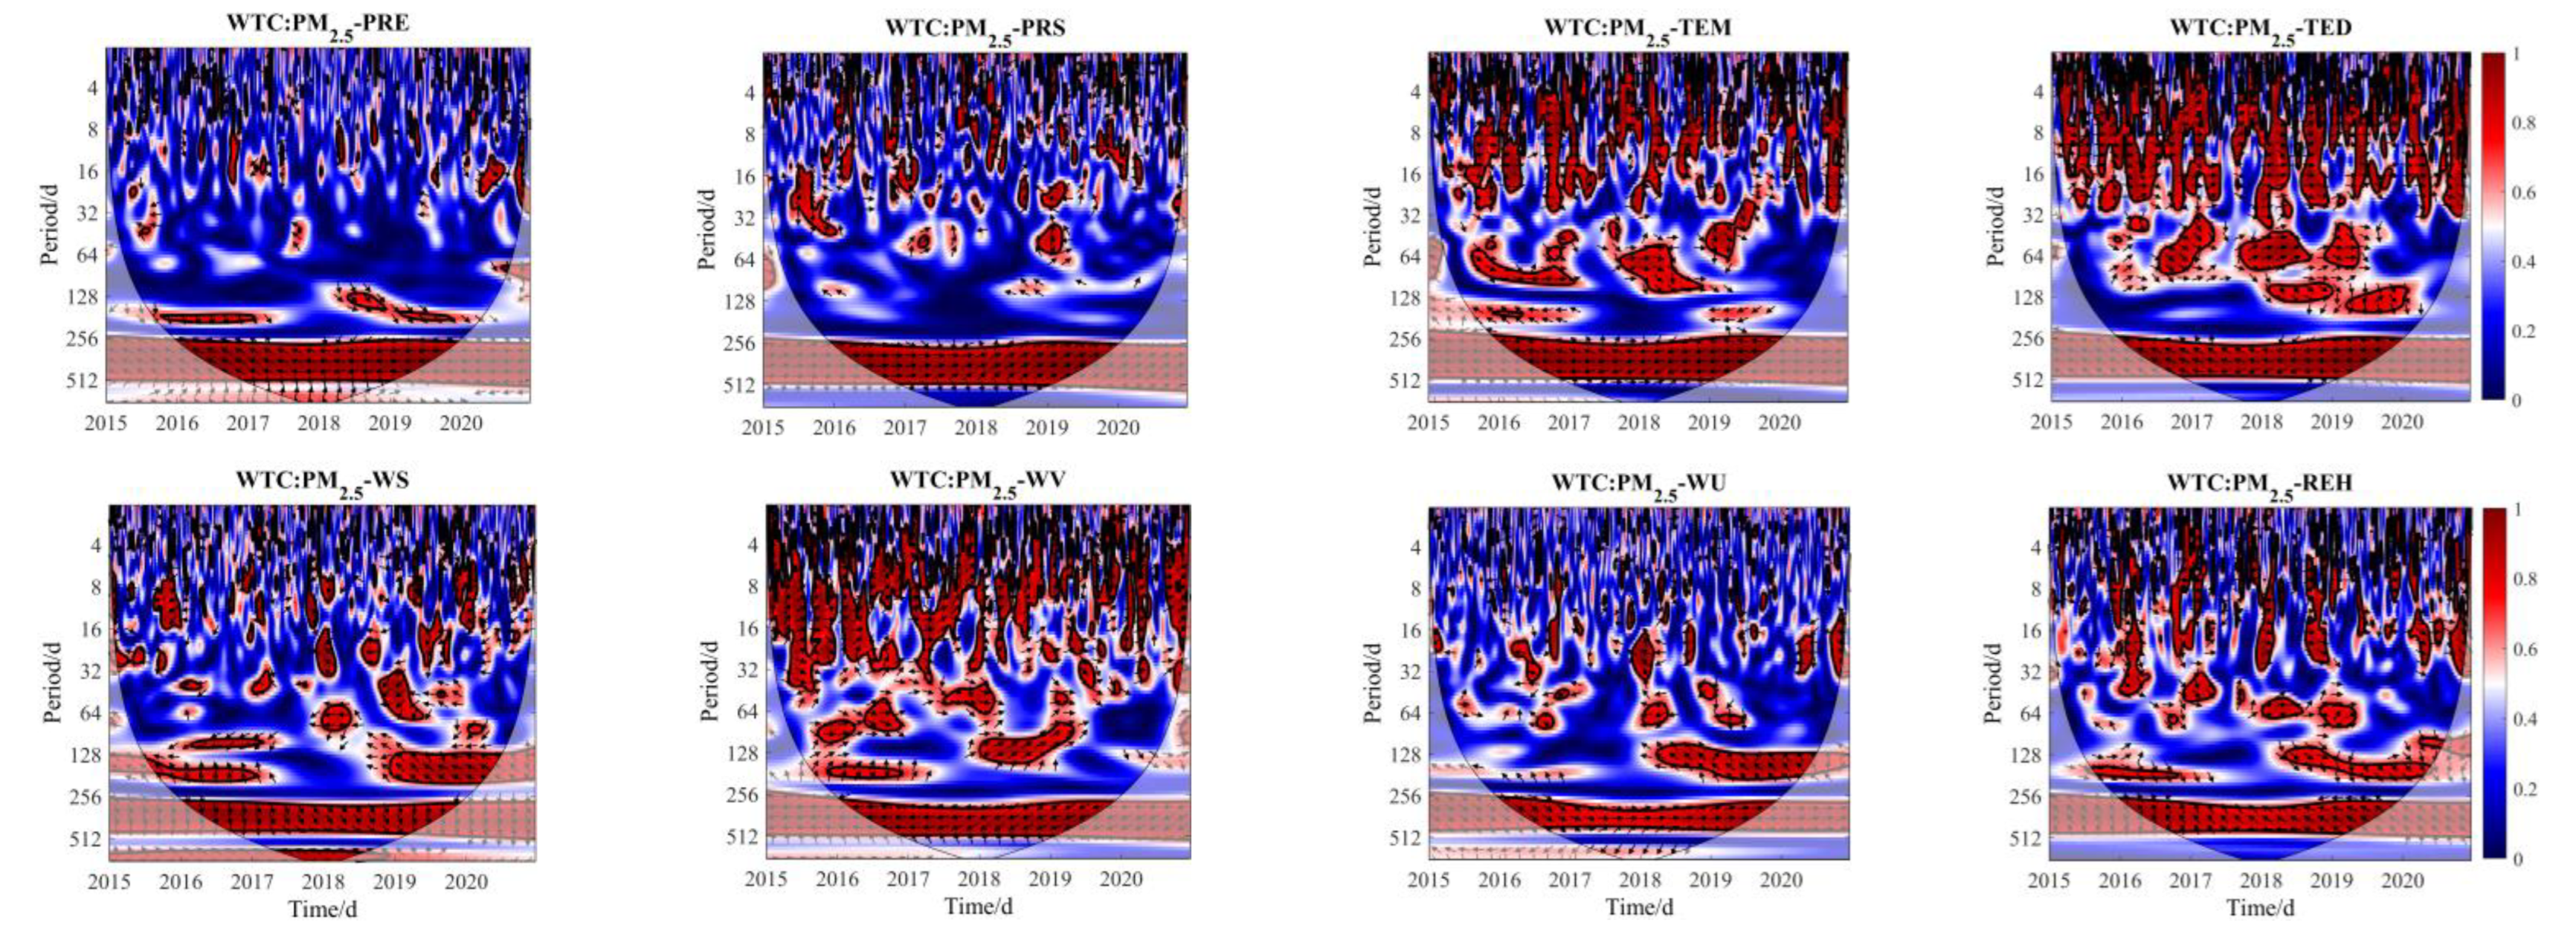
Figure 8.
Multiple wavelet coherence of PM2.5 and multiple meteorological factors.


Table 1.
AWC and PASC for wavelet transform coherence.
| Meteor-Factor | AWC | PASC (%) |
|---|---|---|
| PM2.5-PRE | 0.39 | 0.16 |
| PM2.5-PRS | 0.42 | 0.20 |
| PM2.5-TEM | 0.51 | 0.29 |
| PM2.5-TED | 0.54 | 0.34 |
| PM2.5-REH | 0.47 | 0.22 |
| PM2.5-WU | 0.40 | 0.15 |
| PM2.5-WV | 0.55 | 0.32 |
| PM2.5-WS | 0.47 | 0.23 |
Table 2.
AWC and PASC for multiple wavelet coherence.
| Meteor-Factors | AWC | PASC | Meteor-Factors | AWC | PASC |
|---|---|---|---|---|---|
| PRE-WU | 0.63 | 0.18 | TED-WS | 0.77 | 0.41 |
| PRE-PRS | 0.65 | 0.22 | TED-WU | 0.75 | 0.34 |
| PRE-REH | 0.72 | 0.27 | TED-WV | 0.75 | 0.34 |
| PRE-TED | 0.74 | 0.34 | TED-TEM | 0.75 | 0.38 |
| PRE-WS | 0.69 | 0.28 | WS-WU | 0.68 | 0.20 |
| PRE-WV | 0.71 | 0.26 | WS-WV | 0.76 | 0.36 |
| PRE-TEM | 0.70 | 0.31 | WS-TEM | 0.76 | 0.40 |
| PRS-REH | 0.70 | 0.27 | WU-WV | 0.72 | 0.28 |
| PRS-TED | 0.72 | 0.30 | WU-TEM | 0.74 | 0.33 |
| PRS-WS | 0.71 | 0.34 | WV-TEM | 0.76 | 0.37 |
| PRS-WU | 0.68 | 0.23 | PRE-TEM-TED | 0.86 | 0.41 |
| PRS-WV | 0.74 | 0.30 | TEM-TED-REH | 0.86 | 0.39 |
| PRS-TEM | 0.71 | 0.28 | PRS-REH-WV | 0.86 | 0.29 |
| REH-TED | 0.75 | 0.36 | TEM-REH-WV | 0.87 | 0.40 |
| REH-WS | 0.69 | 0.21 | TEM-WV-WS | 0.89 | 0.45 |
| REH-WU | 0.68 | 0.21 | REH-WV-WU | 0.85 | 0.31 |
| REH-WV | 0.72 | 0.27 | PRE-PRS-WV | 0.84 | 0.29 |
| REH-TEM | 0.75 | 0.37 | PRS-WS-WV | 0.88 | 0.41 |
Publisher’s Note: MDPI stays neutral with regard to jurisdictional claims in published maps and institutional affiliations. |
© 2022 by the authors. Licensee MDPI, Basel, Switzerland. This article is an open access article distributed under the terms and conditions of the Creative Commons Attribution (CC BY) license (https://creativecommons.org/licenses/by/4.0/).
Share and Cite
MDPI and ACS Style
Liu, N.; Li, S.; Zhang, F. Multi-Scale Spatiotemporal Variations and Drivers of PM2.5 in Beijing-Tianjin-Hebei from 2015 to 2020. Atmosphere 2022, 13, 1993. https://doi.org/10.3390/atmos13121993
AMA Style
Liu N, Li S, Zhang F. Multi-Scale Spatiotemporal Variations and Drivers of PM2.5 in Beijing-Tianjin-Hebei from 2015 to 2020. Atmosphere. 2022; 13(12):1993. https://doi.org/10.3390/atmos13121993
Chicago/Turabian StyleLiu, Nanjian, Song Li, and Fengtai Zhang. 2022. "Multi-Scale Spatiotemporal Variations and Drivers of PM2.5 in Beijing-Tianjin-Hebei from 2015 to 2020" Atmosphere 13, no. 12: 1993. https://doi.org/10.3390/atmos13121993
Note that from the first issue of 2016, this journal uses article numbers instead of page numbers. See further details here.