Article

Comprehensive Analysis of Organic Micropollutants in Fine Particulate Matter in Hanoi Metropolitan Area, Vietnam

1
Center for Research and Technology Transfer, Vietnam Academy of Science and Technology (VAST), Hanoi 100000, Vietnam
2
Department of Chemistry, Graduate University of Science and Technology, VAST, Hanoi 100000, Vietnam
3
Graduate School of Engineering, Osaka University, Osaka 565-0871, Japan
*
Author to whom correspondence should be addressed.
Atmosphere 2022, 13(12), 2088; https://doi.org/10.3390/atmos13122088
Submission received: 23 September 2022 / Revised: 12 November 2022 / Accepted: 7 December 2022 / Published: 12 December 2022
(This article belongs to the Section Air Quality)

Abstract

:
Rapid urbanization has led to increased environmental pollution in Vietnam, especially air pollution issues. In this study, we used gas chromatography-mass spectrometry with an automated identification and quantification system database to detect and quantitate compounds in atmospheric fine particulate matter (PM2.5). A total of 288 compounds classified in 19 pollutant categories based on their origins were detected in PM2.5 samples collected in three areas of Hanoi during winter. The total content of substances detected ranged from 41.08 to 795.00 ng.m−3. The characteristics and concentrations of organic pollutants differed among the industrial, urban, and agricultural sampling areas, with average concentrations of 179.00, 112.10, and 529.40 ng.m−3, respectively. In this comprehensive study on trace organic compounds conducted with samples collected at three sites, we investigating the basic impact of three main factors on the environment. This study contributes to the literature by providing a data set on the content of trace organic substances in the air at the study site.

1. Introduction

Due to rapid urbanization, industrial development and population increase in big cities in Vietnam, air pollution has become an alarming environmental issue in Hanoi, the capital city. Fine particulate matter (PM2.5) is a notable and widespread air pollutant in Hanoi [1,2,3]. Several diseases are associated with PM2.5 pollution, for instance, asthma, lung cancer, and heart disease. PM2.5 is more dangerous than larger particles in terms of long-term human health effects, as smaller particles can penetrate deeper into the respiratory tract. PM2.5 is generated by a wide range of natural and anthropogenic emission sources, which contribute to the high heterogeneity and complexity of the physicochemical properties of PM2.5. PM2.5 sources include fossil fuel combustion, construction, mining, cement and ceramic manufacturing, and other industrial activities [3,4]. A rapid increase in the use of private transport, such as motorcycles and cars, has been a substantial contributor to PM2.5 pollution in Hanoi. Agricultural activities represent another major contributor to PM2.5 air pollution in the region [3,5,6]
In addition to the harmful effects caused by the physical properties of PM2.5, there is potential for toxicity from chemicals present in the particles. PM2.5 comprises various chemical compounds, both inorganic and organic, which originate from different sources, including natural and human activities [7,8,9,10,11]. Because organic pollutants may persist in the environment for a long time, there is an increased to human health with exposure. Therefore, researchers have been concerned with identifying and quantifying organic components in PM2.5 [9,12]
Kadokami et al. developed an automated identification and quantification system database (AIQS-DB) for gas chromatography-mass spectrometry (GC-MS) to simultaneously identify and quantitate almost 1000 targeted compounds from environmental and food samples [5,6,13]. The database essentially contains three factors: the retention times, calibration curves, and quantitation mass fragment of target substances. The AIQS-DB contains standard curves of compounds based on the internal standard (IS)-based method [6]. Compared to conventional GC-MS, this method has advantages in terms of savings in time, labor, and analysis chemicals, as the preparation and analysis process is not required for authentic standards. The AIQS-DB has been effectively applied to the quantification of micropollutants in environmental media, such as river water, sediment, and particulate matter in ambient air in Japan [14], China [13], Australia [15], and Vietnam [6,16,17,18].
To the best of our knowledge, there are very few studies on the trace organic compounds in PM2.5 in Vietnam. In previous studies, 118 semivolatile organic compounds [6] and 195 organic contaminants [17] were detected in particulate matter and settle dusts collected in northern Vietnam, respectively. In the present study, organic micropollutants adsorbed in PM2.5 collected at sites in Hanoi were simultaneously quantified utilizing the AIQS-DB with a GC-MS. Our research results can provide researchers and managers with an overview of organic air pollution in Hanoi, one of the biggest cities in Vietnam [19], supporting the identification of solutions to control and improve the air quality in Hanoi.

2. Materials and Methods

2.1. Reagents

Standard used for predicting retention times: custom retention time index standard (C9-C33) (in hexane, 100 μg/mL, 1 mL), Restek P/N:560295. IS: custom IS (4-Chlorotoluene-d4, 1,4-Dichlorobenzene-d4, Naphthalene-d8, Phenanthrene-d10, Acenaphthene-d10, Fluoranthene-d10, Chrysene-d12, Perylene-d12) (in acetone, 1000 μg/mL, 1 mL), Restek P/N:560294. A mixture of check standards and IS 1 μg/mL was used to calibrate the AIQS-DB system. All organic solvents used were of HPLC grade (Merck).

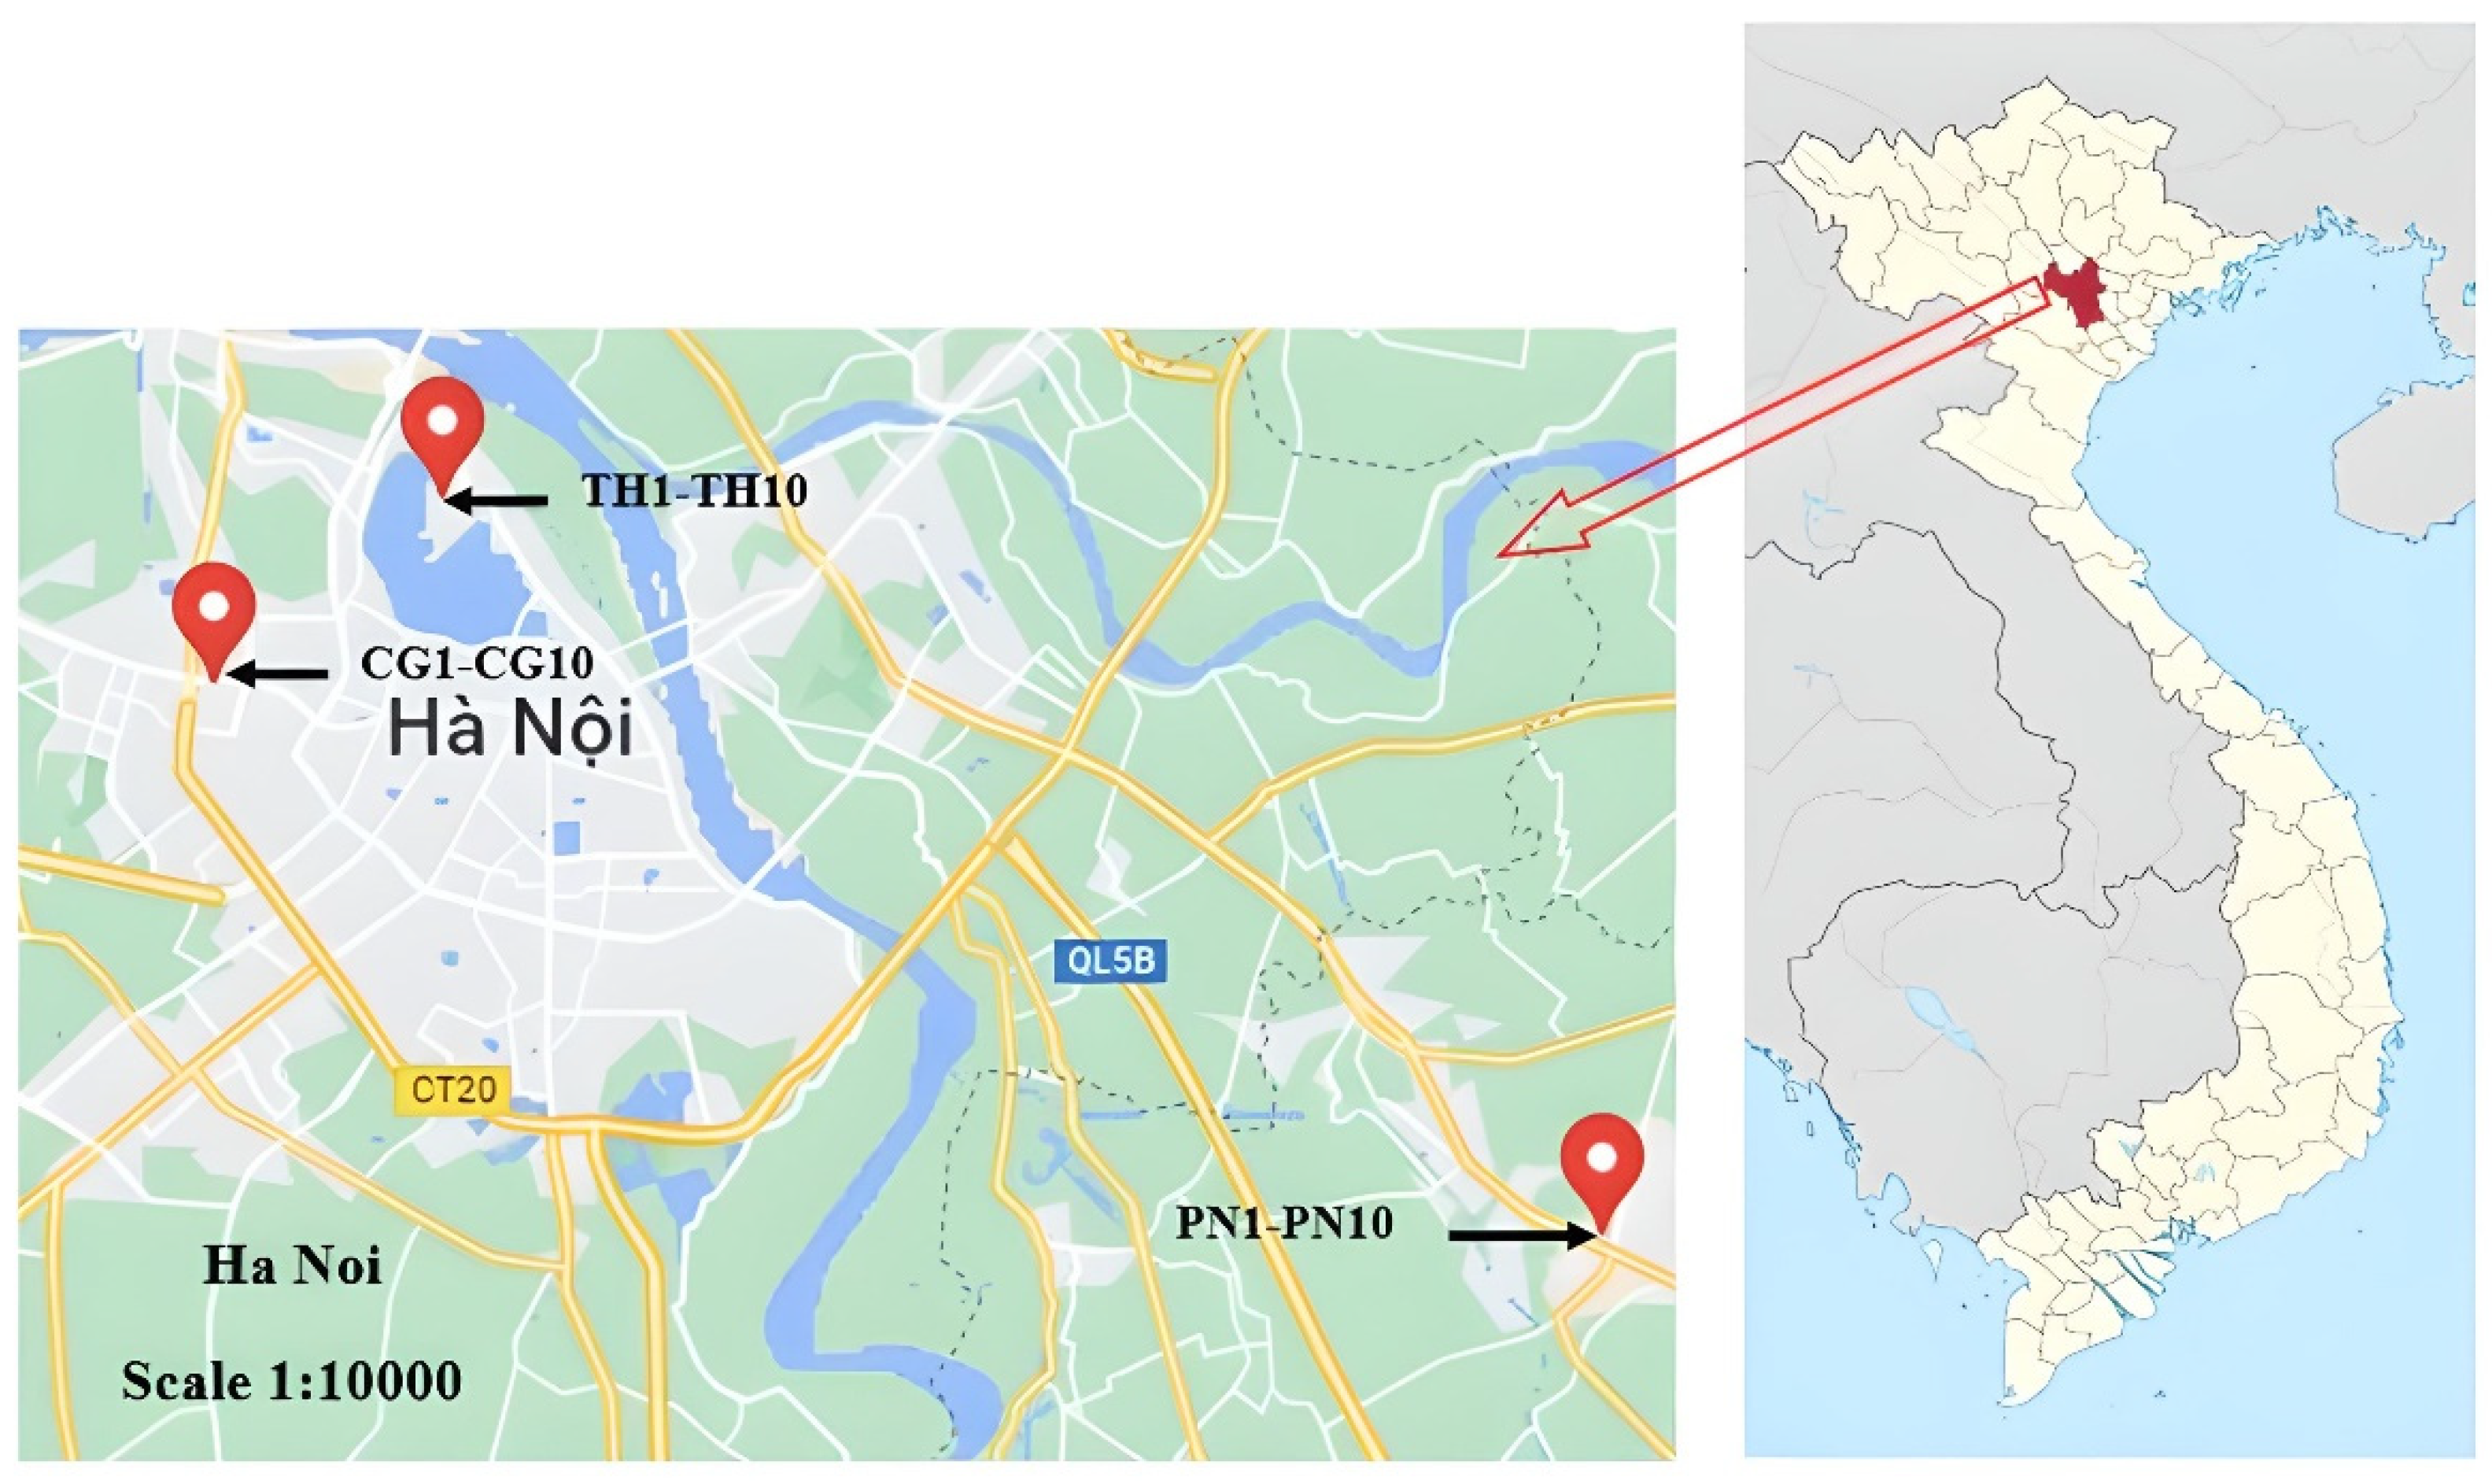
2.2. Sample Collection and Extraction

Thirty fine particulate matter air samples were collected at 3 locations in Hanoi in January 2021 (dry season) (Figure 1). At each location, 10 samples were collected, representing 10 consecutive days. Samples were collected for 10 h from 8 a.m. to 6 p.m. Samples were coded in order of collection and sampling location. Samples PN1–PN10 were collected at one location (20°57′04.6″ N, 106°01′24.3″ E), i.e., Pho Noi (PN) industrial zone, approximately 24 km from the center of Hanoi. TH1–TH10 (21°03′57.9″ N, 105°49′22.1″ E) were collected in Quang Ba ward, Tay Ho (TH) District, where numerous agricultural activities occur, including a large flower market. Samples CG1-CG10 (21°02′12.0″ N, 105°47′01.6″ E) were collected in Cau Giay (CG) District, an urban district of the city with excessive traffic and population density. A high-volume air sampler (Shibata HV-500R, Japan) with cutoff PM2.5 was used for sample collection at an average flow rate of 6 m3/h [20]. The quartz fiber filters was baked at 550 °C for 6h and then stored in a desiccator (48h at a temperature of 25 ± 2 °C and relative humidity of 50 ± 4%) before use. The filters were weighed before and after sampling under the same conditions. After weighting, each filter was wrapped in aluminum foil, kept in a polypropylene bag, and stored at −20 °C until extraction.
The PM2.5 concentration in Hanoi is much higher in the winter months than in the summer months. This trend is attributed to the influences of monsoons, nocturnal radiation inversions, and subsidence temperature inversions [4]. In the winter months, the northeast monsoon carries PM2.5 dust into Hanoi. In addition, in winter, humidity is low, and radiative heat is low in daytime and nighttime, limiting the dispersion of PM2.5 into the atmosphere. On the contrary, in summer, the daytime and nighttime radiative heat create ideal conditions for dust particles to easily disperse into the atmosphere. Rains also clear the air of accumulated PM2.5 in the summer months. These seasonal fluctuations are the main causes leading to variations in PM2.5 content in Hanoi. Duong et al. [6] compared 107 insecticides in atmospheric particulate matter between dry and rainy seasons and identified 19 compounds in samples from both seasons. The study reported higher pesticide concentrations in the dry season. Therefore, to assess the level of organic pollution in PM2.5, winter was chosen as the sampling time in this study.
The samples were extracted by following the method described in the previous study with modifications. In brief, half of the filter from the high-volume air sampler was cut into small pieces, placed in a dark tube, and added to the surrogate. The pieces were extracted with 40 mL hexane:acetone (1:1 v:v) (Merck) in a sonication bath at room temperature for 20 min before centrifuging at 2500 rpm/min for 10 min. The supernatant was transferred into a flask, and the pellet was re-extracted two more times by the same procedure. Then, the extract solutions were combined and concentrated by rotary evaporation to 2 mL and transferred to a tube to evaporate to 0.4 mL utilizing a gentle nitrogen stream. The residue was mixed with 1 µg of IS and brought to a volume of 1 mL with hexane. The IS with exact concentration was added so that the calibration curve could be used with the IS-based method already registered in the AIQS-DB.

2.3. Targeted Analysis of the Air Particulate Samples

Quantitation of the targeted compounds in each sample was conducted using a GC-MS-TQ8040 system (Shimadzu, Kyoto, Japan) in full scan mode and selected ion mode (SIM) equipped with an AIQS-DB, which was described in previous studies (Table S4). A DB-5MS Ultra Inert column (30 m length × 0.25 mm internal diameter × 0.25 µm film thickness, Agilent Technologies, Santa Clara, CA, USA) was used in this study. The injector temperature was 250 °C with helium carrier gas at a linear velocity of 40 cm/s. The temperature of the interface between MS and GC was 300 °C, and the ion source was set to 200 °C. The column oven temperature was set to 40 °C, held for 2 min, and increased to 310 °C (8 °C/min, held for 5 min). One microliter of each concentration was injected into the gas chromatograph in splitless mode. The method detection limits (MDsLs) for the substances were estimated based on the instrument detection limit (IDL) in full scan mode as shown in the previous studies. The organic compounds were validated if the retention times and mass fractions matched the data specified in the system and quantified using standard curve data in AIQS-DB.

2.4. Quality Control

Quality control was conducted by blank and surrogate recovery analysis. Blank samples were processed every five samples for cross verification. Blank concentrations were subtracted from the sample concentrations in the reported data. The accuracy of the method was confirmed by examining the recoveries of 21 surrogates (deuterium-labelled IS), which were spiked to the blank and PM2.5 samples and had the same range of broad physicochemical properties as targeted compounds. The recoveries of the 21 surrogates ranged from 80.5% to 121.5% (Table S5). Relative standard deviations of 21 surrogates were below 20%, which clarified that sample analyses were acceptably precise.

2.5. Meteorological Data

In this study, we collected Hanoi weather data during the sample period from the Weather Underground website (https://www.wunderground.com accessed on 1 February 2021) for Noi Bai airport, which is located approximately 30 km from the sampling location. Hourly data collected for the study site in January 2021 include temperature, humidity, and wind speed. Pooled data for this study were averaged from the data collected during the sampling period from 8 a.m. to 6 p.m. The average results for the day were used to assess the relationship between PM2.5 levels and climatic factors (Table S3).

2.6. Statistical Analysis

Statistical analysis was processed using Microsoft Excel 2010. Single-factor ANOVA was used to determine the differences in concentrations between samples.

3. Results

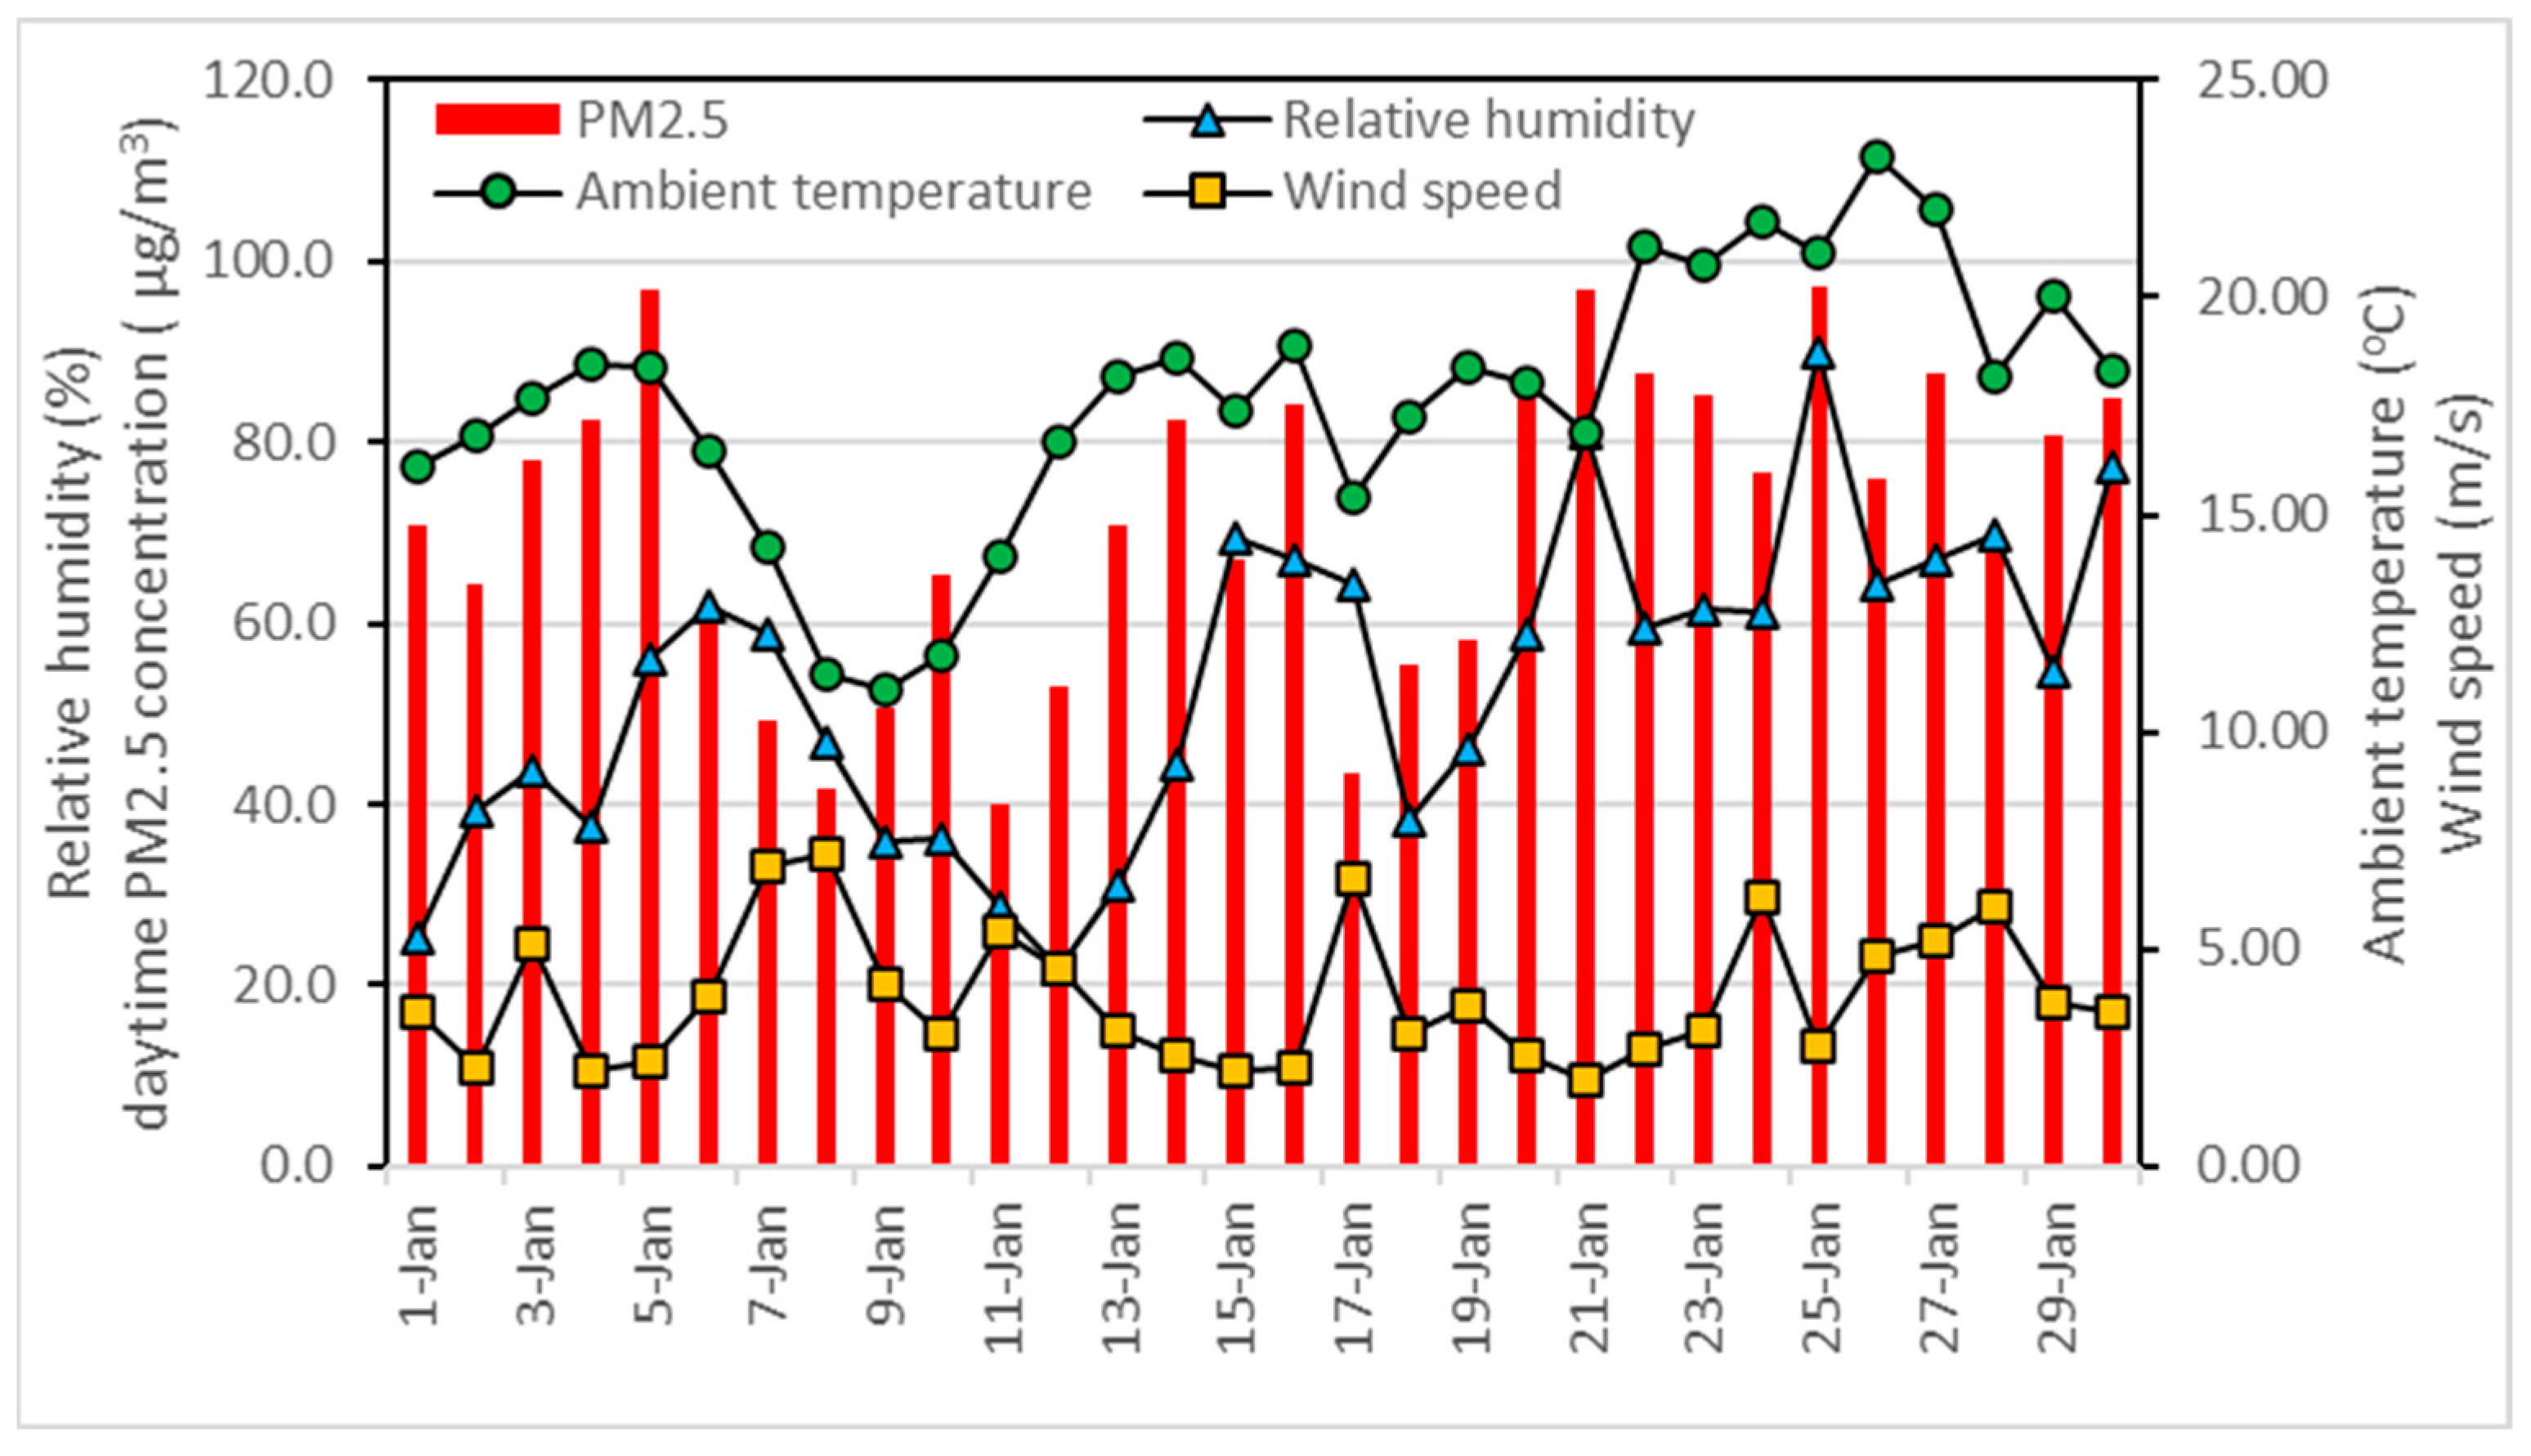
3.1. Concentrations of PM2.5 and Correlations with Meteorogical Variables

Figure 2 shows the daytime average concentration of PM2.5 and meteorological conditions measured at the sampling location in Hanoi in January 2021. Most of the daytime average concentrations of PM2.5 (Table S3) in the month exceeded the allowable limit of PM2.5 content in Vietnam (50 µg.m3), and all results were higher than the level allowed by WHO guidelines [21]. Meteorological parameters such as temperature, air humidity, and wind speed vary from day to day with large differences. It can be easily seen that in January, there are two northeast monsoons affecting the sampling location between the 5th and 8th and between the 16th and 19th, causing a sharp drop in the average daytime temperature, whereas the temperature is stable on the remaining days. There were moderately positive correlations between mean daytime temperature and PM2.5 concentration (R = 0.66), showing that high-temperature days have higher PM2.5 concentrations than low-temperature days. Similarly, there was an average positive correlation between humidity and mean daytime PM2.5 concentration (R = 0.46), showing that the humidity of the air also partly affects the condensation of PM2.5 in the air [22]. In contrast, there were moderately negative correlations between mean daytime PM2.5 concentration and wind speed (R = −0.65) with high-wind days, and dust in the air fluctuated greatly, causing PM2.5 concentrations to decrease significantly [23]. For the total content of trace organic compounds detected in the sample, there was an average positive correlation with the daytime average concentration of PM2.5 (R = 0.51), showing a fairly close association between micropollutants and PM2.5 dust. In summary, meteorological factors and PM2.5 content can affect the content of trace organic compounds. However, the results show that the difference in trace organic contents in the three study corresponds to the three distinct regions of industry, agriculture, and transport.

3.2. Overview of Organic Micropollutant Screening

Two hundred eighty-eight compounds were detected in the samples. The total content of trace organic compounds detected in PM2.5 ranged from 41.08 to 794.80 ng.m−3 (Table S2). These components were classified into 19 pollutant categories and 3 major classes, namely, business/household/traffic, industry, and agriculture. The concentrations of compounds in each category at each site are presented in Table S1. The pollutant contents were significantly different among sampling sites, with an average concentration at TH, CG, and PN for 10 days of sampling of 179.00, 529.41, and 112.13 ng.m−3, respectively. The highest total residue concentration was observed in TH1 at 794.80 ng.m−3, whereas the lowest was found in CG8 at 41.08 ng.m−3 (Table S2).

3.3. Intermediate

Intermediates can be generated via industrial activities. In this study, 26 intermediates were found in 30 PM2.5 samples, which involved dyes, fibers, resins, and organic synthesis processing (Table 1). Chemicals used for dyeing included one quinolone, one anthraquinone, and three aniline derivatives, all with concentrations less than 1.88 ng.m−3. 2,7-dimethyl quinolone was found in samples collected at the CG and PN sites, and benzanthrone was detected only at CG7 at a concentration of 0.05 ng.m−3 (Table S1). Benzanthrone may be generated by military activities in the sampling area [24] that can release trace amounts of this compound.
Sixteen organic synthesizing byproducts were detected in the samples. Total concentrations of these pollutants in samples ranged from 0.08 to 2.83 ng.m−3 (Table 1), and the number of detected compounds per sample varied from 1 to 30. Hexachloroethane was detected in all samples at concentrations ranging from 0.04 to 0.64 ng.m−3, whereas 2-naphthol was detected only in PN2 at 0.11 ng.m−3 (Table S1). Hexachloroethane is a byproduct of chemical production that may cause skin irritation and kidney damage [25]. Four compounds related to resin processing and one byproduct of fiber production were detected. Epsilon-caprolactam, a material used to produce fiber, was detected at approximately 0.50 ng.m−3 in PN2, TH2, and CG1, whereas concentrations were much lower in other samples. Among four resin intermediates, 4-tert-butylphenol was identified in 28 of 30 samples.
The highest concentration of 4-tert-butylphenol was 0.50 ng.m−3 in PN2, whereas the concentrations were ≤0.05 ng.m−3 in other samples. N-butyl acrylate was detected in 14 samples. The samples collected in PN contained the highest contents of this compound, reaching 2.11 ng.m−3. The detection of this compound in PN was reasonable because several textile and garment development activities took places in this area [26]. The concentrations in four other samples varied from 0.01 to 0.80 ng.m−3. Similarly, 2,6-dimethylphenol was detected in only three samples at approximately 0.01 ng.m−3, whereas 3-methoxy-1-butyl acetate was detected only in CG3 at 0.08 ng.m−3.

3.4. Solvents and Reagents

Eight solvents and nine organic reagents were detected in the samples. Hexachlorobutadiene, a solvent used for chlorinated compounds or protective coatings [27], had the highest content among solvent pollutants and was detected in all 30 samples. Sixteen samples contained hexachlorobutadiene concentrations higher than 9 ng.m−3. The highest concentrations were 34.08, 39.88, and 36.54 in PN1, PN2, and PN3, respectively (Table 1). Several waste-treatment facilities are located in the PN industrial park, and the incineration of chlorinate-containing products led to hexachlorobutadiene emissions [28]. In contrast, TH1–TH3 samples showed the lowest hexachlorobutadiene concentrations at approximately 1 ng.m−3.
Ethyl carbamate, a major reagent pollutant, showed trends similar to that of hexachlorobutadiene. PN1 had the highest contents of the compound at 59.02 ng.m−3, followed by PN3 at 47.91 ng.m−3; the lowest concentrations were found in TH and CG samples (Table S1). Ethyl carbamate is used in the textile industry as a crosslinker for permanent pressing textile treatments to create “wash-and-wear” fabric, resulting in high concentrations in the PN area [29].
Among other reagents, N-nitroso-di-n-butylamine and N-nitrosopiperidine were detected in 21 and 20 samples, respectively. Dibenzyl ether and 1-Acetoxy-2-methoxyethane were also detected in approximately five samples.

3.5. Antioxidants

Antioxidant contents ranged from 0.04 to 4.11 ng.m−3 in the samples (Table 2). The detected concentrations of 2,6-di-tert-butyl-4-benzoquinone ranged from 0.03 to 0.33 ng.m−3 in all samples (Table S1). In several samples, 2-tert-butyl-4-methoxyphenol, 4-methyl-2,6-di-t-butylphenol, 3,5-di-tert-butyl-4-hydroxybenzaldehyde, and N-phenyl-2-naphthylamine were detected at concentrations ≤0.65 ng.m−3. These compounds are commonly generated by diesel combustion. Significant differences in bisphenol A (BPA) concentrations were detected among samples. BPA was detected at concentrations ≥1.4 ng.m−3 in 26 samples, reaching levels up to 3.03 ng.m−3 in PN2; however, it was not found in TH1, CG3, CG4, or CG8 (Table S1). BPA is released into the atmosphere via the combustion of plastics and has potential hepatotoxicity, neurotoxicity, and immunotoxicity, even at low concentrations [30,31]. Inhaling the other detected antioxidants, such as phenols, benzaldehyde, and benzoquinone derivatives, may cause headaches, nausea, or sore throat [32,33].

3.6. Non-Ionic Detergent Metabolites and Disinfectants

One non-ionic detergent metabolite and three disinfectants were detected in PM2.5 samples. The highest concentration of 4-tert-octylphenol, a non-ionic detergent, was detected in sample PN2 at 0.35 ng.m−3, followed by CG9 and CG1 at 0.18 and 0.12 ng.m−3, respectively. Among three aromatic disinfectants, the highest content was 3.78 ng.m−3 in CG1, followed by 1.91 ng.m−3 in TH, whereas the lowest content was observed in CG8 at 0.03 ng.m−3 (Table S3). The previous report did not detect these pollutants in atmospheric particulate matter in Hanoi. A proportion of 98% of 4-tert-octylphenol is used in the manufacture of octyl phenol–formaldehyde resins for tire rubber, insulation, paint, printing inks, etc. This compound has the ability to bioaccumulate and is capable of causing hormonal disturbances, greatly affecting reproductive function [34].

3.7. PAHs

Twenty-three constituents of PAH were detected in the samples. Phenanthrene and pyrene were detected in every sample, and 10 other PAHs were found in at least 10 samples. The total PAH concentrations ranged from 0.29 to 4.40 ng.m−3 (Table 1). We detected 11 PAHs listed as high-priority PAH pollutants by the United States Environmental Protection Agency (EPA), namely acenaphthylene, anthracene, benzo[a]pyrene, benzo[ghi]perylene, benzo[b]fluoranthene, benzo[k]fluoranthene, fluoranthene, indeno [1,2,3-cd]pyrene, perylene, phenanthrene, and pyrene.
Diagnostic ratios can be used to predict PAH sources. The pyrogenic index (PI) [35] is an effective indicator to differentiate pyrogenic and petrogenic PAHs. The PI index is defined as the ratio of total of three- to six-ring EPA priority PAHs to five alkylated PAHs, including homolog series of naphthalene, phenanthrene, dibenzothiophene, chrysene, and fluorene. PI values less than 0.05 indicate petrogenic sources, whereas PI values between 0.13 and 2.12 indicate pyrolytic sources. The PI values and methyl phenanthrene-to-phenanthrene (MP/P) ratios of all samples are shown in Table 3. The MP/P ratios were ≤2 in most samples (excluding TH1 and TH2), suggesting the PAHs likely originated from the combustion of fossil fuels and other materials. Increases in traffic and industrial activities in Hanoi before the Lunar New Year may contribute to high PAH levels [1], which have been reported to significantly increase during festivals.

3.8. Plastics

Thirteen pollutants originating from plastics were detected in the samples at concentrations ranging from 2.31 to 35.45 ng.m−3 (Table 2). Total plastic additive concentrations were higher in the industrial and agricultural areas (PN and TH) than CG, an urban area; PN2 had the highest content at 35.45 ng.m−3. Phthalates were the major plastic additive pollutants in PM2.5 samples [36], and six phthalate derivatives were detected (Table S1). Moreover, di-iso-butyl phthalate, di-n-butyl phthalate, and bis(2-ethylhexyl)phthalate were detected in all 30 samples, with concentrations ranging from 0.10 to 19.88 ng.m−3 (median: 1.69 ng.m−3). These compounds are commonly used in Vietnam to plasticize products [37]. The processing, use, and disposal of plastic products are the main source of phthalates in PM2.5. Additionally, three alkylated phenols, two fatty acid esters, and two phosphate derivatives were identified (Table S1).

3.9. Petroleum

The concentrations of petroleum were particularly high in the TH samples. The concentrations in TH1–TH10 ranged from 216.8 to 460.3 ng.m−3 (Table 2). In the TH area, there is a big lake, namely West Lake (5.3 km2), with a lot of tourist ships and floating restaurants. The commercial activities and vehicle parking lead to the release of petroleum compounds because fuel is not burned at suitable temperatures [38]. In TH, the total petroleum concentrations of PN samples were in the range of 21.00–158.70 ng.m−3 (Table 2). There are two highways crossing this area. Petroleum transportation equipment, waste burning, and coal are the main contributors to pollution in this area [39]. The vigorous operation of industrial zones without emission regulations results in high levels of pollution. The total petroleum concentrations were lowest in CG, with a range of 4.2–34.1 ng.m−3 (Table 2). These petroleum emissions are mainly caused by traffic activities [40]. The dust particles under the road accumulate these compounds, and air mixing caused by traffic activities mixes these pollutants with the dust in the air.

3.10. Agricultural Pollutants

One hundred and four pesticides were detected in the PM2.5 samples. A research report on pesticides over 10 years commented on the increase in pesticide use in Vietnam and showed that many banned substances are still detected in agricultural products and have been found mixed into other pesticides [41]. Total pesticide concentrations in samples from agricultural zones (TH1–TH3) were significantly higher than in urban areas (CG1–CG9) (Table S2).
The highest total fungicide contents were found in TH, with concentrations varying from 33.3 to 102.4 ng.m−3 (Table 1). PN1–PN3, CG1, CG2, and CG5 samples contained approximately 30 ng.m3, whereas the values in the other urban area samples (CG2–CG9) were less than 20.00 ng.m3. Similarly, insecticide and pesticide contents in TH1–TH3 samples were much higher than in samples from the PN industrial area, and the urban areas had lower contents of these pollutants (Table S2). Interestingly, herbicides were not detected in TH1–TH3 samples from agricultural areas, and the highest herbicide content was detected in CG1 at 4.71 ng.m3. Six herbicides were detected in at least one sample: mefenacet, etobenzanid, cafenstrole, pyridate, pyrazoxyfen, and flumiclorac-pentyl, all of which are permitted by the Vietnam Ministry of Agriculture and Rural Development (VMARD) [42]. The concentration of each herbicide was <1.00 ng.m−3, except for flumiclorac-pentyl in CG1 (3.51 ng.m3) and pyrazoxyfen in CG4 (3.58 ng.m−3).
Sixty-three insecticides were detected, includes many compounds banned by VMARD. A previous study detected 30 pesticide compounds in PM2.5 samples in Spain [43]. Dieldrin showed the highest contents at 202.5 ng.m3 in TH1, whereas those concentrations were ≥30 ng.m3 in TH2-TH9. Among permitted insecticides, fenpropathrin and spirodiclofen were the most common, found in 28 and 30 samples, respectively. This finding differs from a previous report, in which propargite, imidacloprid, and omethoate were the most common insecticides [44]. The difference may be attributed to different sampling periods and analytical methods [45].
Thirty-five fungicides were identified in the samples, among which captan and captafol were banned by VMARD. Captafol was found at 0.06 ng.m3 in only one sample (CG9), and captan was detected at 0.11–0.2 ng.m3 in four samples (Table S1). Chloroneb and triadimenol II were the most common fungicides [46], observed in 21 of 30 samples. Oxpoconazole fumarate was observed in the highest concentrations at 45.39, 43.43, and 44.80 ng.m3 in TH1, TH2, and TH3, respectively, and other samples contained the compound at ~30 ng.m3.

4. Conclusions

Utilizing GC-MS with the AIQS database, 288 compounds belonging to 19 pollutant groups were detected in PM2.5 samples collected in three areas of Hanoi. Furthermore, the differences in the types of pollutants among urban, agricultural, and industrial areas were apparent. Pesticides were specific to the pollution in the agricultural zone, whereas higher concentrations of chemicals used in manufacturing and other industrial processes comprised the majority of pollutants in the industrial zones. The pollution levels in the urban central district were lower than in other areas. The current study provides a more comprehensive picture of atmospheric PM2.5 pollutants in the capital city of Vietnam, demonstrating an advanced approach for analyzing a large number of compounds in environmental samples. The obtained results illustrate the first baseline data on the organic pollution of fine particulate matter in Hanoi. This research is limited by the small sample size and short sample collection time. The variety of organic micropollutants found in this study warrants further investigation to clarify their source apportionments.

Supplementary Materials

The following supporting information can be downloaded at: https://www.mdpi.com/article/10.3390/atmos13122088/s1. Table S1. Chemical detection of fine particulate samples in Hanoi, Vietnam (ng.m−3), Table S2. Total concentrations of compounds in 19 pollutant categories detected in fine particulate matter (PM2.5) samples collected in Hanoi, Vietnam (ng.m−3), Table S3. The daytime mean concentration of PM2.5 and meteorological conditions during the sampling period in January 2021 and correlation, Table S4. GC-MS parameters, Table S5. Recoveries of 21 surrogate compounds (n = 10), Table S6. The correlation between each category of organic micropollutants and percentages in PM2.5.

Author Contributions

Conceptualization, T.N.-Q. and H.L.-Q.; methodology, T.N.-Q. and H.L.-Q.; software, H.L.-Q. and T.P.T.P.; validation, D.N.-T., M.L.-V. and H.L.-Q.; formal analysis, H.L.-Q. and M.N.-H.; resources, T.N.-Q. and M.B.-Q.; data curation, H.L.-Q. and T.N.-T.; writing—original draft preparation, H.L.-Q. and T.P.T.P.; writing—review and editing, D.N.-T., M.L.-V., A.K. and H.S.; visualization, M.B.-Q.; supervision, T.N.-Q., A.K. and H.S.; project administration, T.N.-Q. and D.N.-T. All authors have read and agreed to the published version of the manuscript.

Funding

This work was supported by the Vietnam Academy of Science and Technology via project “Supporting the transfer of quality management systems and air pollution control policy recommendations in some areas of Vietnam” (grant code QTAT01.01/19-20).

Institutional Review Board Statement

Not applicable.

Informed Consent Statement

Not applicable.

Data Availability Statement

The datasets generated and/or analyzed during the current study are available from the corresponding author upon reasonable request.

Acknowledgments

This research was supported by the Osaka University ASEAN Campuses.

Conflicts of Interest

The authors declare no conflict of interest.

References

  1. Bootdee, S.; Chantara, S.; Prapamontol, T. Determination of PM2.5 and polycyclic aromatic hydrocarbons from incense burning emission at shrine for health risk assessment. Atmos. Pollut. Res. 2016, 7, 680–689. [Google Scholar] [CrossRef] [Green Version]
  2. Ngoc, B.A.P.; Delbarre, H.; Deboudt, K.; Dieudonné, E.; Tran, D.N.; Le Thanh, S.; Pelon, J.; Ravetta, F. Key factors explaining severe air pollution episodes in Hanoi during 2019 winter season. Atmos. Pollut. Res. 2021, 12, 101068. [Google Scholar] [CrossRef]
  3. Popovicheva, O.B.; Shonija, N.K.; Persiantseva, N.; Timofeev, M.; Diapouli, E.; Eleftheriadis, K.; Borgese, L.; Nguyen, X.A. Aerosol pollutants during agricultural biomass burning: A case study in Ba Vi region in Hanoi, Vietnam. Aerosol Atmos. Chem. 2017, 17, 2762–2779. [Google Scholar] [CrossRef]
  4. Ly, B.-T.; Matsumi, Y.; Nakayama, T.; Sakamoto, Y.; Kajii, Y.; Nghiem, T.-D. Characterizing PM2.5 in Hanoi with new high temporal resolution sensor. Aerosol Air Qual. Res 2018, 18, 2487–2497. [Google Scholar] [CrossRef]
  5. Duong, H.T.; Doan, N.H.; Trinh, H.T.; Kadokami, K. Occurrence and risk assessment of herbicides and fungicides in atmospheric particulate matter in Hanoi, Vietnam. Sci. Total Environ. 2021, 787, 147674. [Google Scholar] [CrossRef]
  6. Duong, H.T.; Kadokami, K.; Trinh, H.T.; Phan, T.Q.; Le, G.T.; Nguyen, D.T.; Nguyen, T.T.; Nguyen, D.T. Target screening analysis of 970 semi-volatile organic compounds adsorbed on atmospheric particulate matter in Hanoi, Vietnam. Chemosphere 2019, 219, 784–795. [Google Scholar] [CrossRef]
  7. Allinson, G.; Allinson, M.; Kadokami, K. Combining passive sampling with a GC-MS-database screening tool to assess trace organic contamination of rivers: A pilot study in Melbourne, Australia. Water Air Soil Pollut. 2015, 226, 230. [Google Scholar] [CrossRef]
  8. Borgie, M.; Ledoux, F.; Verdin, A.; Cazier, F.; Greige, H.; Shirali, P.; Courcot, D.; Dagher, Z. Genotoxic and epigenotoxic effects of fine particulate matter from rural and urban sites in Lebanon on human bronchial epithelial cells. Environ. Res. 2015, 136, 352–362. [Google Scholar] [CrossRef]
  9. Toro-Heredia, J.; Jirau-Colón, H.; Jiménez-Vélez, B.D. Linking PM2.5 organic constituents, relative toxicity and health effects in Puerto Rico. Environ. Chall. 2021, 5, 100350. [Google Scholar] [CrossRef]
  10. Miller, C.J.; Runge-Morris, M.; Cassidy-Bushrow, A.E.; Straughen, J.K.; Dittrich, T.M.; Baker, T.R.; Petriello, M.C.; Mor, G.; Ruden, D.M.; O’Leary, B.F.; et al. A Review of Volatile Organic Compound Contamination in Post-Industrial Urban Centers: Reproductive Health Implications Using a Detroit Lens. Int. J. Environ. Res. Public Health 2020, 17, 8755. [Google Scholar] [CrossRef]
  11. Nghiem, T.-D.; Nguyen, T.T.T.; Nguyen, T.T.H.; Ly, B.-T.; Sekiguchi, K.; Yamaguchi, R.; Pham, C.-T.; Ho, Q.B.; Nguyen, M.-T.; Duong, T.N. Chemical characterization and source apportionment of ambient nanoparticles: A case study in Hanoi, Vietnam. Environ. Sci. Pollut. Res. 2020, 27, 30661–30672. [Google Scholar] [CrossRef] [PubMed]
  12. Lelieveld, J.; Evans, J.S.; Fnais, M.; Giannadaki, D.; Pozzer, A. The contribution of outdoor air pollution sources to premature mortality on a global scale. Nature 2015, 525, 367–371. [Google Scholar] [CrossRef] [PubMed]
  13. Kong, L.; Kadokami, K.; Duong, H.T.; Chau, H.T.C. Screening of 1300 organic micro-pollutants in groundwater from Beijing and Tianjin, North China. Chemosphere 2016, 165, 221–230. [Google Scholar] [CrossRef] [PubMed]
  14. Nishimuta, K.; Ueno, D.; Takahashi, S.; Kuwae, M.; Kadokami, K.; Miyawaki, T.; Matsukami, H.; Kuramochi, H.; Higuchi, T.; Koga, Y. Use of comprehensive target analysis for determination of contaminants of emerging concern in a sediment core collected from Beppu Bay, Japan. Environ. Pollut. 2021, 272, 115587. [Google Scholar] [CrossRef] [PubMed]
  15. Allinson, M.; Kadokami, K.; Shiraishi, F.; Nakajima, D.; Zhang, J.; Knight, A.; Gray, S.; Scales, P.; Allinson, G. Wastewater recycling in Antarctica: Performance assessment of an advanced water treatment plant in removing trace organic chemicals. Environ. Pollut. 2018, 224, 122–129. [Google Scholar] [CrossRef]
  16. Trinh, H.T.; Marcussen, H.; Hansen, H.C.B.; Le, G.T.; Duong, H.T.; Ta, N.T.; Nguyen, T.Q.; Hansen, S.; Strobel, B.W. Screening of inorganic and organic contaminants in floodwater in paddy fields of Hue and Thanh Hoa in Vietnam. Environ. Sci. Pollut. Res. 2017, 24, 7348–7358. [Google Scholar] [CrossRef]
  17. Anh, H.Q.; Tomioka, K.; Tue, N.M.; Suzuki, G.; Minh, T.B.; Viet, P.H.; Takahashi, S. Comprehensive analysis of 942 organic micro-pollutants in settled dusts from northern Vietnam: Pollution status and implications for human exposure. J. Mater. Cycles Waste Manag. 2019, 21, 57–66. [Google Scholar] [CrossRef]
  18. Bui, T.H.; Nguyen, D.L.; Nguyen, T.P.M.; Bui, Q.T.; Nguyen, V.D.; Mac, V.D. Chemical characterization, source apportionment, and human health risk assessment of PM2.5 in an urban area in Hanoi, Vietnam. Air Qual. Atmos. Health 2022, 1–15. [Google Scholar] [CrossRef]
  19. Truong, A.H.; Kim, M.T.; Nguyen, T.T.; Nguyen, N.T.; Nguyen, Q.T. Methane, nitrous oxide and ammonia emissions from livestock farming in the Red River Delta, Vietnam: An inventory and projection for 2000–2030. Sustainability 2018, 10, 3826. [Google Scholar] [CrossRef] [Green Version]
  20. Nguyen, T.P.M.; Bui, T.H.; Nguyen, M.K.; Nguyen, T.H.; Vu, V.T.; Pham, H.L. Impact of COVID-19 partial lockdown on PM2.5, SO2, NO2, O3, and trace elements in PM2.5 in Hanoi, Vietnam. Environ. Sci. Pollut. Res. 2022, 29, 41875–41885. [Google Scholar] [CrossRef]
  21. World Health Organization. WHO Global Air Quality Guidelines: Particulate Matter (PM2.5 and PM10), Ozone, Nitrogen Dioxide, Sulfur Dioxide and Carbon Monoxide; World Health Organization: Geneva, Switzerland, 2021. [Google Scholar]
  22. Wang, J.; Wu, J.; Liu, B.; Liu, X.; Gao, H.; Zhang, Y.; Feng, Y.; Han, S.; Gong, X. Exploring the Sensitivity of Visibility to PM2.5 Mass Concentration and Relative Humidity for Different Aerosol Types. Atmosphere 2022, 13, 471. [Google Scholar] [CrossRef]
  23. Ścibor, M.; Bokwa, A.; Balcerzak, B. Impact of wind speed and apartment ventilation on indoor concentrations of PM10 and PM2.5 in Kraków, Poland. Air Qual. Atmos. Health 2020, 13, 553–562. [Google Scholar] [CrossRef] [Green Version]
  24. Peng, F.; Tsuji, G.; Zhang, J.-Z.; Chen, Z.; Furue, M. Potential role of PM2.5 in melanogenesis. Environ. Int. 2019, 132, 105063. [Google Scholar] [CrossRef] [PubMed]
  25. Mobasser, S.; Wager, Y.; Dittrich, T.M. Indoor Air Purification of Volatile Organic Compounds (VOCs) Using Activated Carbon, Zeolite, and Organosilica Sorbents. Ind. Eng. Chem. Res. 2022, 20, 6791–6801. [Google Scholar] [CrossRef]
  26. Cheolmin Lee, Y.G.; Dajeong, L.; Yongseok, C.; Donghyun, L. A study on the perception of indoor concentration due to radon exhalation from domestic building materials. J. Environ. Sci. Int. 2017, 2017, 116. [Google Scholar] [CrossRef] [Green Version]
  27. Balmer, J.E.; Hung, H.; Vorkamp, K.; Letcher, R.J.; Muir, D.C. Hexachlorobutadiene (HCBD) contamination in the Arctic environment: A review. Emerg. Contam. 2019, 5, 116–122. [Google Scholar] [CrossRef]
  28. Wang, L.; Bie, P.; Zhang, J. Estimates of unintentional production and emission of hexachlorobutadiene from 1992 to 2016 in China. Environ. Pollut. 2018, 238, 204–212. [Google Scholar] [CrossRef]
  29. Nadian, M.; Mirzaei, R.; Soltani Mohammadi, S. Application of Moran’sI Autocorrelation in Spatial-Temporal Analysis of PM2.5 Pollutant (A case Study: Tehran City). J. Environ. Health Eng. 2018, 5, 197–213. [Google Scholar] [CrossRef] [Green Version]
  30. Deng, W.-J.; Li, N.; Wu, R.; Richard, W.K.; Wang, Z.; Ho, W. Phosphorus flame retardants and Bisphenol A in indoor dust and PM2.5 in kindergartens and primary schools in Hong Kong. Environ. Pollut. 2018, 235, 365–371. [Google Scholar] [CrossRef]
  31. Munyaneza, J.; Qaraah, F.A.; Jia, Q.; Cheng, H.; Zhen, H.; Xiu, G. Seasonal Trends, Profiles, and Exposure Risk of PM2.5-bound Bisphenol Analogs in Ambient Outdoor Air: A Study in Shanghai, China. Aerosol Air Qual. Res. 2022, 22, 210324. [Google Scholar] [CrossRef]
  32. Sánchez-Piñero, J.; Novo-Quiza, N.; Moreda-Piñeiro, J.; Turnes-Carou, I.; Muniategui-Lorenzo, S.; López-Mahía, P. Multi-class organic pollutants in atmospheric particulate matter (PM2.5) from a Southwestern Europe industrial area: Levels, sources and human health risk. Environ. Res. 2022, 214, 114195. [Google Scholar] [CrossRef] [PubMed]
  33. Zhang, Y.; Xu, C.; Zhang, W.; Qi, Z.; Song, Y.; Zhu, L.; Dong, C.; Chen, J.; Cai, Z. p-Phenylenediamine Antioxidants in PM2.5: The Underestimated Urban Air Pollutants. Environ. Sci. Technol. 2021, 56, 6914–6921. [Google Scholar] [CrossRef] [PubMed]
  34. Wallraff, J.P.; Ungeheuer, F.; Dombrowski, A.; Oehlmann, J.; Vogel, A.L. Occurrence and in vitro toxicity of organic compounds in urban background PM2.5. Sci. Total Environ. 2022, 817, 152779. [Google Scholar] [CrossRef]
  35. Marinaite, I.; Penner, I.; Molozhnikova, E.; Shikhovtsev, M.; Khodzher, T. Polycyclic Aromatic Hydrocarbons in the Atmosphere of the Southern Baikal Region (Russia): Sources and Relationship with Meteorological Conditions. Atmosphere 2022, 13, 420. [Google Scholar] [CrossRef]
  36. Cheng, Y.Y.; Yu, J.Z. Minimizing contamination from plastic labware in the quantification of C16 and C18 fatty acids in filter samples of atmospheric particulate matter and their utility in apportioning cooking source contribution to urban PM2.5. Atmosphere 2020, 11, 1120. [Google Scholar] [CrossRef]
  37. Islam, M.R.; Welker, J.; Salam, A.; Stone, E.A. Plastic Burning Impacts on Atmospheric Fine Particulate Matter at Urban and Rural Sites in the USA and Bangladesh. ACS Environ. Au 2022, 2, 409–417. [Google Scholar] [CrossRef]
  38. Abbasi, S.; Keshavarzi, B. Source identification of total petroleum hydrocarbons and polycyclic aromatic hydrocarbons in PM10 and street dust of a hot spot for petrochemical production: Asaluyeh County, Iran. Sustain. Cities Soc. 2019, 45, 214–230. [Google Scholar] [CrossRef]
  39. Lin, Y.-C.; Li, Y.-C.; Amesho, K.T.; Shangdiar, S.; Chou, F.-C.; Cheng, P.-C. Chemical characterization of PM2.5 emissions and atmospheric metallic element concentrations in PM2.5 emitted from mobile source gasoline-fueled vehicles. Sci. Total Environ. 2020, 739, 139942. [Google Scholar] [CrossRef]
  40. Bozlaker, A.; Peccia, J.; Chellam, S. Indoor/outdoor relationships and anthropogenic elemental signatures in airborne PM2.5 at a high school: Impacts of petroleum refining emissions on lanthanoid enrichment. Environ. Sci. Technol. 2017, 51, 4851–4859. [Google Scholar] [CrossRef]
  41. Anh Le, H.; Quynh Linh, V.T. Investigation of Indoor and Outdoor Air Quality at Elementary Schools in Hanoi, Vietnam. VNU J. Sci. 2020, 36. [Google Scholar] [CrossRef]
  42. Dung, P.; Sharma, S. Responding to climate change in the agriculture and rural development sector in Vietnam. In Redefining Diversity & Dynamics of Natural Resources Management in Asia; Upland Natural Resources and Social Ecological Systems in Northern Vietnam; Elsevier: Amsterdam, The Netherlands, 2017; Volume 2, pp. 13–25. [Google Scholar]
  43. López, A.; Yusà, V.; Muñoz, A.; Vera, T.; Borràs, E.; Ródenas, M.; Coscollà, C. Risk assessment of airborne pesticides in a Mediterranean region of Spain. Sci. Total Environ. 2017, 574, 724–734. [Google Scholar] [CrossRef] [PubMed]
  44. Nascimento, M.M.; da Rocha, G.O.; de Andrade, J.B. Pesticides in fine airborne particles: From a green analysis method to atmospheric characterization and risk assessment. Sci. Rep. 2017, 7, 2267. [Google Scholar] [CrossRef] [PubMed] [Green Version]
  45. Zhou, Y.; Guo, J.; Wang, Z.; Zhang, B.; Sun, Z.; Yun, X.; Zhang, J. Levels and inhalation health risk of neonicotinoid insecticides in fine particulate matter (PM2.5) in urban and rural areas of China. Environ. Int. 2020, 142, 105822. [Google Scholar] [CrossRef]
  46. Nascimento, M.M.; da Rocha, G.O.; de Andrade, J.B. A rapid low-consuming solvent extraction procedure for simultaneous determination of 34 multiclass pesticides associated to respirable atmospheric particulate matter (PM2.5) by GC–MS. Microchem. J. 2018, 139, 424–436. [Google Scholar] [CrossRef]
Figure 1. Sampling locations for PM2.5 dust samples of this study (created by author).
Atmosphere 13 02088 g001
Figure 2. The daytime average concentration of PM2.5 and meteorological conditions during the sampling period in January 2021.
Atmosphere 13 02088 g002
Table 1. The concentration of trace organic compounds derived from industry and agriculture (ng.m−3).
CategoryIntermediates for DyesPAHsSolventsReagentsIntermediates Used in Organic SynthesisIntermediates for ResinPCBsFungicidesHerbicidesInsecticides
PN12.181.8525.7259.520.901.270.3927.280.3421.18
PN21.384.4022.0520.912.831.630.2918.880.0618.98
PN31.841.9438.1648.470.911.790.4229.870.3710.34
PN40.940.2911.5631.310.642.16-13.390.1315.94
PN51.880.4713.0022.900.821.40-13.430.108.66
PN60.870.5420.9522.060.961.77-15.610.103.84
PN71.610.6820.5113.040.691.35-13.130.206.91
PN81.150.4520.7511.520.681.05-20.110.169.83
PN90.800.5712.6210.930.552.07-9.920.098.03
PN101.860.6812.5510.250.561.87-8.430.133.31
TH10.010.959.263.991.770.02-102.40-202.45
TH20.000.756.212.781.080.020.0463.65-149.34
TH30.022.884.421.821.520.040.0458.41-133.33
TH4--4.361.150.980.22-63.02-132.30
TH5--3.220.540.490.19-46.41-107.17
TH6--3.721.782.060.17-33.28-87.06
TH7--1.930.961.820.11-43.68-122.55
TH8--5.660.710.380.21-38.70-96.12
TH9--3.170.270.820.09-45.17-77.37
TH10--4.061.581.270.05-52.15-83.81
CG11.081.2616.6332.720.540.060.2329.654.729.36
CG21.301.2016.7431.580.560.830.2432.180.1227.29
CG31.001.2413.8228.990.370.120.208.970.894.83
CG41.101.8714.8121.380.360.620.2617.113.8722.38
CG51.321.0122.9334.600.470.060.2328.370.9616.19
CG60.930.6614.5420.270.51-0.2215.860.026.19
CG71.091.4912.9925.132.070.020.2314.730.288.98
CG80.561.453.2717.160.08-0.113.460.882.11
CG90.710.679.2413.380.240.030.2410.590.0611.05
CG100.440.235.125.670.110.080.005.33-3.31
Table 2. The concentration of trace organic compounds originating from business/household/traffic (ng.m−3) and total trace organic compounds.
CategoryAntioxidantsCosmeticsDisinfectantsFatty Acid Methyl EsterFragrancesLeaching from TiresPetroleumPlastics MaterialsPPCPsTotal Trace Organic Compounds
PN12.490.140.274.181.534.15158.6821.8535.66163.58
PN24.110.490.099.461.162.7921.0435.453.24158.93
PN32.180.170.234.550.844.96149.3417.3432.1972.45
PN42.08-0.082.340.140.2032.592.4522.81132.20
PN52.840.110.142.320.170.3633.512.1712.03142.86
PN61.57-0.162.850.220.2235.662.4222.6986.64
PN71.67-0.033.080.280.3334.242.2123.72114.87
PN81.900.160.202.550.290.3032.272.9912.9841.08
PN93.24-0.102.290.170.2526.552.3413.5596.67
PN100.60-0.103.270.300.3830.301.8613.8845.18
TH10.665.621.9126.681.782.80419.6611.183.37369.67
TH22.360.140.3424.291.311.16460.2916.0927.31170.74
TH32.44-0.5030.430.870.68456.0625.3927.33345.99
TH40.35-0.1118.463.091.12264.977.5011.69139.03
TH50.40-0.0412.633.391.14298.5313.9322.48116.32
TH60.22-0.126.281.622.07270.7114.2410.36132.50
TH70.55-0.1814.040.511.87287.196.466.02123.67
TH80.46-0.0816.881.231.97262.533.465.41119.33
TH90.39-0.177.501.352.29280.763.706.1794.08
TH100.42-0.127.501.171.00216.795.312.7890.33
CG13.110.163.782.590.981.7534.0517.671.71794.80
CG21.710.110.125.751.061.6518.5416.210.97757.88
CG30.120.010.060.290.351.405.062.312.35746.39
CG40.140.170.131.250.711.5526.6010.835.83509.30
CG51.140.090.146.341.092.1713.849.481.37510.56
CG60.840.070.124.750.711.0611.727.210.71433.68
CG70.960.140.131.710.621.2027.129.625.63487.88
CG80.05-0.030.240.271.604.203.302.30433.81
CG91.790.150.204.271.061.3529.8711.060.45429.22
CG100.570.000.120.830.221.0316.245.700.18377.99
Table 3. Pyrogenic index values and methyl phenanthrene-to-phenanthrene (MP/P) ratios of polycyclic aromatic hydrocarbons detected in PM2.5 samples collected in Hanoi, Vietnam.
LocationPI IndexMP/P
PN11.4531.284
PN21.0250.079
PN30.7900.668
PN40.590-
PN50.913-
PN60.888-
PN70.989-
PN80.530-
PN91.564-
PN101.544-
TH10.1652.619
TH20.4862.381
TH30.3680.324
TH4—TH10--
CG11.1640.810
CG20.3921.001
CG30.1970.000
CG41.1100.403
CG51.9791.902
CG61.1161.417
CG72.1240.776
CG80.130-
CG90.838-
CG10--
Publisher’s Note: MDPI stays neutral with regard to jurisdictional claims in published maps and institutional affiliations.

