Article

Source Apportionment and Toxic Potency of PM2.5-Bound Polycyclic Aromatic Hydrocarbons (PAHs) at an Island in the Middle of Bohai Sea, China

1
Yantai Oceanic Environmental Monitoring Central Station, State Oceanic Administration (SOA), Yantai 264006, China
2
Yantai Ecological Environment Monitoring Center of Shandong Province, Yantai 264000, China
3
School of Resources and Environmental Engineering, Ludong University, Yantai 264025, China
4
CAS Key Laboratory of Coastal Environmental Processes and Ecological Remediation, Yantai Institute of Coastal Zone Research, Chinese Academy of Sciences, Yantai 264003, China
5
Shandong Key Laboratory of Coastal Environmental Processes, Yantai 264003, China
6
Yantai Environmental Monitoring Center, Yantai 264003, China
*
Author to whom correspondence should be addressed.
Atmosphere 2022, 13(5), 699; https://doi.org/10.3390/atmos13050699
Submission received: 30 March 2022 / Revised: 23 April 2022 / Accepted: 26 April 2022 / Published: 28 April 2022

Abstract

:
Polycyclic aromatic hydrocarbons (PAHs) have attracted more attention because of their high atmospheric concentration and toxicity in recent decades. In this study, a total of 60 PM2.5 samples were collected from Beihuangcheng Island in Bohai Sea, China, from August 2017 to March 2018 for analyzing 16 congeners of PAHs (Σ16PAHs). Sources of PAHs were apportioned by a positive matrix factorization (PMF) model and the carcinogenic risk due to exposure to the PAHs was estimated by the toxicity equivalent of BaP (BaPeq). The results showed that the average concentration of Σ16PAHs was 35.3 ± 41.8 ng/m3. The maximum concentration of Σ16PAHs occurred in winter, followed by spring and autumn, and summer. The PMF modeling apportioned the PAHs into four sources, coal combustion, biomass burning, vehicle exhaust, and petroleum release, contributing 43.1%, 25.8%, 24.7%, and 6.39%, respectively. The average ΣBaPeq concentration was 2.32 ± 4.95 ng/m3 during the sampling period, and vehicle exhaust was the largest contributor. The finding indicates that more attention should be paid to reduce the emissions from coal combustion and vehicle exhaust because they were the largest contributors to the PAH concentration in PM2.5 and ΣBaPeq concentration, respectively.

1. Introduction

Polycyclic aromatic hydrocarbons (PAHs) are a class of hydrocarbons with two or more benzene rings, exposure to which can cause cytotoxic, teratogenic, mutagenic, or carcinogenic effects [1,2]. The US Environmental Protection Agency (EPA) identified 16 kinds of PAHs as priority pollutants for control through the assessment of environmental concentration and toxicity. These PAH compounds mainly come from the incomplete combustion and high-temperature pyrolysis of carbon containing substances, which can be divided into natural sources and anthropogenic sources [3]. In areas with more intensive human activities, anthropogenic sources, such as vehicle exhaust emissions (oil combustion), coal combustion, and biomass combustion, are the dominant contributors of PAH burden in the environment [4,5,6]. Much research in recent decades has focused on the contribution of anthropogenic sources to environmental PAHs and their associated health risks [1,7].
Previous studies reported that China has the largest PAH emissions in the world [8], and 1.6% of the lung cancer morbidity in China might be caused by inhalation exposure to PAHs [9]. The Bohai Sea is a semi-enclosed and shallow marginal sea and is one of the most populated and industrialized regions in China [10]. The sea is adjacent to the Liaoning, Hebei, and Shandong Provinces, as well as the Tianjin Municipality [10]. The PAH emissions of Liaoning, Hebei, and Shandong Provinces around the Bohai Sea account for about 20% of the national emissions, and the emissions of neighboring Shanxi, Henan, Anhui, and Jiangsu Provinces account for about 20% of national emissions [11]. The high-intensity emissions of PAHs led to the high pollution levels and health risk exposure around the Bohai Sea [9,12]. As reported in previous studies, the risk of lung cancer caused by inhalation exposure to air PAHs in the region was more than twice the national mean in China in 2009 [9,13]. Therefore, more attention was paid to the source apportionment of PAHs around Bohai Sea, China [5,14].
Diagnostic ratios and receptor models were widely applied to evaluate the source of PAHs in the environment. The method of diagnostic ratios is a common conventional tool for qualitatively determining the potential sources of PAHs according to these PAH congeners with different characteristics [15,16,17]. The receptor models mainly include principal component analysis (PCA), factor analysis/multiple linear regression (FA/MLR), non-negative constraint factor analysis (FA-NNC), positive matrix decomposition model (PMF), UNMIX model, and other methods [18,19]. These receptor models make use of different mathematical algorithms to quantitatively apportion PAHs to their sources by decomposing a data matrix into two or more matrices [18]. Researchers prefer to apply the PMF model to apportion potential sources of PAHs because the model does not require providing source profiles for a model scenario of a source apportionment, and model results have not obviously negative values and better interpretability for source contributions [18,20].
In recent years, the high atmospheric levels of PAHs and their health risks around the Bohai Sea have not received enough serious attention because more concern has been paid to atmospheric levels and health risks of atmospheric fine particles with aerodynamic diameters < 2.5 μm (PM2.5). Significant improvement in PM2.5 pollution occurred around 2017 under the umbrella of the Air Pollution Prevention and Control Action Plan (2013–2017) proposed by the Chinese government in 2013. In order to better understand the atmospheric pollution levels of PAHs and associated health risks around Bohai Sea around the year 2017, PM2.5 samples were collected at an island located in the middle of the Bohai Strait for PAH analysis. The PMF model and diagnostic ratios were used together to apportion PM2.5-bound PAHs sources, and the total toxicity equivalent concentration of Benzo[a]pyrene (BaPeq) was used to assess the health risk exposed to PM2.5-bound PAHs. The major objectives of this study were: (1) to examine the components and temporal variation in PM2.5-bound PAH concentrations; (2) to apportion sources of PM2.5-bound PAHs; (3) to assess human health risk caused by PM2.5-bound PAHs and their contribution from the identified sources.

2. Materials and Methods

2.1. Site Description and Sample Collection

PM2.5 samples were collected from Beihuangcheng Island (38°24′ N, 120°55′ E). As shown in Figure 1, the island is located at the junction of the Bohai Sea and the North Yellow Sea. It is about 65 km from Shandong Peninsula in the south, nearly 43 km from Liaodong Peninsula in the north, and about 185 km from Beijing-Tianjin-Hebei region in the west [21,22]. The island covers an area of about 2.72 km2 and has a coastline of 10.32 km. The island has two administrative villages with a registered population of more than 2400 people. The area of the Beihuangcheng Island is the warm temperate continental monsoon climate, with an annual average temperature of 11.9 °C and annual average precipitation of 560 mm. There are almost no industrial enterprises, and the majority of islanders make a living by fishing and seafood farming. There is no obvious local emission source, which indicates that the air pollution level and source contribution of PAHs in the island can well reflect the background characteristics around the Bohai Sea [5,21,22].
PM2.5 samples were collected at the observation platform of the Beihuangcheng Island Environmental Monitoring Station of the State Oceanic Administration. The observation platform is located at the top of Dengta Mountain. The mountain is about 180 m above sea level, which is the highest point of the island, and there are no buildings in the vicinity of the sampling site.
A Tisch high-flow PM2.5 sampler at a sampling flow rate of 1.13 m3/min from the United States was placed on the monitoring station for PM2.5 collection from 19 August 2017 to 23 March 2018. Samples were collected every third day from 6:00 a.m. (local time) and lasted for 24 h to make it easier to manually change the filters. It can be turned off in case of heavy snow, heavy rain, strong wind, or sampler failure, etc. The delayed longest period was from 24 December 2017 to 24 January of the following year due to the sampler failure. Quartz fiber filters (Whatman, QM-A, 20.3 × 25.4 cm2) were used to collect PM2.5 and these filters were preheated at 450 °C for 6 h in muffle furnace to remove the impurities. Before and after each sampling, quartz fiber filters were subjected to 24 h equilibration at 25 ± 1 °C and 50 ± 2% relative humidity, then analyzed gravimetrically using a Sartorius MC5 electronic microbalance. After weighing, filters were folded, wrapped in aluminum foil, sealed in airtight plastic bags, and then stored at −20 °C freezer in the lab until further analyses. During the sampling period, blank samples were also collected to subtract possible contamination occurring during or after sampling. A total of 60 PM2.5 samples and 6 blank samples were collected. More detailed information was reported in our previous studies [21,22,23].

2.2. Extraction and Analysis of PAHs

Three punches of 47 mm in diameter were cut off from each quartz filter for PAH analysis. The analytical procedures followed the methodology developed in our previous study [5,15,24]. Briefly, all samples were added with five PAH surrogate standard mixtures (Naphthalene-D8, Acenaphthene-D10, Phenanthrene-D10, Chrysene-D12, Perylene-D12 (Supelco, Co., Bellefonte, PA, USA) before extraction. Each sample was extracted continuously for 24 h with 100 mL mixture of acetone and hexane (1:1 v/v) in a Soxhlet apparatus. Activated copper fragments were added in excess to the collection flask to remove elemental sulfur. The extracted solution was concentrated to 1 mL with a rotary evaporator; the silica-alumina column was used to obtain PAHs in the sample. then washed with 20 mL of a mixed solution of dichloromethane: hexane (1:1 by volume) and concentrated to 2 mL. The eluent solvent was concentrated and reduced to a final volume of 250 μL. An amount of 240 ng hexamethylbenzene was added as the internal standard substance to each sample solution before the analysis.
The PAHs were analyzed with an Agilent 7890 gas chromatograph and a mass spectrometer (Agilent 5975C) combined system (GC-MS). The equipped chromatographic column was DB-5MS, 30 m × 0.25 mm × 0.25 μm. Each extract (1 μL) was injected in split less mode, and high-purity nitrogen with a flow rate of 1.3 mL/min was used as the carrier gas. The oven temperature was set at 60 °C, then raised to 290 °C at a rate of 3 °C/min. The temperature of inlet and ion source was 280 °C and 230 °C, respectively. The ion source has an electron bombardment source with an energy of 70 Ev. A total of 16 US EPA priority PAHs were detected, including naphthalene (Nap), acenaphthylene (Acy), acenaphthene (Ace), fluorene (Flu), phenanthrene (Phe), anthracene (Ant), fluoranthene (Flua), pyrene (Pyr), benzo[a]anthracene (BaA), chrysene (Chr), benzo[b]fluoranthene (BbF), benzo[k] fluoranthene (BkF), Benzo[a]pyrene (BaP), indeno [1,2,3-cd]pyrene (InP), Dibenz[a,h]anthracene (DahA), and benzo[ghi]perylene (BghiP).

2.3. Quality Assurance and Quality Control

The instrumental stability was examined daily using PAH standards, and the relative deviation was less than 10%. A real sample, a field blank, and a procedural blank selected randomly were checked with each batch of 10 real samples to assess potential contamination during the analysis, and results showed that the relative deviation of PAH concentrations in duplicates was less than 15%. The target PAH compounds in the procedural and field blanks were not detected. The average recoveries of five PAH surrogates were 73.2%, 89.7%, 87.6%, 98.4%, 102.5%, respectively, ranging from 71.5% to 113.1%. The method detection limits (MDL, defined as the mean blank value plus 3 times the standard deviation) for 16 PAHs ranged from 0.02 to 0.13 ng/sample. The final results were not corrected by surrogate recoveries because the recoveries were in acceptable levels recommended in many analytical methods [25].

2.4. Methods of Source Apportionment

The PMF 5.0 model released by the U.S. EPA was applied to assess sources of PM2.5-bound PAHs in this study. The mathematical algorithm of the model was established based on ME-2 method [20]. The PMF model decomposes an original matrix (V) into two matrices (W and H) with non-negative elements only, which can be expressed as follows:
V i j = r = 1 p W i r H r j + e i j
where p is the number of identified factors and e is the simulated residual error of the components in row i and column j. The model decomposes a matrix by minimizing the objective function (QNMF), as follows:
min Q P M F = f W , H = i = 1 m j = 1 n V i j r = 1 p W i r H r j / u i j 2
where u is the matrix of the uncertainty and the other symbols have the same meaning as the symbols in Equation (1) [20,26]. The input data of PM2.5-bound PAH concentrations were a matrix of 60 × 16. The uncertainty matrix was constructed as follows: if the concentration of jth PAH component of ith sample was lower than the MDL of the component, the corresponding element was 5/6 times the MDL in row i and column j of the uncertainty matrix; otherwise, the corresponding value (Un) in the uncertainty matrix was calculated using the following equation:
U n = U c × C 2 + 0.5 × M D L 2
where Uc is the relative uncertainty of PM2.5-bound PAH component which was set to 10% [27], C is the concentration of the PM2.5-bound PAH component (ng/m3), and MDL is the detection limit of the PAH component (ng/m3). According to the suggestion in the user guide, in order to find the globally optimal solution, the final solution was selected from 100 model results obtained by using a new random seed or starting point for each iteration [20]. Before the PMF modeling, PCA was used to pre-estimate the minimum possible number of sources because the method is able to explain a large number of variables using a smaller number of variables with a minimum information loss [5,15].

2.5. HYSPLIT Model

The hybrid single-particle Lagrangian integrated trajectory (HYSPLIT) model is a complete system for computing simple air parcel trajectories, as well as complex transport, dispersion, chemical transformation, and deposition simulations [28], which is available on the National Oceanic and Atmospheric Administration Air Resource Laboratory website (https://www.arl.noaa.gov/hysplit/, accessed on 21 April 2021. The model was widely used to perform a back trajectory analysis to determine the origin of air masses and establish source–receptor relationships [28]. In this study, the model was applied to generate 120 h backward trajectories with 6 h intervals during the sampling period. These air mass trajectories were calculated starting from the sampling site at 10 m above the ground level. A total of 240 trajectories were obtained and these trajectories were bunched in five clusters according to significant variation of total spatial variance of all trajectories [28]. The observed concentrations of PAHs carried by the five clusters of air masses were compared with each other to assess their potential sources.

2.6. Toxic Potency Assessment of PAHs

An assessment of the potential health risks due to exposure to PM2.5-bound PAHs were carried by estimating the BaPeq. The BaPeq concentration of each PAH congener is assessed by the product of the measured concentration and the corresponding toxicity equivalent factor (TEF). The assessment method is more frequently used, since it is able to reflect both carcinogenic and mutagenic actions [3,29]. The total BaPeq concentration contributed by the 16 PAH congeners were calculated according to the following equation:
B a P e q = i = 1 16 ( C i × T E F i )
where Ci and TEFi are the concentration of ith PM2.5-bound PAH congener and its associated toxicity equivalent factor. The TEF values of 16 PAH components used in this study were given by previous studies [3,5].

3. Results and Discussion

3.1. Concentrations and Compositions of PAHs

The PM2.5-bound PAH concentrations from Beihuangcheng Island in the Bohai Sea from August 2017 to March 2018 are listed in Table 1. The average concentration of PM2.5-bound Σ16PAHs was 35.3 ± 41.8 ng/m3. Among which, the concentrations of two-ring, three-ring, four-ring, five-ring, and six-ring PAHs were 0.66 ± 0.19 ng/m3, 6.97 ± 4.44 ng/m3, 16.2 ± 17.9 ng/m3, 9.33 ± 14.7 ng/m3, and 2.15 ± 9.10 ng/m3, accounting for 1.88%, 19.7%, 45.9%, 26.4%, and 6.10% of Σ16PAH concentration, respectively. The most abundant PAH components were Flua, Pyr, and Phe, with average concentrations of 6.46 ± 6.39 ng/m3, 5.30 ± 5.99 ng/m3, and 5.04 ± 3.59 ng/m3, respectively.
The PAH concentrations in PM2.5 were classified according to the sampling time in seasons: August 2017 was summer (5 samples), September to November 2017 was autumn (29 samples), December 2017 to February 2018 was winter (18 samples), and March 2018 was spring (8 samples). As listed in Table 1, the seasonal concentrations of Σ16PAHs in PM2.5 in summer, autumn, winter of 2017, and spring of 2018 were 9.93 ± 3.89 ng/m3, 30.8 ± 48.9 ng/m3, 45.9 ± 38.0 ng/m3, and 43.7 ± 19.8 ng/m3, respectively. Obviously, the highest concentration of Σ16PAHs was in winter, followed by spring and autumn, and the lowest concentration was in summer. This seasonal feature is very similar to the previous observations in northern China [5,30,31,32,33], although there might be some deviation because only one month’s samples were detected in both spring and summer. As shown in Figure 2 and Table 2, the air mass carrying high concentrations of PAHs were mainly from the northwest region with high-intensity emissions, proved by previous studies [8,11]. Generally, the elevated concentrations in the cold season were mainly attributed to PAH outflow carried by the East Asian winter monsoon from the northwest source region, where PAH concentrations increased significantly due to combustion emission of heating fuels [5,23,34].
Table 3 lists concentrations of PM
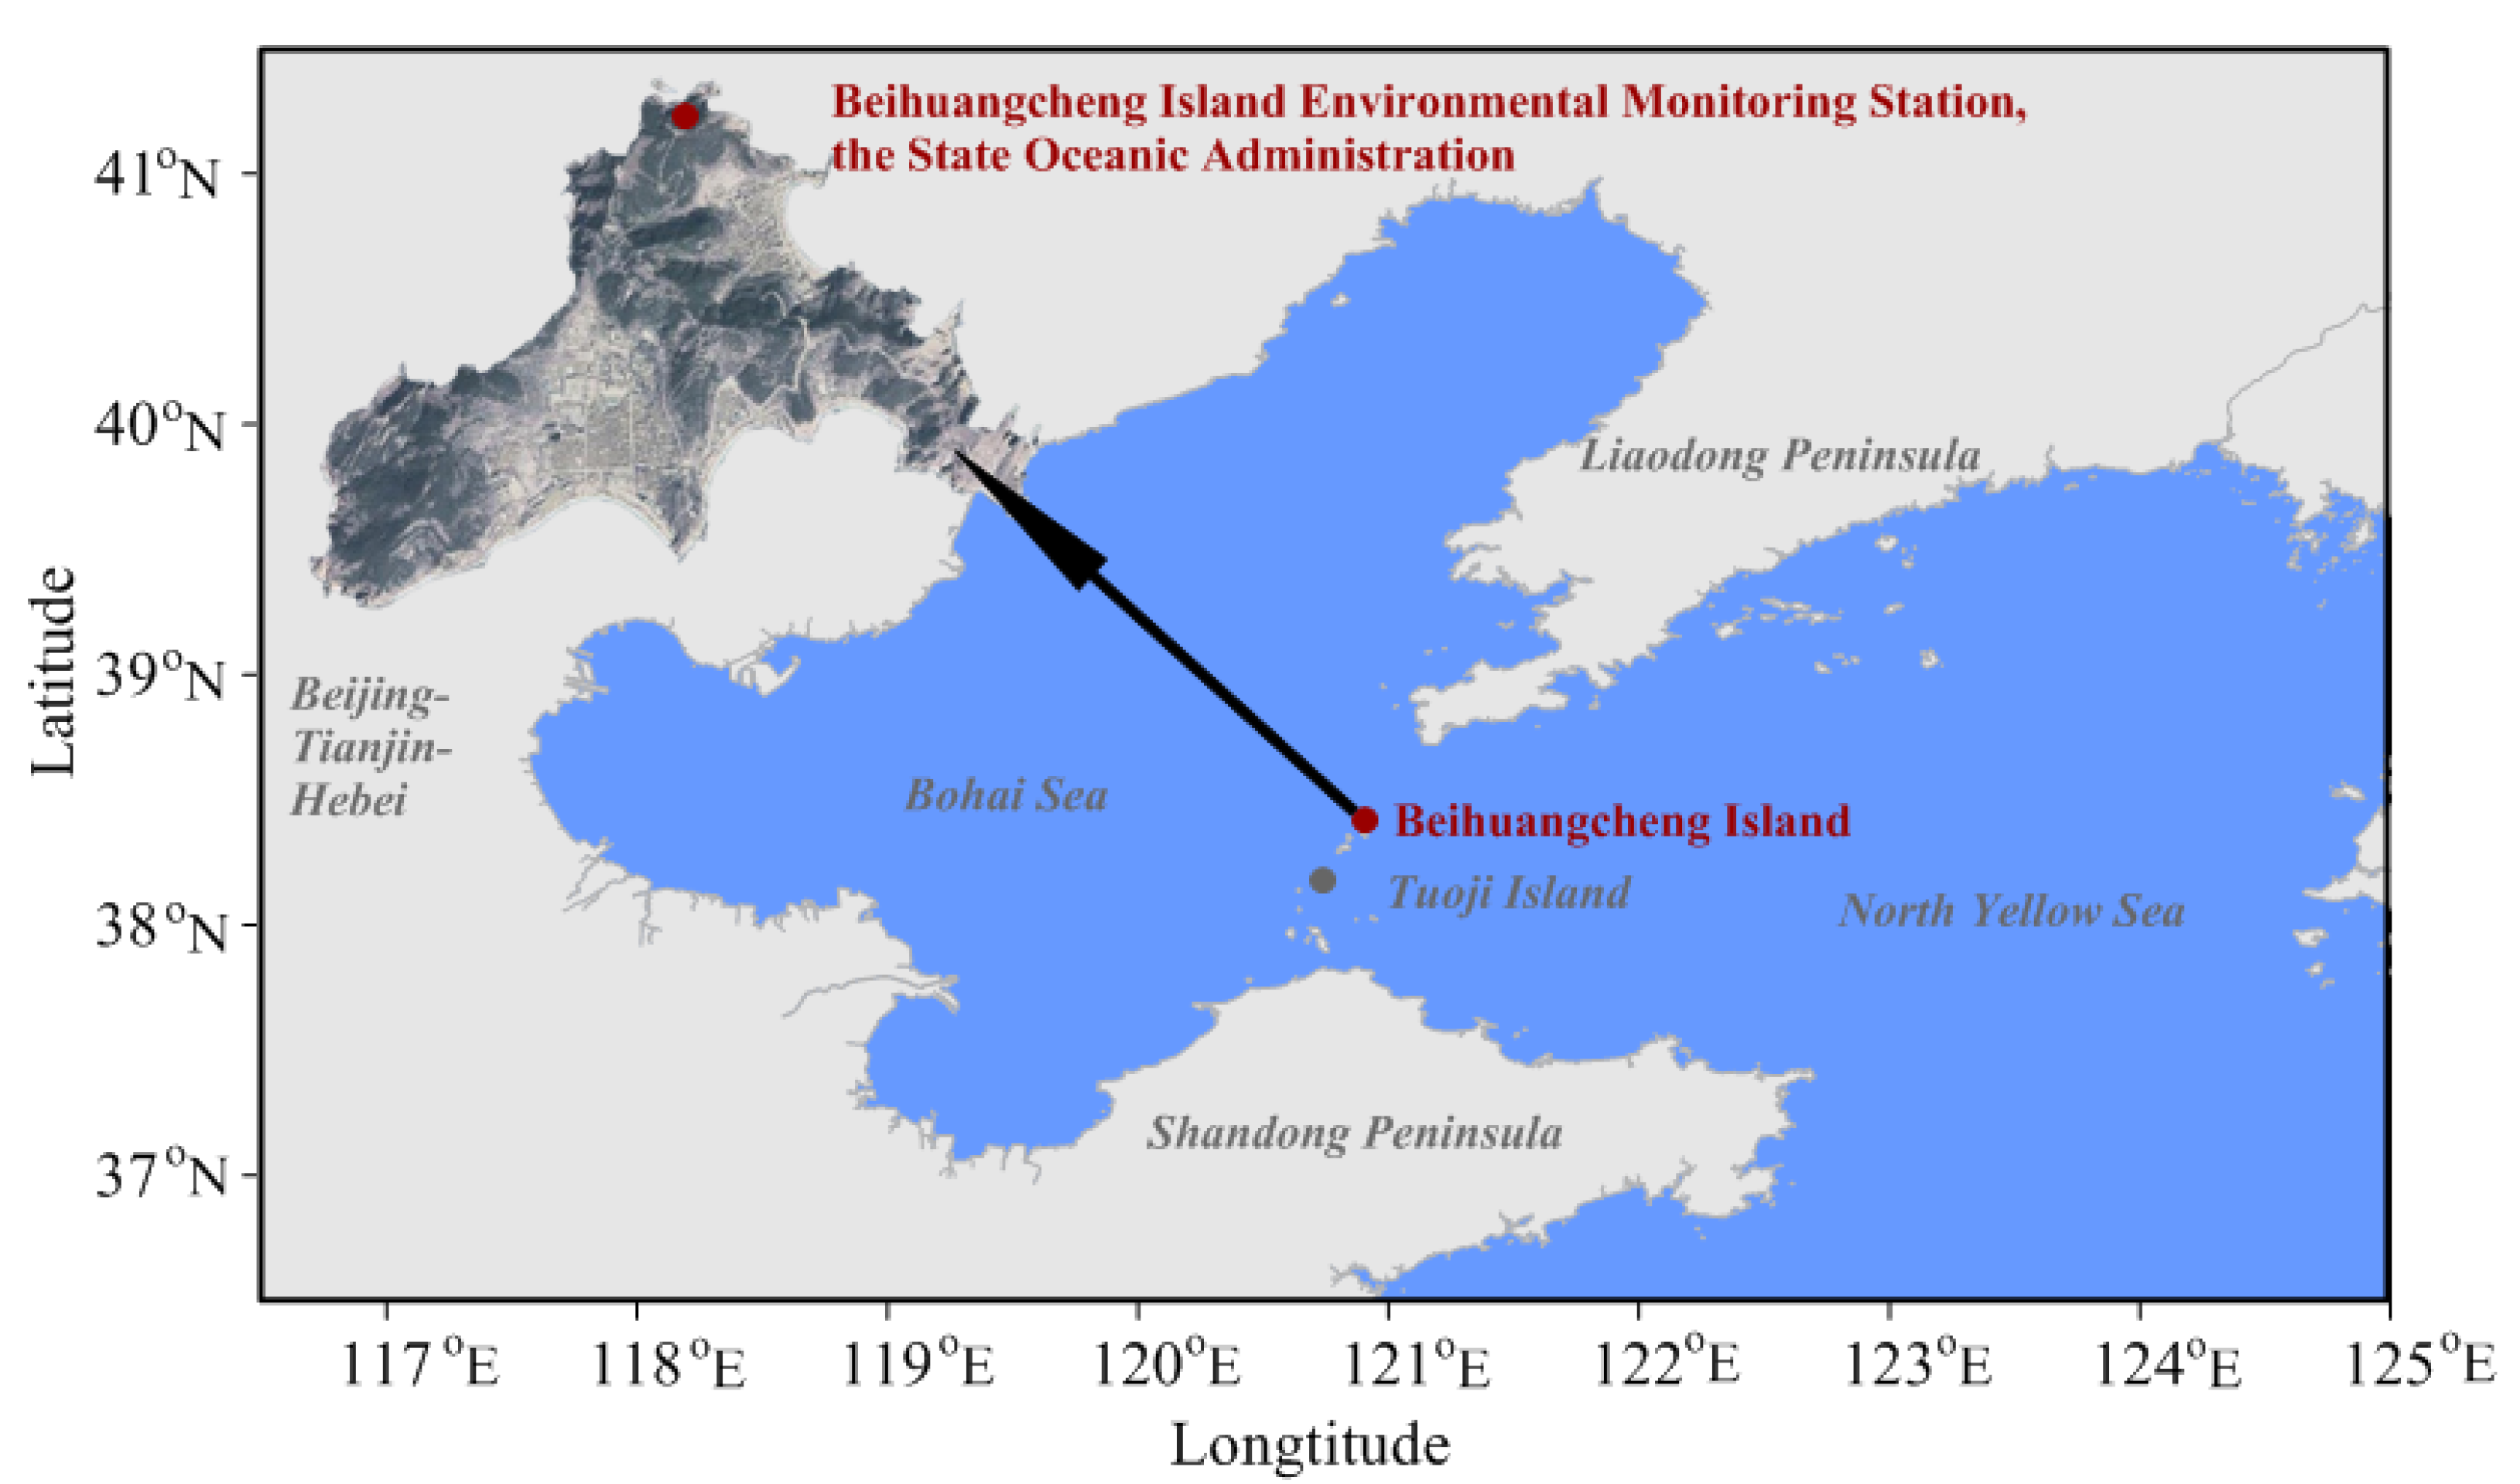
2.5-bound PAHs measured in the present study and reported in previous studies for comparison. The atmospheric concentration of PAHs on Beihuangcheng Island was lower than that in cities of northern China, such as Beijing, Tangshan, Dalian, and Zhengzhou, but was higher than that at a national station for background atmospheric monitoring located at Tuoji Island, which is the closest location where PAH concentrations were reported (see Figure 1). The concentration level was still higher than that in the Yangtze River Delta (e.g., Shanghai, Hangzhou, Hangzhou, Ningbo, Jinhua, Lishui, Zhoushan, and Nanjing) and the Pearl River Delta (e.g., Guangzhou). The comparison indicates that the pollution burden of atmospheric PAHs around the Bohai Sea was severe, at a relatively high level.

3.2. Source Apportionment of PAHs in the Atmosphere

PCA analysis showed that there were three eigenvalues greater than 1 and the three principal components (PC) could explain 83.7% of total variance in PM2.5-bound PAH concentrations. The pre-estimation results indicated that the PM2.5-bound PAH concentrations were mainly contributed to by more than three potential sources. Based on the results, model exercises with factors from three to six were performed. Among the model exercises, the model scenarios with four factors could provide the most physically reasonable source profiles. The Q and Q(robust) values in the PMF model were 2642.3 and 2529.6, respectively. The BS-DISP estimation of the modeling showed that the largest decreases in Q(robust) were <1%, indicating that the results of the base run of the model scenario could be treated as the global optimum solution. The Fpeak model runs with strengths of −1.0, −0.5, 0.5, 1.0, and 1.5 showed increases of Q > 3.9% in Q(robust) from the base run of the model scenario, suggesting that the Fpeak solution should be removed from further consideration.
The source profiles identified by the base run of the PMF modeling are shown in Figure 3. Factor One was considered as biomass burning, typically characterized by relatively high loadings of low molecular weight PAHs such as Acy, Ace, Flu, and Phe [15]. Factor Two showed high proportions to the moderate molecular weight PAHs of Ant, Flua, Pyr, BaA, and Chr, which were treated as coal combustion [44,45]. Factor Three was considered as traffic emission, characterized by relatively high load on high-molecular-weight PAHs such as BghiP, BaP, BkF and BbF [4]. Factor Four was mainly loaded by Nap, Ace, Acy, and Ant, which indicated spills of petroleum or petroleum-related products [14,45].
Table 4 lists measured and modeled concentrations of PAHs in PM2.5 and Figure 4 displays the contributions of the four source factors identified by the PMF modeling to PAHs. The summer, autumn, winter, spring, and average PAH concentrations contributed by the four source factors identified by the PMF modeling were 12.1 ng/m3, 29.2 ng/m3, 45.9 ng/m3, 43.8 ng/m3, and 34.1 ng/m3, which could explain 78.5%, 94.6%, 94.2%, 96.8%, and 96.6% of measured PAH concentrations, respectively. The averaged contributions of biomass burning, coal combustion, traffic emission, and spills of petroleum or petroleum-related products to PM2.5-bound PAH concentrations were 25.8%, 43.1%, 24.7%, and 6.39%, respectively. This result suggested that coal combustion was the primary contributor of PAHs, followed by biomass burning, traffic emission, and petroleum release during the sampling period. The molecular diagnostic ratios of PAHs, such as Ant/(Ant + Phe), Flua/(Flua + Pyr), BaA/(BaA + Chr), and InP/(InP + BghiP), were often used to qualitatively differentiate sources of PAHs in the past studies [17,46]. These diagnostic ratios of PM2.5-bound PAH components in the present study were calculated and are listed in Table 5. The averaged ratios of Ant/(Ant + Phe), Flua/(Flua + Pyr), BaA/(BaA + Chr), and IDP/(IDP + BghiP) of PAHs in this study were 0.22 ± 0.18, 0.55 ± 0.07, 0.35 ± 0.17, and 0.36 ± 0.23, respectively. Among them, the ratio of Ant/(Ant + Phe) was greater than 0.1, indicating dominative contribution of combustion sources, such as biomass burning, coal combustion, and traffic emission [16]. The ratio of Flua/(Flua + Pyr) was greater than 0.5, indicating primary contribution of coal combustion and biomass burning [17]. The ratios of BaA/(BaA + Chr) and InP/(InP + BghiP) were in the range of 0.2 and 0.35 and 0.2 and 0.5, suggesting the dominant contribution of petroleum-based fuel burning [47]. The similar sources identified by the PMF model and the method of diagnostic ratios indicate that the model used in this study can comprehensively apportion PAH sources.
The seasonal contributions of the four source factors identified by the PMF modeling are displayed in Figure 4. The contributions of biomass burning were the highest in summer (45.8%), followed by spring (31.4%), winter (27.6%), and autumn (18.6%). The contribution pattern was similar to that for carbonaceous aerosols and nitrate in PM2.5 on the Bohai Sea because of extensive agricultural waste open burning in fields in the Shandong Peninsula and PAH outflow carried by the East Asian summer monsoon from the emission region [22,23]. The coal combustion contributed 23.8%, 36.1%, 49.4, and 43.8% of PM2.5-bound PAH concentrations in summer, autumn, winter, and spring, respectively. The strongest and weakest contributions were in winter and summer, agreeing extensively with the seasonal source apportionment of atmospheric pollutants over the region [14,22,48]. Traffic emissions accounted for 6.28%, 36.5%, 19.3%, and 21.4% of PM2.5-bound PAH concentrations in summer, autumn, winter, and spring, respectively. Petroleum release contributed 24.2%, 8.82%, 3.61%, and 3.30% of the PAH concentrations in summer, autumn, winter, and spring, respectively. Previous studies reported that petroleum release of river outflow and oil leakage from ships and offshore oil fields (such as Da-Gang and Sheng-Li oil fields) were the important contributors of PAHs in the sediment and air of the Bohai Sea [14,49]. High contribution of the source to PAHs in PM2.5 in the warm season was probably due to volatilization from seawater [14]. The temporal patterns of the source contributions were in agreement with that reported in previous studies [5,14]. As listed in Table 5, the seasonal molecular diagnostic ratios of Ant/(Ant + Phe), Flua/(Flua + Pyr), BaA/(BaA + Chr), and InP/(InP + BghiP) were within defined ranges, indicating that the combustion sources were the main contributors to PM2.5-bound PAH concentrations [16,17].
It is already clear that the contribution of biomass burning increased obviously in summer and the emission source became the preponderant contributor of PM2.5-bound PAH concentrations in the season on the Bohai Sea. Previous studies reported that wheat straw burning usually becomes frequent in summer for quickly eliminating agricultural wastes for the next planting in Shandong [5,23,48,50]. The finding suggests that more attention should be paid to open burning of agricultural waste in the Shandong Peninsula. The contribution of coal combustion emissions increased significantly in winter due to heating needs. This suggests that controlling emissions from coal combustion, especially for civil use, is a more effective means for mitigating atmospheric PAH concentrations in winter on the Bohai Sea.

3.3. Toxic Potency of PAHs and Source Contribution

As listed in Table 1, the average concentration of ΣBaPeq during the sampling period was 2.32 ± 4.95 ng/m3. The concentration was higher than the legal limit (1 ng/m3) of ambient air quality standards established by the Chinese government (GB 3095—2012) and the reference level (0.12 ng/m3) recommended by the World Health Organization (WHO) [5,51]. BaP was the largest contributor of the ΣBaPeq concentration due to the dominant toxicity equivalent factor [3]. The PAH component contributed 37.9% of ΣBaPeq concentration, followed by BbF and BkF (21.1% and 18.5% of the totals) over the sampling period. The finding was similar to that measured at a national background atmospheric monitoring station at Tuoji Island in the Bohai Sea during November 2011 and January 2013 [5].
The seasonal ΣBaPeq concentrations were comparable in spring (2.60 ± 1.84 ng/m3), winter (2.54 ± 3.31 ng/m3), and autumn (2.47 ± 6.49 ng/m3) and were significantly higher than that in summer (0.18 ± 0.16 ng/m3). The average concentration of ΣBaPeq from August 2017 to March 2018 (2.32 ± 4.95 ng/m3) was slightly lower than that monitored at the national background atmospheric monitoring station in the Bohai Sea from November 2011 to January 2013 (2.70 ± 1.88 ng/m3) [5]. The finding suggests that PAH concentration in PM2.5 over the Bohai Sea has slightly decreased. Table 6 lists measured and modeled concentrations of ΣBaPeq in PM2.5 and Figure 5 displays the contribution of four source factors to the ΣBaPeq concentration in PM2.5 identified by the PMF modeling. The averaged contribution proportions of biomass burning, coal combustion, traffic emissions, and spills of petroleum or petroleum-related products were 8.71%, 31.0%, 58.0%, and 2.36%, respectively. The contributions indicate that vehicle exhaust was the largest contributor to potential health risks of exposure to PM2.5-bound PAHs, although the source contributed weakly to PAH concentration in PM2.5 as mentioned above. The difference in the contribution of traffic emissions to PAH concentration and ΣBaPeq concentration is mainly due to the fact that this source emits more PAH components with high toxic potential, such as BaP, than the other sources apportioned by the PMF modeling [3,15,18,19]. As the largest contributor of PAH concentrations in PM2.5 during the sampling period, coal combustion contributed 12.1% less to ΣBaPeq concentration (31.0%) than to PAH concentrations (43.1%). Many previous studies have found that motor vehicles emit a higher proportion of highly toxic PAH components than other sources, e.g., coal combustion, due to the higher temperature of combustion of motor vehicle fuel [11,32,52].
As shown in Figure 5, the seasonal contributions of vehicle exhaust (Factor 3) were 26.2%, 70.7%, 49.5%, and 53.7% in summer, autumn, winter, and spring. The largest contribution of vehicle exhaust occurred in autumn, attributed mainly to the prevailing northwest wind carrying PAHs from the upwind Beijing-Tianjin-Hebei region (see Figure 2) to the Bohai Sea [5,34]. The weakest impact of vehicle exhaust on ΣBaPeq concentration in PM2.5 was in summer, when it was mainly dominated by prevailing southeasterly winds, that is, air masses coming from relatively clean seas [53,54].

4. Conclusions

In this study, PM2.5 samples were collected at an island in Bohai Sea, China, from August 2017 to March 2018. Sixteen US EPA priority PAHs in PM2.5 samples were analyzed, and their sources and toxic potency were assessed. The results showed that the average concentration of Σ16PAHs in the 60 collected samples was 35.3 ± 41.8 ng/m3. The PAH concentrations were dominated by four-ring PAHs (45.9%), followed by five-ring (26.4%), three-ring (19.7%), six-ring (6.10%), and two-ring (1.88%). The predominant PAH components were Flua, Pyr, and Phe. The average concentration of Σ16PAHs reached its maximum in winter, followed by spring and autumn, and summer. The PMF model allowed apportioning four pollution sources related to coal combustion, biomass burning, traffic emission, and petroleum release, contributing 43.1%, 25.8%, 24.7%, and 6.39%, respectively, of PM2.5-bound PAH concentrations during the sampling period. Coal combustion and biomass burning were identified as the main sources of PAHs in PM2.5. The contribution of biomass burning was obviously increased in summer, while that of coal combustion was significantly enlarged in winter. The contribution increases in winter and summer were attributed to additional coal consumption for domestic heating and open burning of agricultural waste in fields, respectively. The averaged ΣBaPeq concentration during the sampling period was 2.32 ± 4.95 ng/m3, which was higher than the legal limit of Chinese ambient air quality standards (GB 3095—2012) and the reference level recommended by the WHO. Vehicle exhaust was the largest contributor to the potential health risks of exposure to PAHs in PM2.5. The finding indicates that more attention should be paid to reducing the emissions from coal combustion and vehicle emissions, which were the largest contributors to the PAH concentration in PM2.5 and ΣBaPeq concentration, respectively. It is worth noting that, as mentioned above, uneven sample number in four seasons because the sampling period did not cover a full year and the sampling delay due to the sampler damage might increase the uncertainty of the analytical results.

Author Contributions

Conceptualization, L.Q. and X.W.; methodology, X.W. and R.S.; software, Q.W. and Y.Z.; validation, L.Y., X.L. and Q.W.; formal analysis, X.L.; investigation, L.Q.; resources, L.Y.; data curation, R.S. and B.L.; writing—original draft preparation, L.Q.; writing—review and editing, L.Y. and X.W.; visualization, L.Y., B.L. and Y.C.; supervision, L.J. and C.T.; project administration, C.T. and L.J.; funding acquisition, L.Y. All authors have read and agreed to the published version of the manuscript.

Funding

This research was funded by the Marine Science and Technology Project of Beihai Branch, Ministry of Natural Resources of China, grant number 2018B16; the National Natural Science Foundation of China, grant number U1806207; and the seed project of Yantai Institute of Coastal Zone Research, Chinese Academy of Sciences, grant number YIC Y855011021.

Institutional Review Board Statement

Not applicable.

Informed Consent Statement

Informed consent was obtained from all subjects involved in the study.

Data Availability Statement

Not applicable.

Acknowledgments

The authors gratefully acknowledge the National Oceanic and Atmospheric Administration’s Air Resources Laboratory for providing the HYSPLIT transport model and the READY website (http://www.arl.noaa.gov/ready.html, accessed on 21 April 2021).

Conflicts of Interest

The authors declare no conflict of interest.

References

  1. Yan, D.; Wu, S.; Zhou, S.; Tong, G.; Li, F.; Wang, Y.; Li, B. Characteristics, sources and health risk assessment of airborne particulate PAHs in Chinese cities: A review. Environ. Pollut. 2019, 248, 804–814. [Google Scholar] [CrossRef] [PubMed]
  2. Gamboa-Loira, B.; López-Carrillo, L.; Mar-Sánchez, Y.; Stern, D.; Cebrián, M.E. Epidemiologic evidence of exposure to polycyclic aromatic hydrocarbons and breast cancer: A systematic review and meta-analysis. Chemosphere 2022, 290, 133237. [Google Scholar] [CrossRef] [PubMed]
  3. Nisbet, I.C.T.; Lagoy, P.K. Toxic equivalency factors (TEFs) for polycyclic aromatic hydrocarbons (PAHs). Regul. Toxicol. Pharmacol. 1992, 16, 290–300. [Google Scholar] [CrossRef]
  4. Ma, L.; Li, B.; Liu, Y.; Sun, X.; Fu, D.; Sun, S.; Thapa, S.; Geng, J.; Qi, H.; Zhang, A.; et al. Characterization, sources and risk assessment of PM2.5-bound polycyclic aromatic hydrocarbons (PAHs) and nitrated PAHs (NPAHs) in Harbin, a cold city in Northern China. J. Clean. Prod. 2020, 264, 121673. [Google Scholar] [CrossRef]
  5. Wang, X.; Zong, Z.; Tian, C.; Chen, Y.; Luo, C.; Tang, J.; Li, J.; Zhang, G. Assessing on toxic potency of PM2.5-bound polycyclic aromatic hydrocarbons at a national atmospheric background site in North China. Sci. Total Environ. 2018, 612, 330–338. [Google Scholar] [CrossRef]
  6. Cui, S.; Song, Z.; Zhang, L.; Zhang, Z.; Hough, R.; Fu, Q.; An, L.; Shen, Z.; Li, Y.-F.; Liu, D.; et al. Polycyclic aromatic hydrocarbons in fresh snow in the city of Harbin in northeast China. Atmos. Environ. 2019, 215, 116915. [Google Scholar] [CrossRef]
  7. Ma, S.; Lin, M.; Tang, J.; Liu, R.; Yang, Y.; Yu, Y.; Li, G.; An, T. Occurrence and fate of polycyclic aromatic hydrocarbons from electronic waste dismantling activities: A critical review from environmental pollution to human health. J. Hazard. Mater. 2022, 424, 127683. [Google Scholar] [CrossRef]
  8. Shen, H.; Huang, Y.; Wang, R.; Zhu, D.; Li, W.; Shen, G.; Wang, B.; Zhang, Y.; Chen, Y.; Lu, Y.; et al. Global Atmospheric Emissions of Polycyclic Aromatic Hydrocarbons from 1960 to 2008 and Future Predictions. Environ. Sci. Technol. 2013, 47, 6415–6424. [Google Scholar] [CrossRef] [Green Version]
  9. Zhang, Y.; Tao, S.; Shen, H.; Ma, J. Inhalation exposure to ambient polycyclic aromatic hydrocarbons and lung cancer risk of Chinese population. Proc. Natl. Acad. Sci. USA 2009, 106, 21063–21067. [Google Scholar] [CrossRef] [Green Version]
  10. Liang, X.; Tian, C.; Zong, Z.; Wang, X.; Jiang, W.; Chen, Y.; Ma, J.; Luo, Y.; Li, J.; Zhang, G. Flux and source-sink relationship of heavy metals and arsenic in the Bohai Sea, China. Environ. Pollut. 2018, 242, 1353–1361. [Google Scholar] [CrossRef]
  11. Xu, S.; Liu, W.; Tao, S. Emission of Polycyclic Aromatic Hydrocarbons in China. Environ. Sci. Technol. 2006, 40, 702–708. [Google Scholar] [CrossRef] [PubMed]
  12. Wang, J.-Z.; Zhu, C.-Z.; Chen, T.-H. PAHs in the Chinese environment: Levels, inventory mass, source and toxic potency assessment. Environ. Sci. Process. Impacts 2013, 15, 1104–1112. [Google Scholar] [CrossRef] [PubMed]
  13. Lian, L.; Huang, T.; Ling, Z.; Li, S.; Li, J.; Jiang, W.; Gao, H.; Tao, S.; Liu, J.; Xie, Z.; et al. Interprovincial trade driven relocation of polycyclic aromatic hydrocarbons and lung cancer risk in China. J. Clean. Prod. 2021, 280, 124368. [Google Scholar] [CrossRef]
  14. Wang, Y.; Zhang, Q.; Zhang, Y.; Zhao, H.; Tan, F.; Wu, X.; Chen, J. Source apportionment of polycyclic aromatic hydrocarbons (PAHs) in the air of Dalian, China: Correlations with six criteria air pollutants and meteorological conditions. Chemosphere 2019, 216, 516–523. [Google Scholar] [CrossRef] [PubMed]
  15. Liu, H.; Li, B.; Qi, H.; Ma, L.; Xu, J.; Wang, M.; Ma, W.; Tian, C. Source Apportionment and Toxic Potency of Polycyclic Aromatic Hydrocarbons (PAHs) in the Air of Harbin, a Cold City in Northern China. Atmosphere 2021, 12, 297. [Google Scholar] [CrossRef]
  16. Katsoyiannis, A.; Sweetman, A.J.; Jones, K.C. PAH Molecular Diagnostic Ratios Applied to Atmospheric Sources: A Critical Evaluation Using Two Decades of Source Inventory and Air Concentration Data from the UK. Environ. Sci. Technol. 2011, 45, 8897–8906. [Google Scholar] [CrossRef]
  17. Dvorská, A.; Lammel, G.; Klanova, J. Use of diagnostic ratios for studying source apportionment and reactivity of ambient polycyclic aromatic hydrocarbons over Central Europe. Atmos. Environ. 2011, 45, 420–427. [Google Scholar] [CrossRef]
  18. Belis, C.A.; Karagulian, F.; Larsen, B.R.; Hopke, P.K. Critical review and meta-analysis of ambient particulate matter source apportionment using receptor models in Europe. Atmos. Environ. 2013, 69, 94–108. [Google Scholar] [CrossRef]
  19. Hopke, P.K. A review of receptor modeling methods for source apportionment. J. Air Waste Manag. Assoc. 2016, 66, 237–259. [Google Scholar] [CrossRef]
  20. Norris, G.; Duvall, R. EPA Positive Matrix Factorization (PMF) 5.0 Fundamentals and User Guide; EPA/600/R-14/108; U.S. Environmental Protection Agency National Exposure Research Laboratory: Washington, DC, USA, 2014; pp. 1–124.
  21. Zong, Z.; Wang, X.; Tian, C.; Chen, Y.; Fu, S.; Qu, L.; Ji, L.; Li, J.; Zhang, G. PMF and PSCF based source apportionment of PM2.5 at a regional background site in North China. Atmos. Res. 2018, 203, 207–215. [Google Scholar] [CrossRef] [Green Version]
  22. Zong, Z.; Wang, X.; Tian, C.; Chen, Y.; Fang, Y.; Zhang, F.; Li, C.; Sun, J.; Li, J.; Zhang, G. First Assessment of NOx Sources at a Regional Background Site in North China Using Isotopic Analysis Linked with Modeling. Environ. Sci. Technol. 2017, 51, 5923–5931. [Google Scholar] [CrossRef]
  23. Wang, X.; Chen, Y.; Tian, C.; Huang, G.; Fang, Y.; Zhang, F.; Zong, Z.; Li, J.; Zhang, G. Impact of agricultural waste burning in the Shandong Peninsula on carbonaceous aerosols in the Bohai Rim, China. Sci. Total Environ. 2014, 481, 311–316. [Google Scholar] [CrossRef]
  24. Liu, D.; Xu, Y.; Chaemfa, C.; Tian, C.; Li, J.; Luo, C.; Zhang, G. Concentrations, seasonal variations, and outflow of atmospheric polycyclic aromatic hydrocarbons (PAHs) at Ningbo site, Eastern China. Atmos. Pollut. Res. 2014, 5, 203–209. [Google Scholar] [CrossRef] [Green Version]
  25. Liu, R.; Ma, S.; Li, G.; Yu, Y.; An, T. Comparing pollution patterns and human exposure to atmospheric PBDEs and PCBs emitted from different e-waste dismantling processes. J. Hazard. Mater. 2019, 369, 142–149. [Google Scholar] [CrossRef] [PubMed]
  26. Paatero, P.; Eberly, S.; Brown, S.G.; Norris, G.A. Methods for estimating uncertainty in factor analytic solutions. Atmos. Meas. Tech. 2014, 7, 781–797. [Google Scholar] [CrossRef] [Green Version]
  27. Saba, T.; Su, S. Tracking polychlorinated biphenyls (PCBs) congener patterns in Newark Bay surface sediment using principal component analysis (PCA) and positive matrix factorization (PMF). J. Hazard. Mater. 2013, 260, 634–643. [Google Scholar] [CrossRef] [PubMed]
  28. Stein, A.F.; Draxler, R.R.; Rolph, G.D.; Stunder, B.J.B.; Cohen, M.D.; Ngan, F. NOAA’s HYSPLIT Atmospheric Transport and Dispersion Modeling System. Bull. Am. Meteorol. Soc. 2015, 96, 2059–2077. [Google Scholar] [CrossRef]
  29. Callén, M.S.; Iturmendi, A.; López, J.M. Source apportionment of atmospheric PM2.5-bound polycyclic aromatic hydrocarbons by a PMF receptor model. Assessment of potential risk for human health. Environ. Pollut. 2014, 195, 167–177. [Google Scholar] [CrossRef]
  30. Hong, W.-J.; Jia, H.; Yang, M.; Li, Y.-F. Distribution, seasonal trends, and lung cancer risk of atmospheric polycyclic aromatic hydrocarbons in North China: A three-year case study in Dalian city. Ecotoxicol. Environ. Saf. 2020, 196, 110526. [Google Scholar] [CrossRef]
  31. Liu, W.; Xu, Y.; Zhao, Y.; Liu, Q.; Yu, S.; Liu, Y.; Wang, X.; Liu, Y.; Tao, S.; Liu, W. Occurrence, source, and risk assessment of atmospheric parent polycyclic aromatic hydrocarbons in the coastal cities of the Bohai and Yellow Seas, China. Environ. Pollut. 2019, 254, 113046. [Google Scholar] [CrossRef]
  32. Feng, B.; Li, L.; Xu, H.; Wang, T.; Wu, R.; Chen, J.; Zhang, Y.; Liu, S.; Ho, S.S.H.; Cao, J.; et al. PM2.5-bound polycyclic aromatic hydrocarbons (PAHs) in Beijing: Seasonal variations, sources, and risk assessment. J. Environ. Sci. 2019, 77, 11–19. [Google Scholar] [CrossRef] [PubMed]
  33. Jiang, N.; Li, L.; Wang, S.; Li, Q.; Dong, Z.; Duan, S.; Zhang, R.; Li, S. Variation tendency of pollution characterization, sources, and health risks of PM2.5-bound polycyclic aromatic hydrocarbons in an emerging megacity in China: Based on three-year data. Atmos. Res. 2019, 217, 81–92. [Google Scholar] [CrossRef]
  34. Feng, J.L.; Guo, Z.G.; Zhang, T.R.; Yao, X.H.; Chan, C.K.; Fang, M. Source and formation of secondary particulate matter in PM2.5 in Asian continental outflow. J. Geophys. Res. Earth Surf. 2012, 117, D03302. [Google Scholar] [CrossRef] [Green Version]
  35. Gao, Y.; Ji, H. Characteristics of polycyclic aromatic hydrocarbons components in fine particle during heavy polluting phase of each season in urban Beijing. Chemosphere 2018, 212, 346–357. [Google Scholar] [CrossRef] [PubMed]
  36. Zhang, L.; Xu, H.; Fang, B.; Wang, H.; Yang, Z.; Yang, W.; Hao, Y.; Wang, X.; Wang, Q.; Wang, M. Source Identification and Health Risk Assessment of Polycyclic Aromatic Hydrocarbon-Enriched PM 2.5 in Tangshan, China. Environ. Toxicol. Chem. 2020, 39, 458–467. [Google Scholar] [CrossRef]
  37. Jia, J.; Deng, L.; Bi, C.; Jin, X.; Zeng, Y.; Chen, Z. Seasonal variations, gas-PM2.5 partitioning and long-distance input of PM2.5-bound and gas-phase polycyclic aromatic hydrocarbons in Shanghai, China. Atmos. Environ. 2021, 252, 118335. [Google Scholar] [CrossRef]
  38. Wang, Q.; Liu, M.; Yu, Y.; Li, Y. Characterization and source apportionment of PM2.5-bound polycyclic aromatic hydrocarbons from Shanghai city, China. Environ. Pollut. 2016, 218, 118–128. [Google Scholar] [CrossRef]
  39. Lu, H.; Wang, S.; Li, Y.; Gong, H.; Han, J.; Wu, Z.; Yao, S.; Zhang, X.; Tang, X.; Jiang, B. Seasonal variations and source apportionment of atmospheric PM2.5-bound polycyclic aromatic hydrocarbons in a mixed multi-function area of Hangzhou, China. Environ. Sci. Pollut. Res. 2017, 24, 16195–16205. [Google Scholar] [CrossRef]
  40. Mo, Z.; Wang, Z.; Mao, G.; Pan, X.; Wu, L.; Xu, P.; Chen, S.; Wang, A.; Zhang, Y.; Luo, J.; et al. Characterization and health risk assessment of PM2.5-bound polycyclic aromatic hydrocarbons in 5 urban cities of Zhejiang Province, China. Sci. Rep. 2019, 9, 7296. [Google Scholar] [CrossRef]
  41. Chen, C.; Xia, Z.; Wu, M.; Zhang, Q.; Wang, T.; Wang, L.; Yang, H. Concentrations, Source Identification, and Lung Cancer Risk Associated with Springtime PM2.5-Bound Polycyclic Aromatic Hydrocarbons (PAHs) in Nanjing, China. Arch. Environ. Contam. Toxicol. 2017, 73, 391–400. [Google Scholar] [CrossRef]
  42. Liu, J.; Man, R.; Ma, S.; Li, J.; Wu, Q.; Peng, J. Atmospheric levels and health risk of polycyclic aromatic hydrocarbons (PAHs) bound to PM2.5 in Guangzhou, China. Mar. Pollut. Bull. 2015, 100, 134–143. [Google Scholar] [CrossRef] [PubMed]
  43. Gao, B.; Guo, H.; Wang, X.-M.; Zhao, X.-Y.; Ling, Z.-H.; Zhang, Z.; Liu, T.-Y. Polycyclic aromatic hydrocarbons in PM2.5 in Guangzhou, southern China: Spatiotemporal patterns and emission sources. J. Hazard. Mater. 2012, 239-240, 78–87. [Google Scholar] [CrossRef] [PubMed]
  44. Shen, R.; Liu, Z.; Chen, X.; Wang, Y.; Wang, L.; Liu, Y.; Li, X. Atmospheric levels, variations, sources and health risk of PM2.5-bound polycyclic aromatic hydrocarbons during winter over the North China Plain. Sci. Total Environ. 2019, 655, 581–590. [Google Scholar] [CrossRef] [PubMed]
  45. Chen, P.; Liang, J. Polycyclic aromatic hydrocarbons in green space soils in Shanghai: Source, distribution, and risk assessment. J. Soils Sediments 2021, 21, 967–977. [Google Scholar] [CrossRef]
  46. Yunker, M.B.; Macdonald, R.W.; Vingarzan, R.; Mitchell, R.H.; Goyette, D.; Sylvestre, S. PAHs in the Fraser River basin: A critical appraisal of PAH ratios as indicators of PAH source and composition. Org. Geochem. 2002, 33, 489–515. [Google Scholar] [CrossRef]
  47. Tobiszewski, M.; Namiesnik, J. PAH diagnostic ratios for the identification of pollution emission sources. Environ. Pollut. 2012, 162, 110–119. [Google Scholar] [CrossRef]
  48. Wang, X.; Zong, Z.; Tian, C.; Chen, Y.; Luo, C.; Li, J.; Zhang, G.; Luo, Y. Combining Positive Matrix Factorization and Radiocarbon Measurements for Source Apportionment of PM2.5 from a National Background Site in North China. Sci. Rep. 2017, 7, 10648. [Google Scholar] [CrossRef] [Green Version]
  49. Lin, T.; Hu, L.; Guo, Z.; Qin, Y.; Yang, Z.; Zhang, G.; Zheng, M. Sources of polycyclic aromatic hydrocarbons to sediments of the Bohai and Yellow Seas in East Asia. J. Geophys. Res. Earth Surf. 2011, 116, D23305. [Google Scholar] [CrossRef]
  50. Lu, W.; Yang, L.; Chen, J.; Wang, X.; Li, H.; Zhu, Y.; Wen, L.; Xu, C.; Zhang, J.; Zhu, T.; et al. Identification of concentrations and sources of PM2.5-bound PAHs in North China during haze episodes in 2013. Air Qual. Atmos. Health 2016, 9, 823–833. [Google Scholar] [CrossRef]
  51. Garrido, A.; Jiménez-Guerrero, P.; Ratola, N. Levels, trends and health concerns of atmospheric PAHs in Europe. Atmos. Environ. 2014, 99, 474–484. [Google Scholar] [CrossRef]
  52. He, J.; Fan, S.; Meng, Q.; Sun, Y.; Zhang, J.; Zu, F. Polycyclic aromatic hydrocarbons (PAHs) associated with fine particulate matters in Nanjing, China: Distributions, sources and meteorological influences. Atmos. Environ. 2014, 89, 207–215. [Google Scholar] [CrossRef]
  53. Tian, C.; Ma, J.; Liu, L.; Jia, H.; Xu, D.; Li, Y.-F. A modeling assessment of association between East Asian summer monsoon and fate/outflow of α-HCH in Northeast Asia. Atmos. Environ. 2009, 43, 3891–3901. [Google Scholar] [CrossRef]
  54. Xu, Y.; Tian, C.; Zhang, G.; Ming, L.; Wang, Y.; Chen, Y.; Tang, J.; Li, J.; Luo, C. Influence of monsoon system on α-HCH fate in Asia: A model study from 1948 to 2008. J. Geophys. Res. Atmos. 2013, 118, 6764–6770. [Google Scholar] [CrossRef]
Figure 1. The location of the sampling site on the Beihuangcheng Island.
Atmosphere 13 00699 g001
Figure 2. The 120 h back trajectory clusters during the sampling period.
Atmosphere 13 00699 g002
Figure 3. Factor profiles of PAH components in PM2.5 identified by the PMF modeling.
Atmosphere 13 00699 g003
Figure 4. Seasonal contributions of four source factors to PAHs in PM2.5 identified by the PMF modeling.
Atmosphere 13 00699 g004
Figure 5. Contributions of four source factors to ΣBaPeq in PM2.5 identified by the PMF modeling.
Atmosphere 13 00699 g005
Table 1. The mean ± standard deviation of PM2.5-bound PAH concentrations and BaPeq concentrations on Beihuangcheng Island from August 2017 to March 2018 (unit: ng/m3).
ComponentAverageSummerAutumnWinterSpring
Nap0.41 ± 0.160.38 ± 0.200.46 ± 0.110.38 ± 0.200.33 ± 0.09
Acy0.13 ± 0.050.10 ± 0.020.10 ± 0.030.16 ± 0.050.15 ± 0.02
Ace0.12 ± 0.030.14 ± 0.060.10 ± 0.020.12 ± 0.020.13 ± 0.01
Flu0.69 ± 0.370.90 ± 0.310.53 ± 0.370.83 ± 0.340.81 ± 0.13
Phe5.04 ± 3.593.69 ± 1.063.80 ± 3.337.20 ± 3.955.48 ± 1.75
Ant1.24 ± 1.560.83 ± 0.581.10 ± 0.851.18 ± 1.292.11 ± 3.27
Flua6.45 ± 6.391.10 ± 0.674.53 ± 5.5610.1 ± 7.228.53 ± 3.25
Pyr5.30 ± 5.980.97 ± 0.714.34 ± 6.907.37 ± 5.286.80 ± 2.43
BaA1.49 ± 2.880.18 ± 0.191.40 ± 3.861.85 ± 1.661.83 ± 0.56
Chr2.95 ± 3.380.40 ± 0.462.65 ± 3.424.01 ± 3.733.24 ± 2.22
BbF4.79 ± 7.830.64 ± 0.704.33 ± 8.845.64 ± 7.937.15 ± 4.12
BkF3.34 ± 4.300.49 ± 0.512.74 ± 4.124.47 ± 5.094.80 ± 2.76
BaP1.18 ± 3.090.01 ± 0.011.39 ± 4.141.21 ± 1.821.04 ± 1.11
InP0.90 ± 4.090.01 ± 0.001.42 ± 5.760.37 ± 1.060.73 ± 0.94
DahA0.01 ± 0.030.00 ± 0.000.01 ± 0.050.01 ± 0.010.01 ± 0.00
BghiP1.25 ± 5.040.01 ± 0.001.85 ± 6.990.93 ± 2.070.56 ± 0.88
2-ring0.66 ± 0.190.62 ± 0.270.67 ± 0.150.67 ± 0.240.63 ± 0.12
3-ring6.97 ± 4.445.43 ± 1.175.44 ± 4.039.22 ± 4.288.41 ± 4.85
4-ring16.2 ± 17.92.66 ± 2.0012.9 ± 19.423.3 ± 17.420.4 ± 8.02
5-ring9.33 ± 14.71.17 ± 1.228.48 ± 16.711.3 ± 14.513.0 ± 7.79
6-ring2.15 ± 9.100.03 ± 0.013.27 ± 12.71.31 ± 3.041.29 ± 1.68
Σ16PAHs35.3 ± 41.89.93 ± 3.8930.8 ± 48.945.9 ± 38.043.7 ± 19.8
ΣBaPeq2.32 ± 4.950.18 ± 0.162.47 ± 6.492.54 ± 3.312.60 ± 1.84
Table 2. Number of 120 h back trajectories in five clusters as shown in Figure 2.
Trajectory Clusters SummerAutumnWinterSpringTotal
Cluster 11240101274
Cluster 252610849
Cluster 332622859
Cluster 401112427
Cluster 501318031
Table 3. PM2.5-bound PAH concentrations in this study and previous studies (unit: ng/m3).
Study AreaSample PeriodNMean ± SDRef.
Beihuangcheng IslandAugust 2017–March 20186035.3 ± 41.8This study
BeijingSeptember 2015–August 20161677.48 ± 6.83[35]
BeijingNovember 2014–June 201522758.3[32]
TangshanApril 2014–February 201539190[36]
DalianNovember 2016–November 20176352.4 ± 24.0[14]
ZhengzhouDecember 2013–October 201618037.8–115.2[33]
Tuoji IslandNovember 2011–January 20137615.34 ± 8.87[5]
ShanghaiOctober 2016–July 20171017.14[37]
ShanghaiApril 2014–January 20152306.90 ± 6.86[38]
HangzhouMarch 2015–February 2016842.27–13.6[39]
HangzhouJanuary and December 20159717.8 ± 15.8[40]
NingboJanuary and December 20159713.5 ± 10.0[40]
JinhuaJanuary and December 20159718.3 ± 16.0[40]
LishuiJanuary and December 20159716.9 ± 15.2[40]
ZhoushanJanuary and December 2015977.5 ± 4.0[40]
Nanjing16 March–5 June 201693.98 ± 1.01[41]
GuangzhouJune 2012–May 20133633.9[42]
GuangzhouNovember–December 200913617.2 ± 3.33[43]
Table 4. Measured and modeled concentrations of PAHs in PM2.5 (unit: ng/m3).
SeasonFactor 1Factor 2Factor 3Factor 4Modeled Conc.Measured Conc.
Summer5.522.870.762.9112.19.93
Autumn5.4110.510.72.5729.230.8
Winter13.424.09.401.7548.645.9
Spring14.219.89.681.4945.243.8
Average8.8114.78.442.1834.135.4
Table 5. Characteristic diagnostic ratios of PM2.5-bound PAH concentrations.
SeasonAnt/(Ant + Phe)Flua/(Flua + Pyr)BaA/(BaA + Chr)InP/(InP + BghiP)
Summer0.19 ± 0.160.53 ± 0.070.43 ± 0.120.58 ± 0.21
Autumn0.26 ± 0.170.53 ± 0.080.29 ± 0.160.31 ± 0.21
Winter0.15 ± 0.150.58 ± 0.020.36 ± 0.150.31 ± 0.20
Spring0.19 ± 0.180.55 ± 0.010.45 ± 0.190.45 ± 0.23
Average0.21 ± 0.170.55 ± 0.070.34 ± 0.170.35 ± 0.23
Table 6. Measured and modeled concentrations of ΣBaPeq in PM2.5 (unit: ng/m3).
SeasonFactor 1Factor 2Factor 3Factor 4Modeled Conc.Measured Conc.
Summer0.110.130.110.070.420.18
Autumn0.110.471.540.062.182.47
Winter0.281.071.360.042.752.55
Spring0.300.881.400.032.612.60
Average0.180.651.220.052.112.32
Publisher’s Note: MDPI stays neutral with regard to jurisdictional claims in published maps and institutional affiliations.

