Abstract
Embalmers are exposed to many pathogens present in bodily fluids. However, the risk posed by these pathogens has yet to be defined in terms of the nature of the hazard and the intensity of the exposure. The objective of this project was to monitor the exposure of embalmers to biological particles in real time and to characterize the microbiota found in the air during embalming activities in three thanatopraxy laboratories. An innovative approach, using a laser-induced fluorescence aerosol spectrometer (WIBS-NEO), made it possible to measure the concentrations and particle size distributions of the aerosols (biological and non-biological) emitted during embalming. At the same time, an Andersen impactor was used to sample the culturable microbiota present in the air and perform its characterization. The preferential aerosolization of the biological (fluorescent) fraction during embalming procedures, which was compared to the non-biological (non-fluorescent) fraction, showed that most of the tasks performed by the embalmer are likely to lead to microbial exposure via bioaerosols. The concentrations measured represented the equivalent of 2000 to 10,000 biological particles inhaled per minute. Although Mycobacterium tuberculosis was not identified in the air during this study, the presence of Streptococcus pneumoniae in some of the samples demonstrated that if a pathogen is present in the lungs of the deceased it can be aerosolized and inhaled by the embalmers. The size distribution showed that embalmers are exposed to a high proportion of small particles in the aerosols produced during their work. Thus, the respirable/total ratios calculated are between 58% and 78%. Finally, the detection of airborne Enterobacter, Serratia, Leclercia, and Hafnia tended to demonstrate the aerosolization of intestinal bacteria and their possible inhalation or ingestion. Due to the difficulty of identifying the presence of pathogenic agents before embalming, the presence of faecal bacteria in the air, the proximity of the embalmer to the body, and the limitations associated with the dilution of contaminants by general ventilation in the near field, local ventilation must be provided. Otherwise, minimally, a fitted N95-type respirator should be recommended.
1. Introduction
The human body contains between 1013 to 1014 bacteria [1,2,3,4]. These microorganisms do not disappear when we die. The loss of our natural barriers, in addition to the shutdown of our immune system, will sustain the proliferation of some microorganisms because of the nutrient-rich environment available for their growth [5,6,7]. Moreover, after death, bacteria from the gut tend to migrate to the blood and other internal organs [6,8]. This may contribute to the presence of an unexpected microbiota in certain organs. The multiplication of microorganisms reaches a peak density of 106 microorganisms per milliliter of body fluid or per gram of body tissues within 24 to 30 h of death [9]. Some thanatomicrobiome studies have reported the occurrence of opportunistic bacteria such as Enterobacter sp., E. coli, Pseudomonas sp., Rothia sp., and Streptococcus sp. in cadavers [5,10,11]. Potential pathogens have been consistently recovered from bodily fluids and/or aspirates of bodies that were previously certified to have died of causes other than an infectious disease [9,12].
For that reason, working with cadavers may be associated with pathogen exposure and may thereby constitute an occupational health risk [13,14,15]. Gwenzi stated that the thanato-resistome may represent a health risk to funeral workers [16]. To reduce the risk of infection and to slow the decomposition process, human cadavers are treated with chemicals with antimicrobial capabilities—this process is known as embalming [17]. Some embalming tasks consist of the aspiration of bodily fluids from the internal organs and the injection of preservative chemicals into the arteries. These tasks are known to produce aerosols containing infectious agents [15,18,19]. Some studies have reported the spread of Mycobacterium tuberculosis to individuals working with human cadavers such as embalmers and funeral directors [20,21,22,23]. Two notable examples of such individuals are René Laennec (the inventor of the stethoscope) and Xavier Bichat (the father of histology), both of whom died of tuberculosis after performing autopsies and examining tissue from tuberculous cadavers [24]. Keane et al. contend that potential exposure to bioaerosols exists as soon as bodies are manipulated [25]. Research has been carried out to describe the thanatomicrobiome, the disinfection efficiency of the liquids used for embalming, and occupationally-acquired infections by means of questionnaires and surveys [5,10,14,17,20,26,27,28], but very few studies have taken measurements of exposure during cadaver embalming [29]. The objective of this study was to evaluate the exposure of embalmers to bioaerosols by determining in real time the concentrations and size distribution of airborne fluorescent and non-fluorescent particles, in addition to characterizing the airborne culturable microorganisms in the ambient air.
2. Materials and Methods
2.1. Sampling Strategy
Three thanatopraxy laboratories were involved in this project. In each of the three laboratories, the sampling was performed over a full working day and the collection period lasted between 3 h 30 and 8 h 20, depending on the length of the embalmer’s’ workday. All sampling instruments were placed on a 1-metre-tall mobile cart positioned at 5 to 10 cm from the thanatopraxy table, in front of the embalmer. The mobile cart made it possible to follow the embalmer in his movements around the body. Lab A (Figure 1, top) has eight tables and two doors, and during sampling, one to three embalmers were at work. Lab B (Figure 1, middle) is the smallest. It has a single table and can be accessed directly from the garage of the viewing room by a flexible door. Lab C (Figure 1, bottom) has two tables and two doors, and two embalmers were working during sampling. In Labs A and C, two embalming procedures were performed by the workers we were observing on the sampling day compared to only one corpse in lab B.
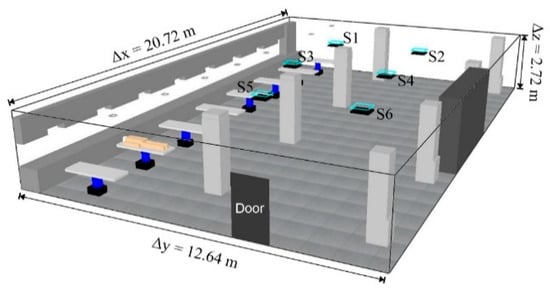

Figure 1.
Schematic representation of labs: A (top), B (middle), and C (bottom) (diffusers: S1–S6).
2.2. Real Time Monitoring
The numerical concentrations and particle size distribution (PSD) of aerosols emitted during thanatopraxy were measured in real time using a laser-induced fluorescence aerosol spectrometer (WIBS-NEO, Droplet Measurement Technologies, Longmont, CO, USA). The WIBS-NEO measures the PSD between 0.4–0.5 and 30 µm by means of a 10-channel optical particle counter [30]. This range of diameters corresponds to the particles likely to reach the respiratory tract. To detect the biological particles, the WIBS-NEO excites the particles with two UV laser diodes (280 nm and 370 nm) and then measures the resulting ultraviolet and visible fluorescence between 310 and 400 nm and 420 and 650 nm [30]. This combination of excitation and detection wavelengths enables the measurement of fluorescence from common living molecules, including nicotinamide adenine di-nucleotide (NADH), tyrosine, phenylalanine, tryptophan, and flavin compounds (riboflavin, flavoproteins) [30,31,32,33]. In this way, the WIBS-NEO makes it possible to distinguish the biological (fluorescent) from the non-biological (non-fluorescent) fractions. The samples were taken every minute for the entire duration of the working days and the concentrations reported represent the average concentrations for each minute. This strategy represents hundreds of samples every day. This high temporal resolution makes it possible to attribute an emission peak to a particular task/action. The embalmers’ activities were recorded for 208 min in Lab A, 252 min in Lab B, and 496 min in Lab C.
2.3. Microbial Air Sampling
A 6-stage Andersen impactor (Tisch Environmental, Cleves, OH, USA) was used to collect inhalable airborne culturable bacteria. The impactor separates particles into 6 size classes ranging from an aerodynamic diameter of 0.6 µm to >7 µm (stage 1 has a cut-off diameter (d50) of 8 µm). This separation simulates the deposition of aerosols in the human respiratory system.
The sampling flow rate was continuously monitored and adjusted to 28.3 L/min. The collection time for each sample was 15 min. The samples were collected successively. This strategy allowed for the collection of between 10 and 16 samples in each laboratory and allowed for the documentation of the total amount of time required to perform a complete thanatopraxy procedure. The background concentration was sampled at the beginning of the day before the body was handled. Trypticase Soya Agar (TSA) supplemented with 5% defibrinated sheep’s blood (Oxoid Canada, Nepean, ON, Canada) was used. This medium is non-selective, highly nutritious, and provides good growth conditions for a large variety of microorganisms as well as hemolysis information for the hemolytic bacteria as the Streptococcus spp. [34]. At the end of the sampling day, the agar plates were placed in an incubator at 37 °C for 48 h.
2.4. Culturable Bacteria Analysis
Total bacterial counts were performed using a stereomicroscope (Nikon SMZ18, Melville, NY, USA). Counts obtained with the Andersen samples were corrected using the positive hole method [35]. For bacterial characterization, colonies from the original agar with a distinct phenotype were isolated in pure culture. A combination of several identification methods was used for the speciation of each strain. Figure 2 schematically summarizes the analytical process performed for the characterization of the bacterial strains. The FAME-GC analysis was performed according to the IRSST method 341 [36] using the Sherlock System (MIDI inc., Newark, NJ, USA). The FAME-GC method produces a fatty acid profile characteristic of each species. To identify a given species, the profile was compared with those in the Sherlock database. Based on the similarity indices (SI), identifications were brought to the species (SI > 0.6) or the genus level (SI > 0.3). The Sanger 16S rRNA sequencing was conducted using the variable gene regions V2 to V9 with the primers Ai (AGR GTT YGA TYC TGG CTC AGG AYG) and rJ primers (GGT TAC CTT GTT ACG ACT T) [37,38] in a T100 Thermal Cycler (Bio-Rad, Hercules, CA, USA). The resulting amplicons were cleaned using the ExoSAP-IT Express® kit (Thermo Fisher Scientific, Waltham, MA, USA). A limited gene area comprising regions V2 to V4 was marked with the BigDye Terminator v3.1 Cycle Sequencing Kit® (Thermo Fisher Scientific Waltham, USA) and Ai and rE primers (GGA CTA CCA GGG TAT CTA AT) [39]. The amplicons obtained were analyzed with the SeqStudio® Genetic Analyzer sequencer from Applied Biosystems (Beverly, MA, USA). The Microscan® and Biolog® identification panels and the VITEK® MS microbial identification system were used according to the manufacturers’ recommendations.
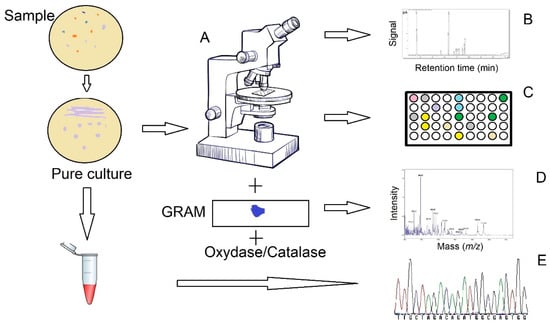
Figure 2.
Schema of the analytical techniques used for the characterization of the bioaerosol culturable fraction (A—Morphological characterization by microscopy, gram staining, oxidase, and catalase tests; B—FAME-GC; C—Microscan® and Biolog®; D—Vitek®-MS; E—Sequencing of bacterial 16S rRNA (Sanger)).
2.5. Data Analysis
NCSS software was used to verify the data distribution and perform the one-way ANOVA and Kruskal–Wallis multiple comparison test. Based on the WIBS-NEO measurements, the daily temporal evolution of the emission factor (EF) of fluorescent (biological) and non-fluorescent (non-biological) particles was calculated. This EF corresponds to the ratio of the concentration measured at time t (Ct) to the average concentration measured at baseline (C0) (without activities).
3. Results
3.1. Real Time Monitoring
Figure 3 represents the temporal evolution of the emission factor (EF) in the three labs. In each lab, it was possible to label some emission peaks corresponding to specific tasks. The emissions of biological particles were clearly identifiable during suturing using sealing powder; wrapping with plastic; viscera aspiration using the trocar; the incision, insertion, and arterial aspiration using the cannula and injection of preservative solution; the cleaning and wiping down of the body; and the cleaning of the mortuary table or when moving the body. Overall, a greater EF was observed for the biological fraction than for the non-biological fraction, and the peaks of biological particles were not always accompanied by an equivalent increase in non-biologic particles. This was observed during suturing using sealing powder in lab A, and in the manipulation of the body during the ante meridiem period in lab C. The highest EFs were measured in lab C during viscera aspiration with the trocar and when the cavities were packed. The EFs were up to 45 times over the baseline level for biological particles in that lab compared to less than 7 times in the other labs.
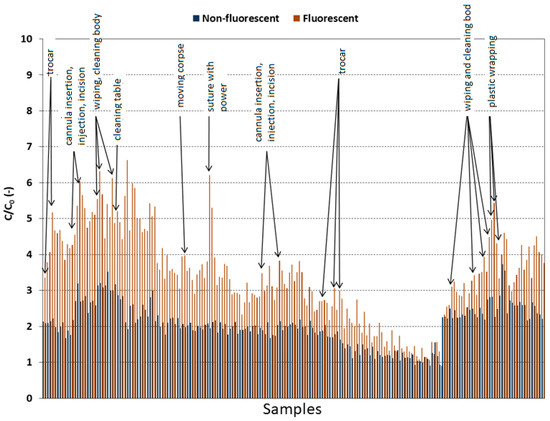
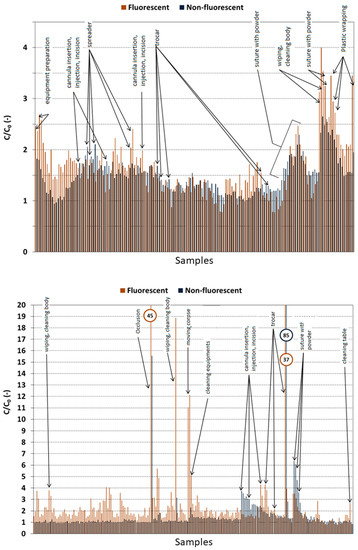
Figure 3.
Chronology of emission factors (C/C0) for fluorescent (biological) and non-fluorescent (non-biological) particles for successive samples of one minute in lab A (top), B (middle), and C (bottom). (C: Concentration and C0: baseline concentration). The numbers in the circles represent the C/C0 ratio that were off-scale and were obtained for extreme generating events (orange for fluorescent particles and blue for non-fluorescent particles).
Overall, the concentration of non-biological particles in lab B (Figure 4) was higher than those measured in labs A and C. The one-minute average concentrations of both types of particles fluctuated somewhat from task to task. With respect to the biological particles, the concentrations observed in lab A were between 0.25 particles/cubic centimeter of air (#/cm3 of air) during suturing with sealing powder and 0.56 #/cm3 when the body was wrapped in plastic. The concentrations in lab A were similar, with the exception of the extremes of 6.30 and 7.65 #/cm3 of air measured in lab C during the use of the trocar and the occlusion of the orifices. Field observations suggested that the embalmer’s practice could explain the high concentrations in lab C. As for lab B, the concentrations observed varied between 1.62 #/cm3 of air during shaving to 2.82 #/cm3 of air when the body was wrapped in plastic. In general, the concentrations varied only slightly over time and no significant differences could be demonstrated between the mean or median concentrations measured by task. However, it remains clear that some tasks can result in very marked increases and that the substantive exposure of workers to high concentrations of bioaerosols cannot be ignored.
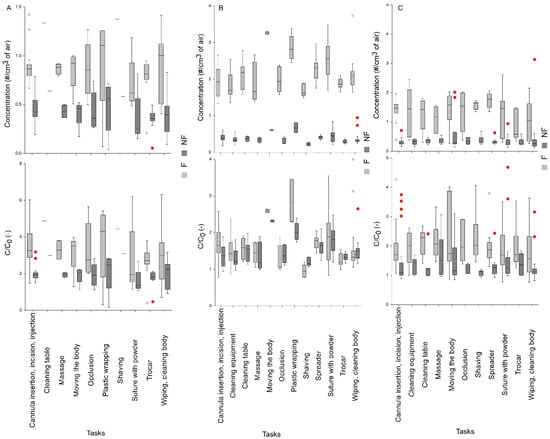
Figure 4.
Concentration (red) and emission factor (gray) of biological/fluorescent (F) and non-biological/non-fluorescent (NF) particles, by task, (top) for lab A, (middle) for lab B, and (bottom) for lab C. (C: Concentration and C0: baseline concentration).
The median concentrations were around 0.2 to 0.5 biological particles per cm3, which represent between 200,000 and 500,000 particles per m3 of air. Assuming that 10 to 20 liters of air are inhaled per minute during low intensity activities, a worker would inhale the equivalent of 2000 to 10,000 particles per minute. Therefore, it is obvious that these concentrations are not negligible, given that the median infectious dose (ID50) of Mycobacterium tuberculosis is less than 10 bacilli [40] and its equivalent estimated for SARS-CoV2 is 100 particles [41].
3.2. Particle Size Distribution
The size of the fluorescent particles as well as their weight in the total aerosol samples are shown for the tasks that cause the most emissions in all labs (Figure 5, Figure 6 and Figure 7). In labs B and C, the profiles of the biological particles tend to differ depending on the task being performed in terms of their size distribution and/or their concentrations, whereas the profiles observed in lab A are much more similar across the tasks being performed. As seen in Figure 6, the size distribution of the particles in lab B are comparable during wrapping with plastic and suturing, whereas their concentrations diverge. In lab C, the use of the trocar and the occlusion of the orifices produced a peak centered at around 4 µm, which was not observed during the other tasks (Figure 7).
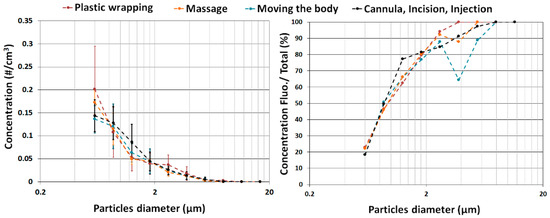
Figure 5.
Fluorescent particle concentration (left) and fluorescent fraction (right) by particle size for the three most emissive tasks observed in lab A.
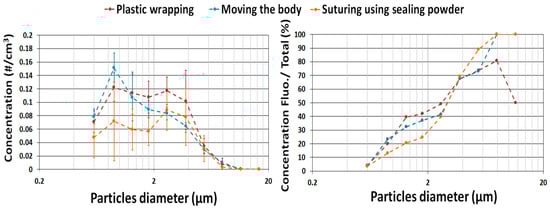
Figure 6.
Fluorescent particle concentration (left) and fluorescent fraction (right) by particle size for the three most emissive tasks observed in lab B.
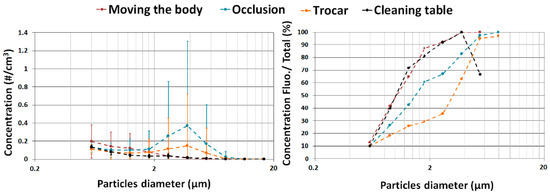
Figure 7.
Fluorescent particle concentration (left) and fluorescent fraction (right) by particle size for the three most emissive tasks observed in lab C. (#/cm3: number of particles per cm3 of air).
In the three labs, the larger the particles, the higher the percentage of biological particles in the total aerosol sample. The high proportion of fluorescent particles in the aerosols demonstrate that the microbiological agents are the main compounds and that they are preferentially aerosolized during embalming compared to the non-biological particles. A noticeable example is the use of the trocar and the occlusion task in lab C, which produce concentration peaks for 4 µm particles that are about 60% and 80% biological, respectively. Since the size of the particle is strongly influences the aerosol dispersion and deposition in workplaces and in the human respiratory tract (around 80% deposited for the 4 µm particles), these data are of primarily interest for worker exposure and risk evaluation.
Figure 8 represents the bacterial abundance of the genera characterized on each stage of the Andersen impactor. Since more than 30 different genera have been characterized in the three labs and in others to limit the complexity of the figure, only the genera that presented more than once on a given sample are reported. This evaluation shows that the culturable bacteria in lab B were recovered from larger particles (stages 1 and 2 of the Andersen impactor) than those collected in the other labs (stages 4 to 6). Notwithstanding the polydispersion, it is important to note that for all three laboratories, particles smaller than 4.7 µm (stages 3 to 6) represented the major fraction. These results show that the majority of the cultivable bacteria collected are respirable and can enter workers’ respiratory tracts. They can also remain airborne for an extensive period. If not removed by the ventilation system, they could represent a risk even after the completion of the thanatopraxy procedure.
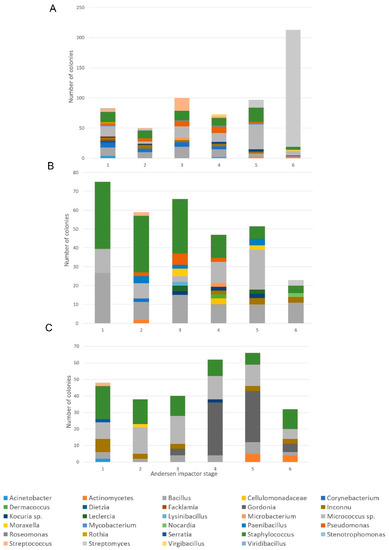
Figure 8.
Identification and the number (CFU) of culturable bacteria collected with the Andersen impactor for 15 min in lab A (top), lab B (middle) and Lab C (bottom). Concentrations are reported according to the size of the particles impacted on each of the six stages of the impactor on the agar surface. Only genera presented more than once on a given sample are reported.
Bacteria sizes are mostly between 0.5 and 3 µm [42]. However, bioaerosols are not always present as separate microbial cells in the air; they agglomerate with other particles [43,44]. The degree of the agglomeration of microbial cells is influenced by several factors, including the type of bacteria, other particles, the relative humidity, the source, substratum, the emission mechanism, and air movement velocities [45,46]. Studies have shown that when there are higher amounts of dust, the association of microorganisms and dust is more frequent [43]. Since lab B was adjacent to a garage with higher dust and exhaust levels, this could explain the higher agglomeration frequency. When assessing microbial risk, it is important to consider the microbial load that may be respirable. In the outdoor environment, researchers have observed R/T (respirable to total particle) ratios ranging from 30 to 50% [44], while in homes and hospitals R/T ratios between 30 and 60% have been reported. The higher the ratios, the greater the proportion of small particles in the aerosol and the deeper the particles will be able to penetrate a worker’s airways. In this study, the calculated R/T ratios in the three laboratories were 78% for A, 58% for B, and 69% for C. These ratios are high compared to what is reported above.
3.3. Culturable Bacteria
As observed with the real-time monitoring analysis, the culturable bacteria presented temporal variations in their concentrations in the three labs (Figure 4, Figure 5 and Figure 6). Even though the sampling time was 15 min, it was still possible to associate some specific tasks with higher culturable concentrations.
Of the 55 air samples taken from the three laboratories, more than 900 colonies were isolated for subsequent identification. From these strains, 49 different genera were characterized, mainly from the phylum Actinobacteria, Firmicutes, and Proteobacteria (Figure 8). The genera Bacillus, Staphylococcus, and Micrococcus were identified as being the most abundant. These results are consistent with what has previously been reported by other researchers in indoor environments [43,44,45,47].
The majority of Actinobacteria are known to be telluric and saprophytic. This does not prevent many of them from colonizing several parts of the human body. It should be remembered that some Corynebacteriaceae and Mycobacteriaceae are known to be opportunistic or even pathogenic to humans [42]. Strains of bacteria belonging to the non-tuberculous Mycobacterium (risk group 2) were cultured in two of the three laboratories, although without speciation. Since the culture media used in this project does not support the growth of Mycobacterium tuberculosis (risk group 3), it was impossible to cultivate it; therefore, it is impossible to guarantee that it was absent. In addition to Corynebacterium and Mycobacterium, several bacteria from the families Dietziaceae, Gordoniaceae, Nocardiaceae, and Streptomycetaceae were recovered. When lab A was being mopped, an increase in the biological particles could be observed with the direct reading instrument. That increase was also observed in the culturable samples (Figure 9), which were mainly Streptomyces. The presence of Streptomyces persisted on the remaining samples collected that day (more than 1.5 h after mopping), demonstrating that the small (0.5 µm) spores [42] produced by these bacteria could remain airborne for an extended period. Almost all of the Streptomyces colonies collected were impacted on stage six of the Andersen impactor, confirming their small aerodynamic diameter (Figure 8).
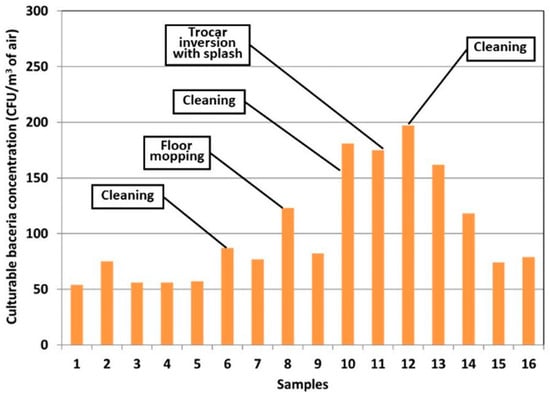
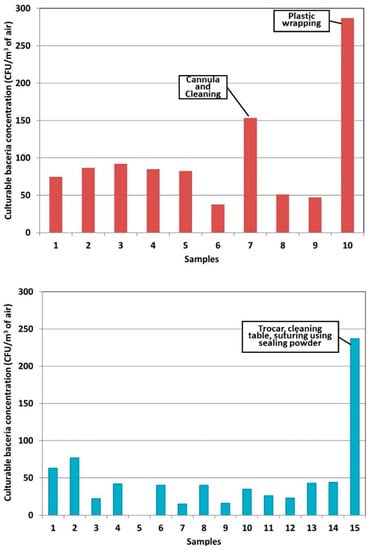
Figure 9.
Concentration of culturable bacteria per cubic meter of air observed in Lab A (top) B (middle) and C (bottom) for 15 min sampling on TSA with 5% defibrinated sheep’s blood using the Andersen 6 stages impactor at a flow rate of 28.3 L/min. (CFU: Colonies forming units).
The genus Micrococcus, whose primary habitat is the skin [42], was undoubtedly the most frequently found. It accounts for just over 20% of all the isolates characterized in this project. This frequency is slightly lower than the 36% reported by Pastuszka et al. in homes and office buildings [44]. This difference could be due to the different bacterial sources present in a thanatopraxy laboratory, which may increase diversity.
The bacteria of the phylum Firmicutes are ubiquitous gram-positive bacteria, which include the genera Bacillus, Staphylococcus, and Streptococcus [48]. Although mostly saprophytic, these genera also include opportunistic or human-pathogenic bacteria. In this project, Streptococcus pneumoniae, a risk group 2 human pathogen, was cultured in a few samples from labs A and C. Although this bacterium may be present asymptomatically in the human upper respiratory tract, where it colonizes the mucosal surface of the nasopharynx [49], its cultivation demonstrates that bacteria likely originating from the respiratory tract are found in a cultivable state in the air of thanatopraxy labs. In addition, three of the four samples in which Streptococcus pneumoniae was isolated were collected during thanatopraxy of a person who died of pneumonia. Streptoccoccus agalactiae, mitis, oralis, and parasanguis were also cultured in a few samples collected in the three laboratories. The different species of Staphylococcus identified come almost exclusively from the surface of the skin, nasal membranes, and the human scalp. It is important to note the presence of the opportunistic bacterium, Staphylococcus aureus, in some samples from lab B. The presence of numerous bacteria from the order Bacillales is not surprising since these bacteria produce endospores that give them great resistance. The vast majority of Bacillus come from soils [48]. Their resistance means that they are pervasive in all types of environments (natural, domestic, industrial, and hospital) [48] and they are found in most air samples [50].
Gram-negative bacteria are grouped primarily in the phylum Proteobacteria [51]. More than half of the gram-negative bacteria characterized in the three laboratories belong to the Gamma-Proteobacteria, a group with a relatively ubiquitous ecological niche. Many of these bacterial genera naturally colonize the skin, mucous membranes, respiratory tract, and intestines [51]. Pseudomonas are known as commensals of the nasal cavity and intestines. However, since they are abundantly distributed in all environments (soil and water), their presence in these air samples cannot be specifically related to aerosolization due to thanatopraxy activities. Although few studies report their presence in air samples, Gorny reports isolating these bacteria in 80% of their samples [43]. Moraxella, naturally present in the oropharynx, mucous membranes, skin, and genital tract, were also found. Finally, the detection of airborne Enterobacter, Serratia, Leclercia, and Hafnia originating mainly from the intestines should be noted. This tends to prove the aerosolization of bacteria from the intestinal system during thanatopraxy.
3.4. Aerosolization Mechanism
Another major point regarding the exposure of embalmers is the preferential aerosolization of fluorescent particles. In order to assess the process causing these bioaerosol peaks, tasks were grouped according to the following mechanisms:
- Bellows effect—ejection of air and particles by compression, air movement (suturing using sealing powder, occlusion, or wrapping);
- Splash—projection related to the use of water (wiping and cleaning bodies, table, or equipment);
- Inertial—emission of particles escaping from the aspiration tool (trocar);
- Venous insertion—emission caused by an incision or the insertion of an object into a vein or artery (cannula insertion, fluid injection, retractor, or spring forceps);
- Friction—emission or resuspension by rubbing (body manipulation, shaving, depilation, or massage).
Since the baseline bioaerosol concentrations varied from lab to lab, the emission factors were considered for the task comparison. For each laboratory, the emission factors were ranked in descending order and the average rank position was calculated to classify the aerosolization risk per mechanism type (Figure 10).
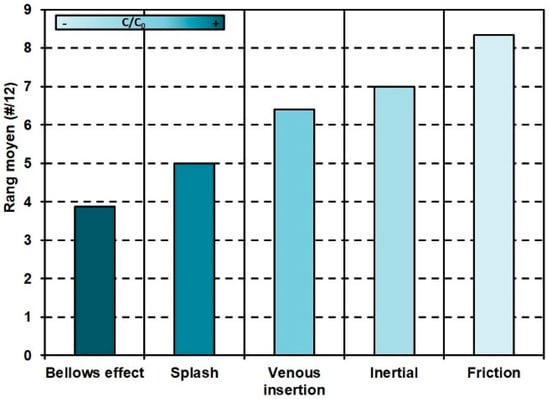
Figure 10.
Average rank of maximum bioaerosol emission factors (descending order) by aerosolization.
The bellows effects and splashing were the mechanisms that generated the most bioaerosols. Bellows effects are intensified by the addition of sealing and formaldehyde powders. These powders are initially non-fluorescent but become fluorescent when in contact with body liquids, before being re-aerosolized by the bellows effect. The case of the inertial emissions caused using the trocar deserves clarification. The aspiration through the trocar limits the aerosolization of particles and helps explain its lower end rank. However, it is essential to remember that the trocar can also be responsible for significant emissions, particularly from an uncontrolled withdrawal of the trocar from the body (Figure 11).
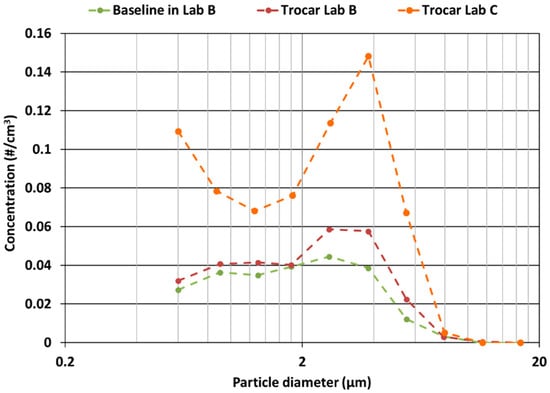
Figure 11.
Comparison of the average particle size distribution of bioaerosols emitted when using the trocar, for labs B and C. (#/cm3: number of particles per cm3 of air).
3.5. Limits
The recommendations made are based on observations and measurements taken in three thanatopraxy labs during normal activities. No change in the working methods was requested by the research team, so the tasks evaluated should be representative of reality. However, because of the various factors that can influence the emission and residual concentrations, the data presented represent only the facilities studied, the state of preservation of the bodies, and the work methods of the embalmers observed. Any other specific situation should be thoroughly evaluated by a professional in bioaerosols or infectious risks. Bacteria enumeration methods were performed by culture on nutrient media. These methods, although widely used, underestimate exposure because only microorganisms that can be grown under the conditions provided are taken into account.
4. Conclusions
This study established that workers performing thanatopraxy activities were exposed to bioaerosols, but that certain tasks were more likely to generate more particles in the breathing zone of the worker. Bacterial strains belonging to non-tuberculous Mycobacterium and Streptococcus pneumoniae (risk group 2) were identified in two of the three laboratories studied. The cultivation of Streptococcus pneumoniae demonstrates that bacteria from the human respiratory tract are present in a cultivable state in the air of thanatopraxy labs. The preferential aerosolization of biological (fluorescent) particles during thanatopraxy procedures, compared to non-biological (non-fluorescent) particles, shows that the majority of the tasks performed by an embalmer are likely to cause microbial exposure. The tasks likely to emit the largest peaks are those involving a bellows effect. These tasks are an important determinant of the exposure of embalmers to potential pathogens. Moreover, the PSD measured indicates that the bioaerosols emitted during thanatopraxy procedures belong to the respirable fraction with the ability to penetrate deep into the respiratory tract. In addition, since small particles remain airborne over long distances and periods of time, unless the embalmer is working alone in the laboratory, he or she may be exposed to microbial bioaerosols produced by the activities of other embalmers or may be exposed for a long period of time after performing thanatopraxy procedures.
Various authors have shown that many pathogens have been recovered from bodily fluids from cadavers whose cause of death was certified not to be an infectious disease [9,12,15]. Considering the difficulty of identifying the presence of pathogenic agents before embalming, the presence of fecal bacteria in the air, the proximity of the embalmer to the body, and the limitations associated with the dilution of contaminants by general ventilation in the near field, local ventilation must be provided. Otherwise, minimally, a fitted N95-type respirator should be recommended.
Author Contributions
Conceptualization, G.M., S.H. and M.D.; methodology, G.M., L.W., S.H. and M.D.; analysis, G.M., L.W. and S.H.; investigation, G.M., L.W. and S.H. data curation, G.M., L.W. and S.H.; writing—original draft preparation, G.M.; writing—review and editing, G.M., L.W., M.D. and S.H.; project administration, G.M.; funding acquisition G.M., S.H. and M.D. All authors have read and agreed to the published version of the manuscript.
Funding
This research was funded by the IRSST, grant number 2016-0016.
Institutional Review Board Statement
The study was conducted in accordance with the Research Ethics Committee of Montreal University for studies involving humans (certificate #17-052-CERES-P approved on 5 May 2017).
Informed Consent Statement
Informed consent was obtained from all workers involved in the study.
Data Availability Statement
Data supporting reported results can be provide about request.
Acknowledgments
The research team would like to thank the Corporation des thanatopracteurs du Québec, the funeral home directors and the embalmers who agreed to participate in the project. We would also like to thank Jacques Lavoie and Yves Cloutier for their contribution at the beginning of the project, Carol-Anne Villeneuve for her help with recruitment and sampling, Simon Lévesque for the identification of some difficult strains using Maldi-TOF, and the IRSST’s biological agent team for the microbiological analysis by culture.
Conflicts of Interest
The authors declare no conflict of interest.
References
- Sender, R.; Fuchs, S.; Milo, R. Revised Estimates for the Number of Human and Bacteria Cells in the Body. PLoS Biol. 2016, 14, e1002533. [Google Scholar] [CrossRef] [PubMed]
- Rup, L. The Human Microbiome Project. Indian J. Microbiol. 2012, 52, 315. [Google Scholar] [CrossRef] [PubMed]
- Savage, D.C. Microbial Ecology of the Gastrointestinal Tract. Annu. Rev. Microbiol. 1977, 31, 107–133. [Google Scholar] [CrossRef]
- Luckey, T.D. Introduction to Intestinal Microecology. Am. J. Clin. Nutr. 1972, 25, 1292–1294. [Google Scholar] [CrossRef] [PubMed]
- Javan, G.T.; Finley, S.J.; Can, I.; Wilkinson, J.E.; Hanson, J.D.; Tarone, A.M. Human Thanatomicrobiome Succession and Time Since Death. Sci. Rep. 2016, 6, 29598. [Google Scholar] [CrossRef]
- Tuomisto, S.; Karhunen, P.J.; Vuento, R.; Aittoniemi, J.; Pessi, T. Evaluation of Postmortem Bacterial Migration Using Culturing and Real-Time Quantitative Pcr. J. Forensic Sci. 2013, 58, 910–916. [Google Scholar] [CrossRef]
- Pechal, J.L.; Schmidt, C.J.; Jordan, H.R.; Benbow, M.E. A Large-Scale Survey of the Postmortem Human Microbiome, and Its Potential to Provide Insight into the Living Health Condition. Sci. Rep. 2018, 8, 5724. [Google Scholar] [CrossRef]
- Morris, J.A.; Harrison, L.M.; Partridge, S.M. Practical and Theoretical Aspects of Postmortem Bacteriology. Curr. Diagn. Pathol. 2007, 13, 65–74. [Google Scholar] [CrossRef]
- Rose, G.W.; Hockett, R.N. The Microbiologic Evaluation and Enumeration of Postmortem Specimens from Human Remains. Health Lab. Sci. 1971, 8, 75–78. [Google Scholar]
- Can, I.; Javan, G.T.; Pozhitkov, A.E.; Noble, P.A. Distinctive Thanatomicrobiome Signatures Found in the Blood and Internal Organs of Humans. J. Microbiol. Methods 2014, 106, 1–7. [Google Scholar] [CrossRef]
- Javan, G.T.; Finley, S.J.; Abidin, Z.; Mulle, J.G. The Thanatomicrobiome: A Missing Piece of the Microbial Puzzle of Death. Front. Microbiol. 2016, 7, 225. [Google Scholar] [CrossRef] [PubMed]
- Cattaneo, C.; Nuttall, P.A.; Molendini, L.O.; Pellegrinelli, M.; Grandi, M.; Sokol, R.J. Prevalence of HIV and Hepatitis C Markers among a Cadaver Population in Milan. J. Clin. Pathol. 1999, 52, 267–270. [Google Scholar] [CrossRef] [PubMed]
- Healing, T.D.; Hoffman, P.N.; Young, S.E.J. Communicable Disease Report the Infection Hazards of Human Cadavers. CDR Rev. 1995, 5, R61–R68. [Google Scholar]
- Beck-Sagué, C.M.; Jarvis, W.R.; Fruehling, J.A.; Ott, C.E.; Higgins, M.T.; Bates, F.L. Universal Precautions and Mortuary Practitioners: Influence on Practices and Risk of Occupationally Acquired Infection. J. Occup. Med. Off. Publ. Ind. Med. Assoc. 1991, 33, 874–878. [Google Scholar] [CrossRef]
- Creely, K. Infection Risks and Embalming; Institute of Occupational Medicine: Edinburgh, UK, 2004; p. 90. [Google Scholar]
- Gwenzi, W. Autopsy, Thanatopraxy, Cemeteries and Crematoria as Hotspots of Toxic Organic Contaminants in the Funeral Industry Continuum. Sci. Total Environ. 2021, 753, 141819. [Google Scholar] [CrossRef]
- Balta, J.Y.; Cryan, J.F.; O’Mahony, S.M. The Antimicrobial Capacity of Embalming Solutions: A Comparative Study. J. Appl. Microbiol. 2019, 126, 764–770. [Google Scholar] [CrossRef]
- Davidson, S.S.; Benjamin, W.H. Risk of Infection and Tracking of Work-Related Infectious Diseases in the Funeral Industry. Am. J. Infect. Control 2006, 34, 655–660. [Google Scholar] [CrossRef]
- Correia, J.C.; Steyl, J.L.; Villiers, H.C.D. Assessing the Survival of Mycobacterium Tuberculosis in Unembalmed and Embalmed Human Remains. Clin. Anat. 2014, 27, 304–307. [Google Scholar] [CrossRef]
- McKenna, M.T.; Hutton, M.; Cauthen, G.; Onorato, I.M. The Association between Occupation and Tuberculosis. A Population-Based Survey. Am. J. Respir. Crit. Care Med. 1996, 154, 587–593. [Google Scholar] [CrossRef]
- Sterling, T.R.; Pope, D.S.; Bishai, W.R.; Harrington, S.; Gershon, R.R.; Chaisson, R.E. Transmission of Mycobacterium Tuberculosis from a Cadaver to an Embalmer. N. Engl. J. Med. 2000, 342, 246–248. [Google Scholar] [CrossRef]
- Anderson, J.A.; Meissner, J.S.; Ahuja, S.D.; Shashkina, E.; O’Flaherty, T.; Proops, D.C. Confirming Mycobacterium Tuberculosis Transmission from a Cadaver to an Embalmer Using Molecular Epidemiology. Am. J. Infect. Control 2015, 43, 543–545. [Google Scholar] [CrossRef] [PubMed]
- Gershon, R.R.M.; Vlahov, D.; Escamilla-Cejudo, J.A.; Badawi, M.; McDiarmid, M.; Karkashian, C.; Grimes, M.; Comstock, G.W. Tuberculosis Risk in Funeral Home Employees. J. Occup. Environ. Med. 1998, 40, 497–503. [Google Scholar] [CrossRef] [PubMed]
- Burton, J.L. Health and Safety at Necropsy. J. Clin. Pathol. 2003, 56, 254–260. [Google Scholar] [CrossRef] [PubMed]
- Keane, E.; Dee, A.; Crotty, T.; Cunney, R.; Daly, E.; Griffin, S.; Horgan, M.; Keane, S.; Kenny, E.; Lyon, C.; et al. Guidelines for the Management of Deceased Individuals Harbouring Infectious Disease; Health Protection Surveillance Centre: Dublin, Ireland, 2013. [Google Scholar]
- Tabaac, B.; Goldberg, G.; Alvarez, L.; Amin, M.; Shupe-Ricksecker, K.; Gomez, F. Bacteria Detected on Surfaces of Formalin Fixed Anatomy Cadavers. Ital. J. Anat. Embryol. 2013, 118, 1–5. [Google Scholar] [PubMed]
- Woodburne, R.T.; Lawrence, C.A. An Improved Embalming Fluid Formula. Anat. Rec. 1952, 114, 507–514. [Google Scholar] [CrossRef]
- Turner, S.B.; Kunches, L.M.; Gordon, K.F.; Travers, P.H.; Mueller, N.E. Occupational Exposure to Human Immunodeficiency Virus (HIV) and Hepatitis B Virus (HBV) among Embalmers: A Pilot Seroprevalence Study. Am. J. Public Health 1989, 79, 1425–1426. [Google Scholar] [CrossRef]
- Stewart, P.A.; Herrick, R.F.; Feigley, C.E.; Utterback, D.F.; Hornung, R.; Mahar, H.; Hayes, R.; Douthit, D.E.; Blair, A. Study Design for Assessing Exposures of Embalmers for a Case-Control Study. Part I. Monitoring Results. Appl. Occup. Environ. Hyg. 1992, 7, 532–540. [Google Scholar] [CrossRef]
- Droplet Measurement Technologies. WIBS-NEO Wideband Integrated Bioaerosols Sensor; Operator Manual; Droplet Measurement Technologies: Longmont, CO, USA, 2020. [Google Scholar]
- Kaye, P.H.; Stanley, W.R.; Foot, V.; Baxter, K.; Barrington, S.J. A Dual-Wavelength Single Particle Aerosol Fluorescence Monitor. In Optically Based Materials and Optically Based Biological and Chemical Sensing for Defence II; SPIE: Bellingham, WA, USA, 1989; Volume 5990, pp. 166–177. [Google Scholar]
- Kaye, P.H.; Stanley, W.R.; Hirst, E.; Foot, E.V.; Baxter, K.L.; Barrington, S.J. Single Particle Multichannel Bio-Aerosol Fluorescence Sensor. Opt. Express 2005, 13, 3583. [Google Scholar] [CrossRef]
- Pinnick, R.G.; Hill, S.C.; Nachman, P.; Pendleton, J.D.; Fernandez, G.L.; Mayo, M.W.; Bruno, J.G. Fluorescence Particle Counter for Detecting Airborne Bacteria and Other Biological Particles. Aerosol Sci. Technol. 1995, 23, 653–664. [Google Scholar] [CrossRef]
- Lennette, E.H. Manual of Clinical Microbiology, 4th ed.; American Society for Microbiology, Ed.; American Society for Microbiology: Washington, DC, USA, 1985. [Google Scholar]
- Andersen, A.A. New Sampler for the Collection, Sizing, and Enumeration of Viable Airborne Particles. J. Bacteriol. 1958, 76, 471–484. [Google Scholar] [CrossRef]
- Marchand, G. Identification Des Bactéries Cultivables; IRSST (Institut de recherche Robert Sauvé en santé et sécurité du travail): Montréal, QC, Canada, 2009; p. 10. [Google Scholar]
- Bekal, S.; Gaudreau, C.; Laurence, R.A.; Simoneau, E.; Raynal, L. Streptococcus Pseudoporcinus Sp. Nov.; a Novel Species Isolated from the Genitourinary Tract of Women. J. Clin. Microbiol. 2006, 44, 2584–2586. [Google Scholar] [CrossRef] [PubMed]
- Janvier, M.; Grimont, P.A.D. The Genus Methylophaga, a New Line of Descent within Phylogenetic Branch γ of Proteobacteria. Res. Microbiol. 1995, 146, 543–550. [Google Scholar] [CrossRef]
- Harf-Monteil, C. Aeromonas Simiae sp. Nov., Isolated from Monkey Faeces. Int. J. Syst. Evol. Microbiol. 2004, 54, 481–485. [Google Scholar] [CrossRef] [PubMed]
- Agence de la Santé Publique du Canada. Fiche Technique Santé-Sécurité: Agents Pathogènes—Mycobacterium Tuberculosis et Complexe Mycobacterium Tuberculosis. Available online: https://www.canada.ca/fr/sante-publique/services/biosecurite-biosurete-laboratoire/fiches-techniques-sante-securite-agents-pathogenes-evaluation-risques/complexe-mycobacterium-tuberculosis.html (accessed on 5 February 2020).
- Karimzadeh, S.; Bhopal, R.; Tien, H.N. Review of Infective Dose, Routes of Transmission and Outcome of COVID-19 Caused by the SARS-COV-2: Comparison with Other Respiratory Viruses. Epidemiol. Infect. 2021, 149, E96. [Google Scholar] [CrossRef]
- Goodfellow, M.; Kämpfer, P.; Busse, H.-J.; Trujillo, M.E.; Suzuki, K.; Ludwig, W.; Whitman, W.B. Bergey’s Manual® of Systematic Bacteriology; Springer: New York, NY, USA, 2012. [Google Scholar]
- Gorny, R.L.; Reponen, T.; Willeke, K.; Schmechel, D.; Robine, E.; Boissier, M.; Grinshpun, S.A. Fungal Fragments as Indoor Air Biocontaminants. Appl. Environ. Microbiol. 2002, 68, 3522–3531. [Google Scholar] [CrossRef]
- Pastuszka, J.S.; Paw, U.K.T.; Lis, D.O.; Wlazło, A.; Ulfig, K. Bacterial and Fungal Aerosol in Indoor Environment in Upper Silesia, Poland. Atmos. Environ. 2000, 34, 3833–3842. [Google Scholar] [CrossRef]
- Kim, K.Y.; Kim, C.N. Airborne Microbiological Characteristics in Public Buildings of Korea. Build. Environ. 2007, 42, 2188–2196. [Google Scholar] [CrossRef]
- Reponen, T.A.; Gazenko, S.V.; Grinshpun, S.A.; Willeke, K.; Cole, E.C. Characteristics of Airborne Actinomycete Spores. Appl. Environ. Microbiol. 1998, 64, 3807–3812. [Google Scholar] [CrossRef]
- Nevalainen, A. Bacterial Aerosols in Indoor Air; Kansanterveyslaitos KTL: Kuopio, Finland, 1989. [Google Scholar]
- De Vos, P.; Whitman, W.B.; Bergey, D.H. (Eds.) Bergey’s Manual of Systematic Bacteriology; The Firmicutes, 2nd ed.; Springer: Dordrecht, The Netherlands, 2009. [Google Scholar]
- Weiser, J.N. The Pneumococcus: Why a Commensal Misbehaves. J. Mol. Med. 2010, 88, 97–102. [Google Scholar] [CrossRef]
- Goyer, N.; Lavoie, J.; Lazure, L.; Marchand, G. Les Bioaérosols en Milieu de travail: Guide D’évaluation, de Contrôle et de Prévention; Institut de recherche Robert-Sauvé en santé et en sécurité du travail du Québec: Montréal, QC, Canada, 2001. [Google Scholar]
- Brenner, D.J.; Garrity, G.M.; Bergey, D.H. (Eds.) Bergey’s Manual of Systematic Bacteriology the Proteobacteria—The Gammaproteobacteria, 2nd ed.; Springer: New York, NY, USA, 2005. [Google Scholar]
Publisher’s Note: MDPI stays neutral with regard to jurisdictional claims in published maps and institutional affiliations. |
© 2022 by the authors. Licensee MDPI, Basel, Switzerland. This article is an open access article distributed under the terms and conditions of the Creative Commons Attribution (CC BY) license (https://creativecommons.org/licenses/by/4.0/).