
Large Methane Emission from the River Inlet Region of Eutrophic Lake: A Case Study of Lake Taihu
by
 and
and
Yuanshan Liao
1,2,
Haijin Lan
3,
Xinyue Zhang
4,
Zhenjing Liu
5,
Mi Zhang
4,
Zhenghua Hu
4,
Hongtao Duan
1,2,* and
Qitao Xiao
2,* 1
College of Urban and Environmental Sciences, Northwest University, Xi’an 710127, China
2
Key Laboratory of Watershed Geographic Sciences, Nanjing Institute of Geography and Limnology, Chinese Academy of Sciences, Nanjing 210008, China
3
Ecological Protection Center of Lake Ulansuhai, Bayannur 015000, China
4
Collaborative Innovation Center on Forecast and Evaluation of Meteorological Disasters (CIC-FEMD), Nanjing University of Information Science and Technology, Nanjing 210044, China
5
Hunan Climate Center, Changsha 410118, China
*
Authors to whom correspondence should be addressed.
Atmosphere 2023, 14(1), 16; https://doi.org/10.3390/atmos14010016
Submission received: 26 September 2022
/
Revised: 26 November 2022
/
Accepted: 19 December 2022
/
Published: 22 December 2022
(This article belongs to the Special Issue Carbon Emission and Transport: Measurement and Simulation)
Abstract
:Lakes are important natural sources of atmospheric methane (CH4), which should be considered in global CH4 budget estimations. However, the CH4 emissions from lakes can be highly variable, and the emissions from the river inlet region were less studied, which seriously hamper our understanding of CH4 budget estimates of lakes. Here, field measurements from over six years (2012 to 2017) at Lake Taihu, a large eutrophic shallow lake with a complicated river network, were conducted to address the issue. Results show that the river inlet region of the lake was a hot spot of CH4 emission. The CH4 emission at the river inlet region with an annual mean value of 0.183 mmol m−2 d−1 was seven times higher than that at pelagic region (0.028 mmol m−2 d−1). Peak CH4 emission occurred in warm seasons, and the lowest in cold seasons at the pelagic region, but peak emission occurred in cold seasons at the river inlet region. The seasonal CH4 emission at the pelagic region can be explained by water temperature; however, less temperature dependency of CH4 emission at the river inlet region was found. The variability of CH4 emission was linked to pollution loadings, and CH4-rich water in the inflowing river likely sustained the large CH4 emission of river inlet region.
1. Introduction
Methane (CH4) is an important atmospheric greenhouse gas, which has great significant warming impacts. Atmospheric CH4 concentrations renewed growth since 2007, and continue to show an increasing trend to date [1], seriously threatening the temperature targets of the Paris Agreement. The increasing CH4 concentration in the atmosphere motivated researchers to investigate the emission sources of CH4, such as anthropogenic and natural sources [2,3]. There is a large uncertainty in the estimation of CH4 emission from a natural source, and its influence on the variability of atmospheric CH4 concentration is still unclear, which needs to be focused on [2,4,5].
Inland water (lakes, reservoirs, and rivers) are key natural source of CH4 emissions [6,7]. Recent studies report that nearly 50% of global CH4 emissions come from aquatic ecosystems, such as lakes [5]. Inland lakes (5 × 10⁶ km2) only account for 3.7% of the total land area [8], but contributes about 70% of CH4 emissions from inland water due to its strong anthropogenic influence and high productivity. The CH4 emissions from lakes are affected by eutrophication with algal blooms, and the increase in lake eutrophication significantly stimulates CH4 emission to the atmosphere [9,10,11]. Lake eutrophication is widespread, leading to lakes’ hot spots for atmospheric CH4 emissions [9].
The CH4 emissions from lakes can be highly variable across time and space due to the heterogeneity of environmental conditions. Temporally, the lake CH4 emission flux is higher in the summer than in the winter due to higher water temperature [12,13]. Spatially, the lakes’ CH4 emission varied greatly, which was associated with lake morphometry [14,15], eutrophic status [9,10], and river discharge [16,17]. It should be noted that the CH4 emission is spatially heterogeneous in small (0.01 km2 in size) to large lakes with a size of larger than 1000 km2 [10,18,19]. The spatial heterogeneity seems to be controlled by river discharge [16,20], because lakes receive large amounts of nutrients and organic matter via river input [21], which in turn affects the CH4 emission. However, the CH4 emissions from the river inlet region of lakes were less studied, which would seriously hamper our understanding of CH4 budget estimates of lakes.
Lake Taihu, with a surface area of 2338 km2 and a mean depth of 1.9 m, is the third largest freshwater lake in China. Here, we investigated the spatial–temporal variability of CH4 emission based on long-term (2012–2017) field measurement at Lake Taihu. The lake was chosen for the study site mostly due to three reasons. First, there are 172 rivers or channels connecting to the lake, which has distinct inflow and outflow regions throughout the year [22,23]; therefore, it gives us an opportunity to explore the CH4 emission dynamics at the river inlet region. Second, the lake was characterized by a subtropical climate with a high temperature in the summer and a low temperature in the winter, it is interesting to investigate the seasonal variation in CH4 emission, especially for the river inlet region. Third, eco-environmental issues (e.g., frequent algal blooms) made the lake become a popular study site in China and around the world in recent decades [24,25,26]. It is important to note that the northwest part of the lake was hyper-eutrophic, with severe algal blooms mostly due to pollutant discharge via Dapu River and Yincun Port. In particular, the highly polluted Dapu River and Yincun Port, as the main upstream rivers of the lake, discharged a large number of external loadings into the lake. Therefore, the inlet regions of Dapu River and Yincun Port were selected to investigate the effects of river discharge on CH4 emissions.
The specific objectives of this study are: (1) to characterize the spatial–temporal variability of CH4 emission at the lake with river discharge, (2) to investigate the influences of environmental conditions, including the algal blooms, on the observed CH4 emission variabilities, and (3) to quantify the role of the river inlet region in CH4 emission estimates.
2. Materials and Methods
2.1. Study Area and Sampling Locations
Lake Taihu (30°05′–32°08′ N, 119°08′–121°55′ E) has a surface area of 2338 km2, a mean depth of 1.9 m and a maximum depth of 3.3 m, a length of 70 km (from north to south) and a width of 60 km (from east to west), and a catchment area of 36,500 km2 [22]. Water temperature of the lake is remarkably uniform, varying spatially by less than 2 °C at hourly intervals [27] and by less than 0.6 °C at monthly intervals [28]. The annual mean surface water temperature is about 18.1 °C and the annual precipitation is about 1100 mm [10,27]. The lake was surrounded by several large cities (e.g., Wuxi City and Suzhou City), therefore, urban pollutant discharge, domestic sewage, and agricultural fertilizers are the primary pollution source. It is estimated that the anthropogenic nitrogen loading inputs through inflow rivers were about 2.8 × 10⁴ t yr−1~5.4 × 10⁴ t yr−1 [22,29]; the load of pollutants into the lake via Dapu River alone accounts for about 50% of the total amount into the lake. Large external pollutant discharge resulted in poor water quality and algal blooms.
Seasonal field measurements in February, May, August, and November from 2012 to 2017 were carried out. Water samples were collected at Site A from February 2012 to August 2013, while at Site B and Site C from 2012 to 2017 (Figure 1). Site A and Site B were located at the northwest part of the lake, which was eutrophic due to pollution discharged by urban and agricultural runoffs [21]. Importantly, Site A and Site B were influenced by the inflowing river, the Dapu River and Yincun Port, thus they were the river inlet region of the lake. A previous study showed that the total nitrogen concentration of the river was larger than 3 mg L−1 [21]. Site C was located at the central zone of the lake, which was the pelagic region, with low human activity disturbance. Meanwhile, water samples were also collected seasonally at the Dapu River (Site D, Figure 1) since May 2013 to February 2016 (12 seasonal sampling sites).
2.2. Lake CH4 Survey
Water samples were collected to measure the dissolved CH4 concentration. In the field, we sampled water at the fixed 20 cm depth below the water surface and poured the water into a 300 mL glass bottle. The bottle was sealed after collection without air space using a butyl rubber stopper. The glass bottle was washed with local bubble-free lake water prior to collection. The collected water samples were saved in coolers in the field and then were transported to the lab for analysis. The dissolved CH4 concentration was determined with the headspace equilibration method [30]. Briefly, we injected 100 mL ultra-high purity N2 gas (99.999%) into the glass bottle to create headspace at the lab, and then the glass bottle was shaken vigorously for 5 min to allow the CH4 gas to reach equilibrium between the residual water and headspace. An air sample was drawn from the headspace section of the glass bottle and injected into a gas chromatograph for CH4 measurement. At last, the dissolved CH4 concentration was calculated according to a temperature-dependent Henry’s law constant.
The diffusive CH4 emission flux (Fm, mmol m−2 d−1) across the lake–air interface was calculated based on the bulk diffusion model, as:
the k is gas exchange velocity, Cw is the dissolved CH4 concentration at the surface water (at the depth of 20 cm), which was determined by headspace equilibration method as suggested above, and Ceq is the gas concentration in the water that is in equilibrium with the atmosphere at the in situ temperature. The gas exchange velocity k (m d−1) is dependent on wind speed at large lake [10,31], as:
where Sc is the Schmidt number [32], and U10 is the wind speed at 10 m height and was obtained from the Lake Taihu eddy flux net [27].
Fm = k × (Cw − Ceq)
2.3. Auxiliary Data
The water temperature (Tw), pH, dissolved oxygen concentration (DO), and specific conductance (Spc) were measured in situ with a multi-parameter probe (YSI 650MDS, YSI, Yellow Springs, OH, USA) in each lake survey. The water depth and water clarity (given by Secchi disc depth) were also measured. Additionally, water samples were also collected for chemical and biological property measurements. The biological and chemical properties included total nitrogen (TN), ammonium nitrogen (-N), nitrate nitrogen (-N), total phosphorus (TP), dissolved organic carbon (DOC), and chlorophyll a (Chl a). The sampling and analysis of biological and chemical property variables were previously reported in detail [21,24,33]. The seasonal precipitation and inflowing water yield during the sampling period were obtained from the Taihu Basin Authority (http://www.tba.gov.cn/, accessed on 9 September 2022).
3. Results
3.1. Environmental Condition
The precipitation varied seasonally with the peak occurring in summer (Figure 2a). Consistent with the precipitation, peak inflowing water yield also occurred in summer, suggesting that precipitation controlled the variability of inflowing water yield. Generally, the peak water depth of the two sampling sites (Site A and Site B) occurred in summer. It should be note that water depth at Site A, with a mean value of 1.9 m, was significantly lower than that at Site B, with mean value of 2.7 m.
Field measurements showed the water temperature between the two sampling sites were not significant (Table 1), which was consistent with previous studies [27,28]. However, strong seasonal variation in water temperature was found (Figure 3a), and the mean water temperature at spring, summer, autumn, and winter were 22.6 °C, 29.2 °C, 14.1 °C, and 6.1 °C, respectively. In line with water temperature, the Chl a varied seasonally with the peak occurring in summer and the lowest in winter. Peak nutrient concentrations occurred in cold seasons (e.g., winter), especially for Site A, with river discharge (Figure 3c,d). Overall, Site A and Site B were featured by poor water quality compared to Site C. Particularly, the pH and DO at Site A were significantly lower than that at Site B, but higher nutrients (e.g., -N, -N, TN, and TP), Chl a, and DOC occurred in Site A and Site B (Table 1).
3.2. Spatial Variations of CH4 Emission
The CH4 emission varies significantly across sampling sites (Figure 4). The mean CH4 diffusion fluxes at the three sampling sites were 0.322 mmol m−2 d−1 (Site A), 0.143 mmol m−2 d−1 (Site B), and 0.028 mmol m−2 d−1 (Site C), respectively. The CH4 diffusion flux at Sites A and Site B were significantly (p < 0.01) higher than that at Site C, and the CH4 flux difference at the two estuaries (Site A and Site B) were also significant (p < 0.01). At the regional level, the average CH4 diffusion flux in the river inlet region was 0.183 mmol m−2 d−1, which was seven times higher than that in the pelagic region (Site C) of the lake.
3.3. Temporal Variations of CH4 Emission
The CH4 emission flux varied greatly at the river inlet region of the lake (Site A and Site B) and the pelagic region of the lake (Site C) across different sampling dates (Figure 5). The emission at Site A, Site B, and Site C ranged from 0.048 mmol m−2 d−1 to 0.826 mmol m−2 d−1, 0.009 mmol m−2 d−1 to 0.654 mmol m−2 d−1, and 0.001 mmol m−2 d−1 to 0.145 mmol m−2 d−1, respectively. The CH4 emission flux at the three sampling sites showed seasonality: autumn (0.826 mmol m−2 d−1) > summer (0.329 mmol m−2 d−1) > winter (0.200 mmol m−2 d−1) > spring (0.183 mmol m−2 d−1) for Site A; winter (0.213 mmol m−2 d−1) > spring (0.148 mmol m−2 d−1) > autumn (0.118 mmol m−2 d−1) > summer (0.091 mmol m−2 d−1) for Site B; and summer (0.070 mmol m−2 d−1) > autumn (0.018 mmol m−2 d−1) > spring (0.010 mmol m−2 d−1) > winter (0.011 mmol m−2 d−1) for Site C.
The CH4 emission at Site B was always higher than that at Site C (Figure 5). Thus, the river inlet region of the eutrophic lake was a hot spot of atmospheric CH4 emission. However, long-term field measurements found a significant decreasing trend in dissolved CH4 at Site B, the sampling site of river inlet region (Figure 1), which was consistent with the variability of -N (Figure 6). The variability trend of dissolved CH4 at pelagic region was insignificant.
3.4. Factors Influencing the CH4 Emission Variability
The seasonal CH4 emissions were positively correlated with -N (R2 = 0.22, p < 0.05) and -N (R2 = 0.22, p < 0.05) at the river inlet region (Site A and Site B) (Figure 7); however, the CH4 emission at Site C was negatively correlated with -N (R2 = 0.37, p < 0.01) and unrelated to -N (p > 0.05). The temporal variations in water temperature explain 34% of the observed variance in the CH4 emission at Site C (Figure 7c; p < 0.01), but the temporal variability of CH4 emission at the river inlet region (Site A and Site B) was uncorrelated with water temperature (p > 0.05). Similar to water temperature, the Chl a, an index of algal biomass, was positively correlated with CH4 emission at Site C (R2 = 0.21, p < 0.05; Figure 7d). Interestingly, the seasonal CH4 emission was negatively correlated with Chl a at the river inlet region (Site A and Site B) (Figure 7d) and unrelated (p > 0.05) with DOC at the three sites. It is worth noting that -N concentration explained 70% of the observed variance (R2 = 0.70, p < 0.01) in the CH4 emission flux at Site B from 2012 to 2017.
In addition, we found the dissolved CH4 varied greatly across sites and time (Figure 8). The dissolved CH4 concentrations at Site D and Site B ranged from 19.65 nmol L−1 to 614.71 nmol L−1 and 13.91 nmol L−1 to 622.81 nmol L−1, respectively. The dissolved CH4 at the two sampling sites showed seasonality: winter (269.02 nmol L−1) > autumn (145.43 nmol L−1) > summer (40.77 nmol L−1) > spring (28.85 nmol L−1) for Site B, and winter (476.62 nmol L−1) > autumn (192.74 nmol L−1) > spring (144.04 nmol L−1) > summer (47.69 nmol L−1) for Site D. It is worth noting that the dissolved CH4 of Site B and Site D were higher in cold seasons than in warm seasons.
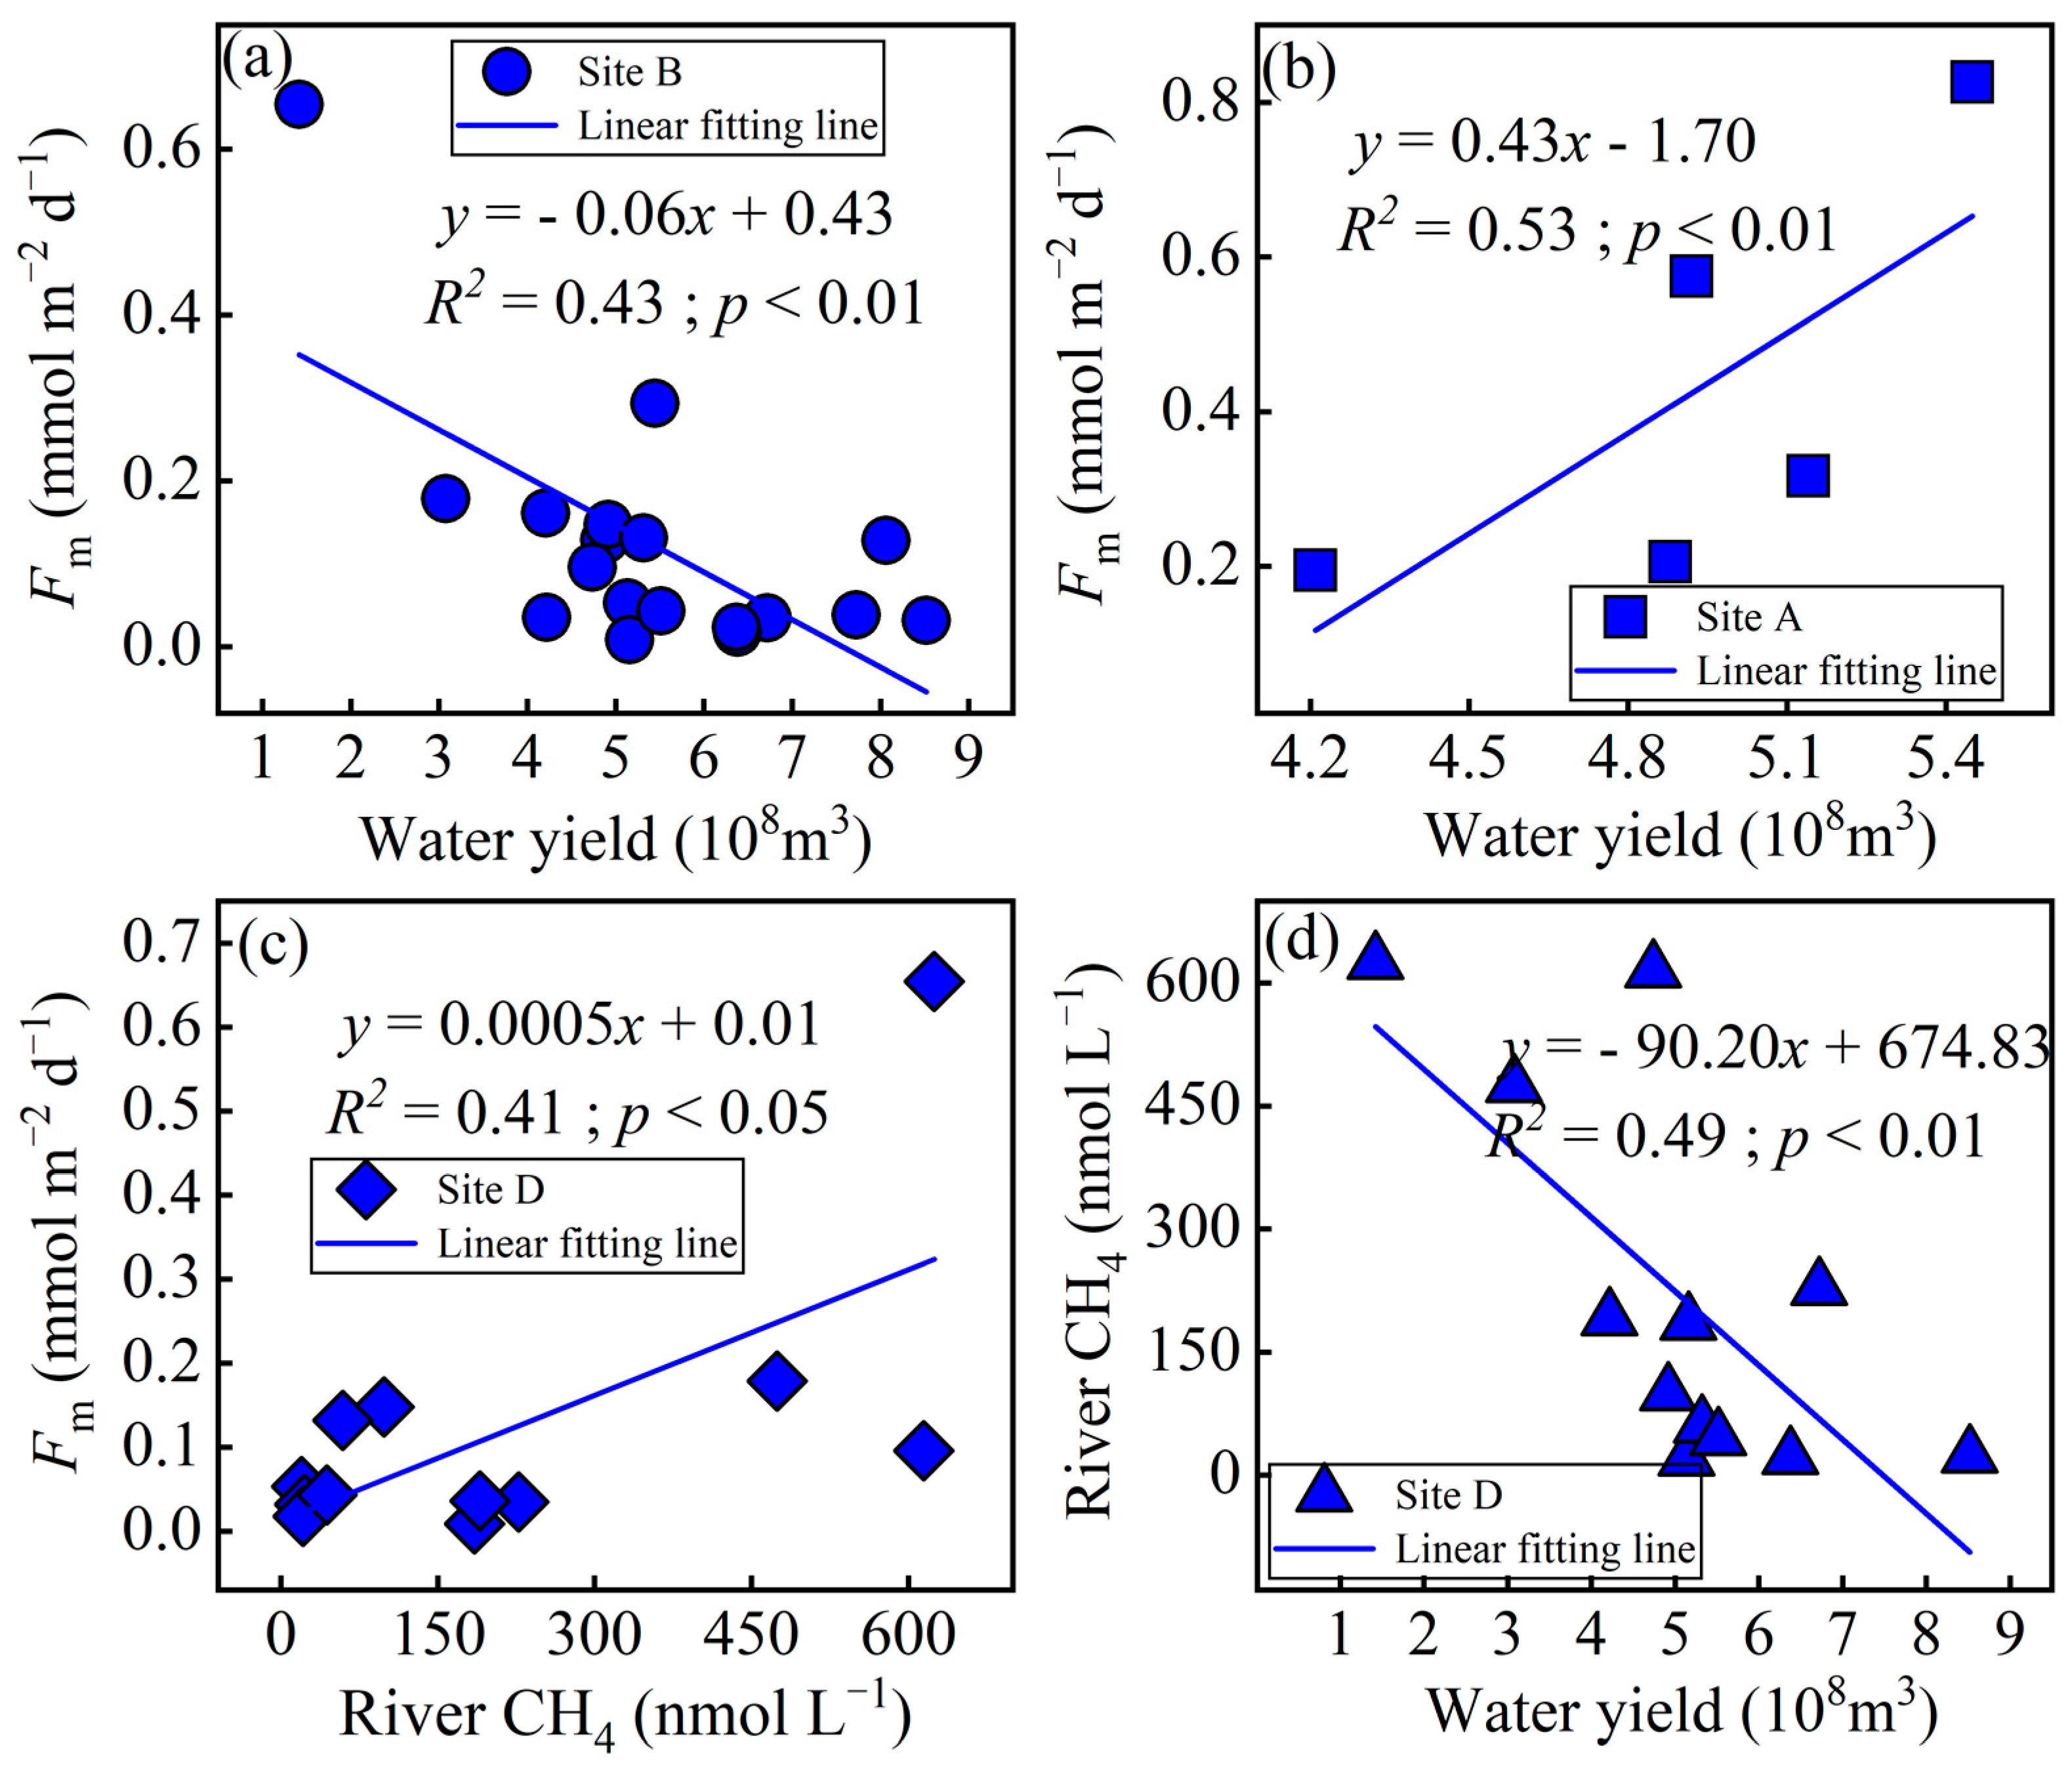
Importantly, the seasonal CH4 emission flux at Site B, the inlet region of the lake, was correlated with inflowing water yield and the dissolved CH4 concentration of the inflowing river (Figure 9). In particular, the seasonal CH4 emission was negatively correlated with the water yield (R2 = 0.43, p < 0.01), and positively correlated with the concentration of dissolved CH4 in Dapu River (R2 = 0.41, p < 0.05), indicating that CH4 carried by Dapu River into the lake was the primary reason influencing the emission flux at the inlet Site B. Meanwhile, it is also worth noting that the dissolved CH4 concentration of Dapu River was also negatively correlated with water yield (R2 = 0.49, p < 0.01; Figure 9d). However, the seasonal CH4 emission of Site A was positively correlated with water yield (R2 = 0.53, p < 0.05; Figure 9b).
4. Discussion
4.1. Potential Factors Sustaining the Large CH4 Emission in River Inlet Region
Long-term (2012–2017) field measurements showed the river inlet region of the eutrophic lake was a hot spot of atmospheric CH4 emission. On the annual basis, the CH4 emission at the Dapu River inlet region was 0.143 mmol m−2 d−1, which was 5 times higher than that at Site C of pelagic region, and the emission flux at the Yincun port region (0.322 mmol m−2 d−1) was 12 times higher than that at Site C. The river inlet region was eutrophic with algal blooms [21], and previous studies suggested algal blooms could stimulate CH4 production and emission due to large algal-derived organic carbon [10,34,35,36]. However, we found that seasonal CH4 emission variability in the river inlet region was uncorrelated with algal biomass indicator Chl a (Figure 7), and peak CH4 emission of the river inlet region occurred in winter (Figure 5), during which the Chl a concentration was very low due to cold temperature (Figure 3) [37]. All this suggests that large CH4 emissions in the inlet region were not caused by algal blooms.
Some studies proposed that catchment input affected the CH4 flux variability of the river inlet region [16,38,39]. The lake’s CH4 emission varied spatially, which was linked to river discharge [16,17]. Meanwhile, literature surveys indicate that dissolved CH4 concentrations in streams are generally lower than in lakes, suggesting that the large CH4 emission of the river inlet region was not attributed to the CH4 concentration in the river itself [40,41]. In our case, the dissolved CH4 concentration at the inflowing river with a mean value of 215.27 nmol L−1 was significantly higher than that at Site B with 121.02 nmol L−1 based on synchronous field measurements. Importantly, the CH4 emission flux of the river inlet region was positively correlated with river CH4 concentration, and peak river CH4 concentration corresponded to peak CH4 emission of the river inlet region during winter. Thus, our results suggest that CH4-rich water in the river sustained the large CH4 emission of the river inlet region.
The role of enhanced CH4 production of the river inlet region should not be neglected in sustaining large CH4 production. The river inlet region was featured by shallow water depth (Figure 2), which likely played role in the CH4 emission. A negative relationship between CH4 emission and water depth was found in previous studies, mostly because of the short oxidation pathway [42,43,44]. Meanwhile, large CH4 emissions from shallow zones of the lake were reported [10,44,45]. It is well known that most produced CH4 would be oxidized when transporting to water surface, and shallow water depth may avoid CH4 to be oxidized and lead to high CH4 emission from the water surface to the atmosphere [10,42]. Additionally, the pollutant loading (e.g., -N and -N) was also significantly higher in the river inlet region, and it is worth noting that -N concentration explained 70% of the observed variance (R2 = 0.70, p < 0.01) in the CH4 emission flux at Site B. However, we found no correlation between CH4 diffusion flux and TP in the river inlet region (p > 0.05). In conclusion, the high nutrient loadings of the river inlet region may also contribute to large CH4 emission [17,46,47].
4.2. Role of Temperature in CH4 Flux Variability
Many studies found that the lake CH4 emission increased significantly with the temperature [10,48,49]. The CH4 emission at the pelagic region (Site C) varied seasonally, and the correlation between temporal variations in the CH4 flux was positively correlated with temperature and was unrelated to nutrient loadings (Figure 7), although correlations between CH4 emission and lake pollution were reported [50]. Thus, temperature played a key role in determining the lake CH4 emission of the lake.
However, the role of temperature in determining CH4 flux variability varied between regions. The CH4 flux at the river inlet region (Site A and Site B) also varied significantly across different times, which was consistent with previous studies showing the river inlet areas were generally characterized by high seasonality in emission flux [51]. It should be noted the seasonal variation in emission flux was unrelated to temperature, but linked to nutrient loadings and catchment input (Figure 7 and Figure 9). A long-term experiment showed that nutrient loadings overwhelm temperature in determining lake CH4 emission [30]. Considering the river regions were affected by river discharge, the temperature dependency of the CH4 flux may be affected by external loading input. Thus, the catchment characteristic should be considered in determining CH4 emission dynamics of the river inlet region.
4.3. Implication of the Study
The previous study showed that the large lake had low CH4 emission, because lake CH4 emission decreased with increasing lake size, and the large lake had less emission flux [14,15]. Indeed, the CH4 emission flux of the pelagic region (Site A and Site B) of the lake was lower [15], but the CH4 emission flux was significantly higher at the river inlet region of the lake, which should be considered in the lake CH4 budget estimation. Meanwhile, it should be noted that the CH4 emission of the river inlet region was unrelated to temperature and Chl a, suggesting global warming and increasing eutrophication may influence the CH4 variability less. The previous study proposed that temperature proxies could act as a solution to biased measurements of lake methane emissions [48]; this may be not suitable for the river inlet region due to less dependency on CH4 emission.
The correlations between CH4 emission and inflowing water yield should call our attention. Water yield was positively correlated with CH4 emission at Site A, but negatively correlated with CH4 emission at Site B (Figure 9). Considering that water yield was driven by precipitation (Figure 2), precipitation either was negatively or positively correlated with the CH4 emission of the river inlet region. Precipitation could transport more pollutant loadings to the aquatic ecosystems, and then increase CH4 emission via stimulating production rate [52,53], likely leading to a positive correlation between water yield and CH4 emission at Site A. Meanwhile, it seems that the CH4 concentration and emission was low during heavy precipitation, and small runoff may contribute to large CH4 emission, especially for winter at Site B. Although the previous study demonstrated that precipitation increased the pollutant loading, such as inorganic nitrogen in the inflowing rivers of this study [54]. Precipitation-induced river discharge should receive much attention to explore the effects of external loading input on CH4 emission.
The CH4 emission flux with a mean value of 0.028 mmol m−2 d−1 in the pelagic region of the lake was significantly lower compared to other studies. For example, the previous study showed that the CH4 emission from African lakes is 0.068 mmol m−2 d−1 [4], East Plain lakes in China is 1.214 mmol m−2 d−1 [46], and temperate lakes is 0.618 mmol m−2 d−1 [6]. However, the diffusive CH4 emission of the river inlet region (0.183 mmol m−2 d−1) was significantly higher than that mean value (0.15 mmol m−2 d−1) of global lakes [42] and the lake >100 km2 of global lakes [15].
5. Conclusions
Filed measurements over six years (2012–2017) at Lake Taihu, a large eutrophic shallow lake with complicated river networks, showed that the CH4 emission varied spatially and temporally. Spatially, the river inlet region was a hot spot of atmospheric CH4 emission. The CH4 emission at the river inlet region with an annual mean value of 0.183 mmol m−2 d−1 was seven times higher than that at pelagic region (0.028 mmol m−2 d−1). Temporally, the peak CH4 emission occurred in warm seasons and was the lowest in cold seasons at the pelagic region, but the peak CH4 emission occurred in cold seasons at the river inlet region of the lake.
The seasonal variability of CH4 emission at the pelagic region can be explained by water temperature; however, less temperature dependency on CH4 emission at the river inlet region was found. Generally, the variability of CH4 emission was linked to pollution loadings, and high dissolved CH4 in river sustained the large CH4 emission of the river inlet region. It should be noted that peak river CH4 concentration corresponded to peak CH4 emission of the river inlet region during winter. The CH4 emission flux at the river inlet region of the lake should be considered in the lake CH4 budget estimation.
Author Contributions
Conceptualization, M.Z. and Z.H.; Methodology, X.Z.; Investigation, H.L.; Writing—Original draft, Y.L. and Z.L.; Writing—Review & editing, H.D. and Q.X. All authors have read and agreed to the published version of the manuscript.
Funding
The study was funded jointly by Provincial Science and Technology Innovative Program for Carbon Peak and Carbon Neutrality of Jiangsu of China (BK20220018 and BK20220041), the National Natural Science Foundation of China (42271114, 42271377, 41971309, 41971314), and Science and Technology Planning Project of Bayannur (K202124).
Institutional Review Board Statement
Not applicable.
Informed Consent Statement
Not applicable.
Data Availability Statement
Not applicable.
Conflicts of Interest
The authors declare no conflict of interest.
References
- Nisbet, E.G.; Dlugokencky, E.J.; Bousquet, P. Methane on the Rise-Again. Science 2014, 343, 493–495. [Google Scholar] [CrossRef] [PubMed] [Green Version]
- Kirschke, S.; Bousquet, P.; Ciais, P.; Saunois, M.; Canadell, J.G.; Dlugokencky, E.J.; Bergamaschi, P.; Bergmann, D.; Blake, D.R.; Bruhwiler, L.; et al. Three Decades of Global Methane Sources and Sinks. Nat. Geosci. 2013, 6, 813–823. [Google Scholar] [CrossRef] [Green Version]
- Stavert, A.R.; Saunois, M.; Canadell, J.G.; Poulter, B.; Jackson, R.B.; Regnier, P.; Lauerwald, R.; Raymond, P.A.; Allen, G.H.; Patra, P.K.; et al. Regional Trends and Drivers of the Global Methane Budget. Glob. Chang. Biol. 2021, 28, 182–200. [Google Scholar] [CrossRef] [PubMed]
- Borges, A.V.; Deirmendjian, L.; Bouillon, S.; Okello, W.; Lambert, T.; Roland, F.A.E.; Razanamahandry, V.F.; Voarintsoa, N.R.G.; Darchambeau, F.; Kimirei, I.A. Greenhouse Gas Emissions from African Lakes Are No Longer a Blind Spot. Sci. Adv. 2022, 8, eabi8716. [Google Scholar] [CrossRef]
- Rosentreter, J.A.; Borges, A.V.; Deemer, B.R.; Holgerson, M.A.; Liu, S.; Song, C.; Melack, J.; Raymond, P.A.; Duarte, C.M.; Allen, G.H.; et al. Half of Global Methane Emissions Come from Highly Variable Aquatic Ecosystem Sources. Nat. Geosci. 2021, 14, 225–230. [Google Scholar] [CrossRef]
- Bastviken, D.; Tranvik, L.J.; Downing, J.A.; Crill, P.M.; Enrich-Prast, A. Freshwater Methane Emissions Offset the Continental Carbon Sink. Science 2011, 331, 50. [Google Scholar] [CrossRef] [Green Version]
- Zhang, L.; Xia, X.; Liu, S.; Zhang, S.; Li, S.; Wang, J.; Wang, G.; Gao, H.; Zhang, Z.; Wang, Q.; et al. Significant Methane Ebullition from Alpine Permafrost Rivers on the East Qinghai–Tibet Plateau. Nat. Geosci. 2020, 13, 349–354. [Google Scholar] [CrossRef]
- Verpoorter, C.; Kutser, T.; Seekell, D.A.; Tranvik, L.J. A Global Inventory of Lakes Based on High-Resolution Satellite Imagery. Geophys. Res. Lett. 2014, 41, 6396–6402. [Google Scholar] [CrossRef]
- Beaulieu, J.J.; DelSontro, T.; Downing, J.A. Eutrophication Will Increase Methane Emissions from Lakes and Impoundments During the 21st Century. Nat. Commun. 2019, 10, 1375. [Google Scholar] [CrossRef] [Green Version]
- Xiao, Q.; Zhang, M.; Hu, Z.; Gao, Y.; Hu, C.; Liu, C.; Liu, S.; Zhang, Z.; Zhao, J.; Xiao, W.; et al. Spatial Variations of Methane Emission in a Large Shallow Eutrophic Lake in Subtropical Climate. J. Geophys. Res.-Biogeosci. 2017, 122, 1597–1614. [Google Scholar] [CrossRef]
- Grasset, C.; Sobek, S.; Scharnweber, K.; Moras, S.; Villwock, H.; Andersson, S.; Hiller, C.; Nydahl, A.C.; Chaguaceda, F.; Colom, W.; et al. The CO2-Equivalent Balance of Freshwater Ecosystems Is Non-Linearly Related to Productivity. Glob. Chang. Biol. 2020, 26, 5705–5715. [Google Scholar] [CrossRef] [PubMed]
- Zhang, M.; Xiao, Q.; Zhang, Z.; Gao, Y.; Zhao, J.; Pu, Y.; Wang, W.; Xiao, W.; Liu, S.; Lee, X. Methane Flux Dynamics in a Submerged Aquatic Vegetation Zone in a Subtropical Lake. Sci. Total Environ. 2019, 672, 400–409. [Google Scholar] [CrossRef] [PubMed]
- Xing, Y.; Xie, P.; Yang, H.; Ni, L.; Wang, Y.; Rong, K. Methane and Carbon Dioxide Fluxes from a Shallow Hypereutrophic Subtropical Lake in China. Atmos. Environ. 2005, 39, 5532–5540. [Google Scholar] [CrossRef]
- Rasilo, T.; Prairie, Y.T.; Del Giorgio, P.A. Large-Scale Patterns in Summer Diffusive CH4 Fluxes across Boreal Lakes, and Contribution to Diffusive C Emissions. Glob. Chang. Biol. 2015, 21, 1124–1139. [Google Scholar] [CrossRef] [PubMed]
- Holgerson, M.A.; Raymond, P.A. Large Contribution to Inland Water CO2 and CH4 Emissions from Very Small Ponds. Nat. Geosci. 2016, 9, 222–226. [Google Scholar] [CrossRef]
- Natchimuthu, S.; Sundgren, I.; Gålfalk, M.; Klemedtsson, L.; Crill, P.; Danielsson, Å.; Bastviken, D. Spatio-Temporal Variability of Lake CH4 Fluxes and Its Influence on Annual Whole Lake Emission Estimates. Limnol. Oceanogr. 2016, 61, 13–26. [Google Scholar] [CrossRef] [Green Version]
- Yang, P.; Yang, H.; Sardans, J.; Tong, C.; Zhao, G.; Penuelas, J.; Li, L.; Zhang, Y.; Tan, L.; Chun, K.P.; et al. Large Spatial Variations in Diffusive CH4 Fluxes from a Subtropical Coastal Reservoir Affected by Sewage Discharge in Southeast China. Environ. Sci. Technol. 2020, 54, 14192–14203. [Google Scholar] [CrossRef]
- Casper, P.; Maberly, S.C.; Hall, G.H.; Finlay, B.J. Fluxes of Methane and Carbon Dioxide from a Small Productive Lake to the Atmosphere. Biogeochemistry 2000, 49, 1–19. [Google Scholar] [CrossRef]
- Loken, L.C.; Crawford, J.T.; Schramm, P.J.; Stadler, P.; Desai, A.R.; Stanley, E.H. Large Spatial and Temporal Variability of Carbon Dioxide and Methane in a Eutrophic Lake. J. Geophys. Res. Biogeosci. 2019, 124, 2248–2266. [Google Scholar] [CrossRef]
- Köhn, D.; Welpelo, C.; Günther, A.; Jurasinski, G. Drainage Ditches Contribute Considerably to the CH4 Budget of a Drained and a Rewetted Temperate Fen. Wetlands 2021, 41, 71. [Google Scholar] [CrossRef]
- Xiao, Q.; Xu, X.; Duan, H.; Qi, T.; Qin, B.; Lee, X.; Hu, Z.; Wang, W.; Xiao, W.; Zhang, M. Eutrophic Lake Taihu as a Significant CO2 Source During 2000–2015. Water Res. 2020, 170, 115331. [Google Scholar] [CrossRef] [PubMed]
- Qin, B.; Xu, P.; Wu, Q.; Luo, L.; Zhang, Y. Environmental Issues of Lake Taihu, China. Hydrobiologia 2007, 581, 3–14. [Google Scholar] [CrossRef]
- Xiao, W.; Wen, X.; Wang, W.; Xiao, Q.; Xu, J.; Cao, C.; Xu, J.; Hu, C.; Shen, J.; Liu, S.; et al. Spatial Distribution and Temporal Variability of Stable Water Isotopes in a Large and Shallow Lake. Isot. Environ. Health Stud. 2016, 52, 443–454. [Google Scholar] [CrossRef] [PubMed]
- Zhang, Y.; Qin, B.; Zhu, G.; Shi, K.; Zhou, Y. Profound Changes in the Physical Environment of Lake Taihu from 25 Years of Long-Term Observations: Implications for Algal Bloom Outbreaks and Aquatic Macrophyte Loss. Water Resour. Res. 2018, 54, 4319–4331. [Google Scholar] [CrossRef]
- Paerl, H.W.; Xu, H.; McCarthy, M.J.; Zhu, G.; Qin, B.; Li, Y.; Gardner, W.S. Controlling Harmful Cyanobacterial Blooms in a Hyper-Eutrophic Lake (Lake Taihu, China): The Need for a Dual Nutrient (N & P) Management Strategy. Water Res. 2011, 45, 1973–1983. [Google Scholar] [CrossRef]
- Qi, T.; Xiao, Q.; Cao, Z.; Shen, M.; Ma, J.; Liu, D.; Duan, H. Satellite Eestimation of Dissolved Carbon Dioxide Concentrations in China’s Lake Taihu. Environ. Sci. Technol. 2020, 54, 13709–13718. [Google Scholar] [CrossRef]
- Lee, X.; Liu, S.; Xiao, W.; Wang, W.; Gao, Z.; Cao, C.; Hu, C.; Hu, Z.; Shen, S.; Wang, Y.; et al. The Taihu Eddy Flux Network: An Observational Program on Energy, Water, and Greenhouse Gas Fluxes of a Large Freshwater Lake. Bull. Am. Meteorol. Soc. 2014, 95, 1583–1594. [Google Scholar] [CrossRef]
- Wang, W.; Xiao, W.; Cao, C.; Gao, Z.; Hu, Z.; Liu, S.; Shen, S.; Wang, L.; Xiao, Q.; Xu, J.; et al. Temporal and Spatial Variations in Radiation and Energy Balance across a Large Freshwater Lake in China. J. Hydrol. 2014, 511, 811–824. [Google Scholar] [CrossRef]
- Xiao, Q.; Xu, X.; Zhang, M.; Duan, H.; Hu, Z.; Wang, W.; Xiao, W.; Lee, X. Coregulation of Nitrous Oxide Emissions by Nitrogen and Temperature in China’s Third Largest Freshwater Lake (Lake Taihu). Limnol. Oceanogr. 2019, 64, 1070–1086. [Google Scholar] [CrossRef]
- Davidson, T.A.; Audet, J.; Svenning, J.C.; Lauridsen, T.L.; Søndergaard, M.; Landkildehus, F.; Larsen, S.E.; Jeppesen, E. Eutrophication Effects on Greenhouse Gas Fluxes from Shallow Lake Mesocosms Override Those of Climate Warming. Glob. Chang. Biol. 2015, 21, 4449–4463. [Google Scholar] [CrossRef]
- Read, J.S.; Hamilton, D.P.; Desai, A.R.; Rose, K.C.; MacIntyre, S.; Lenters, J.D.; Smyth, R.L.; Hanson, P.C.; Cole, J.J.; Staehr, P.A.; et al. Lake-Size Dependency of Wind Shear and Convection as Controls on Gas Exchange. Geophys. Res. Lett. 2012, 39, L09405. [Google Scholar] [CrossRef] [Green Version]
- Cole, J.J.; Caraco, N.F. Atmospheric Exchange of Carbon Dioxide in a Low-Wind Oligotrophic Lake Measured by the Addition of Sf6. Limnol. Oceanogr. 1998, 43, 647–656. [Google Scholar] [CrossRef] [Green Version]
- Xu, H.; Paerl, H.W.; Zhu, G.; Qin, B.; Hall, N.S.; Zhu, M. Long-Term Nutrient Trends and Harmful Cyanobacterial Bloom Potential in Hypertrophic Lake Taihu, China. Hydrobiologia 2017, 787, 229–242. [Google Scholar] [CrossRef]
- Bartosiewicz, M.; Maranger, R.; Przytulska, A.; Laurion, I. Effects of Phytoplankton Blooms on Fluxes and Emissions of Greenhouse Gases in a Eutrophic Lake. Water Res. 2021, 196, 116985. [Google Scholar] [CrossRef] [PubMed]
- Townsend-Small, A.; Disbennett, D.; Fernandez, J.M.; Ransohoff, R.W.; Mackay, R.; Bourbonniere, R.A. Quantifying Emissions of Methane Derived from Anaerobic Organic Matter Respiration and Natural Gas Extraction in Lake Erie. Limnol. Oceanogr. 2016, 61, S356–S366. [Google Scholar] [CrossRef] [Green Version]
- Zhang, L.; Liao, Q.; Gao, R.; Luo, R.; Liu, C.; Zhong, J.; Wang, Z. Spatial Variations in Diffusive Methane Fluxes and the Role of Eutrophication in a Subtropical Shallow Lake. Sci. Total Environ. 2021, 759, 143495. [Google Scholar] [CrossRef]
- Duan, H.; Ma, R.; Xu, X.; Kong, F.; Zhang, S.; Kong, W.; Hao, J.; Shang, L. Two-Decade Reconstruction of Algal Blooms in China’s Lake Taihu. Environ. Sci. Technol. 2009, 43, 3522–3528. [Google Scholar] [CrossRef]
- Zhou, Y.; Xiao, Q.; Yao, X.; Zhang, Y.; Zhang, M.; Shi, K.; Lee, X.; Podgorski, D.C.; Qin, B.; Spencer, R.G.M.; et al. Accumulation of Terrestrial Dissolved Organic Matter Potentially Enhances Dissolved Methane Levels in Eutrophic Lake Taihu, China. Environ. Sci. Technol. 2018, 52, 10297–10306. [Google Scholar] [CrossRef]
- Linkhorst, A.; Paranaíba, J.R.; Mendonça, R.; Rudberg, D.; DelSontro, T.; Barros, N.; Sobek, S. Spatially Resolved Measurements in Tropical Reservoirs Reveal Elevated Methane Ebullition at River Inflows and at High Productivity. Glob. Biogeochem. Cycles 2021, 35, e2020GB006717. [Google Scholar] [CrossRef]
- Crawford, J.T.; Striegl, R.G.; Wickland, K.P.; Dornblaser, M.M.; Stanley, E.H. Emissions of Carbon Dioxide and Methane from a Headwater Stream Network of Interior Alaska. J. Geophys. Res. Biogeosci. 2013, 118, 482–494. [Google Scholar] [CrossRef]
- Lundin, E.J.; Giesler, R.; Persson, A.; Thompson, M.S.; Karlsson, J. Integrating Carbon Emissions from Lakes and Streams in a Subarctic Catchment. J. Geophys. Res. Biogeosci. 2013, 118, 1200–1207. [Google Scholar] [CrossRef] [Green Version]
- Li, M.; Peng, C.; Zhu, Q.; Zhou, X.; Yang, G.; Song, X.; Zhang, K. The Significant Contribution of Lake Depth in Regulating Global Lake Diffusive Methane Emissions. Water Res. 2020, 172, 115465. [Google Scholar] [CrossRef] [PubMed]
- Schilder, J.; Bastviken, D.; Hardenbroek, M.; Kankaala, P.; Rinta, P.; Stötter, T.; Heiri, O. Spatial Heterogeneity and Lake Morphology Affect Diffusive Greenhouse Gas Emission Estimates of Lakes. Geophys. Res. Lett. 2013, 40, 5752–5756. [Google Scholar] [CrossRef] [Green Version]
- Bastviken, D.; Cole, J.; Pace, M.; Tranvik, L. Methane Emissions from Lakes: Dependence of Lake Characteristics, Two Regional Assessments, and a Global Estimate. Glob. Biogeochem. Cycles 2004, 18, GB4009. [Google Scholar] [CrossRef]
- Encinas Fernández, J.; Peeters, F.; Hofmann, H. On the Methane Paradox: Transport from Shallow Water Zones Rather Than in Situ Methanogenesis Is the Major Source of Ch4 in the Open Surface Water of Lakes. J. Geophys. Res. Biogeosci. 2016, 121, 2717–2726. [Google Scholar] [CrossRef] [Green Version]
- Li, S.; Bush, R.T.; Santos, I.R.; Zhang, Q.; Song, K.; Mao, R.; Wen, Z.; Lu, X. Large Greenhouse Gases Emissions from China’s Lakes and Reservoirs. Water Res. 2018, 147, 13–24. [Google Scholar] [CrossRef]
- Wang, X.; He, Y.; Chen, H.; Yuan, X.; Peng, C.; Yue, J.; Zhang, Q.; Zhou, L. CH4 Concentrations and Fluxes in a Subtropical Metropolitan River Network: Watershed Urbanization Impacts and Environmental Controls. Sci. Total Environ. 2018, 622, 1079–1089. [Google Scholar] [CrossRef]
- Jansen, J.; Thornton, B.F.; Wik, M.; MacIntyre, S.; Crill, P.M. Temperature Proxies as a Solution to Biased Sampling of Lake Methane Emissions. Geophys. Res. Lett. 2020, 47, e2020GL088647. [Google Scholar] [CrossRef]
- Gabriel, Y.D.; Allen, A.P.; Bastviken, D.; Conrad, R.; Gudasz, C.; St-Pierre, A.; Thanh-Duc, N.; del Giorgio, P.A. Methane Fluxes Show Consistent Temperature Dependence across Microbial to Ecosystem Scales. Nature 2014, 507, 488–491. [Google Scholar] [CrossRef] [Green Version]
- Gonzalez-Valencia, R.; Sepulveda-Jauregui, A.; Martinez-Cruz, K.; Hoyos-Santillan, J.; Dendooven, L.; Thalasso, F. Methane Emissions from Mexican Freshwater Bodies: Correlations with Water Pollution. Hydrobiologia 2014, 721, 9–22. [Google Scholar] [CrossRef]
- Paranaíba, J.R.; Barros, N.; Almeida, R.M.; Linkhorst, A.; Mendonça, R.; do Vale, R.; Roland, F.; Sobek, S. Hotspots of Diffusive CO2 and CH4 Emission from Tropical Reservoirs Shift through Time. J. Geophys. Res. Biogeosci. 2021, 126, e2020JG006014. [Google Scholar] [CrossRef]
- Stanley, E.H.; Casson, N.J.; Christel, S.T.; Crawford, J.T.; Loken, L.C.; Oliver, S.K. The Ecology of Methane in Streams and Rivers: Patterns, Controls, and Global Significance. Ecol. Monogr. 2016, 86, 146–171. [Google Scholar] [CrossRef]
- Xiao, Q.; Hu, Z.; Hu, C.; Towfiqul Islam, A.R.M.; Bian, H.; Chen, S.; Liu, C.; Lee, X. A Highly Agricultural River Network in Jurong Reservoir Watershed as Significant CO2 and CH4 Sources. Sci. Total Environ. 2021, 769, 144558. [Google Scholar] [CrossRef] [PubMed]
- Lian, X.; Zhu, G.; Yang, W.; Zhu, M.; Xu, H. Effect of Heavy Rainfall on Nitrogen and Phosphorus Concentrations in Rivers at River-net Plain. Environ. Sci. 2020, 41, 4970–4980. [Google Scholar] [CrossRef]
Figure 1.
Map showing the three sampling sites in lake (Site A, Site B, and Site C) and the inflowing river (Dapu River) connecting Site B.
Figure 1.
Map showing the three sampling sites in lake (Site A, Site B, and Site C) and the inflowing river (Dapu River) connecting Site B.
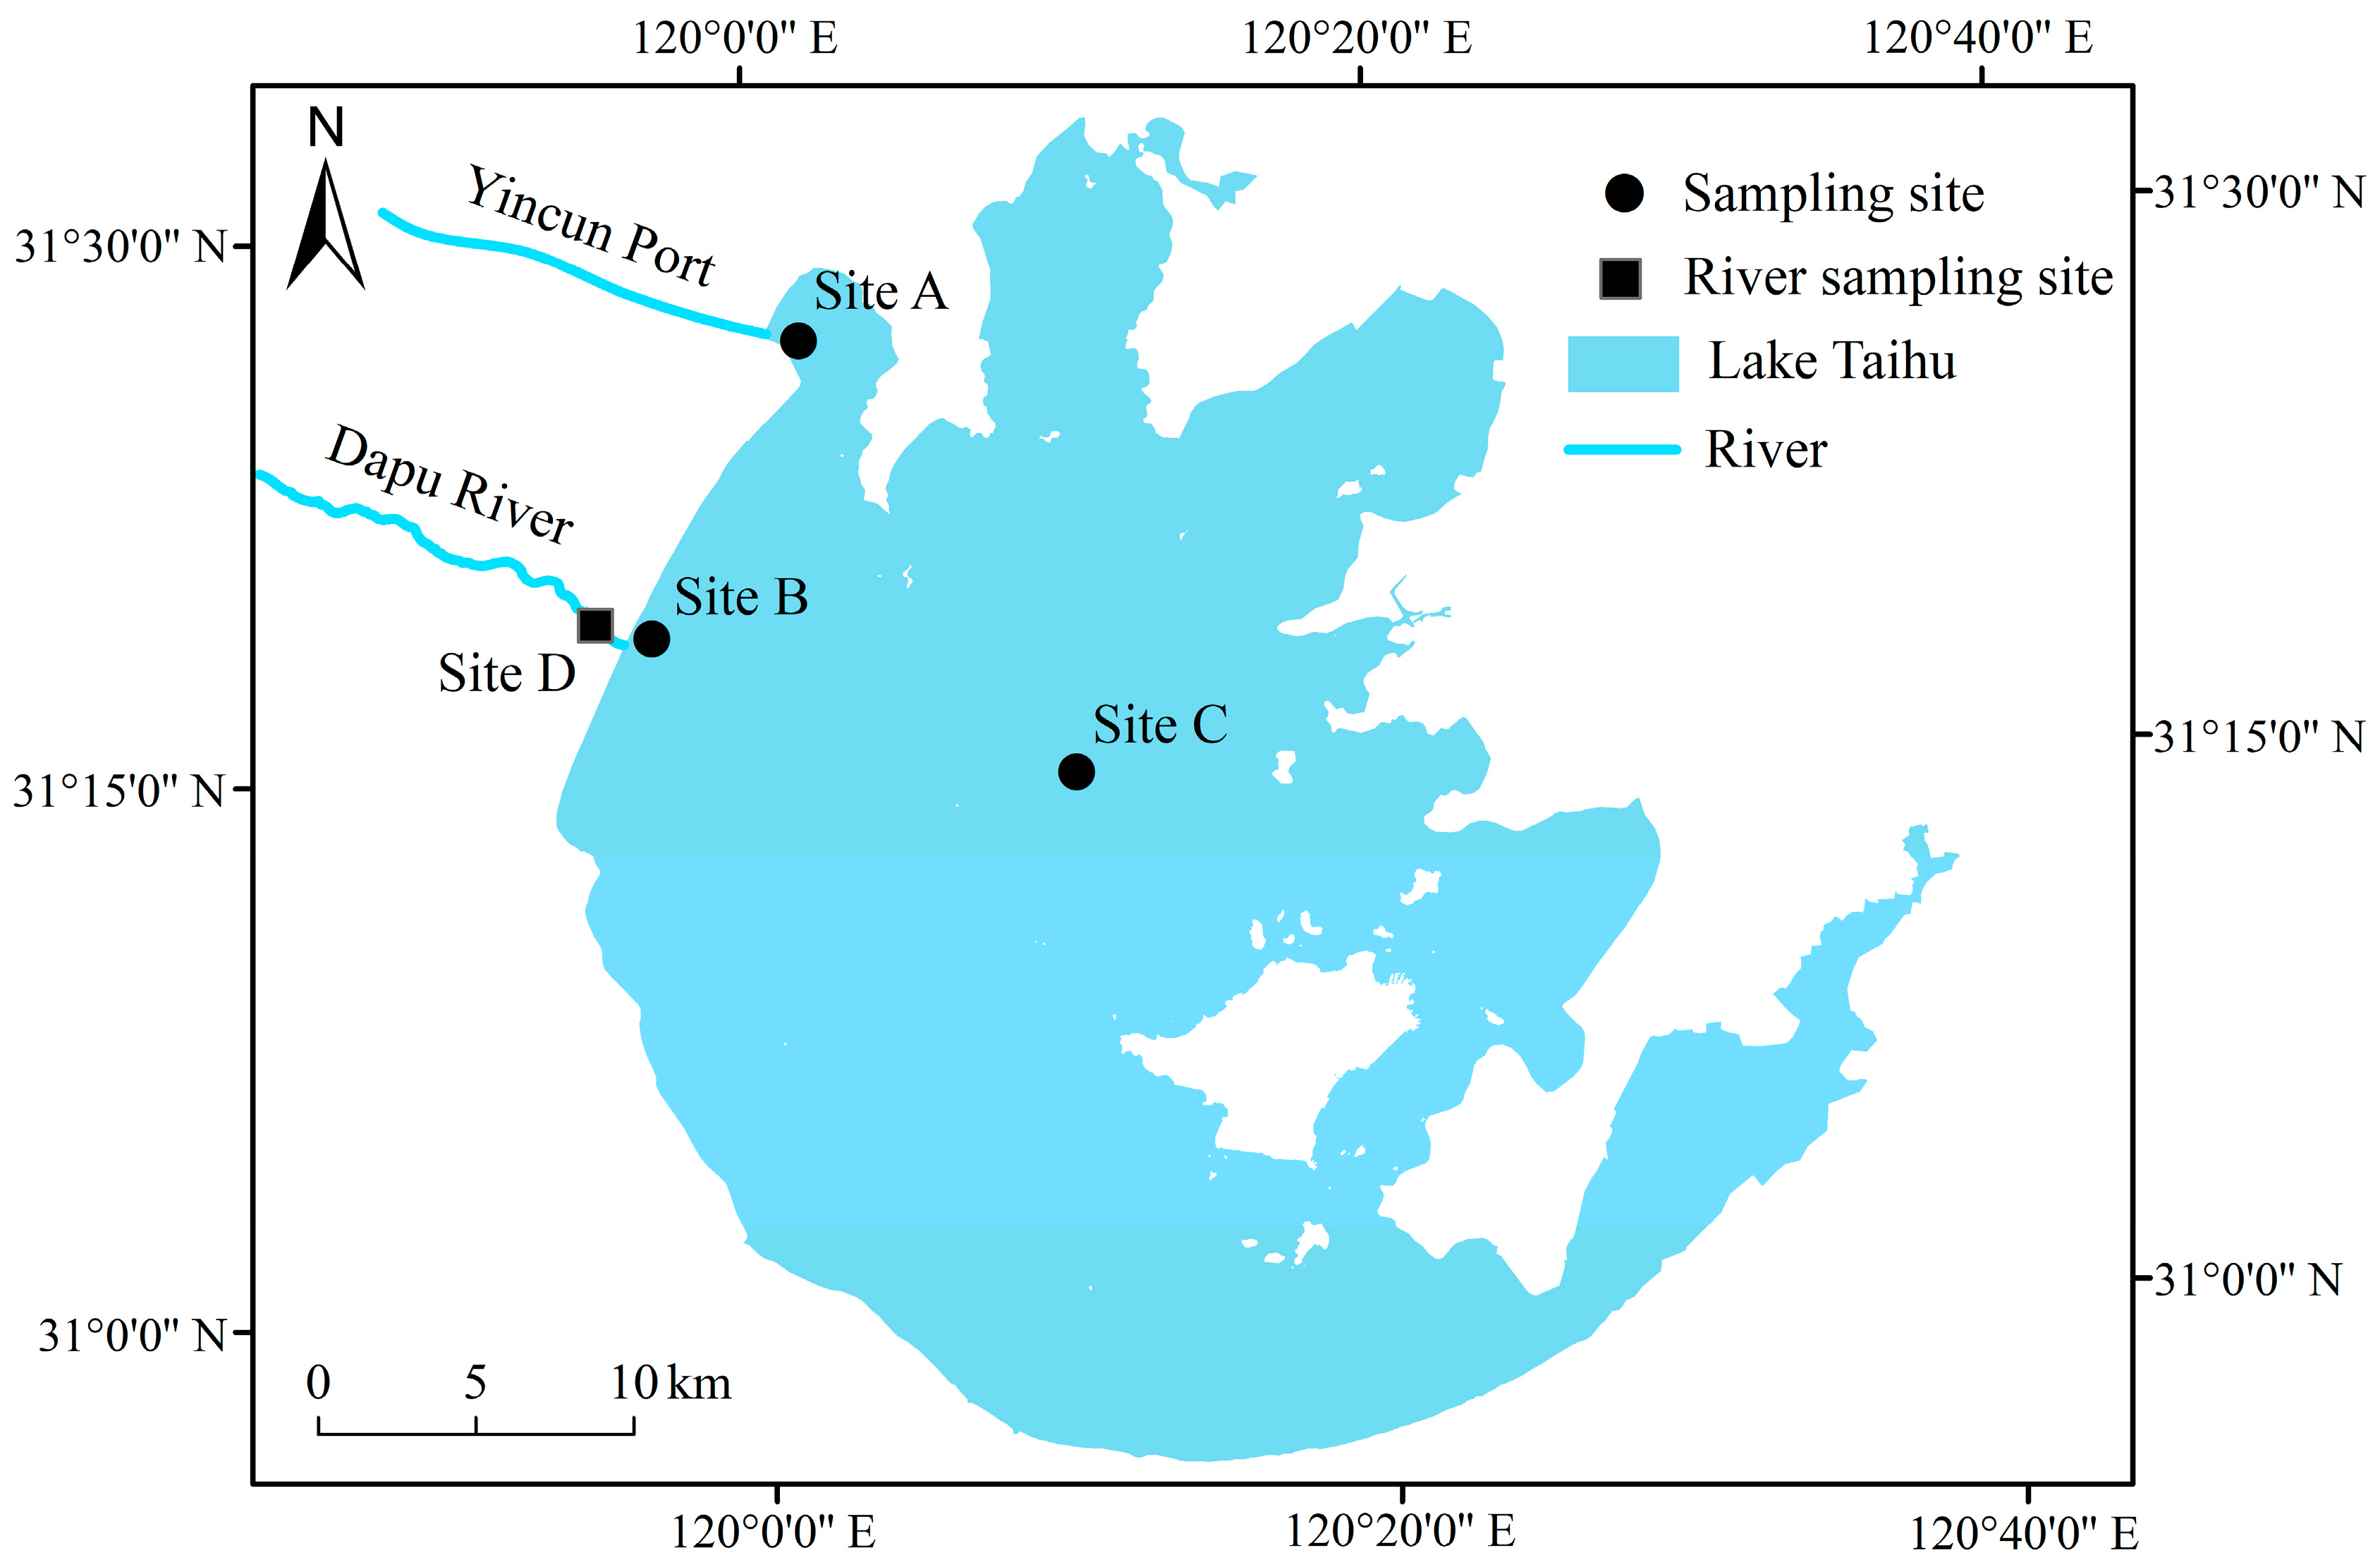
Figure 2.
Seasonal variations of precipitation and inflowing water yield (a) of Lake Taihu and (b) the variation in water depth at site A, B, and C during the sampling period.
Figure 2.
Seasonal variations of precipitation and inflowing water yield (a) of Lake Taihu and (b) the variation in water depth at site A, B, and C during the sampling period.
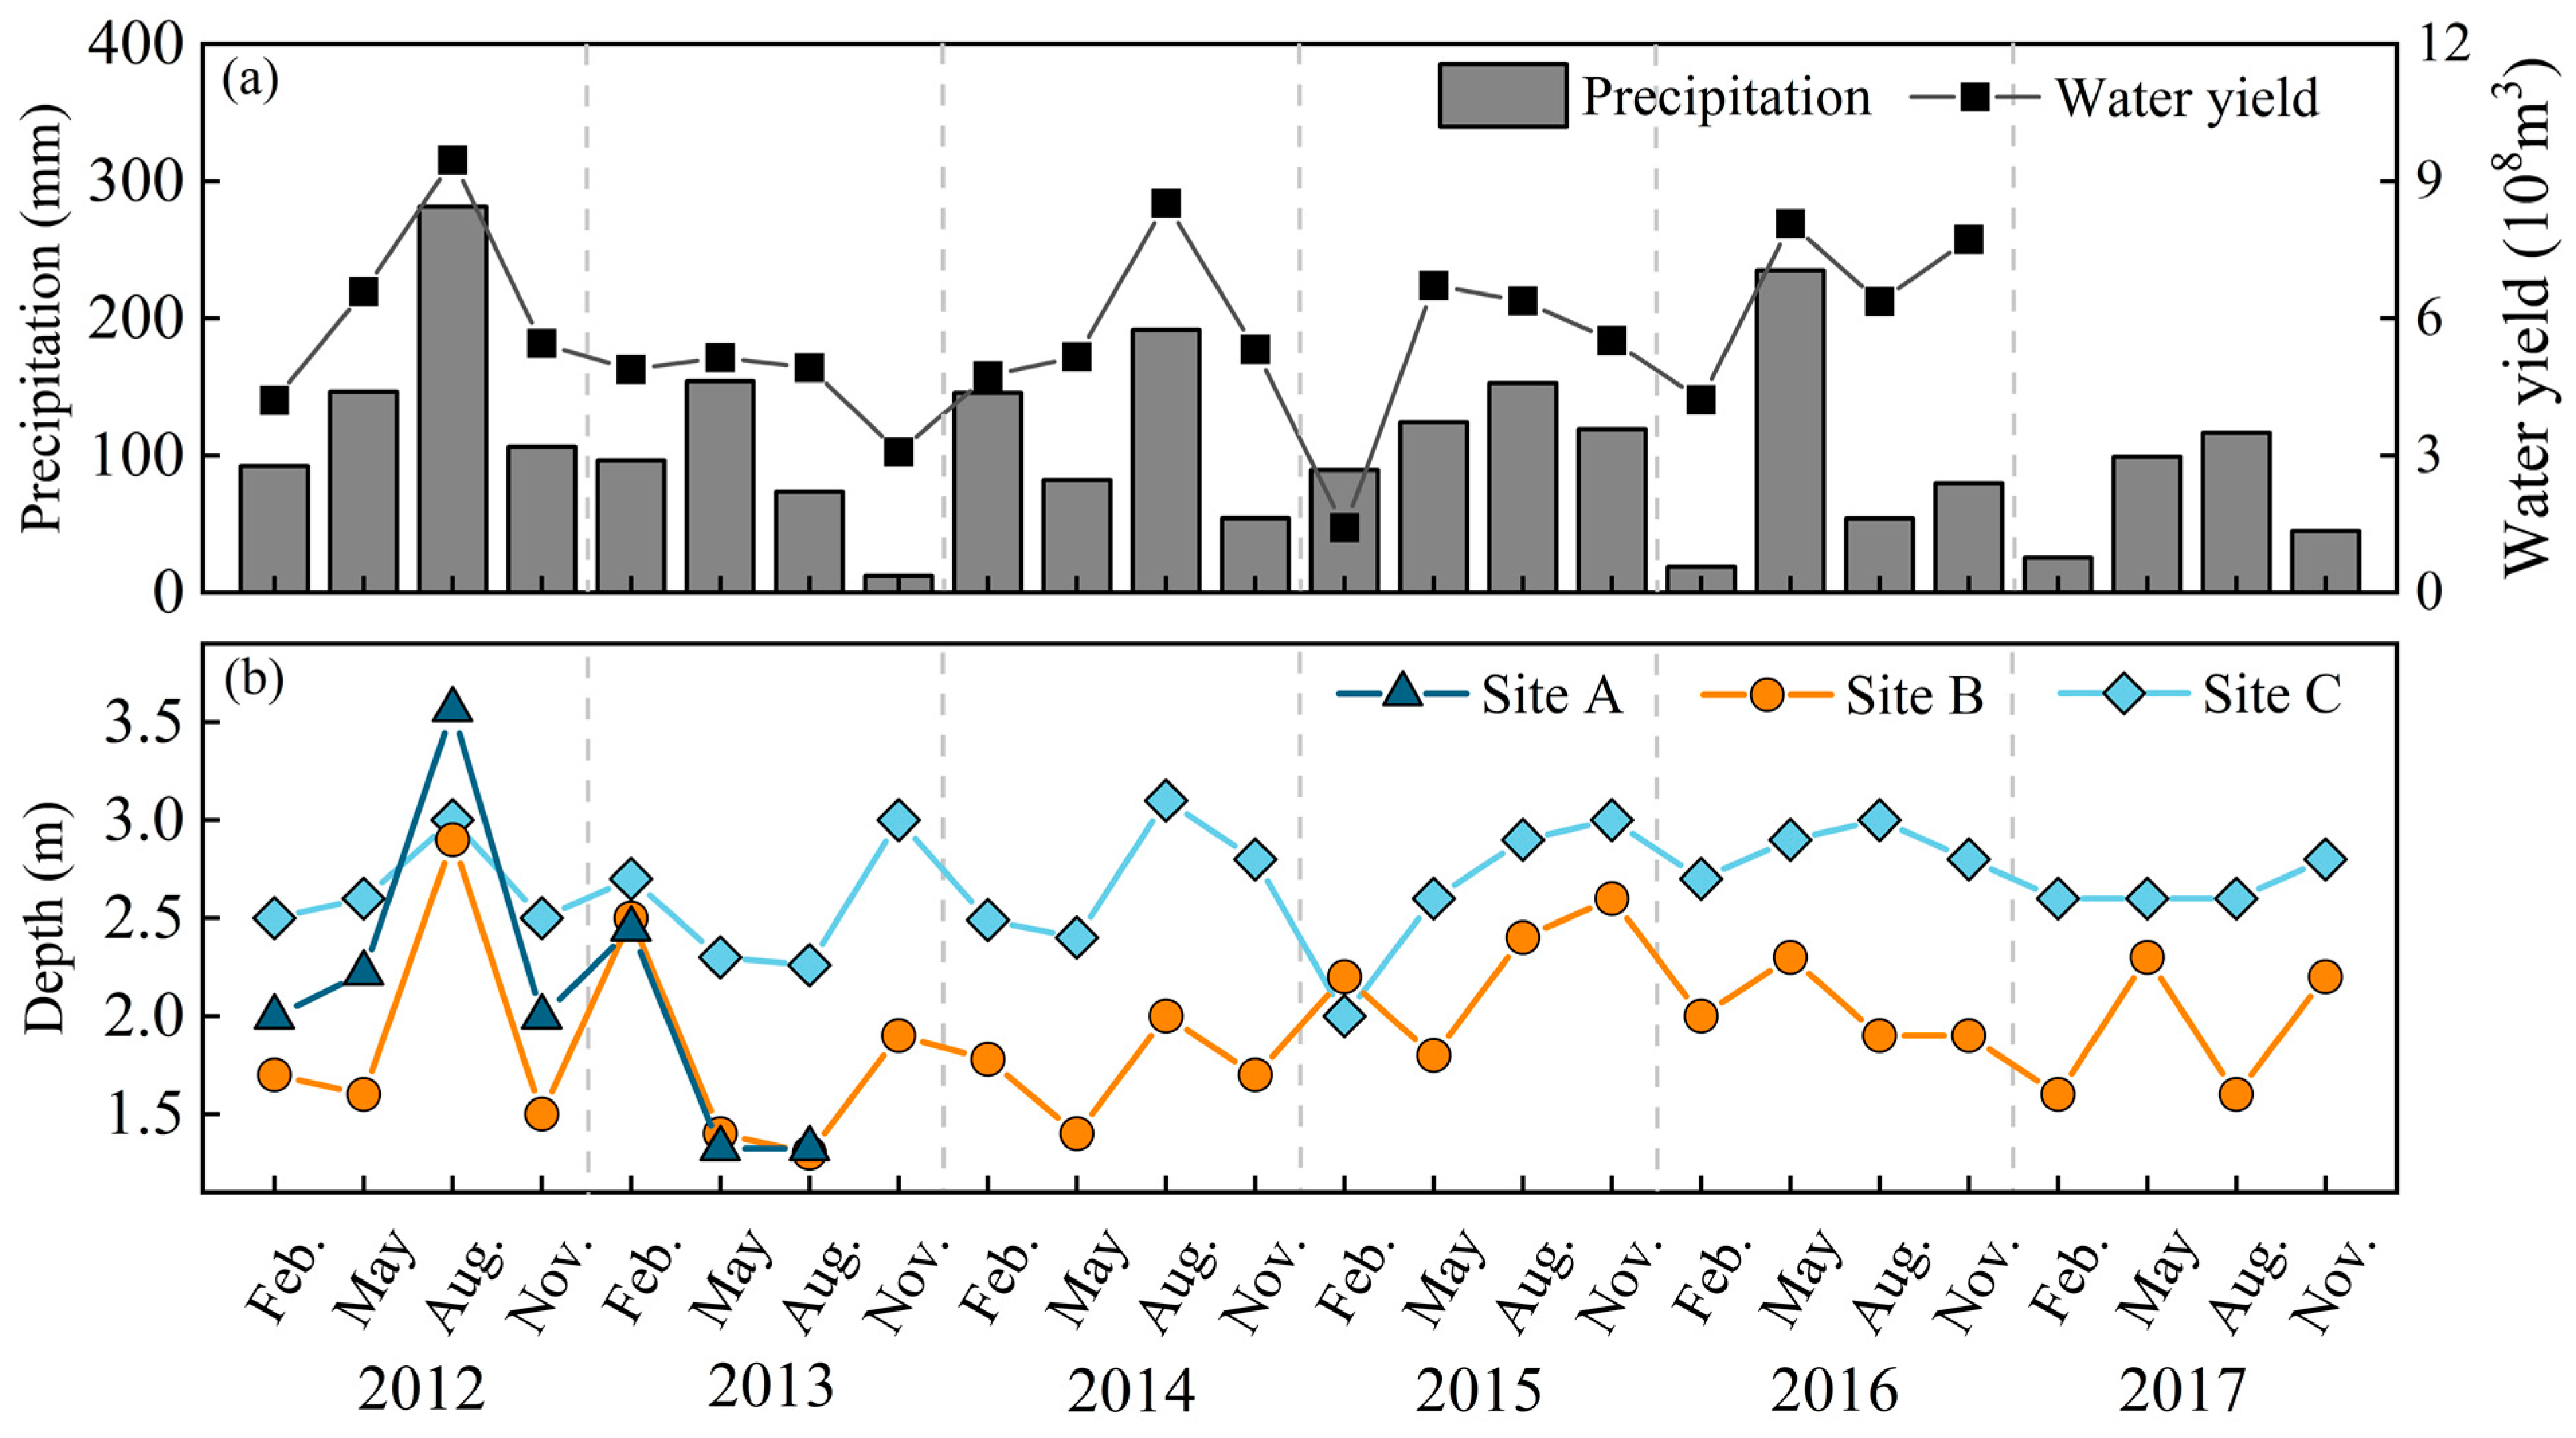
Figure 3.
Seasonal variation in key environment variables ((a) Temperture, (b) Chl a, (c) -N, (d) TN) at the three sampling sites (Site A, Site B, and Site C) during the sampling period.
Figure 3.
Seasonal variation in key environment variables ((a) Temperture, (b) Chl a, (c) -N, (d) TN) at the three sampling sites (Site A, Site B, and Site C) during the sampling period.
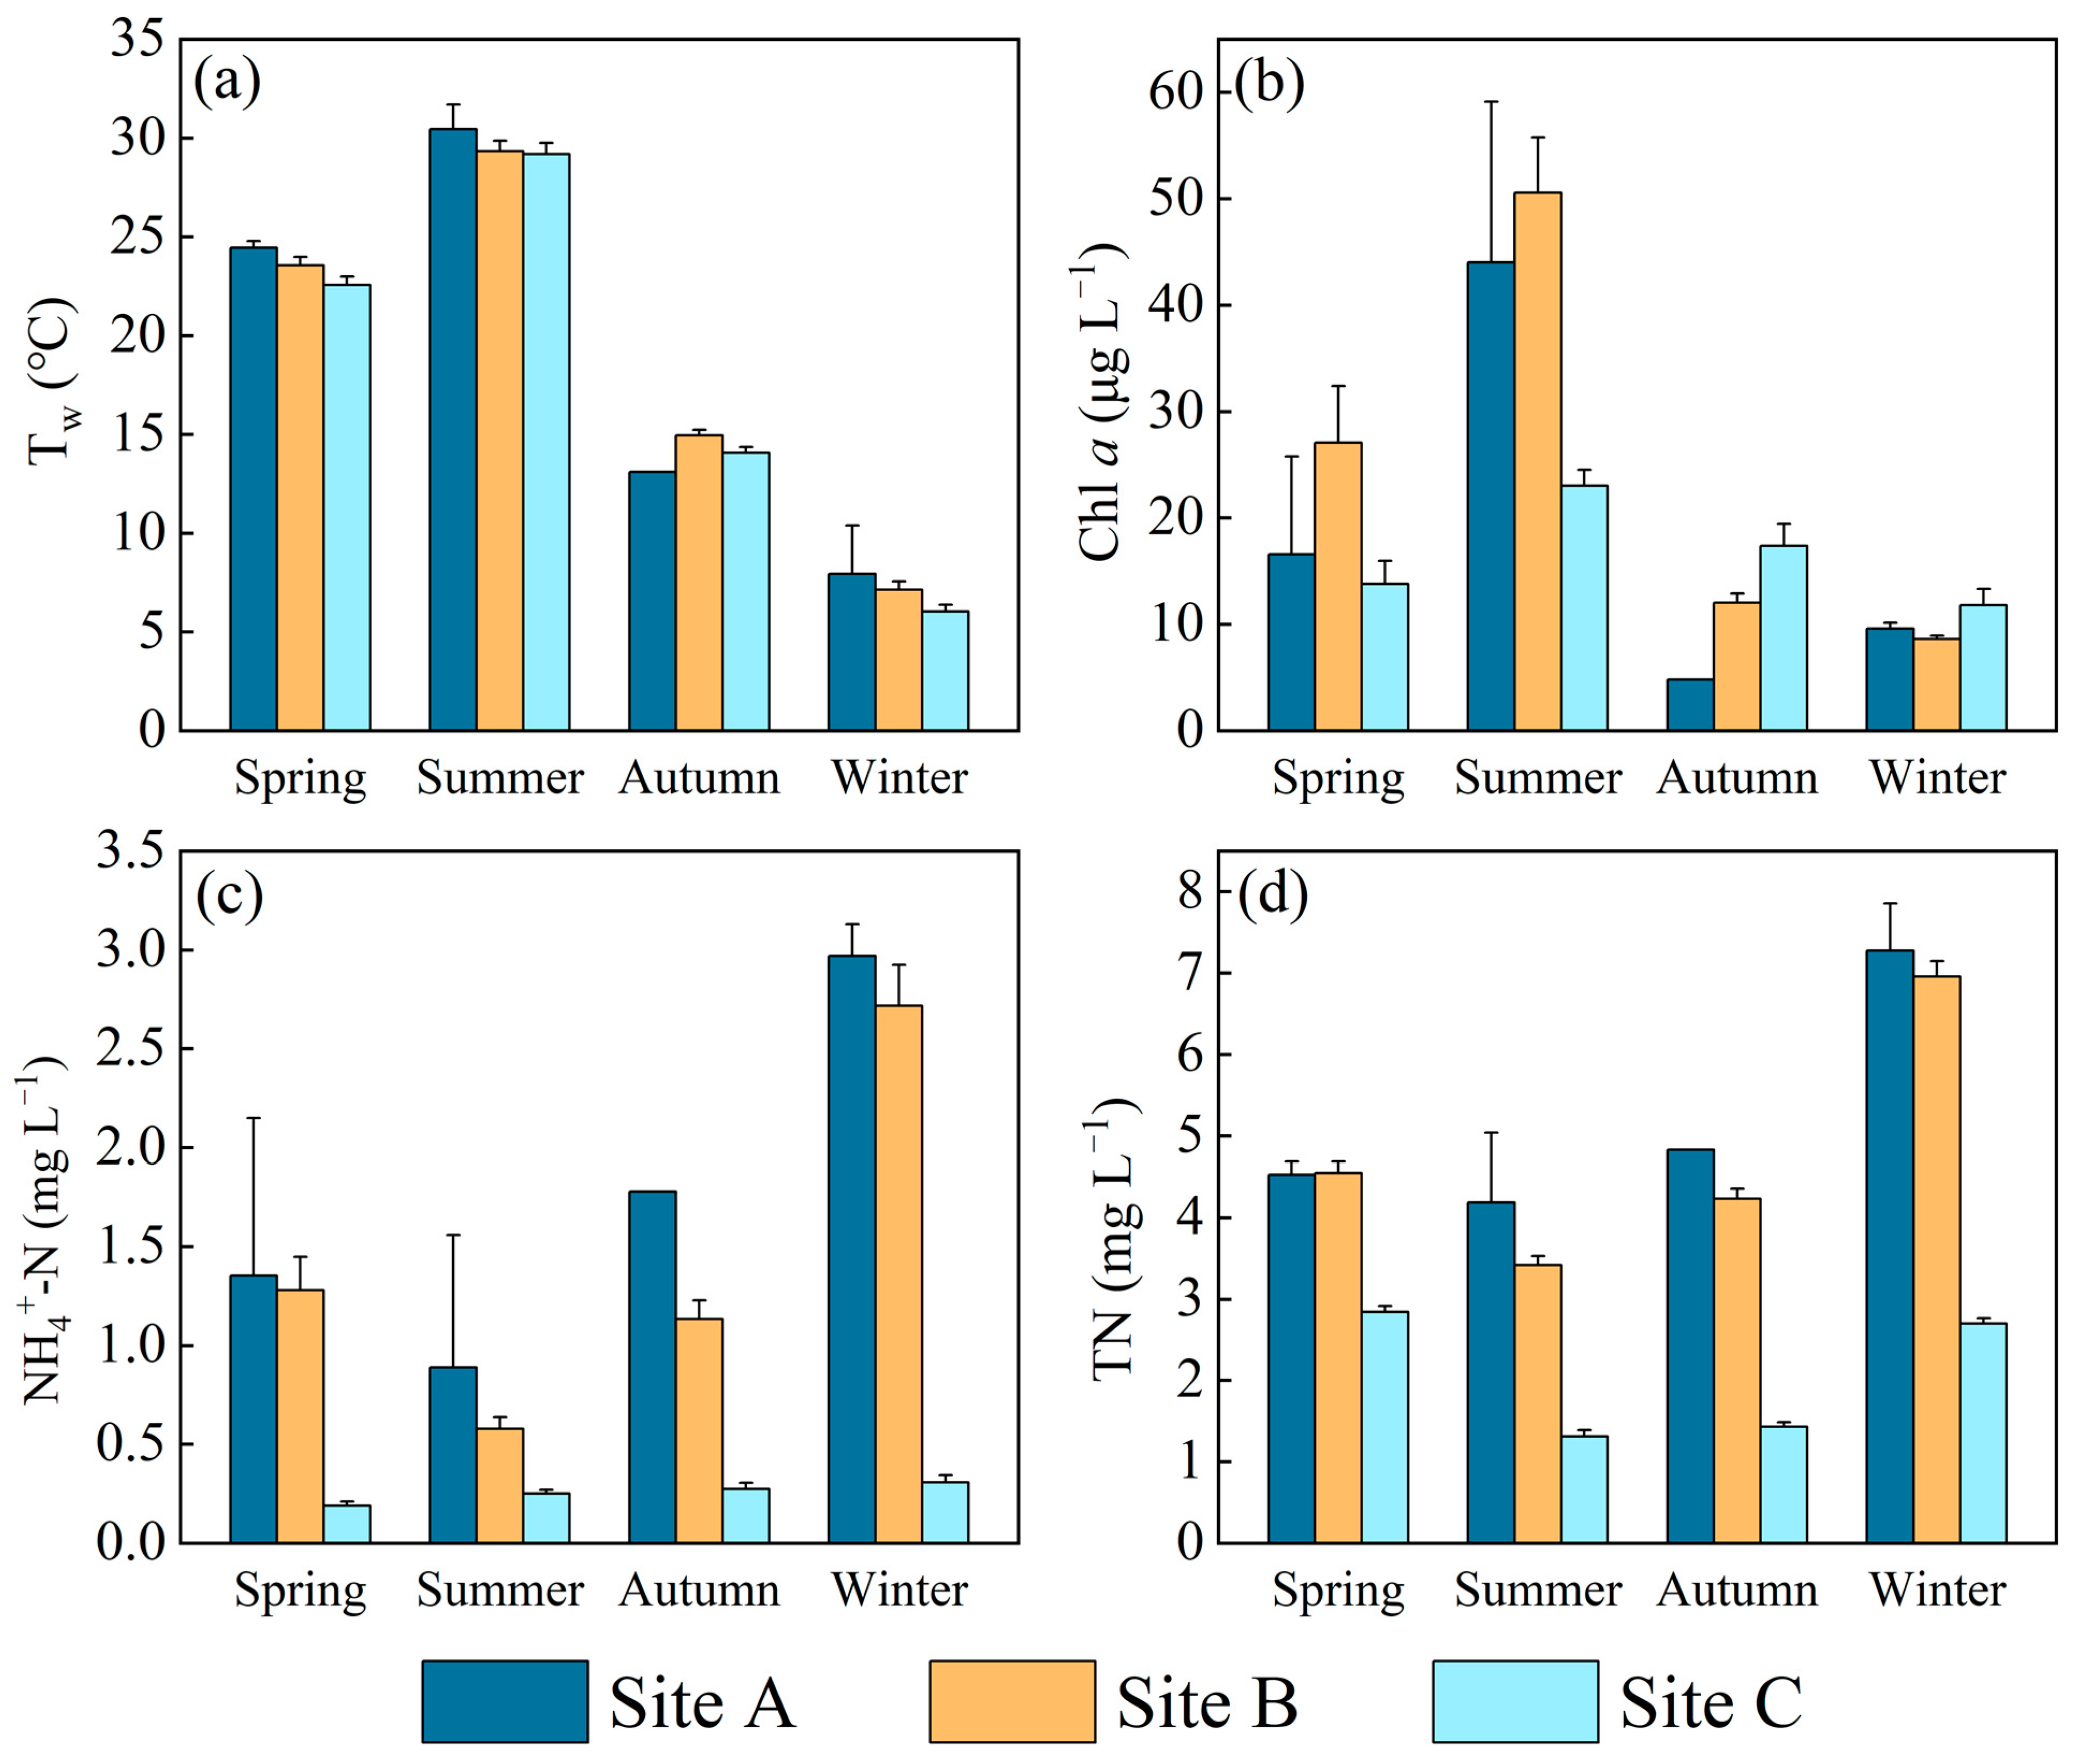
Figure 4.
Spatial variations of CH4 diffusion flux in different sites and different regions of Lake Taihu.
Figure 4.
Spatial variations of CH4 diffusion flux in different sites and different regions of Lake Taihu.
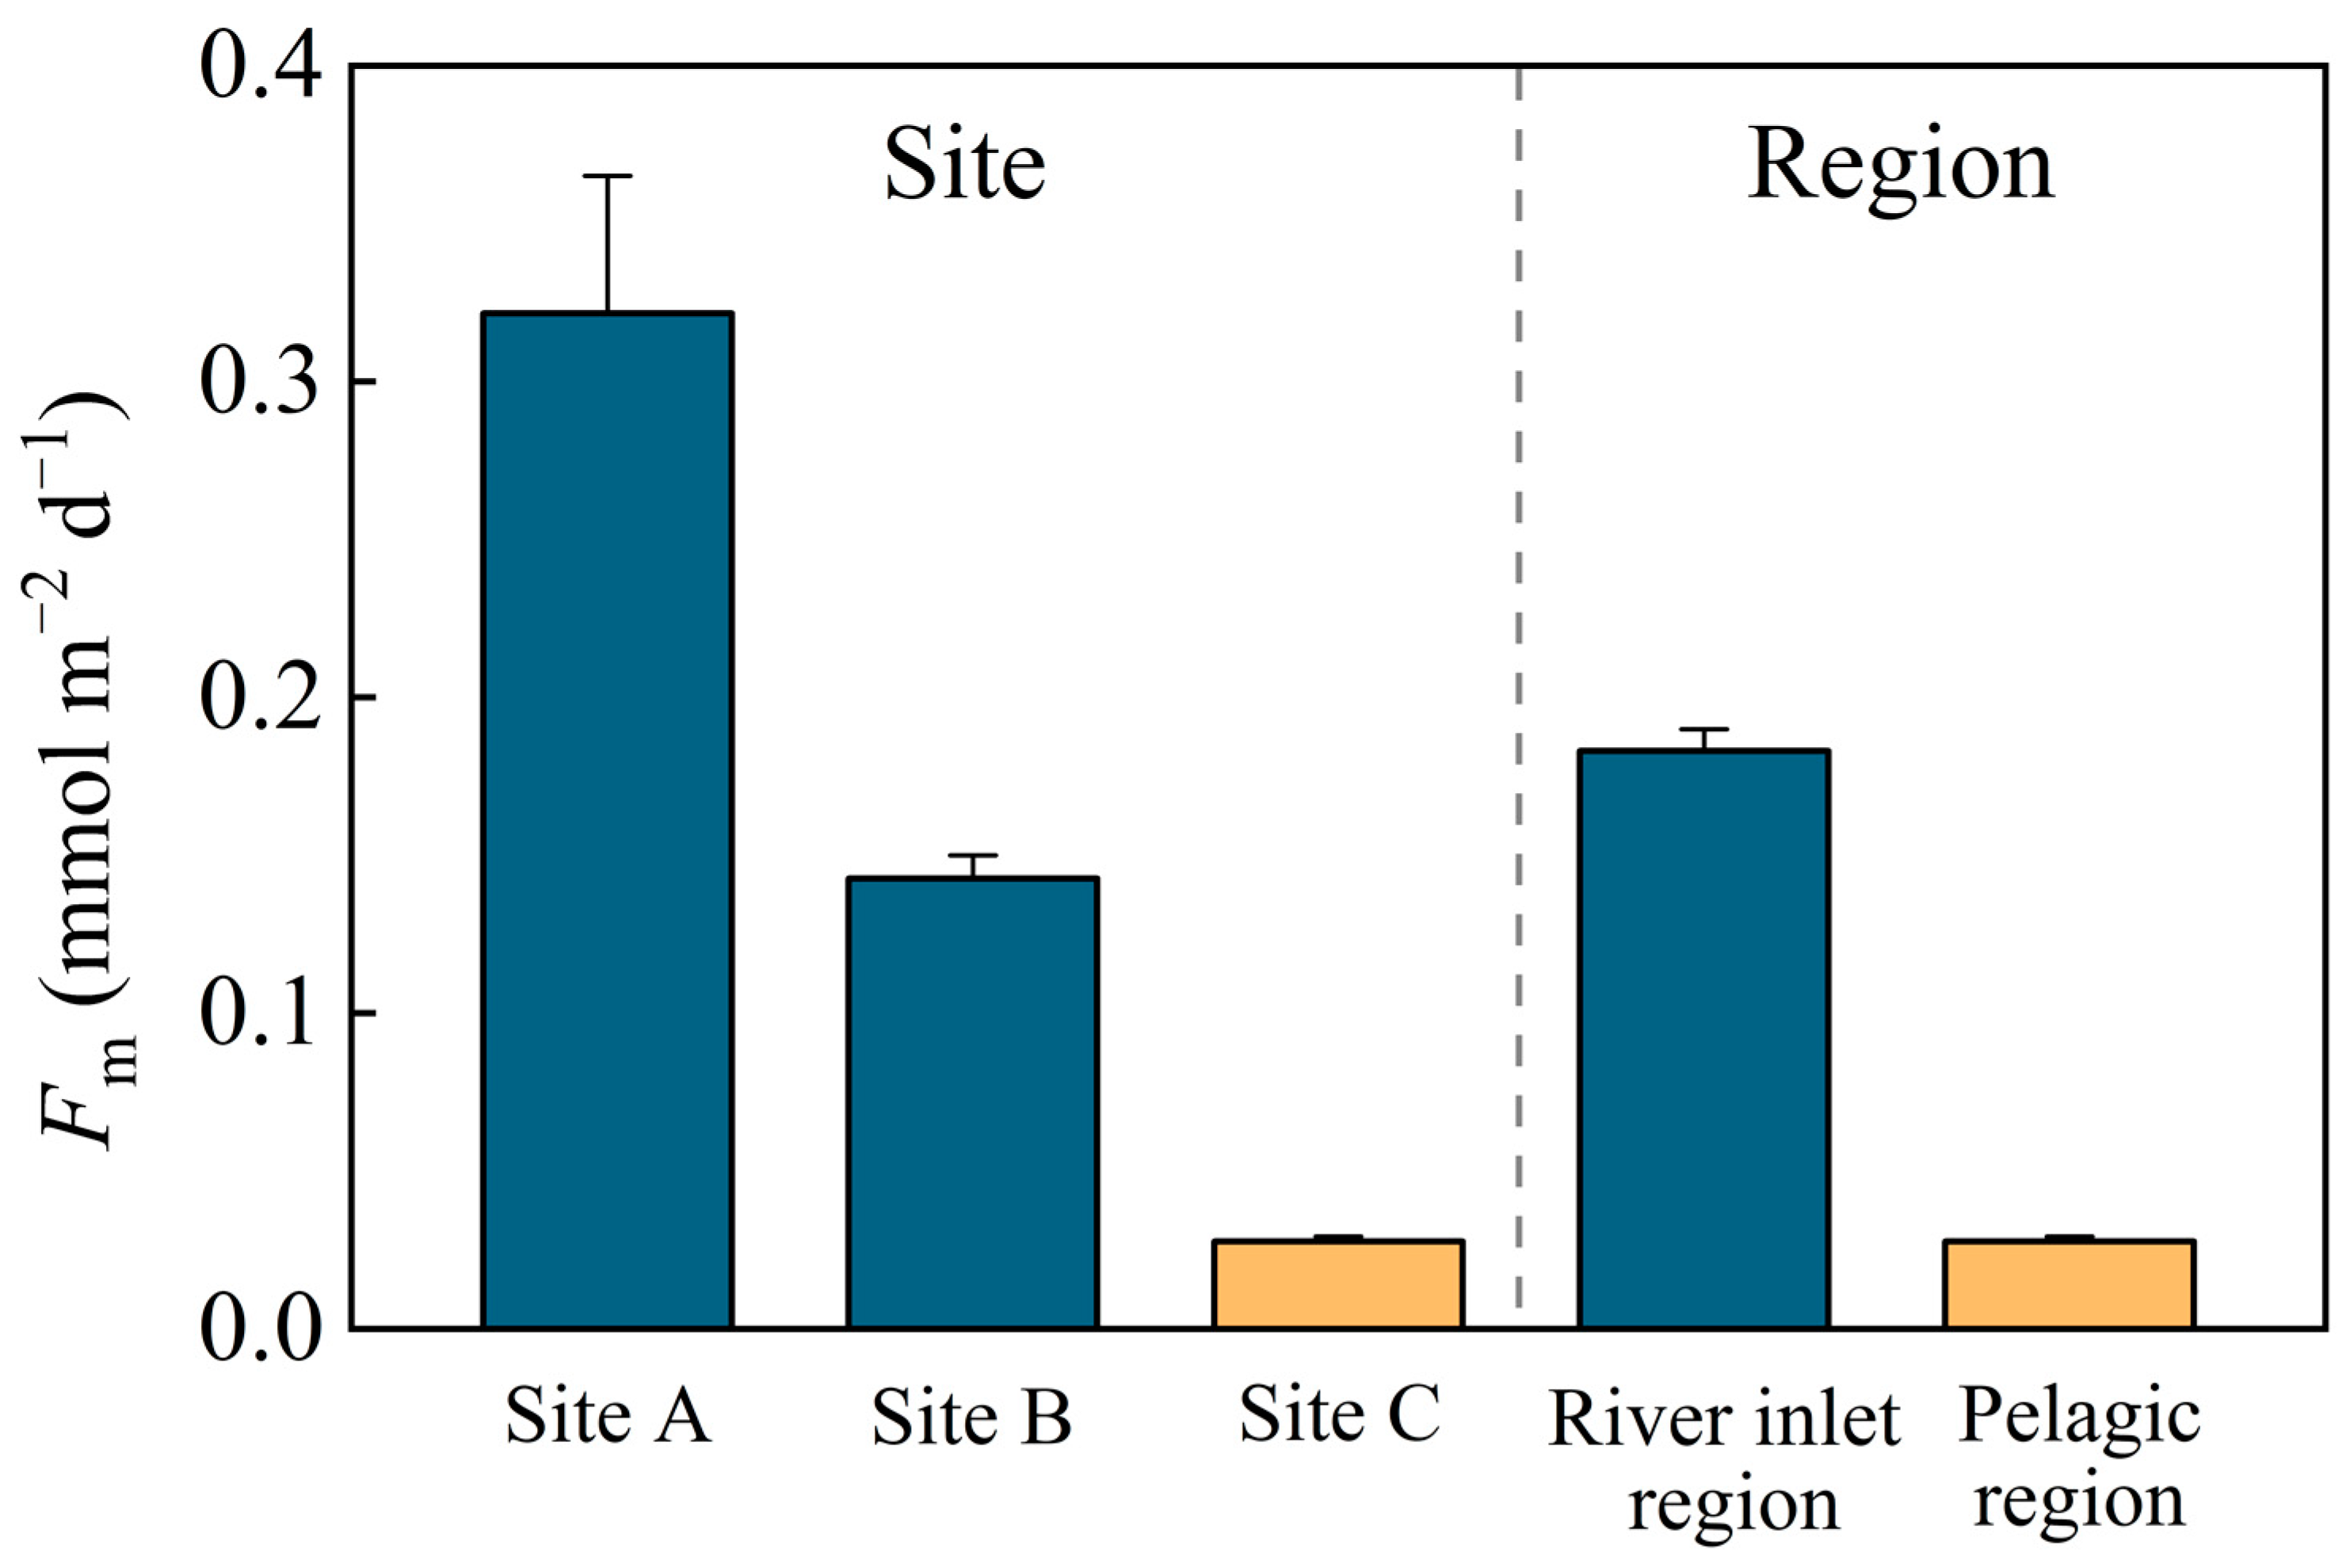
Figure 5.
Temporal variation in diffusive CH4 emission flux (Fm) at the three sampling sites of Lake Taihu based on long-term (2012–2017) field measurement. The insert graph represents the seasonal mean CH4 flux.
Figure 5.
Temporal variation in diffusive CH4 emission flux (Fm) at the three sampling sites of Lake Taihu based on long-term (2012–2017) field measurement. The insert graph represents the seasonal mean CH4 flux.
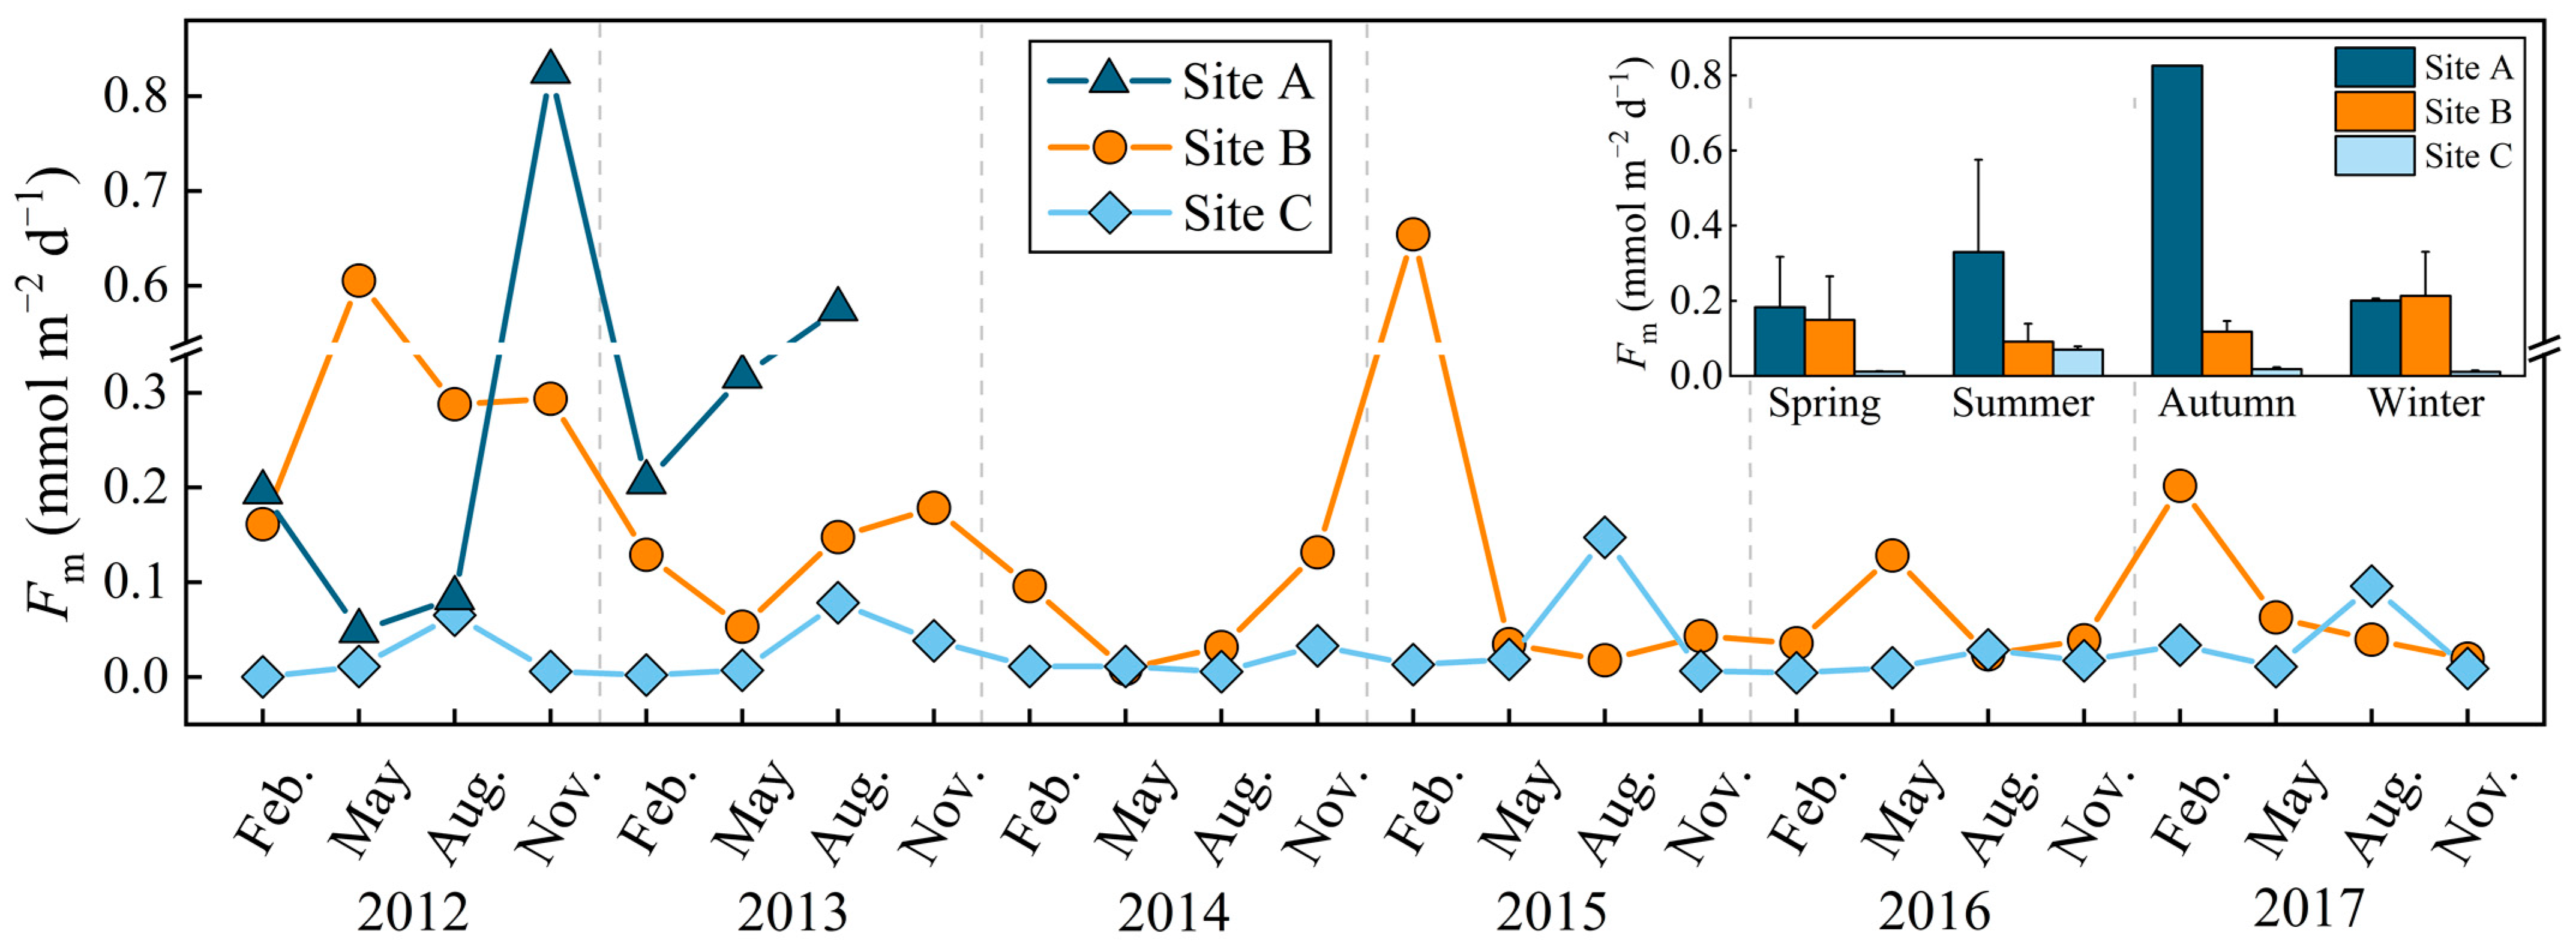
Figure 6.
Trend of -N concentration and dissolved CH4 at Site B (a) and Site C (b) from 2012 to 2017.
Figure 6.
Trend of -N concentration and dissolved CH4 at Site B (a) and Site C (b) from 2012 to 2017.
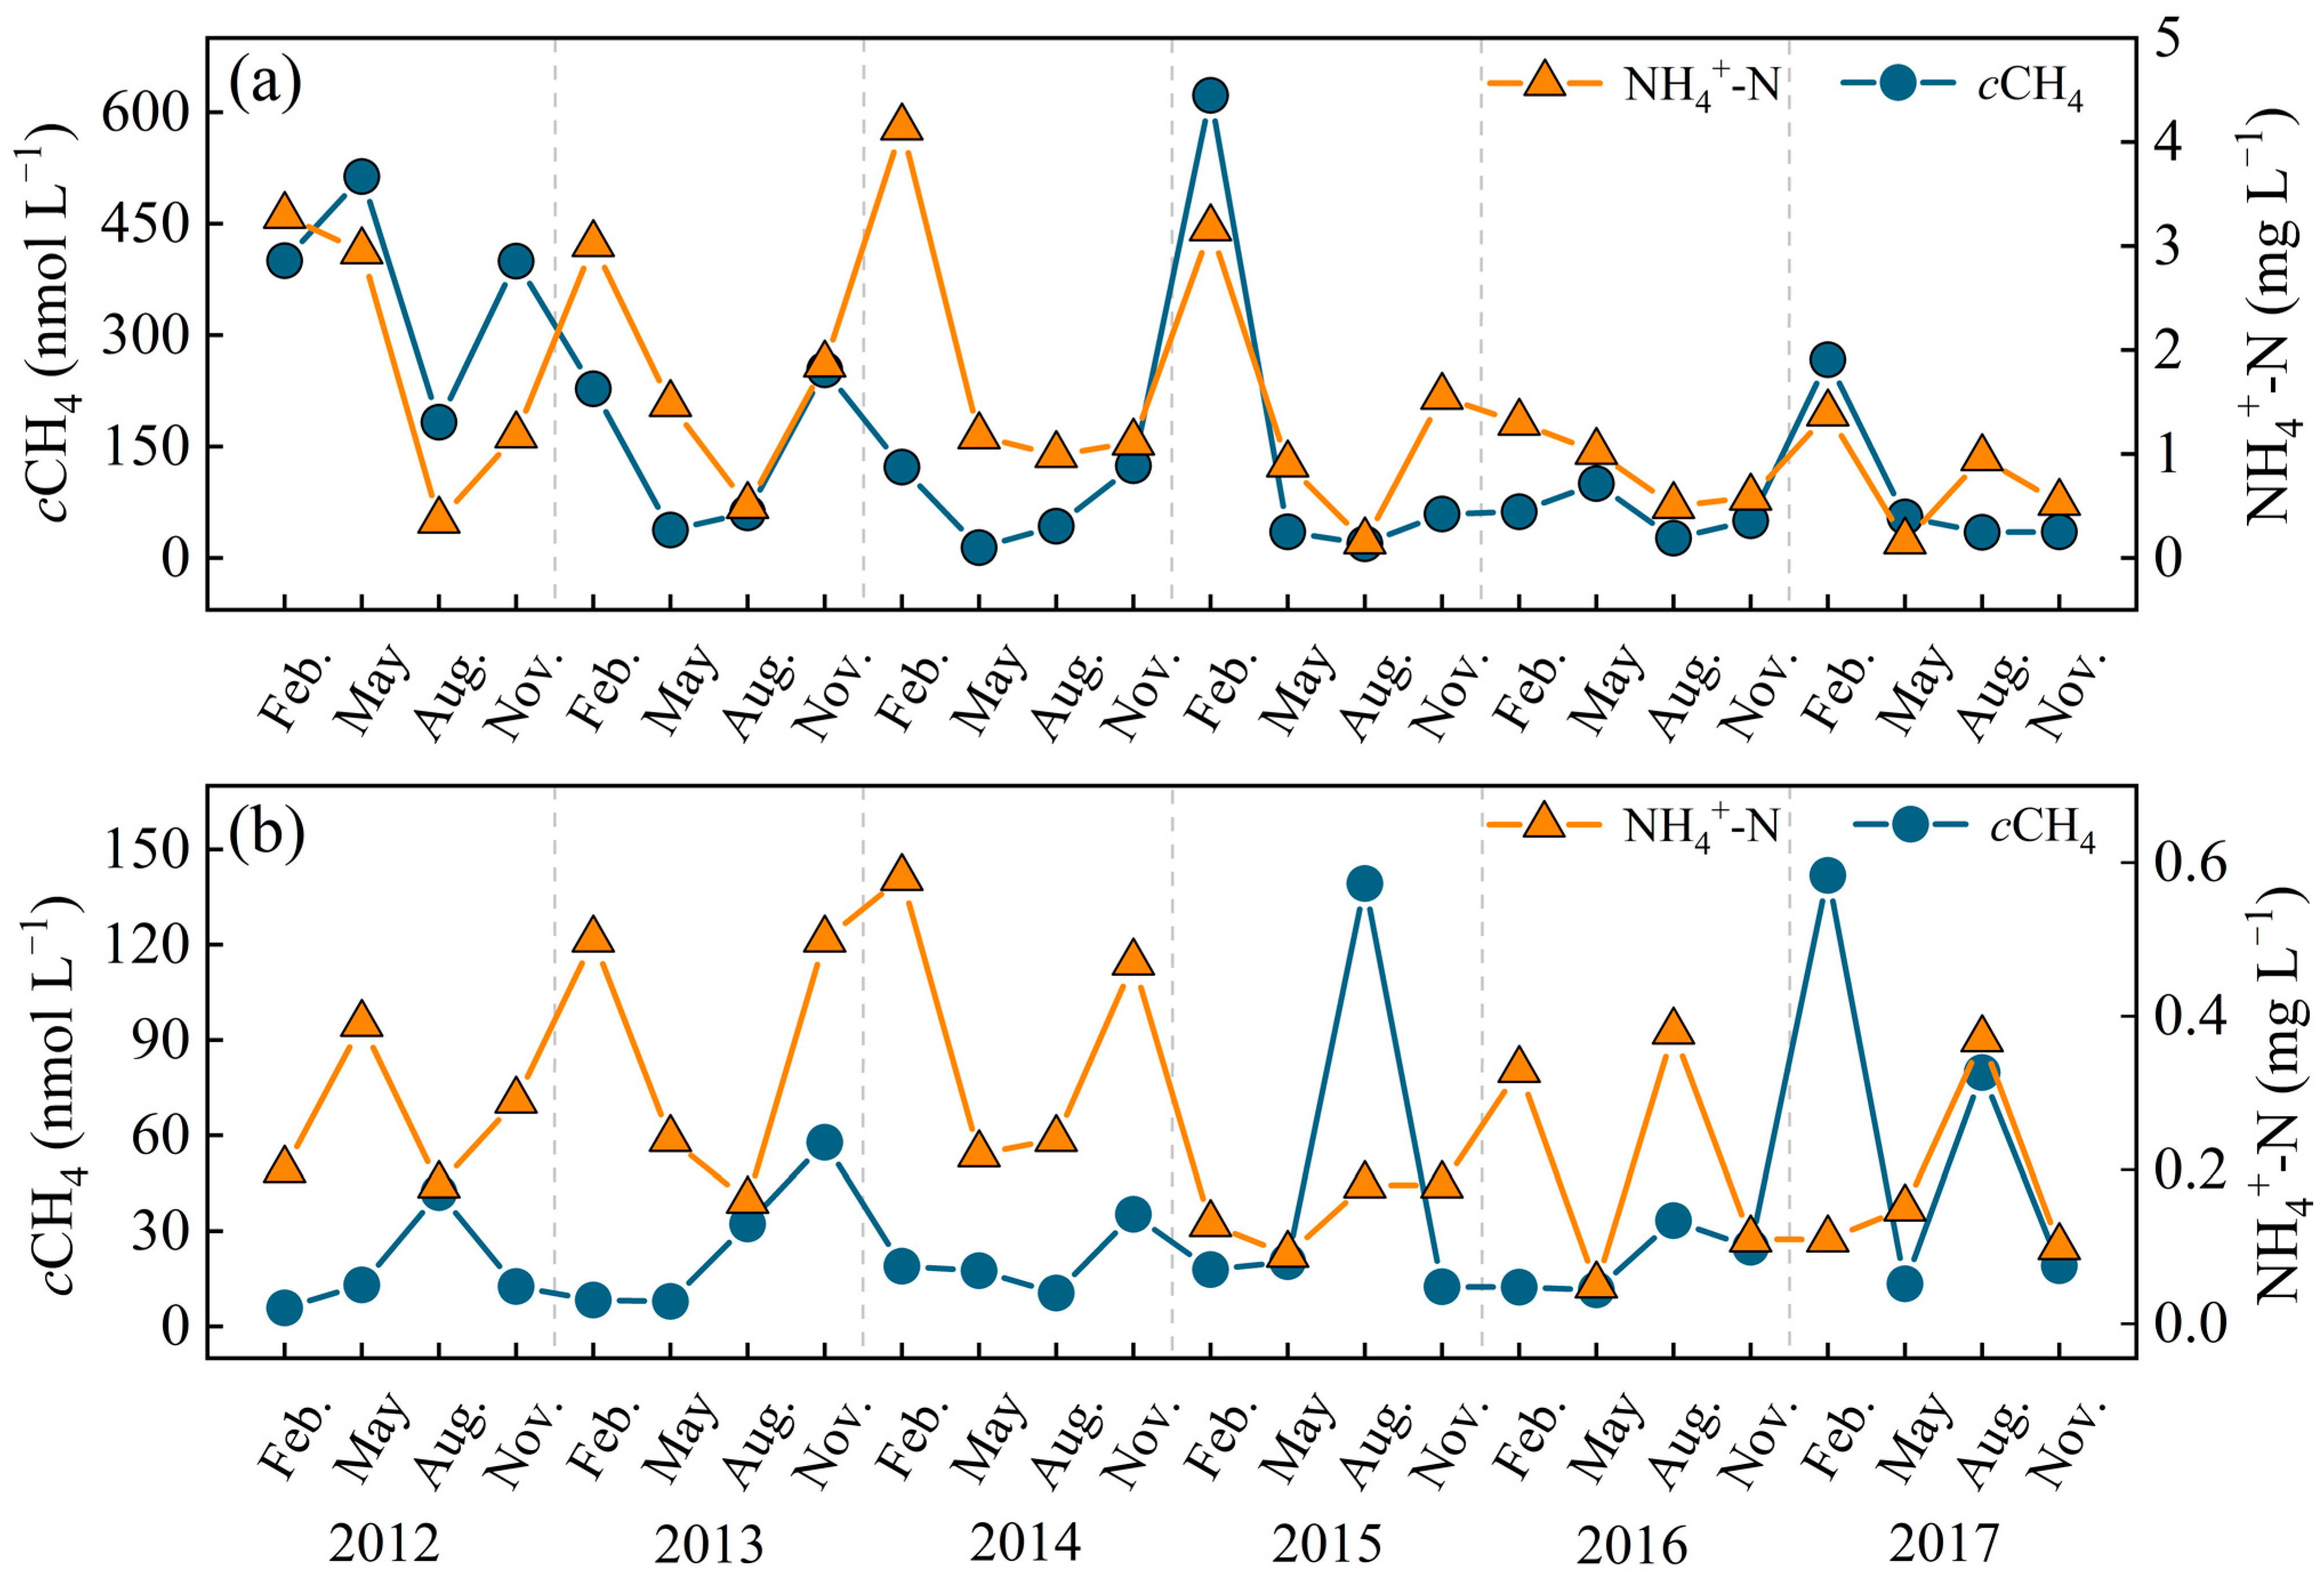
Figure 7.
Correlations of the normalized seasonal CH4 flux against -N (a), -N (b), water temperature (Tw), (c), and Chl a (d) at the river inlet region (Site A and Site B) and pelagic region (Site C) of the lake from 2012 to 2017. (Triangle represents Site A, circle represents Site B and rhombus represents Site C. Blue represents the river inlet region and orange represents pelagic region).
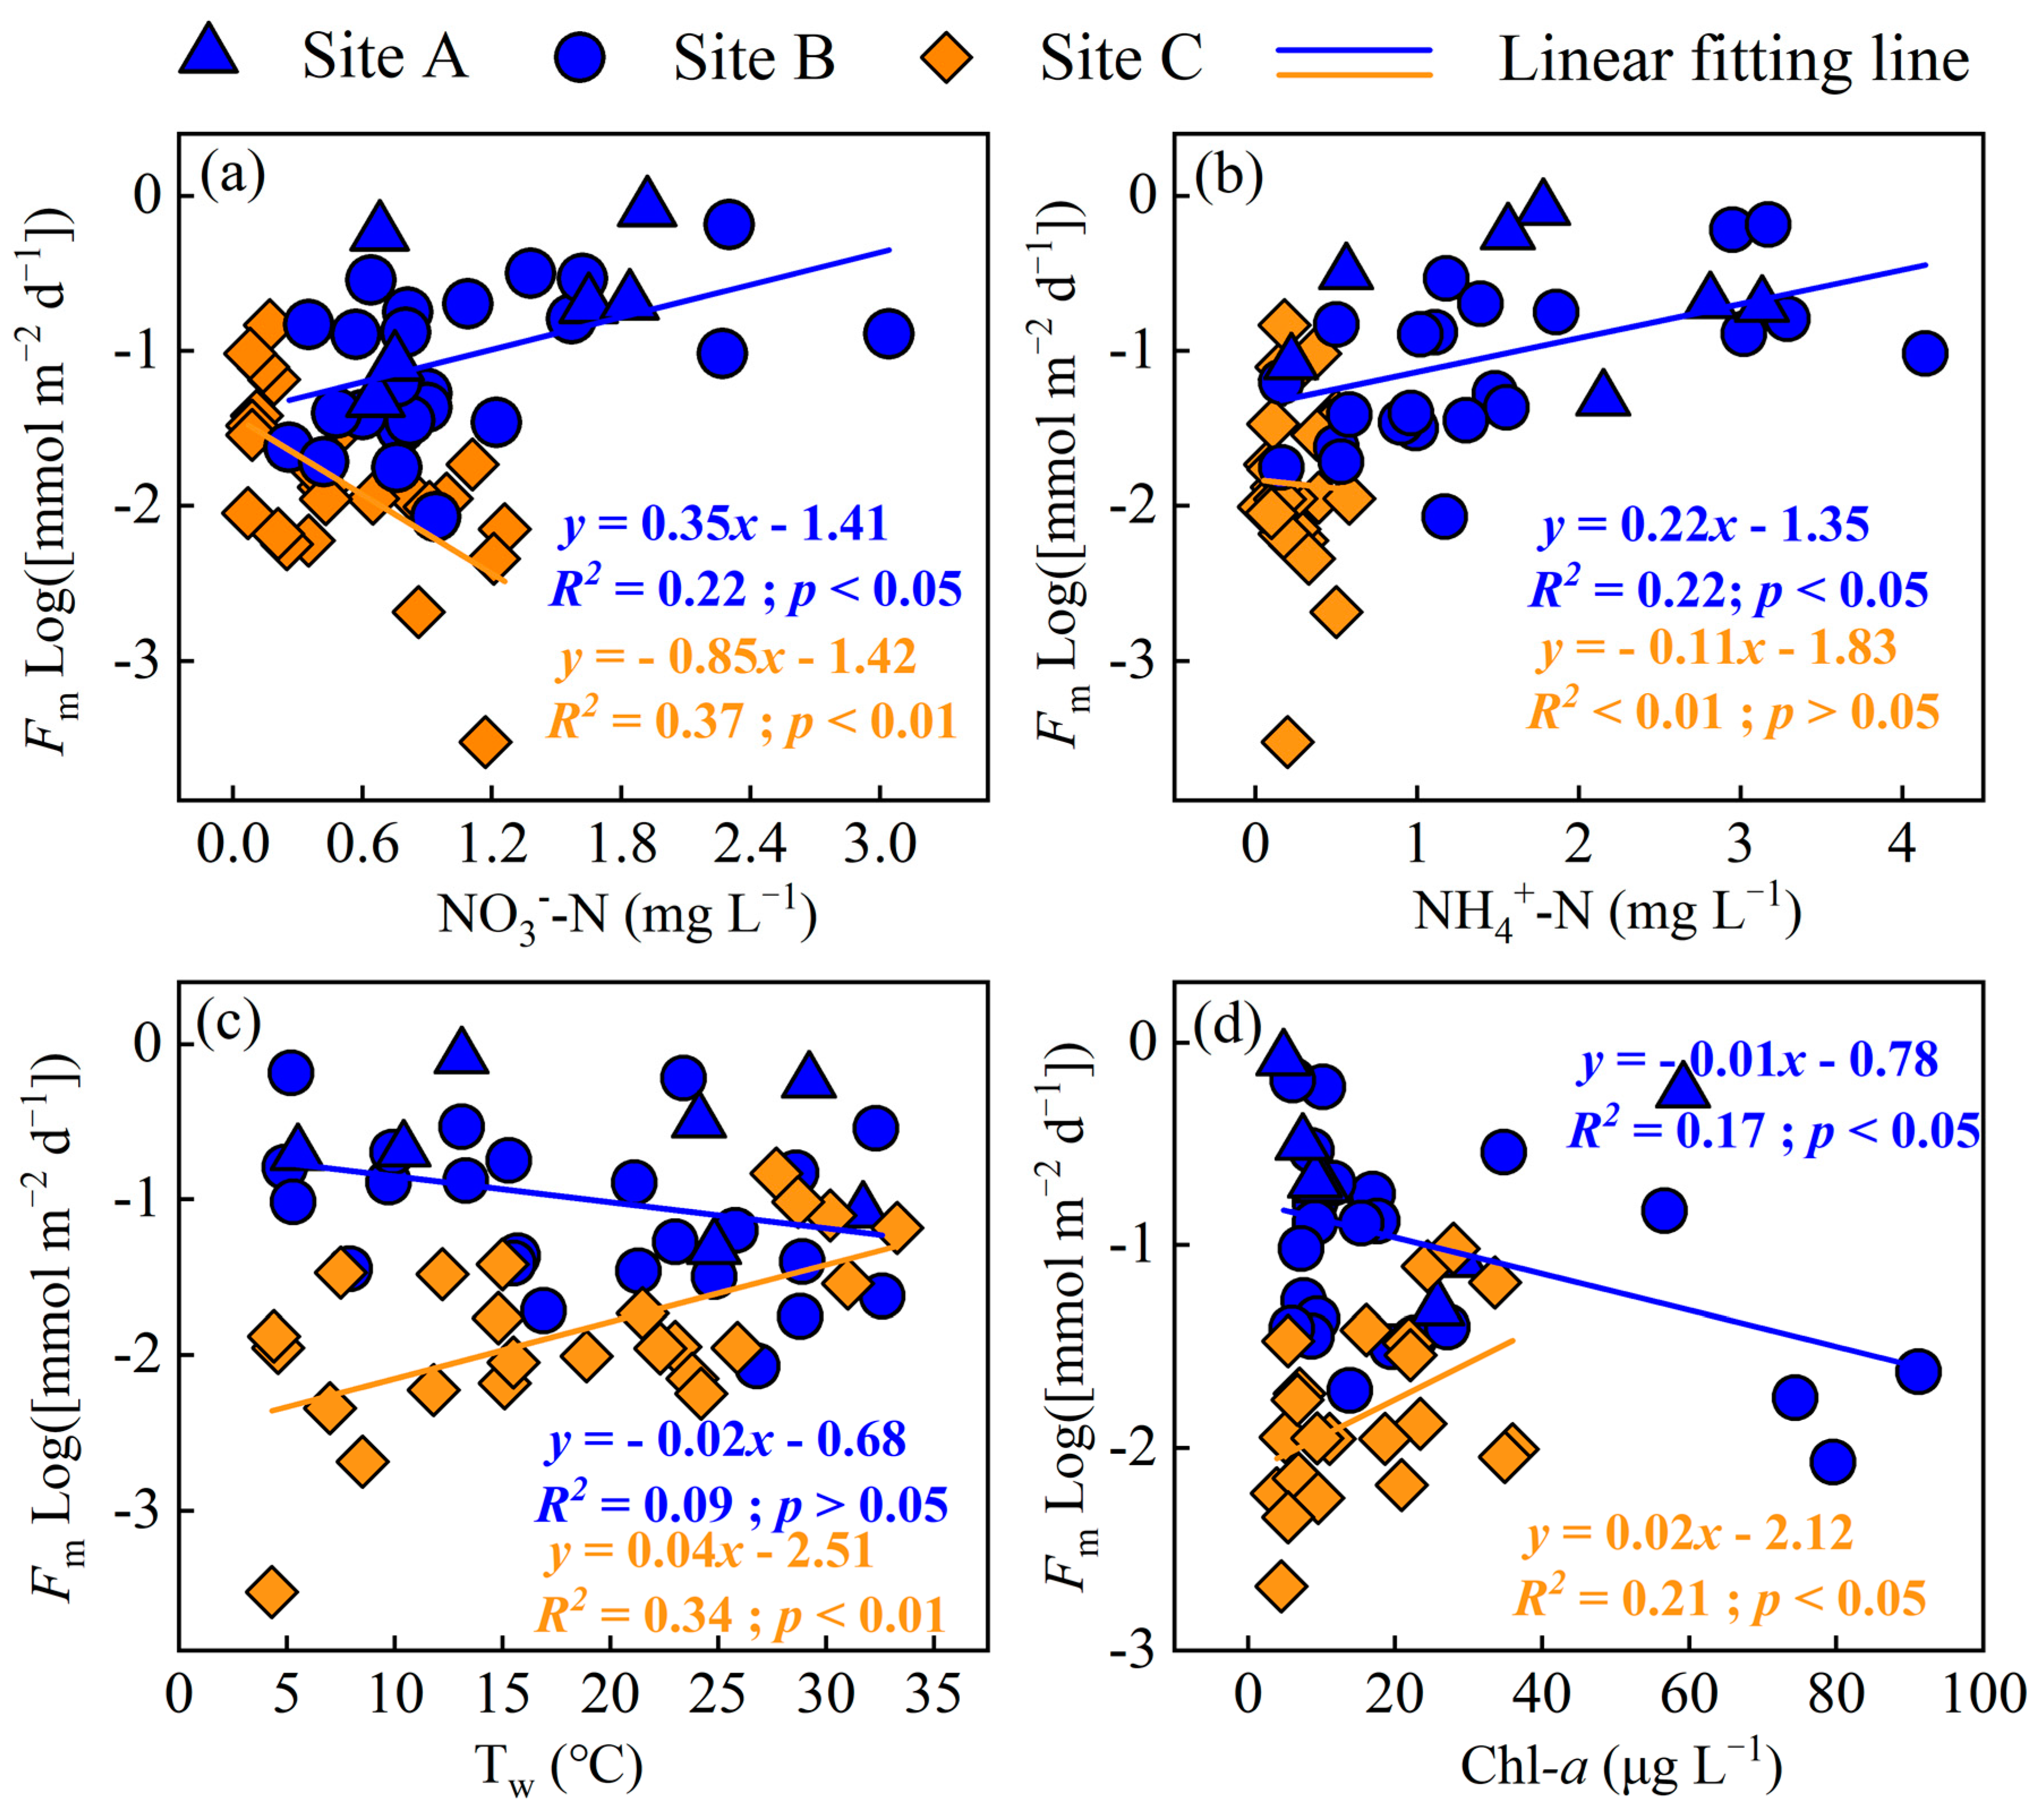
Figure 8.
Temporal variation in dissolved CH4 at the two sites (Site B and Site D) of Lake Taihu based on long-term (2013–2016) field measurement. The insert graph represents the seasonal mean dissolved CH4.
Figure 8.
Temporal variation in dissolved CH4 at the two sites (Site B and Site D) of Lake Taihu based on long-term (2013–2016) field measurement. The insert graph represents the seasonal mean dissolved CH4.

Figure 9.
Correlations of seasonal CH4 flux of Site A and Site B against inflowing water yield (a,b), correlation between the seasonal flux at Site B and the concentration of dissolved CH4 in Dapu River (c), and correlation of dissolved CH4 concentration of inflowing river (Dapu River) against water yield (d).

Table 1.
Basic environmental variables of different observation sites during the observation period (Site A (2012–2013), Site B, and Site C (2012–2017)). Data were shown as mean ± one standard deviation.
Table 1.
Basic environmental variables of different observation sites during the observation period (Site A (2012–2013), Site B, and Site C (2012–2017)). Data were shown as mean ± one standard deviation.
| Site | Tw (℃) | Water Clarity (m) | pH | Deph (m) | DO (mg L−1) | (mg L−1) | (mg L−1) | TN (mg L−1) | TP (mg L−1) | DOC (mg L−1) | Chl a (μg L−1) |
|---|---|---|---|---|---|---|---|---|---|---|---|
| Site A | 19.83 ± 9.34 | 0.35 ± 0.10 | 8.04 ± 0.16 | 1.96 ± 0.32 | 6.09 ± 1.22 | 1.27 ± 0.52 | 1.74 ± 1.00 | 5.26 ± 1.41 | 0.26 ± 0.06 | 5.50 ± 0.66 | 20.76 ± 17.91 |
| Site B | 18.75 ± 8.69 | 0.26 ± 0.09 | 7.98 ± 0.23 | 1.94 ± 0.41 | 6.16 ± 1.67 | 1.03 ± 0.66 | 1.43 ± 1.07 | 4.79 ± 1.50 | 0.30±0.16 | 4.96 ± 0.97 | 24.48 ± 24.92 |
| Site C | 17.97 ± 8.97 | 0.31 ± 0.12 | 8.24 ± 0.27 | 2.67 ± 0.27 | 8.98 ± 1.74 | 0.52 ± 0.41 | 0.26 ± 0.15 | 2.07 ± 0.78 | 0.09 ± 0.03 | 3.70 ± 0.86 | 16.52 ± 10.12 |
Disclaimer/Publisher’s Note: The statements, opinions and data contained in all publications are solely those of the individual author(s) and contributor(s) and not of MDPI and/or the editor(s). MDPI and/or the editor(s) disclaim responsibility for any injury to people or property resulting from any ideas, methods, instructions or products referred to in the content. |
© 2022 by the authors. Licensee MDPI, Basel, Switzerland. This article is an open access article distributed under the terms and conditions of the Creative Commons Attribution (CC BY) license (https://creativecommons.org/licenses/by/4.0/).
Share and Cite
MDPI and ACS Style
Liao, Y.; Lan, H.; Zhang, X.; Liu, Z.; Zhang, M.; Hu, Z.; Duan, H.; Xiao, Q. Large Methane Emission from the River Inlet Region of Eutrophic Lake: A Case Study of Lake Taihu. Atmosphere 2023, 14, 16. https://doi.org/10.3390/atmos14010016
AMA Style
Liao Y, Lan H, Zhang X, Liu Z, Zhang M, Hu Z, Duan H, Xiao Q. Large Methane Emission from the River Inlet Region of Eutrophic Lake: A Case Study of Lake Taihu. Atmosphere. 2023; 14(1):16. https://doi.org/10.3390/atmos14010016
Chicago/Turabian StyleLiao, Yuanshan, Haijin Lan, Xinyue Zhang, Zhenjing Liu, Mi Zhang, Zhenghua Hu, Hongtao Duan, and Qitao Xiao. 2023. "Large Methane Emission from the River Inlet Region of Eutrophic Lake: A Case Study of Lake Taihu" Atmosphere 14, no. 1: 16. https://doi.org/10.3390/atmos14010016
Note that from the first issue of 2016, this journal uses article numbers instead of page numbers. See further details here.