1. Introduction
In recent years, the detection of Terrestrial Gamma-ray Flashes (TGFs) and other thunderstorm-related high-energy emissions by ground facilities has been frequently reported. Many installation sites, equipped with gamma-ray instrumentation, allow for the detection of TGFs, gamma-ray glows, reverse positron-beam TGFs, and neutrons at low altitudes, which are produced during lightning events [
1,
2,
3,
4,
5,
6,
7,
8,
9,
10,
11,
12,
13,
14,
15,
16]. To date, the largest fraction of detected TGFs have been revealed from space through low Earth orbit satellites (∼500 km altitude) devoted to high-energy astrophysics, endowed with detectors for high-energy radiation. However, the high absorption and attenuation experienced by this radiation traveling in the atmosphere affects the overall temporal profile and energetics of the events detected from space. In recent times, in situ measurements, carried out either via ground-based facilities or airborne instruments flying near thunderstorms, are becoming much more important and interesting in better characterizing the features of TGFs and glows and their occurrence.
TGFs and gamma-ray glows provide a unique opportunity to study high-energy phenomena on Earth. In particular, ground-based observations of TGFs can integrate data obtained from space-based instruments, leading to a more comprehensive understanding of TGFs and the associated phenomena. However, with respect to space, the detection of TGFs from the ground can be challenging for several reasons: (1) Detecting TGFs from the ground would imply a propagation of the gamma-ray radiation in the lowest-altitude, highest-density layers of the Earth’s atmosphere, which heavily absorb and attenuate high-energy radiation. Placing the instrumentation at higher altitudes, such as on mountains at 2000–4000 m, could reduce this issue. (2) Regarding TGF beamed emissions, which benefit from a broader perspective, ground-based detectors have a limited field of view with respect to space-based instruments. (3) At shorter distances from the TGF source, the duration of events could be even shorter, requiring instruments with extremely fast electronics. (4) Ground-based detectors are affected by a constant environmental radiation background that can hamper the clear identification of transient events above the background noise. (5) Installation sites at high altitudes could be affected by prohibitive environmental conditions, and the instrumentation could be difficult to manage and maintain.
Recently, TGFs have also been detected from space during the massive eruptions of the Hunga Tonga–Hunga Ha’apai submarine volcano that occurred in 2022 [
17]. These violent eruptions developed an extremely tall volcanic ash plume extending up to stratospheric heights, which led to the production of a large number of electrostatic lightning discharges with intense currents. The Fermi satellite was capable of detecting a TGF event produced by one of these discharges directed upward.
It is well known that volcanic eruptions can produce lightning, which arises within the volcanic plumes from the collision and fragmentation of particles, such as volcanic ashes and ice, leading to the production of so-called “dirty thunderstorms”. Several mechanisms could be involved in the production of volcanic lightning, such as triboelectric frictional charging, fractoelectrification, and ice charging [
18]. However, the persistence of one or more ash columns above a volcano’s main craters, even long after the most explosive phases of the eruptions, may constitute favored conductive paths for discharging during thunderstorm episodes taking place within that region: as reported in [
19,
20], although volcanic ash is basically an insulator, the presence of soluble salts (e.g., chlorides, fluorides, and sulfates) that attach to ash grains, under an atmospheric condition full of moisture, such as that of a thunderstorm, might make these salts melt, resulting in ionic conductive paths. From this perspective, a volcano represents an interesting location for the investigation of thunderstorms and high-energy radiation from lightning, as it offers both a high-altitude context, ensuring limited gamma-ray absorption in the atmosphere and acting as a natural trigger for lightning discharge.
2. The ESTHER Project
The Experiment to Study Thunderstorm High-Energy Radiation (ESTHER) project is a low-budget project funded by the Italian National Institute for Astrophysics (INAF), devoted to the study of gamma-ray emissions produced during thunderstorms. It consists of the design and installation of a portable instrument consisting of a gamma-ray detector and a VLF/LF radio receiver. The gamma-ray detector is a NaI (Tl) 3ø × 3h scintillator coupled to a PMT, sensitive in the hundreds keV–few MeV energy range, that acquires high-energy photons with a ∼s time resolution. The radio receiver is sensitive in the 20–250 kHz (centered at ∼50 kHz) range, consisting of an antenna with 2 H-field channels (N–S and E–W) and 1 E-field channel (omnidirectional). The acquired waveforms are digitized to 12 bits at 3.125 MSPS, with GPS absolute time accuracy. The radio receiver serves to identify on-time thunderstorms approaching the installation site, allowing one to switch on the high-time resolution acquisition of gamma-ray data, as well as temporally associate parent lightning in the case of TGF detection. The ESTHER set-up is thought of as modular, and it can be easily extended by installing other gamma-ray detectors or antennas.
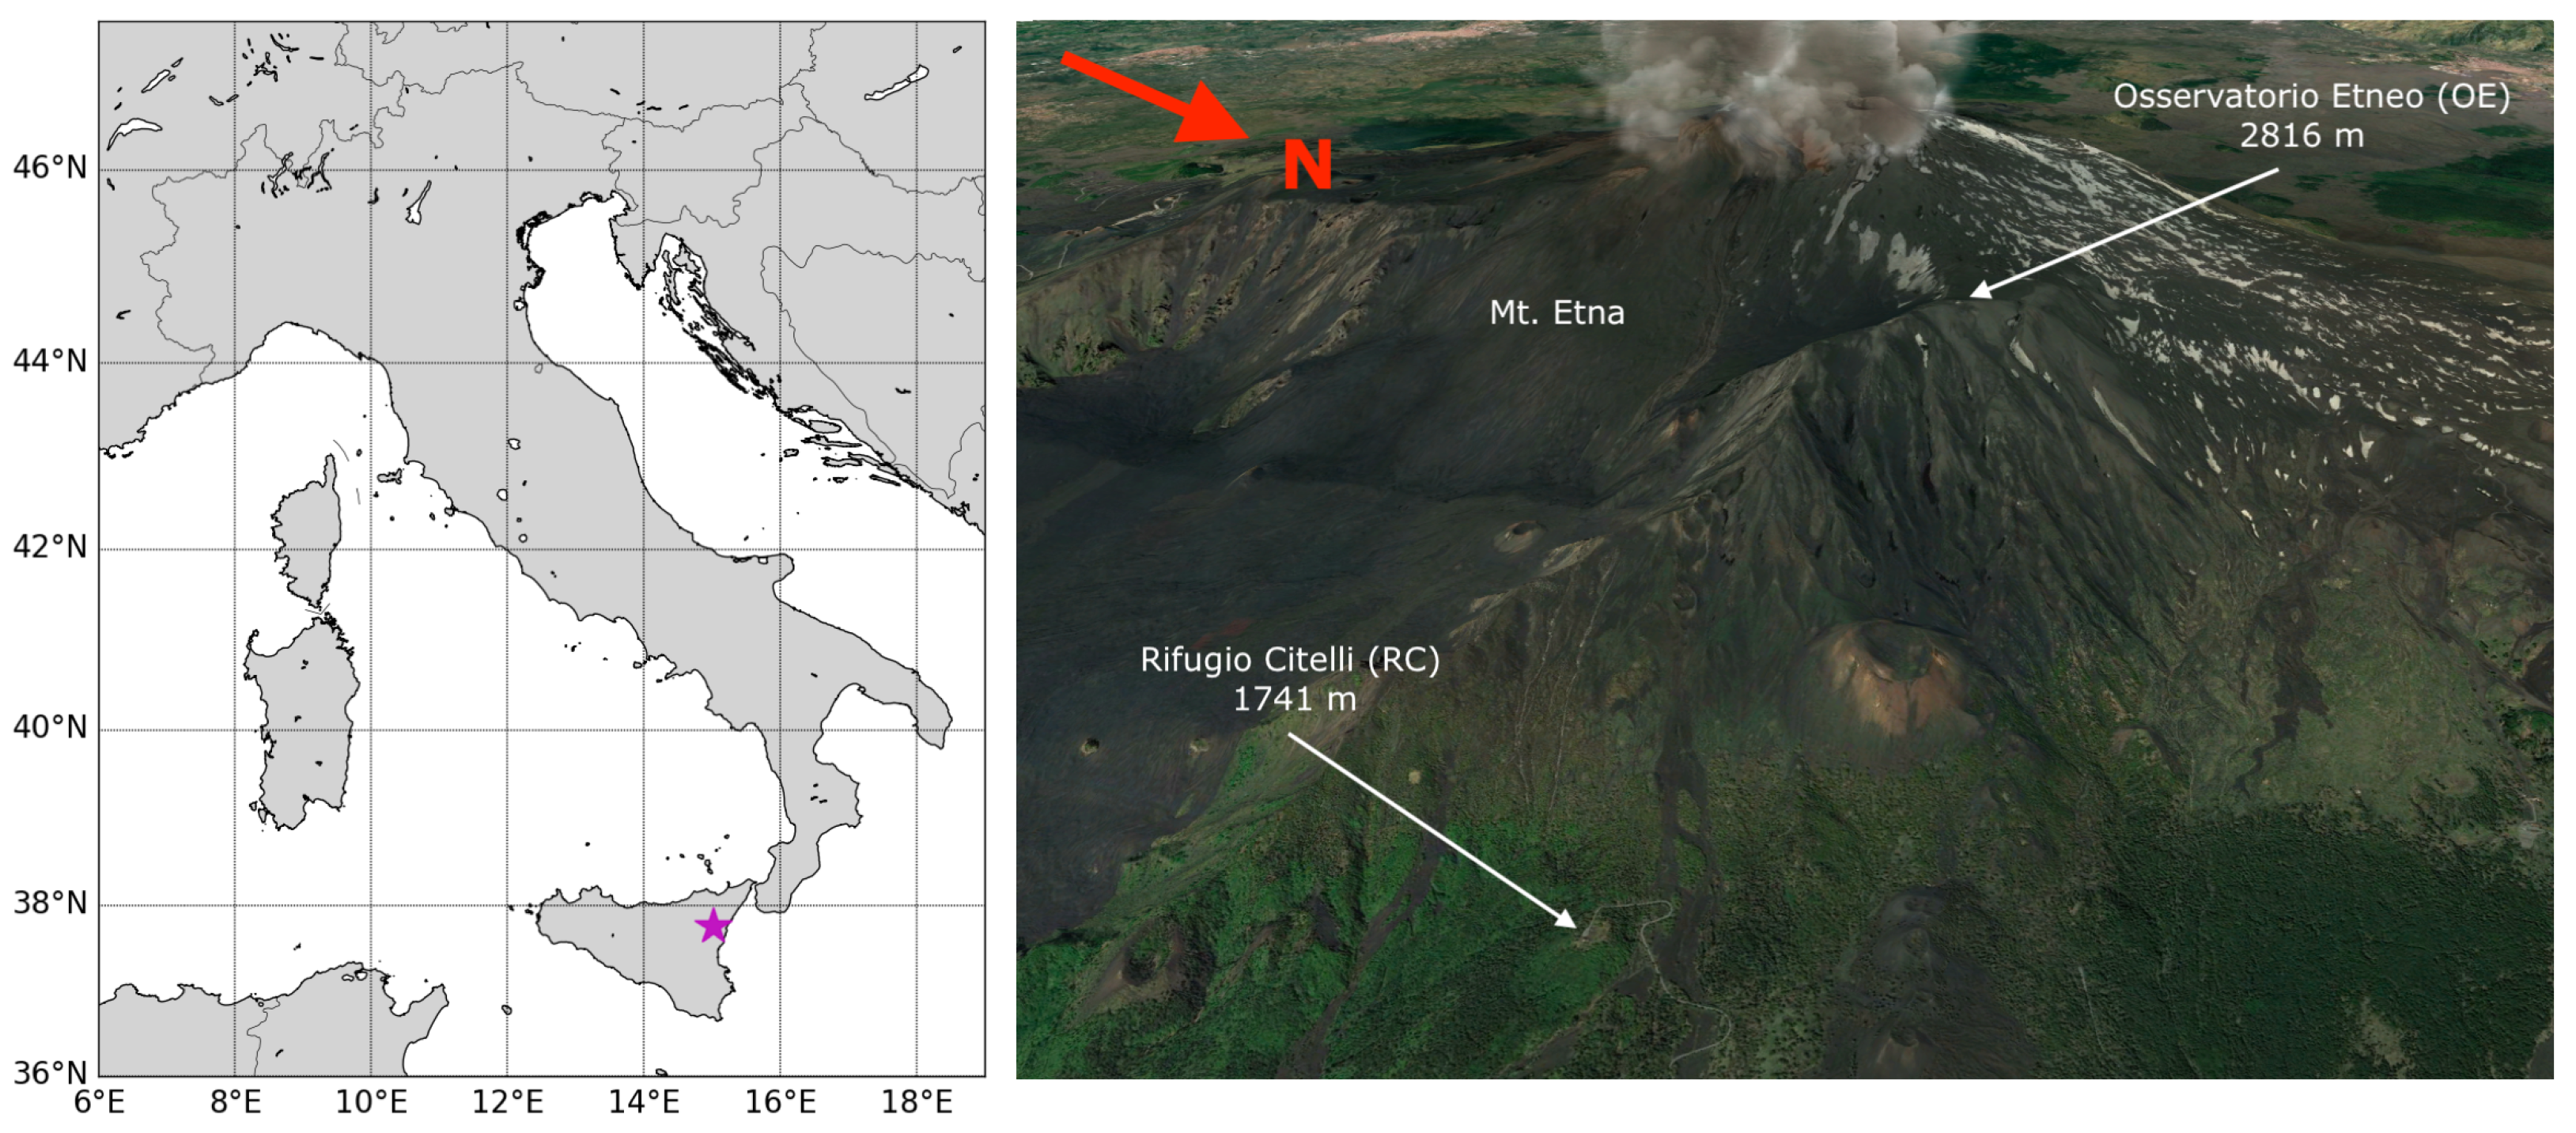
ESTHER is planned to be installed on Mt. Etna, Italy. The high-altitude installation site will increase the probability of ground detection of TGFs and gamma-ray glows due to the lower attenuation undergone by gamma-ray radiation traveling in the higher-altitude, lower-density atmospheric layers. Moreover, the volcanic activity affecting this geographic region and the frequent presence of volcanic plumes may likely favor the production of electric discharges during thunderstorms. Although being thought of as a portable detection system, which may also work for some hours with an independent power supply, the ESTHER set-up requires an electrical current and a network connection to work in nominal mode and carry out long-lasting surveys. However, the highest part of Mt. Etna is an inhospitable environment made of igneous rocks from previous lava flows and frequently affected by new lava flows during volcanic eruptions. As a consequence, anthropic structures above 2000 m are few and lay in particular positions that guarantee a safe spot (i.e., hills preventing structures from being submerged by lava flows). Two possible installation sites have been identified for the ESTHER set-up so far: the Osservatorio Etneo (OE) “Pizzi Deneri”
https://www.ct.ingv.it/index.php/organizzazione/altre-sedi/osservatorio-di-pizzi-deneri (accessed on 6 November 2023) of the Italian National Institute of Geophysics and Volcanology (INGV) at 2816 m a.s.l. and the Rifugio Citelli (RC)
https://www.cai.it/sezione/catania/i-rifugi-della-sezione/rifugio-salvatore-citelli/ (accessed on 6 November 2023) of the Italian Alpine Club (CAI) at 1741 m a.s.l. Both sites are shown in a Google Earth image in
Figure 1, where their location and distance from the mountain top can be noticed. Due to the prohibitive environmental conditions encountered at the higher altitudes of Mt. Etna (especially due to strong winds carrying abrasive ashes that may move or damage the instrumentation), if installed at the OE, the ESTHER gamma-ray detector is planned to be placed behind one of the main windows of the building, directly pointing toward the volcano’s top. In this case, only a relatively thin glass slab would separate it from the outside, thus not preventing gamma-ray propagation and detection. However, if installed at RC, the detector is planned to be placed outside the shelter and inside a watertight aluminum case, directly facing the volcano.
The ESTHER project takes advantage of the long-term experience in TGF studies achieved with the AGILE satellite [
21,
22,
23] and with the Gamma-Flash program [
24,
25,
26]. Moreover, it is worth mentioning that it offers the interesting side opportunity of monitoring environmental high-energy background spectrum variations before, during, and after volcanic eruptions, from a favored point of view.
The ESTHER set-up is currently under calibration in the laboratory, and the project is expected to start in spring 2024. Once operational, it will be the second Italian project devoted to the study of high-energy radiation from thunderstorms and one of the few projects around the world for the study and investigation of TGFs and gamma-ray glows from the ground.
3. Lightning Distribution at Mt. Etna
In order to establish whether Mt. Etna is a suitable location for the installation of a detection system to reveal thunderstorm-related high-energy radiation, it is fundamental to evaluate the lightning occurrence in that geographic region. We investigated the typical lightning occurrence in the surroundings of Mt. Etna, within
km of the mountain top (N
, E
). Panels (a) and (a1) of
Figure 2 report the Mt. Etna altitude profile and the details of it, respectively. In panel (a1), the main craters of the volcano are reported, with their Italian names: Nord Est (North East), Bocca Nuova and Voragine (New Mouth and Hole), and Sud Est (South East), together with the contour lines corresponding to different heights. The two stars represent the Osservatorio Etneo (OE; N
, E
) and the Rifugio Citelli (RC; N
, E
) geographic locations.
For the study of lightning activity, we made use of data acquired by the Lightning Network (LINET) [
27], a European lightning detection network, managed by nowcast GmbH, capable of revealing radio sferic waves emitted by lightning strokes in the VLF/LF range (3–300 kHz). Its radio stations are located all over Europe, thus allowing for thick coverage of the whole continent. Each radio station is equipped with an antenna measuring the lightning magnetic field flux, a GPS clock with a <100 ns time resolution, and modules for signal amplification, ADC conversion, and data processing.
The LINET network provides spatial localization with a mean accuracy of ∼75 m and an overall mean efficiency of ∼4 kA (). Moreover, LINET can discriminate between Intra-Cloud (IC) and Cloud-to-Ground (CG) flashes by means of their current intensity and delay among different radio stations. The network system takes advantage of the fact that CG flashes typically emit sferics at lower altitudes, near the ground, with respect to IC flashes, which produce VLF radiation inside clouds, at a given height. Making use of the Time of Arrival (ToA) method, LINET adopts a specific 3D algorithm, providing information on both the horizontal extent of the event and its vertical displacement, reconstructing for the ICs an estimated average height of the lightning flash. We point out that the evaluation in the ToA could be affected by the ground conductivity and the terrain orography and profile. For this reason, the presence of a dedicated VLF antenna, such as that of the ESTHER set-up, would be useful to provide an independent measurement of VLF signals in the surroundings of the installation site.
We selected the time interval from June 2014 to December 2020 as the period of interest. During this time interval, the LINET network detected 12,343 strokes, occurring within 10 km of the mountain peak. For 402 days out of a total number of 2405 analyzed days, lightning was detected via LINET in the region of interest, corresponding to an occurrence rate of about ∼17% of the time. In comparison, the location chosen for the Gamma-Flash ground-based detection system on Mt. Cimone (2200 m a.s.l.) exhibited a flash occurrence rate of ∼7% of the time.
As expected from typical lightning activity, the discharges tend to exhibit a higher rate during the hottest period of the year, with lower production during winter months, as shown in
Figure 3a for ICs (blue), CGs (red), and both of them (white).
By exploiting the capacity of the LINET network to discriminate among different types of lightning, we found out that 9879 flashes constituted CGs and 2464 constituted ICs. Panels (b) and (b1) of
Figure 2 report the IC flash distributions in the same geographic region of the previous plots. A clear clustering of lightning discharges at the mountain top is evident, with two main spots in the proximity of the volcano craters (one on the Nord Est + Bocca Nuova + Voragine, and one on the Sud Est). This peculiar behavior could be ascribed to the presence of volcanic plumes, which may provide a preferential conductive path for the lightning discharges during thunderstorm episodes. Panels (c) and (c1) of
Figure 2 show the CG lightning distribution in the same region. Furthermore, in this case, a significant clustering of flashes near the mountain peak can be seen, pouring toward the northern part of the top, probably due to orographic reasons. The presence of a cable car could also be partially responsible for such clustering. The return stroke peak currents of these flashes, as reconstructed via LINET, mostly range within
and
kA, peaking at about
kA, depending on the polarity, as shown in
Figure 3b for both ICs and CGs.
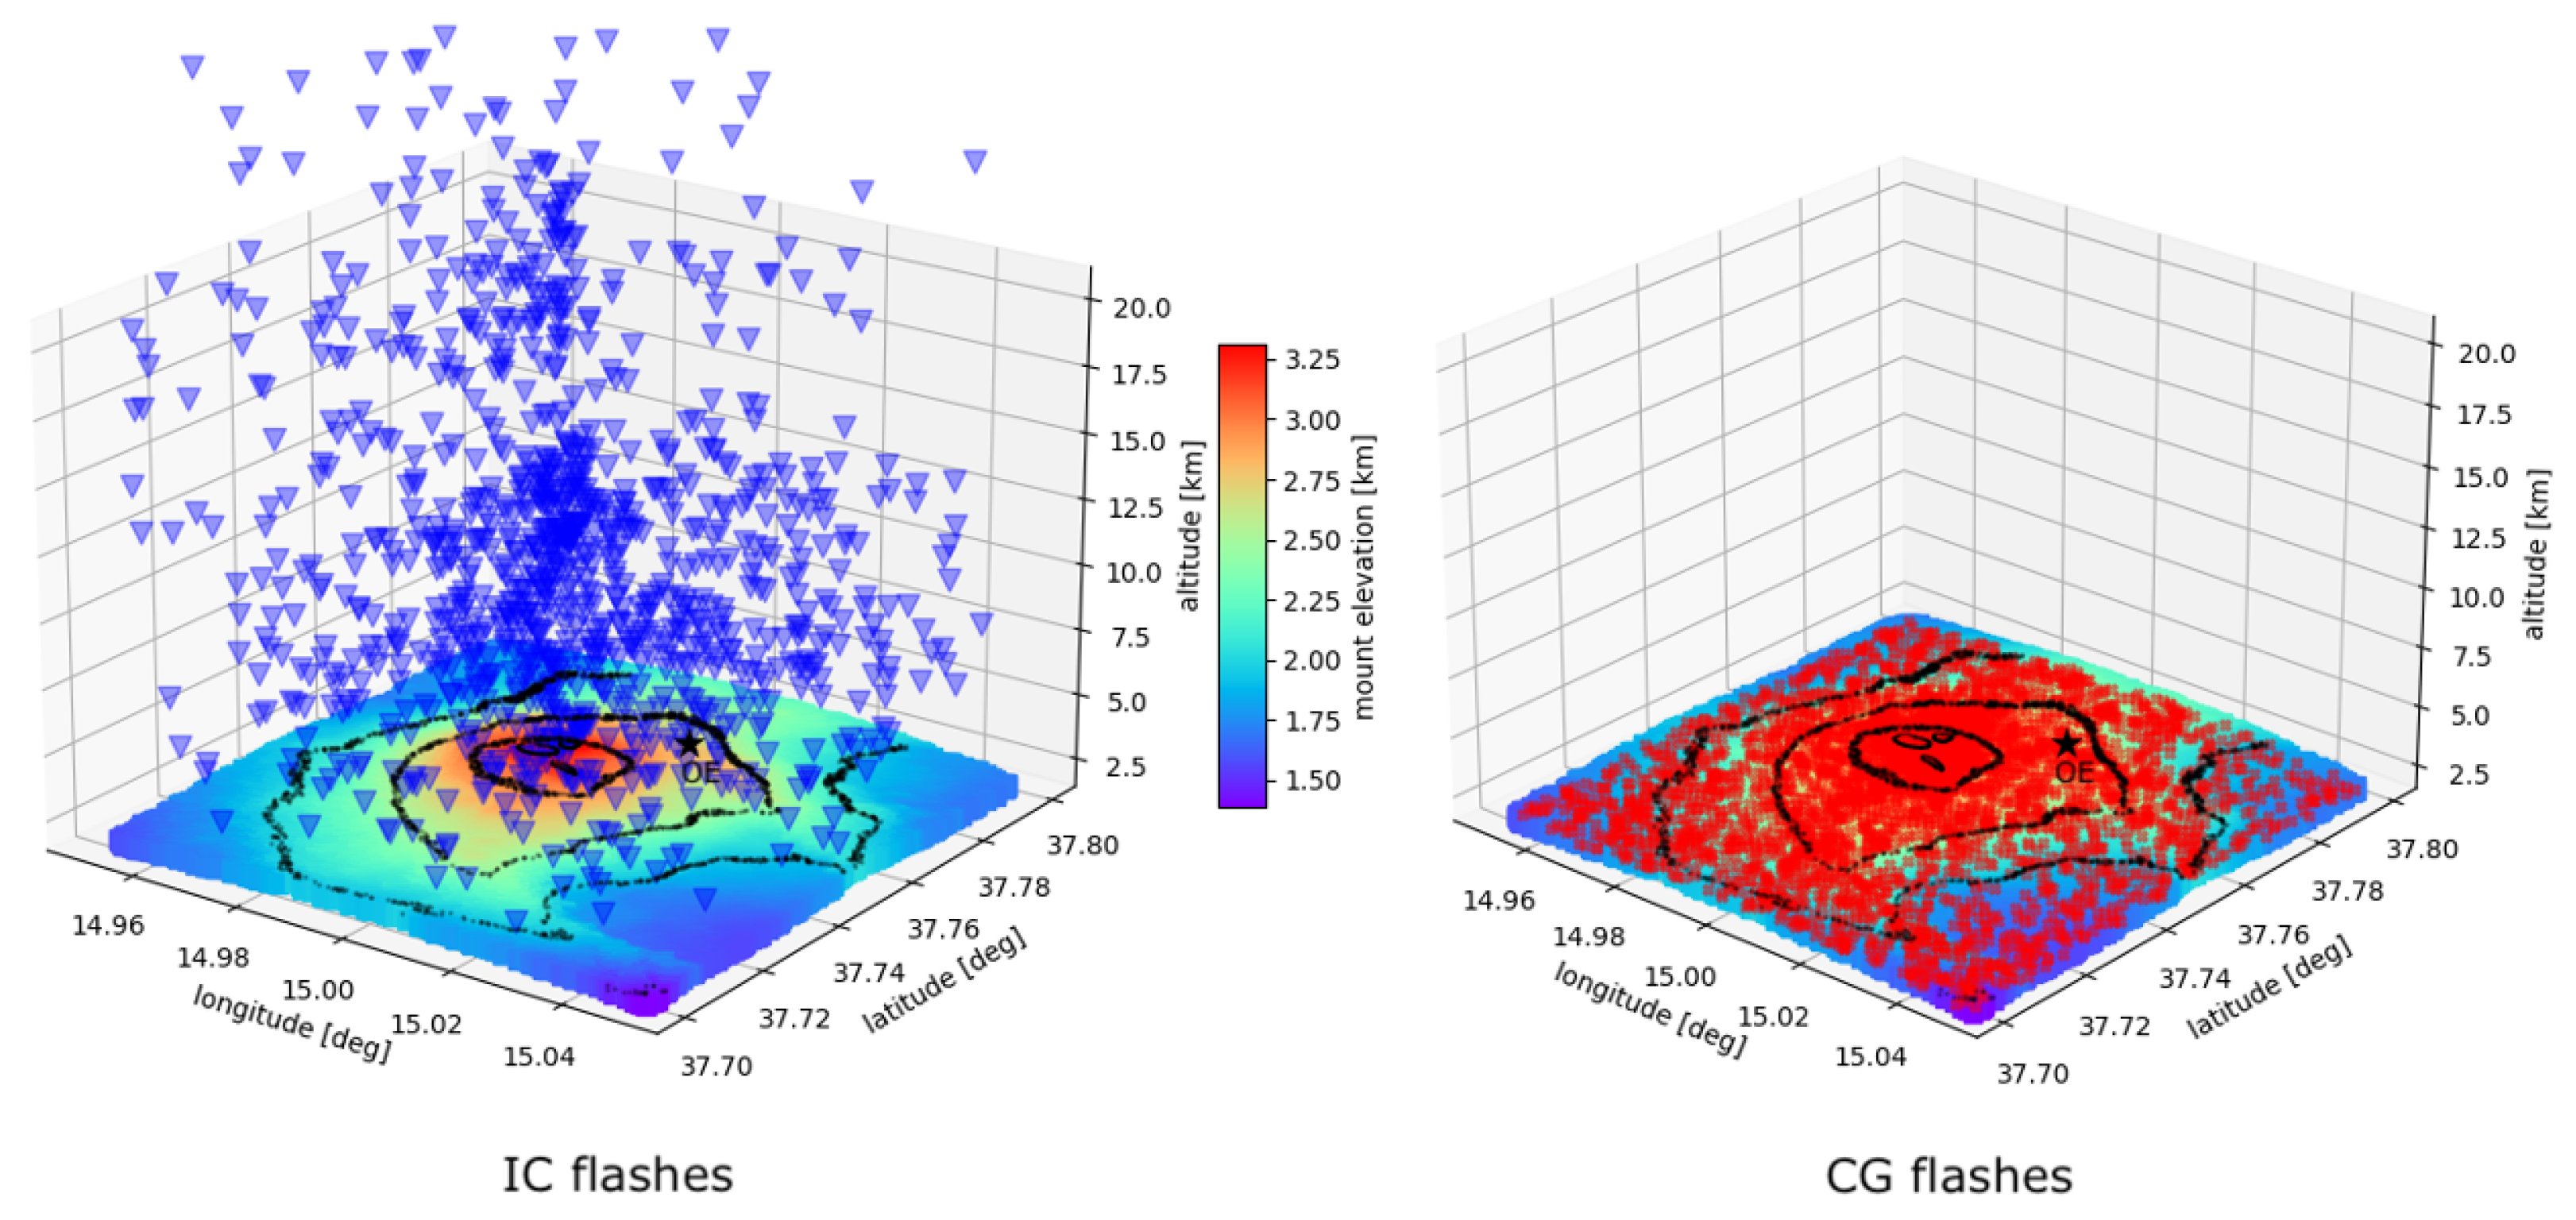
The peculiar distributions of lightning discharges are better displayed in
Figure 4 as 3D scatter plots. In both panels, the altitude profile of Mt. Etna is reported, together with the geographic location of the Osservatorio Etneo (OE, black star). It can be noticed that CG flashes (red crosses) are concentrated on the mountain top, whereas IC flashes (blue triangles) cluster in a thick column right above the volcano’s main craters, which is possibly favored due to the presence of volcanic plumes.
In order to quantify the occurrence of lightning discharges in the Mt. Etna region, we evaluated histograms of the IC (blue) and CG (red) flashes’ radial distance from the installation site and altitude with respect to the sea level. For this analysis, we selected the mountain top as a reference point (N
, E
) and evaluated a radius area of 10 km around it. These histograms are shown in the right part of
Figure 5. The dashed circumferences delimit areas of 2 km radius from the mountain top. Both IC and CG distributions exhibit similar behaviors, with a sharp peak within 2.0 km of the center. This peak corresponds to the cluster of events on (and over) the mountain top, which can be seen in the top plots, circumscribed by the dashed circumferences. For both IC and CG distributions, these events constitute about
of all lightning events taking place within 10 km of the top. This fraction is huge, as all these events are included within an area of only 12.6 km
. However, the remaining analyzed surface, accounting for
of the events, subtended within radii of 2 km and 10 km, is 28,952 km
, meaning that near the mountain top, the flash density is about 40 times that of the surrounding region, for both IC and CG lightning events.
The bottom right panel reports the distribution of the heights of the detected IC and CG flashes. The CG reconstructed altitude corresponds to the ground elevation at the point where the lightning stroke hit the ground, with all flashes occurring from a minimum height of ∼1000 m a.s.l. to a maximum height of ∼3300 m a.s.l. (Mt. Etna’s altitude). From panel (c) of
Figure 2, reported in the bottom left, we know that CGs cluster within the contour lines of 2500–3000 m. As a consequence, those events are mostly included in the last two bins of the CG histogram. The IC altitude profile does not show peculiar features, involving all heights between the mountain top and 20 km. A slight step can be noticed at a height of about 15 km, which is due to the fact that LINET’s sensitivity changed over the years, and a 15–20 km range sensitivity was adopted for a limited amount of time.
4. Lightning Clusters on Mt. Etna’s Peak
As illustrated in
Section 1, volcanoes represent interesting locations for the occurrence and study of lightning. On the one hand, volcanic eruptions may trigger lightning during the most explosive phases of the eruptions by means of different production mechanisms (e.g., frictional electrification, fractoelectrification, and ice charging) [
18]. On the other hand, the persistence of ash plumes over craters, even long after the main stages of volcanic eruptions, might favor electrical discharging, under the conditions of a humid atmosphere, as is present during thunderstorms. It is interesting to estimate the fraction of lightning activity on Mt. Etna, as revealed via LINET, that is produced during the eruption phases or thunderstorms. This would help in understanding whether volcanic lightning could reach, for some particularly energetic eruption episodes, intensities detectable by the lightning network.
We considered an area of 2 km around Mt. Etna’s top, as reported in the left panels of
Figure 5, which includes the IC and the CG lightning clusters. This allowed us to select the most active regions on Mt. Etna and distinguish between the discharges occurring in the peak activity region
(within 0–2 km) and outside of it
(within 2–10 km). We studied the occurrence rate of CGs and ICs over time for both
and
. If the lightning discharges occurring within the region
were produced by volcanic eruptions, we would expect no further lightning activity in the surrounding
region, as the discharges would be all produced by the explosive event nearby the main craters. On the contrary, if the discharges within
were produced during thunderstorms, we would expect the outer
area to be affected by lightning.
For both CGs and ICs, whenever lightning discharges were recorded within their respective areas, lightning activity was also present in the outer regions, proving that these events are ascribed to normal thunderstorms taking place at Mt. Etna. The strong clustering near and over the main volcano craters should therefore be ascribed to the mountain peak and orography, as well as the possible presence of ash columns favoring the electrical discharge. Nevertheless, no sferics were recorded via LINET during the Etna explosive eruption of 3 December 2015, when intense volcanic lightning was reported. The potential volcanic lightning events that occurred during explosive eruptions were probably too weak to produce electrical currents capable of emitting sufficiently intense VLF radio waves to be revealed by the LINET network.
5. Estimate of TGF Detectability at Mt. Etna
Once established that Mt. Etna is affected by frequent and intense lighting activity, we evaluated the detectability of possibly emitted Terrestrial Gamma-ray Flashes (TGFs) from the two proposed installation sites (i.e., OE and RC). We followed the same approach already adopted in [
24] for the estimate of the TGF detectability region in the surroundings of the Gamma-Flash experiment installation site.
Although
Section 3 pointed out that the whole Mt. Etna area is affected by lightning, in the following section, we will provide a particular remark on the IC and CG clustering zones, where the highest fraction of discharges take place, considering them as the most likely TGF production regions.
We assumed
n potential TGF sources located in the volume all around the installation site, at a fixed position within a grid ranging up to an
km ground distance and a
km altitude a.s.l., at steps of 300 m. Each TGF is assumed to produce
initial gamma-ray photons with a typical TGF energy spectrum, as described by [
28]. TGFs are thought to be beamed emissions of gamma-rays, with half-angles mainly compatible with 30°–40°, as reported in [
29]. We point out that such estimates have been carried out considering TGFs detected from space; however, at shorter distances from the TGF source, the beaming emission angles could be smaller. TGFs emitted within large cones would be geometrically more likely to be intercepted by a detector field of view but energetically less easy to reveal due to the substantial softening of their gamma-ray flux. However, TGFs produced within narrower emission cones would be geometrically less likely to be intercepted by a detector field of view but energetically easier to reveal due to their higher intensity and harder energy spectrum. In order to evaluate different beaming configurations, we assumed gamma-ray emissions constrained within semi-apertures of
or
. All TGF emission cones are considered to point directly toward the installation site in order to test the best source–target configuration. Adopting the same method used in [
24] and considering the average attenuation undergone by gamma-ray radiation in the air for the considered energies, we evaluated the number of surviving photons at the installation site for each TGF source of the grid.
A first survey at the Mt. Etna OE and RC sites allowed us to carry out some preliminary evaluations of the average high-energy environmental background encountered in such locations, which turned out to be equal to a rate of ∼200–300 Hz, depending on the time of day and location (OE or RC, inside or outside the structure). Considering millisecond timescales, which are more suitable for TGFs, this translates into ∼0.2–0.3 counts/ms. We know that during precipitation and thunderstorm events, such rates could temporarily rise due to the gamma-ray activity produced by
Pb and
Bi (daughters of atmospheric
Rn) collected and brought to the ground by rain droplets [
30]. We considered a cylinder detector with a radius of
(as that used for ESTHER) as the target surface. We used both the OE and RC as target points for this analysis to highlight the main differences among these two possible installation sites.
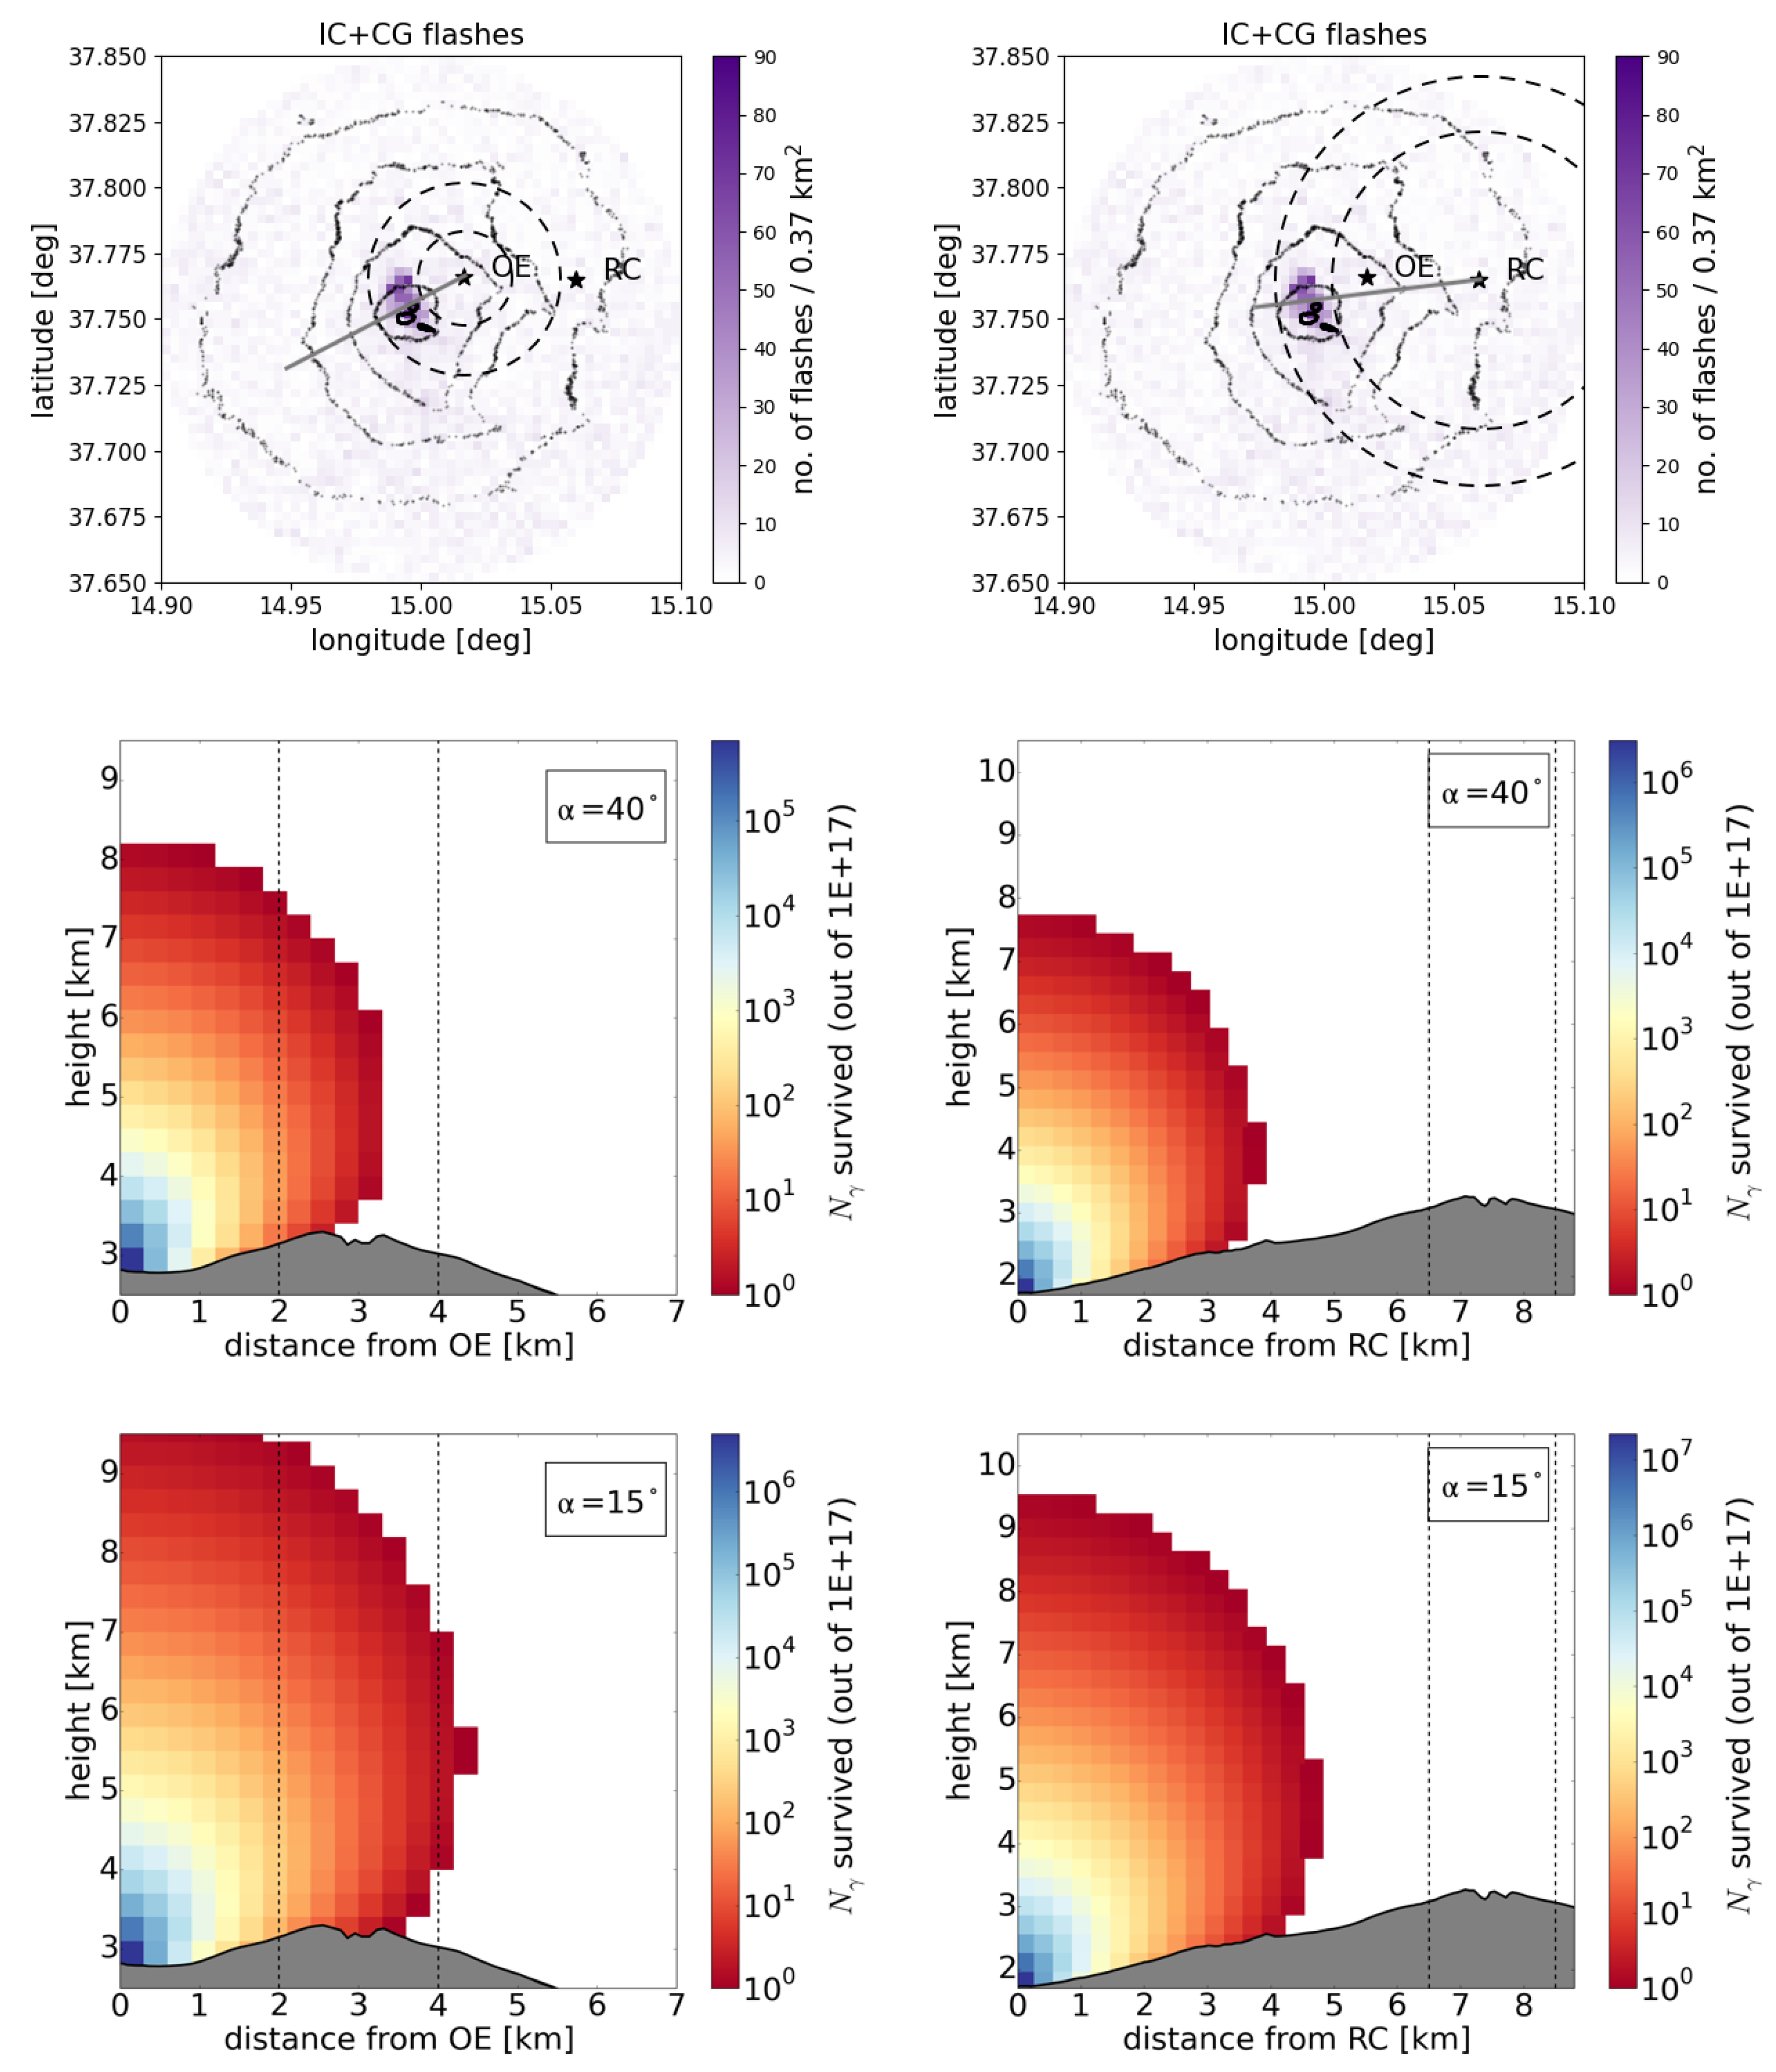
The upper panel of
Figure 6 reports the distribution of IC+CG lightning discharges that occurred in the Mt. Etna region. In the plot on the left, the two dashed circumferences correspond to distances of 2.0 and 4.0 km from the OE, respectively, including the peak lightning activity area. The right plot shows the same concept but from the RC site. The gray lines connect the installation sites with the centers of the flash clusters located at the top of the volcano. In the bottom plots, we reported the detectability regions around the installation sites, for OE (left) and RC (right) and TGF emission cones with
(second row) and
(third row). The detectability regions go from a maximum number of surviving photons of
–10
(depending on the site angle configuration) to the minimum accepted threshold of one photon. The gray profile in the bottom part of the plots represents the elevation profile along the gray lines of the top panels. The dashed vertical lines correspond to the 2.0–4.0 km (left) and 6.5–8.5 km (right) distances from the respective installation sites.
As expected, smaller emission angles translate into a higher survival of the high-energy photons from the source to the target due to the more concentrated and intense configuration of the beam. It can be noticed that the OE site offers a better solution for the installation of the ESTHER set-up, given its closer proximity to the volcano’s peak, which is strongly affected by lightning activity, and the higher altitude location, where gamma-ray attenuation is weaker. For both and , a detector placed at the OE would be, in principle, capable of revealing a TGF originating within the higher occurrence region of 2.0–4.0 km from the site. We remark that this analysis was performed considering an average TGF releasing photons, and these estimated detectability volumes around the installation sites may be wider (in case more photons are emitted at the source) or smaller (in case fewer photons are emitted at the source). Another point to be taken into account is that the detectability volumes estimated in this analysis include all TGF configurations that, in principle, are capable of producing at least one survived count in the gamma-ray detector. However, in order for an event to be clearly distinguished above the background rate, we shall require a larger number of counts. On a TGF timescale of 1 ms, the typical background rate at Mt. Etna is equal to = 0.2–0.3 Hz. Considering that the probability of observing a certain number of events n in a given bin is described by a Poisson distribution , we shall require that a single TGF release at least three counts within 1 ms to have a significance of at least above the background rate or six counts for a significance of . This would resize the amplitude of the detectability region around the target detector.
We point out that lightning activity also exists in the intermediate region between the RC and the mountain peak, so even a detector placed at the RC site could be, in principle, capable of detecting TGFs if these are produced at closer distances. Although less suitable for TGF detection, the RC location shall not be ruled out. Both installation sites can be exploited at different times of the project: the RC can be used to measure initial data at the beginning of the project, serving as a test phase. Furthermore, a possible integration and extension of the ESTHER set-up, such as adding further gamma-ray detectors and/or radio antennas, could allow it to perform simultaneous monitoring of the same geographic region from different points of view.
6. Conclusions
Studying TGFs can provide valuable insights into the complex processes occurring within thunderstorms and lightning, helping to shed light on the fundamental physics of high-energy particle interactions in Earth’s atmosphere. Detecting TGFs from the ground is crucial for advancing our understanding of atmospheric and high-energy physics, as well as studying lightning and thunderstorms and contributing to broadening our scientific knowledge about this phenomenon.
The Experiment to Study Thunderstorm High-Energy Radiation (ESTHER) is a low-budget project of the Italian National Institute for Astrophysics (INAF) that will be installed on Mt. Etna, Italy, starting in 2024. Its aim will be the investigation of high-energy radiation (i.e., TGFs and gamma-ray glows) produced during lightning. The peculiar location, frequently affected by the presence of volcanic ash plumes extending above the mountain top, could make lightning production more likely during thunderstorms, as well as possibly during the most explosive phases of volcanic eruptions, thus increasing the probability of producing associated high-energy emissions.
An extensive analysis of the lightning activity in the Mt. Etna geographic region, using the Lightning Network (LINET) data across the 2014–2020 time interval, allowed us to point out a clear clustering of Cloud-to-Ground (CG) discharges in the proximity of the mountain peak, as well as Intra-Cloud (IC) ones right above the volcano’s main craters. This peculiar behavior is possibly ascribed to orographic reasons and to the frequent presence of volcanic plumes or ashes above the volcano’s top, which creates a favorable conductive path for discharges, thus promoting natural lightning activity. However, we rule out that this clustering is due to volcanic lightning, as for all the flashes revealed by LINET, a thunderstorm was taking place with lightning activity of interest over the surrounding region, though with a lower flash rate.
An estimate of the expected gamma-ray attenuation in air, following an approach already adopted for the Gamma-Flash program, allowed us to evaluate the best accessible installation site on Mt. Etna to ensure Terrestrial Gamma-ray Flash (TGF) detection. In particular, the Osservatorio Etneo “Pizzi Deneri” of the Italiana National Institute of Geophysics and Volcanology (INGV), located at 2816 m a.s.l., would allow the ESTHER set-up to lie only 2.7 km from Mt. Etna’s peak, which is strongly affected by lightning activity. The close proximity of this site to the main craters and its high altitude would reduce the gamma-ray attenuation experienced by gamma-ray radiation traveling in the air, thus enhancing the probability of detection at the target point.
This study serves as a starting point for the ESTHER activities, confirming the Mt. Etna location as a very suitable site for the occurrence of lightning and the investigation of related high-energy emissions.
Author Contributions
Conceptualization, A.U.; methodology, A.U.; software, A.U.; validation, A.U.; formal analysis, A.U.; investigation, A.U.; resources, A.U., D.R., A.B. and A.T.; data curation, A.U.; writing—original draft preparation, A.U.; writing—review and editing, A.U.; supervision, A.U., D.R. and E.V.; project administration, A.U. All authors have read and agreed to the published version of the manuscript.
Funding
This research was funded by INAF RSN-5 mini-grant 1.05.12.04.05 “ESTHER” CUP C83C22001590005.
Institutional Review Board Statement
Not applicable.
Informed Consent Statement
Not applicable.
Data Availability Statement
Restrictions apply to the availability of these data. Data was obtained from CNR-ISAC, Rome and are available from the authors with the permission of CNR-ISAC, Rome.
Acknowledgments
We would like to thank ISAC-CNR, Rome, for providing the Lightning Network (LINET) lightning data used in this study.
Conflicts of Interest
The authors declare no conflict of interest.
References
- Torii, T.; Takeishi, M.; Hosono, T. Observation of gamma-ray dose increase associated with winter thunderstorm and lightning activity. J. Geophys. Res. 2002, 107, 4324. [Google Scholar] [CrossRef]
- Dwyer, J.R.; Rassoul, H.K.; Al-Dayeh, M.; Caraway, L.; Wright, B.; Chrest, A.; Uman, M.A.; Rakov, V.A.; Rambo, K.J.; Jordan, D.M.; et al. A ground level gamma-ray burst observed in association with rocket-triggered lightning. Geophys. Res. Lett. 2004, 31, L05119. [Google Scholar] [CrossRef]
- Tsuchiya, H.; Enoto, T.; Yamada, S.; Yuasa, T.; Kawaharada, M.; Kitaguchi, T.; Kokubun, M.; Kato, H.; Okano, M.; Nakamura, S.; et al. Detection of High-Energy Gamma Rays from Winter Thunderclouds. Phys. Rev. Lett. 2007, 99, 165002. [Google Scholar] [CrossRef] [PubMed]
- Chilingarian, A.; Daryan, A.; Arakelyan, K.; Hovhannisyan, A.; Mailyan, B.; Melkumyan, L.; Hovsepyan, G.; Chilingaryan, S.; Reymers, A.; Vanyan, L. Ground-based observations of thunderstorm-correlated fluxes of high-energy electrons, gamma rays, and neutrons. Phys. Rev. D 2010, 82, 043009. [Google Scholar] [CrossRef]
- Tsuchiya, H.; Enoto, T.; Yamada, S.; Yuasa, T.; Nakazawa, K.; Kitaguchi, T.; Kawaharada, M.; Kokubun, M.; Kato, H.; Okano, M.; et al. Long-duration γ ray emissions from 2007 and 2008 winter thunderstorms. J. Geophys. Res. 2011, 116, D09113. [Google Scholar] [CrossRef]
- Tran, M.D.; Rakov, V.A.; Mallick, S.; Dwyer, J.R.; Nag, A.; Heckman, S. A terrestrial gamma-ray flash recorded at the Lightning Observatory in Gainesville, Florida. J. Atmos.-Sol.-Terr. Phys. 2015, 136, 86–93. [Google Scholar] [CrossRef]
- Hare, B.M.; Uman, M.A.; Dwyer, J.R.; Jordan, D.M.; Biggerstaff, M.I.; Caicedo, J.A.; Carvalho, F.L.; Wilkes, R.A.; Kotovsky, D.A.; Gamerota, W.R.; et al. Ground-level observation of a terrestrial gamma ray flash initiated by a triggered lightning. J. Geophys. Res. 2016, 121, 6511–6533. [Google Scholar] [CrossRef]
- Abbasi, R.U.; Abu-Zayyad, T.; Allen, M.; Barcikowski, E.; Belz, J.W.; Bergman, D.R.; Blake, S.A.; Byrne, M.; Cady, R.; Cheon, B.; et al. Gamma Ray Showers Observed at Ground Level in Coincidence With Downward Lightning Leaders. J. Geophys. Res. Atmos. 2018, 123, 6864–6879. [Google Scholar] [CrossRef]
- Enoto, T.; Wada, Y.; Furuta, Y.; Nakazawa, K.; Yuasa, T.; Okuda, K.; Makishima, K.; Sato, M.; Sato, Y.; Nakano, T.; et al. Photonuclear reactions triggered by lightning discharge. Nature 2017, 551, 481–484. [Google Scholar] [CrossRef]
- Bowers, G.S.; Smith, D.M.; Martinez-McKinney, G.F.; Kamogawa, M.; Cummer, S.A.; Dwyer, J.R.; Wang, D.; Stock, M.; Kawasaki, Z. Gamma Ray Signatures of Neutrons From a Terrestrial Gamma Ray Flash. Geophys. Res. Lett. 2017, 44, 10. [Google Scholar] [CrossRef]
- Smith, D.M.; Bowers, G.S.; Kamogawa, M.; Wang, D.; Ushio, T.; Ortberg, J.; Dwyer, J.R.; Stock, M. Characterizing Upward Lightning With and Without a Terrestrial Gamma Ray Flash. J. Geophys. Res. 2018, 123, 11321–11332. [Google Scholar] [CrossRef]
- Pleshinger, D.J.; Alnussirat, S.T.; Arias, J.; Bai, S.; Banadaki, Y.; Cherry, M.L.; Hoffman, J.H.; Khosravi, E.; Legault, M.D.; Rodriguez, R.; et al. Gamma Ray Flashes Produced by Lightning Observed at Ground Level by TETRA-II. J. Geophys. Res. 2019, 124, 9229–9238. [Google Scholar] [CrossRef]
- Wada, Y.; Enoto, T.; Nakazawa, K.; Furuta, Y.; Yuasa, T.; Nakamura, Y.; Morimoto, T.; Matsumoto, T.; Makishima, K.; Tsuchiya, H. Downward Terrestrial Gamma-Ray Flash Observed in a Winter Thunderstorm. Phys. Rev. Lett. 2019, 123, 061103. [Google Scholar] [CrossRef]
- Belz, J.W.; Krehbiel, P.R.; Remington, J.; Stanley, M.A.; Abbasi, R.U.; LeVon, R.; Rison, W.; Rodeheffer, D.; Abu-Zayyad, T.; Allen, M.; et al. Observations of the Origin of Downward Terrestrial Gamma-Ray Flashes. J. Geophys. Res. 2020, 125, e31940. [Google Scholar] [CrossRef]
- Ortberg, J.; Smith, D.M.; Li, J.; Dwyer, J.; Bowers, G. Detecting an Upward Terrestrial Gamma Ray Flash from its Reverse Positron Beam. J. Geophys. Res. 2020, 125, e30942. [Google Scholar] [CrossRef]
- Pu, Y.; Cummer, S.A.; Huang, A.; Briggs, M.; Mailyan, B.; Lesage, S. A Satellite-Detected Terrestrial Gamma Ray Flash Produced by a Cloud-to-Ground Lightning Leader. Geophys. Res. Lett. 2020, 47, e89427. [Google Scholar] [CrossRef]
- Briggs, M.S.; Lesage, S.; Schultz, C.; Mailyan, B.; Holzworth, R.H. A Terrestrial Gamma-Ray Flash From the 2022 Hunga Tonga-Hunga Ha’apai Volcanic Eruption. Geophys. Res. Lett. 2022, 49, e99660. [Google Scholar] [CrossRef]
- Cimarelli, C.; Behnke, S.; Genareau, K.; Harper, J.M.; Van Eaton, A.R. Volcanic electrification: Recent advances and future perspectives. Bull. Volcanol. 2022, 84, 78. [Google Scholar] [CrossRef]
- Sarkinen, C.; Wiitala, J. Investigation of Volcanic Ash on Transmission Facilities in the Pacific Northwest. IEEE Trans. Power Appar. Syst. 1981, 100, 2278–2286. [Google Scholar] [CrossRef]
- Wardman, J.B.; Wilson, T.M.; Bodger, P.S.; Cole, J.W.; Johnston, D.M. Investigating the electrical conductivity of volcanic ash and its effect on HV power systems. Phys. Chem. Earth 2012, 45–46, 128–145. [Google Scholar] [CrossRef]
- Marisaldi, M.; Fuschino, F.; Labanti, C.; Galli, M.; Longo, F.; Del Monte, E.; Barbiellini, G.; Tavani, M.; Giuliani, A.; Moretti, E.; et al. Detection of terrestrial gamma ray flashes up to 40 MeV by the AGILE satellite. J. Geophys. Res. 2010, 115. [Google Scholar] [CrossRef]
- Lindanger, A.; Marisaldi, M.; Maiorana, C.; Sarria, D.; Albrechtsen, K.; Østgaard, N.; Galli, M.; Ursi, A.; Labanti, C.; Tavani, M.; et al. The 3rd AGILE Terrestrial Gamma Ray Flash Catalog. Part I: Association to Lightning Sferics. J. Geophys. Res. Atmos. 2020, 125, e2019JD031985. [Google Scholar] [CrossRef]
- Maiorana, C.; Marisaldi, M.; Lindanger, A.; Østgaard, N.; Ursi, A.; Sarria, D.; Galli, M.; Labanti, C.; Tavani, M.; Pittori, C.; et al. The 3rd AGILE Terrestrial Gamma-ray Flashes Catalog. Part II: Optimized Selection Criteria and Characteristics of the New Sample. J. Geophys. Res. Atmos. 2020, 125, e2019JD031986. [Google Scholar] [CrossRef]
- Ursi, A.; Rodriguez Fernandez, G.; Tiberia, A.; Virgilli, E.; Arnone, E.; Preziosi, E.; Campana, R.; Tavani, M. A Study on TGF Detectability at 2165 m Altitude: Estimates for the Mountain-Based Gamma-Flash Experiment. Remote Sens. 2022, 14, 3103. [Google Scholar] [CrossRef]
- Tiberia, A.; Arnone, E.; Ursi, A.; Fuschino, F.; Virgilli, E.; Preziosi, E.; Tavani, M.; Dietrich, S. A Joint LINET and ISS-LIS View of Lightning Distribution over the Mt. Cimone Area within the GAMMA-FLASH Program. Remote Sens. 2022, 14, 3501. [Google Scholar] [CrossRef]
- Bulgarelli, A.; Addis, A.; Aboudan, A.; Abu, I.; Andreani, C.; Argan, A.; Campana, R.; Calabretto, P.; Pittori, C.; D’Amico, F.; et al. The Gamma-Flash data acquisition system for observation of terrestrial gamma-ray flashes. arXiv 2023, arXiv:2302.08321. [Google Scholar] [CrossRef]
- Betz, H.; Schmidt, K.; Laroche, P.; Blanchet, P.; Oettinger, W.; Defer, E.; Dziewit, Z.; Konarski, J. LINET—An international lightning detection network in Europe. Atmos. Res. 2009, 91, 564–573. [Google Scholar] [CrossRef]
- Dwyer, J.R.; Smith, D.M. A comparison between Monte Carlo simulations of runaway breakdown and terrestrial gamma-ray flash observations. Geophys. Res. Lett. 2005, 32, 22804. [Google Scholar] [CrossRef]
- Gjesteland, T.; Østgaard, N.; Collier, A.B.; Carlson, B.E.; Cohen, M.B.; Lehtinen, N.G. Confining the angular distribution of terrestrial gamma ray flash emission. J. Geophys. Res. 2011, 116, 11313. [Google Scholar] [CrossRef]
- Minato, S. Analysis of Time Variations in Natural Background Gamma Radiation Flux Density. J. Nucl. Sci. Technol. 1980, 17, 461–469. [Google Scholar] [CrossRef]
| Disclaimer/Publisher’s Note: The statements, opinions and data contained in all publications are solely those of the individual author(s) and contributor(s) and not of MDPI and/or the editor(s). MDPI and/or the editor(s) disclaim responsibility for any injury to people or property resulting from any ideas, methods, instructions or products referred to in the content. |
© 2023 by the authors. Licensee MDPI, Basel, Switzerland. This article is an open access article distributed under the terms and conditions of the Creative Commons Attribution (CC BY) license (https://creativecommons.org/licenses/by/4.0/).

 ,
, 


