Article

Ground Calibration and In-Flight Performance of the Low Energy Particle Analyzer on FY-4B

1
National Space Science Center, Chinese Academy of Sciences, Beijing 100190, China
2
Beijing Key Laboratory of Space Environment Exploration, Beijing 100190, China
3
Key Laboratory of Environmental Space Situation Awareness Technology, Chinese Academy of Sciences, Beijing 100190, China
4
Key Laboratory of Space Weather, National Satellite Meteorological Center, National Center for Space Weather, China Meteorological Administration, Beijing 100081, China
5
Innovation Center for FengYun Meteorological Satellite (FYSIC), Beijing 100081, China
6
Institute of Science and Technology for Deep Space Exploration, Suzhou Campus, Nanjing University, Suzhou 215163, China
7
University of Chinese Academy of Sciences, Beijing 100049, China
*
Authors to whom correspondence should be addressed.
These authors contributed equally to this work.
Atmosphere 2023, 14(12), 1834; https://doi.org/10.3390/atmos14121834
Submission received: 10 November 2023 / Revised: 7 December 2023 / Accepted: 16 December 2023 / Published: 18 December 2023
(This article belongs to the Special Issue Research and Space-Based Exploration on Space Plasma)

Abstract

:
The FY-4B satellite is one of the second generation of China’s geosynchronous meteorological satellites aiming at numerical weather forecasts. The space environment monitoring package (SEMP) onboard the FY-4B is a comprehensive instrument package for plasma, high-energy particle, and energetic neutral particle measurements. The low-energy particle analyzer (LEPA) is one of the instruments of the SEMP and consists of two top hat electrostatic analyzers designed for plasma detection. The electron and ion sensors are back-to-back assembled and are integrated to a shared electronic box. It measures the three-dimensional velocity distribution of low-energy electrons and ions on the geosynchronous orbit. In this paper, we present the ground calibration and in-flight performance of the instrument. With the electrostatic deflectors and the cylindrically symmetric structure, the instrument provides high-cadence measurements of electron and ion velocity distributions with a wide field of view (FOV) of 180° by 100°, an angular resolution of 16.7° × 20°, and a broad energy range for both the electrons and ions from tens of eV to above 30 keV, with a 1 s time resolution. The geometric factors of the electron and ion analyzers are 1.1 × 10⁻³ cm2·sr·eV/eV and 1.4 × 10⁻³ cm2·sr·eV/eV, respectively, which fulfills the requirements of the low-energy plasma measurement. The LEPA monitored typical space environment disturbance such as geomagnetic storms and successfully recorded the responses of plasma energy fluxes. Satellite surface charging events were measured, with the highest potentials of −2000 V in the shadow period and −500 V in the nonshadow period.

1. Introduction

Low-energy plasmas play key roles in many physical processes including magnetic reconnection [1] and plasma outflow and escape [2] in solar terrestrial system, and they are closely related to spacecraft charging effects [3,4]. Spacecraft surface charging events can lead to arc discharging between surfaces if the charging potential difference is big enough and cause anomalies and permanent damage to spacecraft subsystems [5,6].
One of the main scientific objectives of plasma instruments for space missions is to obtain the complete 3D velocity distribution functions for both electrons and ions in a wide field of view (FOV) and a broad energy range. In situ plasma measurements have been performed with a variety of plasma instruments in the near-Earth [7,8,9,10,11] and interplanetary space [12,13,14,15].
The FY-4 satellites are China’s second-generation of geosynchronous meteorological satellite series to realize global, multispectral, three-dimensional, and quantitative remote sensing monitoring. FY-4B is the second of the FY-4 satellites aiming at numerical weather forecasts and was launched successfully on 3 June 2021 UTC+8 (http://www.nsmc.org.cn/nsmc/cn/satellite/FY4B.html, accessed on 15 December 2023). On 11 April 2022, the satellite successfully located over the equator at 133° east. It will continue to operate on the geosynchronous orbit where surface charging is one of the most probable causes of environmentally induced anomalies [16] and spacecraft surfaces can be charged by ambient plasmas to tens of kilovolts in extreme conditions such as substorms [17]. The space environment monitoring package (SEMP) is a package of several space particle detectors and provides a unique, in-depth exploration of the Earth’s plasma and field environments. It studies the solar activities, space plasmas, energetic particle radiation, magnetic field activities, and particles’ interactions with the spacecraft.
The low-energy particle analyzer (LEPA) is one of the payloads of the SEMP and its main objective is to determine the three-dimensional velocity distributions of plasma electrons and ions on the satellite’s orbit. To obtain a complete three-dimensional plasma distribution, the instrument consists of two sensors for electron and ion measurements and a shared electronic box. The electron and ion sensors are back-to-back assembled and are integrated into the electronic box to save mass and size. With the electrostatic deflectors and the cylindrically symmetric structure, the instrument provides high-cadence measurements of the electron and ion velocity distributions with a wide field of view (FOV) of 180° by 100°, an angular resolution of 16.7° × 20°, and a broad energy range for both the electrons and ions from tens of eV to above 30 keV, with a 1 s time resolution. The purpose of this paper is to describe in full the ground calibration results, in-flight performance, and the preliminary observation results of LEPA.

2. Instrument Description

The low-energy particle analyzer consists of an ion sensor head, an electron sensor head and a shared electronics box for ions and electrons. Plasma ions and electrons within the FOV range are deflected by the high voltage-biased deflectors into the top hat electrostatic analyzers for energy-per-charge selection. Each sensor has five main components: (1) a deflector system for wide FOV; (2) a top hat electrode; (3) a hemispherical electrostatic analyzer (ESA); (4) a microchannel plate (MCP) detector; and (5) a discrete anode position-sensitive readout. Figure 1a illustrates the schematic diagram of the low-energy particle analyzer and Figure 1b shows a photograph of the instrument. The deflector system consists of two spherical deflectors that enable the 100° coverage of elevation angle via the sweeping high voltages biased on the upper and lower deflectors. Both sensors employ a top hat electrostatic analyzer for energy-per-charge selection and Chevron MCP stacks to amplify the charge pulse signals. Nine discrete position-sensitive anodes are assembled to cover the 180° azimuth range, each providing an azimuth range of 20°.

3. Ground Calibration

The LEPA instrument was calibrated completely at the NSSC (National Space Science Center, Beijing, China) after environmental testing. The ground calibration facility consists of a vacuum chamber with electron and ion sources, Helmholtz coils to null the external fields (more important for electron beam source calibration), and a 3-axis manipulator to expose different portions of the instrument field of view to a particle source. The electron and ion sources provide a parallel electron beam over an area larger than the sensors’ entrance apertures. The beam energy can be adjusted to span the instrument’s response range. The calibration items include the analyzer constant, energy resolution, elevation angle response, azimuth angle response, and geometric factor. A photograph of the calibration system together with the low-energy particle analyzer is shown in Figure 2 and main parameters of the system are listed in Table 1.

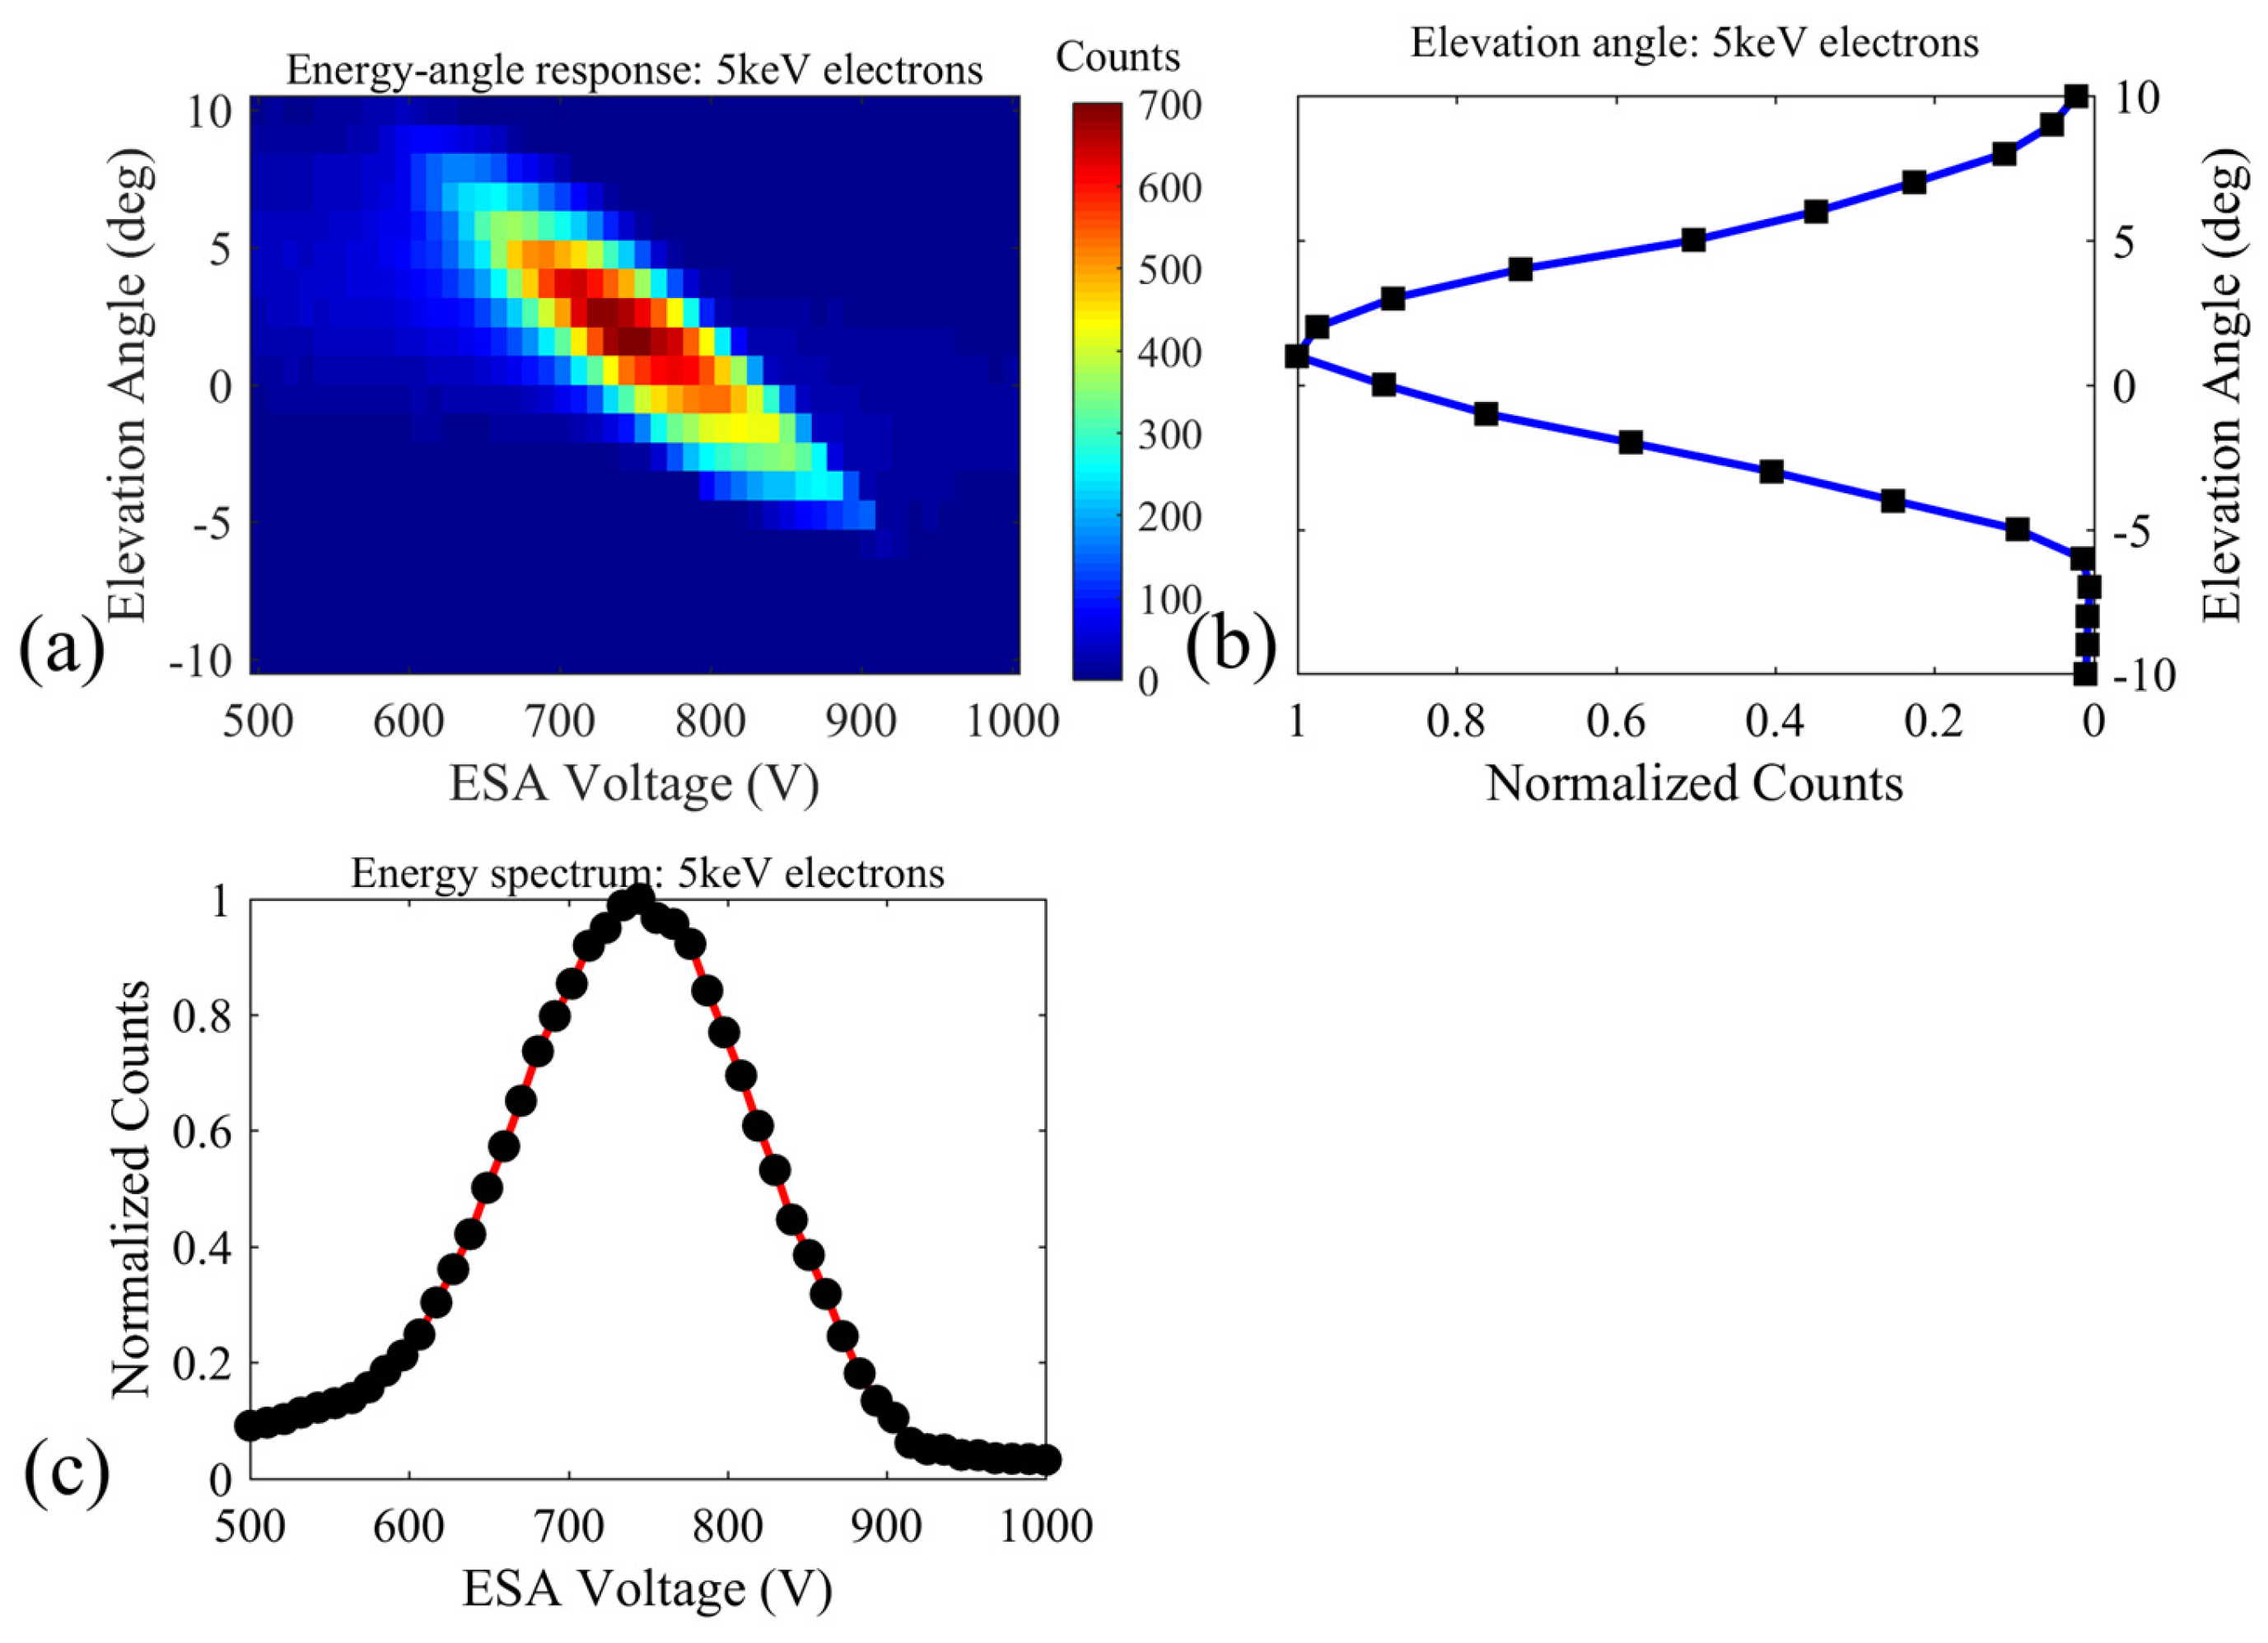
3.1. The Energy Response and Analyzer Constant

The selected E/q of an electron or ion by VESA, the voltage difference between the outer and inner analyzer plates satisfies the relationship:
E / q = k · V E S A
where k is the analyzer constant by which the detecting energy will be determined. The sweeping high voltage of the electrostatic analyzer has 48 logarithmic steps for both electron and ion sensors.
The energy response of electrons and ions was measured at several energies ranging from 1 keV to 30 keV (higher or lower energy response can be obtained by derivation from the linear fitting relation of the analyzer constant).
The analyzer constant is the ratio of the energy-per-charge of the transmitted electrons/ions to the potential difference between the hemispherical analyzer plates. We illustrate here the azimuth channel 5 as an example to show the electron energy–angle response of the LEPA. The beam energy is held constant while the analyzer energy–angle response is measured. Figure 3a shows an example of the electron energy–angle response of the LEPA at a beam energy of 5 keV. The corresponding elevation angle and energy distributions are also displayed in Figure 3b and Figure 3c, respectively. The energy spectrum of electrons is shown in Figure 3a. The peak voltage of the energy distribution, combining the beam energy of 5 keV, gives the electron analyzer constant. Figure 4 illustrates the linear fitting between the electron beam energy and the peak voltage, displaying the calibrating electron energies of 1 keV, 5 keV, 10 keV, 15 keV, and 30 keV. The electron analyzer constant of 6.78 at the azimuth angle channel 5 is derived from the fitting line by its slope.
Analyzer constants at other electron azimuth channels can be calculated by using the same method. In Table 2, the analyzer constants for all the nine electron azimuth channels are summarized. The electron analyzer constants are slightly different from each other mainly because of the design and assembly tolerances of the instrument.
Similarly, the energy–angle response of ions at a beam energy of 5 keV is illustrated in Figure 5a. Corresponding elevation angle and energy distributions are also shown in Figure 5b and Figure 5c, respectively. The ion analyzer constant can be derived to be 6.39 from the linear fitting relation in Figure 6. In Table 3, the analyzer constants for all nine ion azimuth channels are summarized. The ion analyzer constants are slightly different from each other mainly because of the design and assembly tolerances of the instrument.

3.2. The Field of View and Angular Resolution

Electrons or ions from directions within the field of view of the instrument are deflected by the deflecting electric filed, chosen by the electrostatic analyzer and captured by the MCP detectors. The field of view of 100° × 180° is obtained by the elevation sweeping range from −45°to 55° and an azimuth range of 180° for both electron and ion sensors.

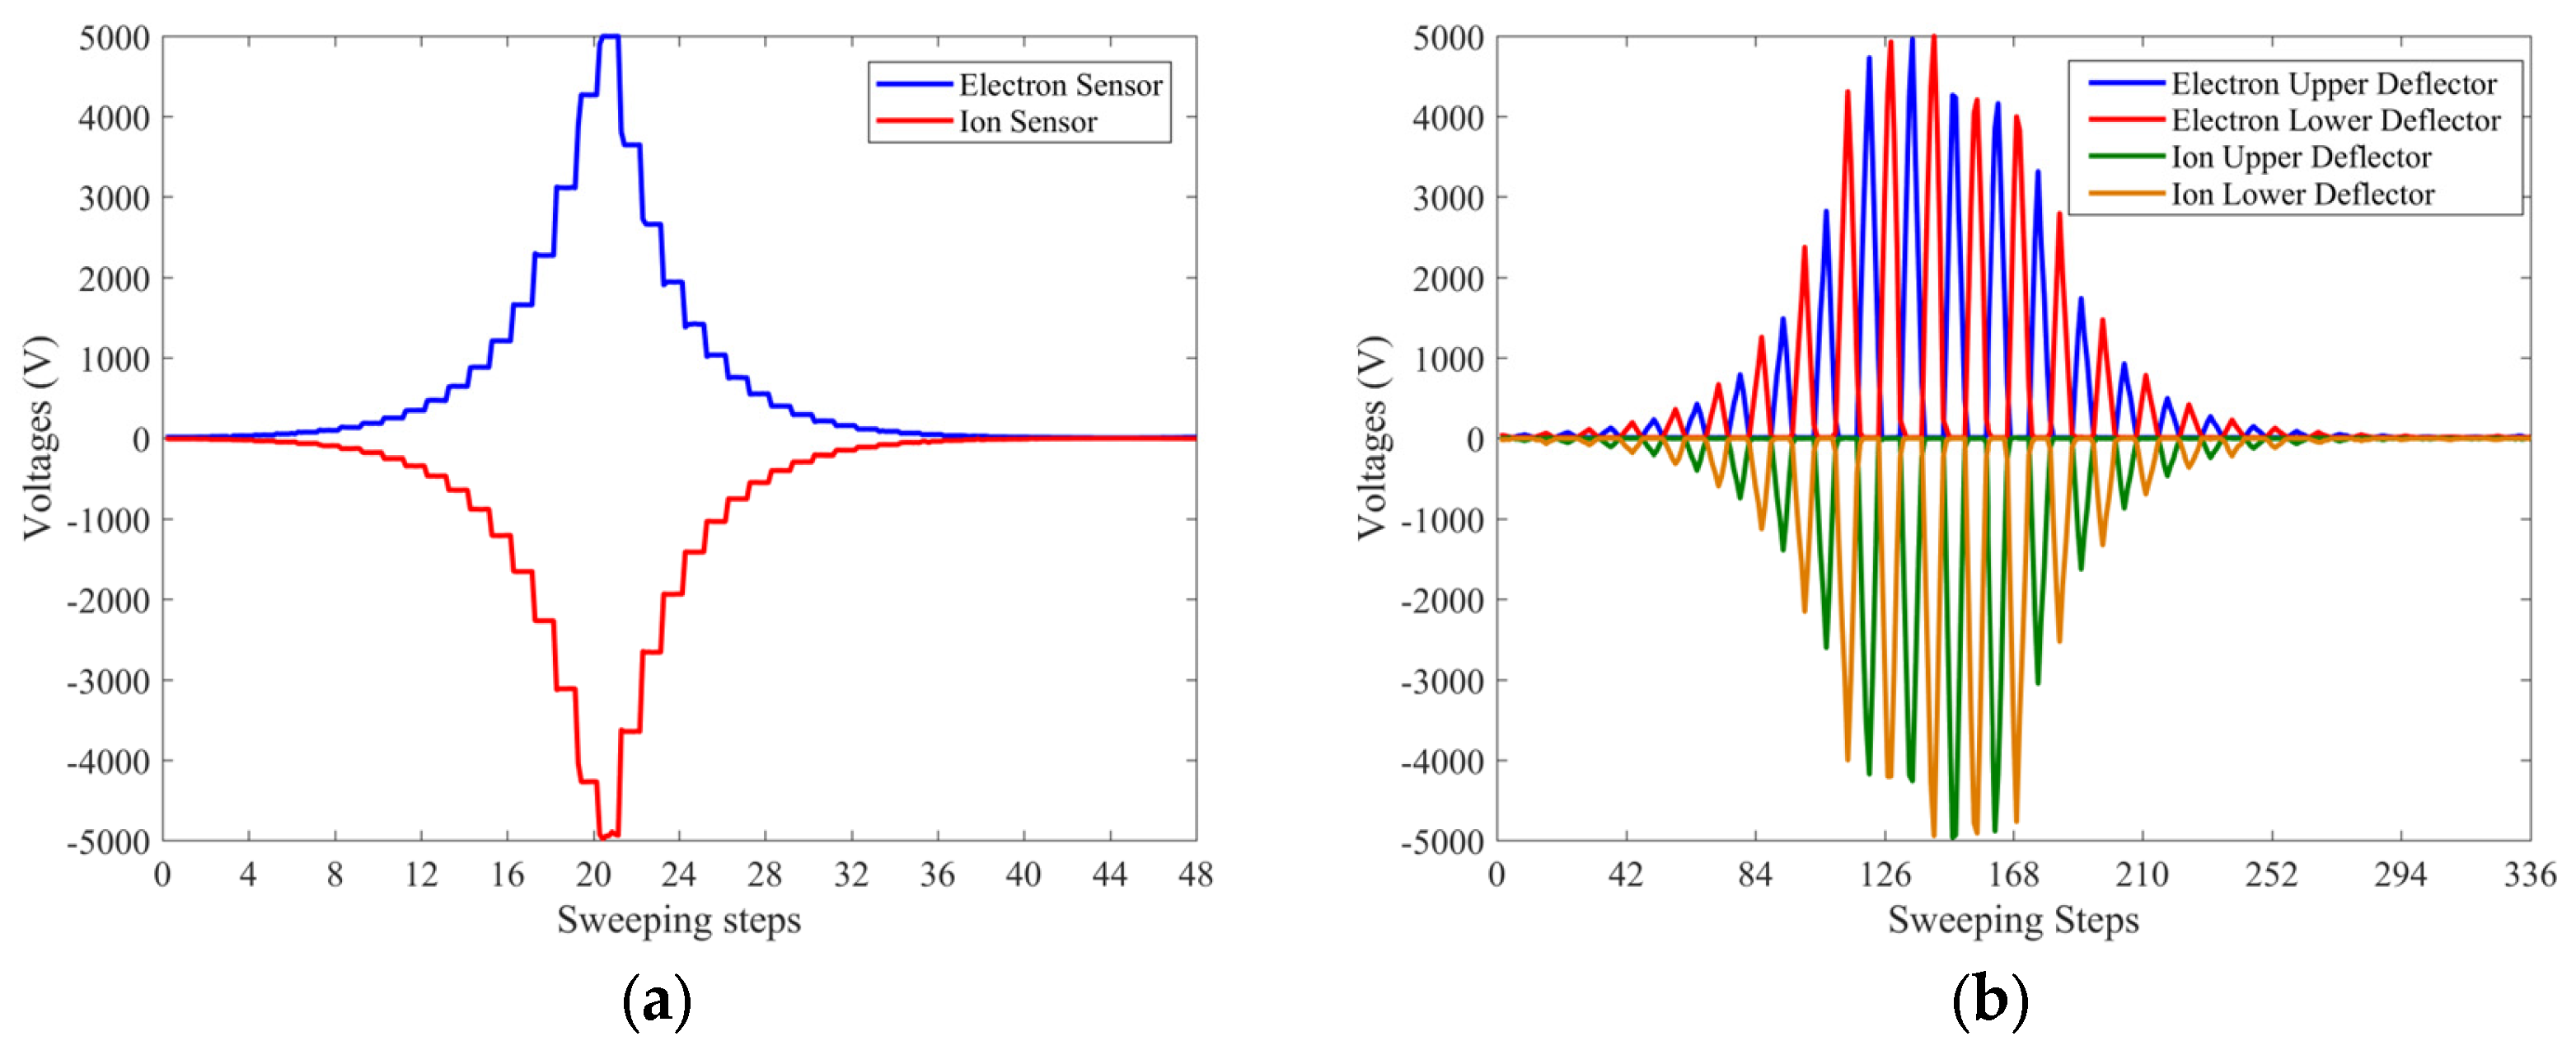
3.2.1. The Elevation Sweeping and Resolution

The wide-FOV analyzer simultaneously detects the energies and directions of incident plasmas on the geosynchronous orbit. Particles from directions covering the FOV of 100° × 180° are deflected into the top hat area and are energy-per-charge (E/q) selected by a voltage scan on the electrostatic analyzer. The incident elevation angles are determined by the deflector voltages and E/q of the incident particles. The deflector factor R is commonly used to determine the elevation angles of incident particles with different energies:
R = V u p V l o w / E / q
where Vup and Vlow are high voltages applied to the upper and lower deflectors, respectively.
The determination of the elevation response of the LEPA instrument utilizes electrons/ions beams with energies of 1 keV, 5 keV, 10 keV, 15 keV, and 30 keV. High voltages are applied to the FOV deflectors to enlarge the elevation FOV. The elevation angle distribution with both deflectors grounded for 5 keV electron beam is illustrated in Figure 3b. The peak angle of the distribution is 1.4° and the full width at half maximum (FWHM) is about 7.5°, which determines the electron elevation angle resolution. When different voltages are applied to the FOV deflectors, the accepting elevation changes. Figure 7 shows the curve fitting line between the electron elevation angle and the deflector factor. A total of nine elevation angles are selected for the elevation angle range from −45° to 55° during the calibration. Elevation angles can be derived by the deflector factor, which is determined by the deflector voltages and the electron beam energies. Similarly, the elevation angle distribution with both deflectors grounded for a 5 keV ion beam is illustrated in Figure 5b. The peak angle of the distribution is 1.0° and the FWHM is about 8.4°. Figure 8 shows the curve fitting line between the ion elevation angle and the deflector factor. For both the electron and ion sensors, the FOV deflectors realize the elevation angle from −45° to 55°.

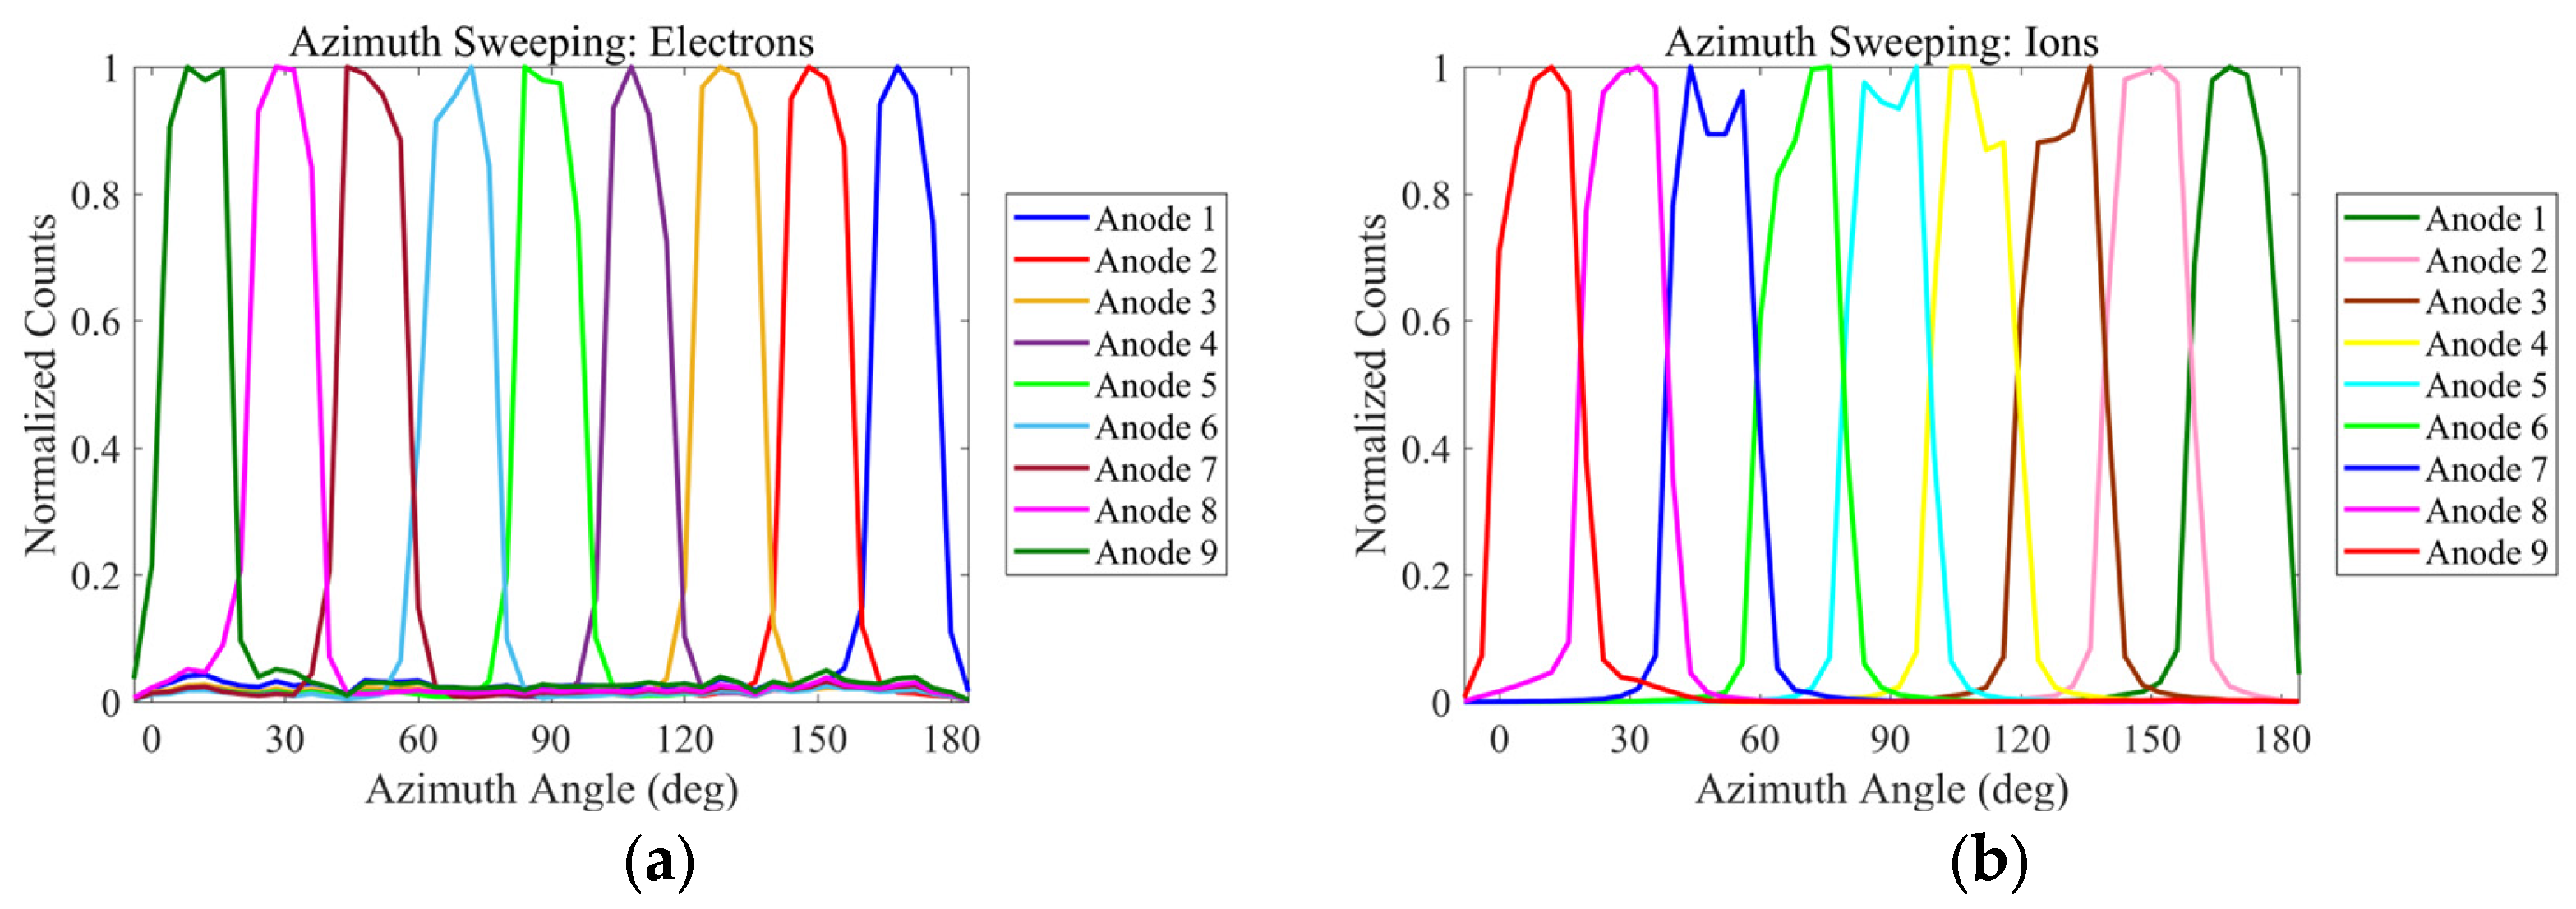
3.2.2. The Azimuth Sweeping and Resolution

The azimuth FOV for both the electron and ion measurements are obtained by the 180° MCPs and anodes divided into 9 sectors, with an azimuth range of 20° for each sector. Figure 9a,b shows the azimuth responses for electrons and ions within the 180° azimuth ranges, with an energy of 5 keV under a fixed elevation angle of 0°. Normal count responses for 9 electron azimuth channels and 9 ion azimuth channels are achieved, with smooth curves labeled in different colors. The calibration results for electrons and ions imply that each anode has a FOV of about 20° (FWHM) on average. Note that count decreases occur at the azimuth angle of 60° and 120° for electrons and ions due to the inside support structure which obstructs part of the azimuth FOV of the instrument.

3.3. The Geometric Factor

The determination of the geometric factor of the instrument is essential for the conversion of counts into plasma moments such as density, velocity, and pressure. It is the integration parameter of all the calibration characteristics described above [18]. The discrete equation of the geometric factor can be expressed by the summation of the energy resolution, azimuth resolution, elevation resolution, and effective area in each single integrated element. For one azimuth channel, the geometric factor is defined as the following formula:
G = Δ α i j k C j k τ · F · Δ θ j · Δ E k E k
where Δα is the azimuth FOV of the azimuth sector, the subscript i denotes the azimuth angle, and j and k denote the sweeping step numbers of elevation angle and energy. Δθj and ΔEk are the passbands of the elevation angle and the energy at the sweeping steps of θj and Ek. Cjk represents ion counts during the accumulating time τ and varies with the energy steps and the elevation angle steps. F is the incident ion flux at the entrance of the instrument.
Figure 3a shows an example energy–elevation angle response for the 5 keV electron beam source at the electron azimuth channel 5, and Figure 5b shows the response for the 5 keV ion beam source at the ion azimuth channel 5. All deflectors of both sensors are grounded. The color map denotes the electron and ion counts in the energy–elevation angle phase space. From the count distributions, the geometric factors for electron and ion measurements are integrated and are 1.1 × 10⁻³ cm2·sr·eV/eV and 1.4 × 10⁻³ cm2·sr·eV/eV, respectively. Figure 10a,b also illustrates the variations in the geometric factor for electron and ion measurements along the elevation angles. For both electron and ion sensors, the geometric factor has a maximum value at 0° and a minimum value at 45°. Figure 10c also illustrates the geometric factor variation for both electrons and ions with azimuth channels at an elevation angle of 0°. The geometric factor varies with a range of 9.83 × 10⁻⁴ cm2·sr·eV/eV~1.1 × 10−3 cm2·sr·eV/eV for electrons and 1.22 × 10⁻³ cm2·sr·eV/eV~1.4 × 10−3 cm2·sr·eV/eV for ions.

3.4. Summary of Calibration Results

Table 4 summarizes the performance of the LEPA instrument for the ground calibration of electron and ion measurements. The instrument can measure electrons with energies from 20.3 eV to 33.9 keV and ions with energies from 19.2 eV to 31.9 keV. Both electron and ion sensors have a FOV of 180° × 100°, within which 9 azimuth angle sectors and 7 elevation angle channels are realized. The geometric factor for the electron measurement is 1.1 × 10⁻³ cm2·sr·eV/eV and is 1.4 × 10⁻³ cm2·sr·eV/eV for the ion measurement, which fulfills the low-flux space plasma electrons and ion detection requirements on the geosynchronous orbit.

4. In-Flight Performance and Preliminary Observational Results

The inner hemispheres for both electron and ion sensors are applied with sweeping voltages. The sweeping voltages vary from +2.8 V to +4997.3 V for the electron sensor and −2.9 V to −4979.7 V for the ion sensor in 48 logarithmically spaced steps, as shown in Figure 11a. For each ESA voltage sweeping step, deflector voltages are also scanned to realize the measuring elevation angle from −45° to 55°. Each ESA and deflector voltage step lasts for 2.9 ms, and the time resolution is 1 s for one complete energy and elevation angle scan. For each ESA step, seven deflector voltages are scanned, which results in 336 deflector voltage steps in the 48 ESA voltage sweeping period. The electronics box shared by both sensors is used to process pulse signals output by the MCP and provide high voltages for the sensor head. It is responsible for supplying power to the sensor electrodes and communicating with external platforms.

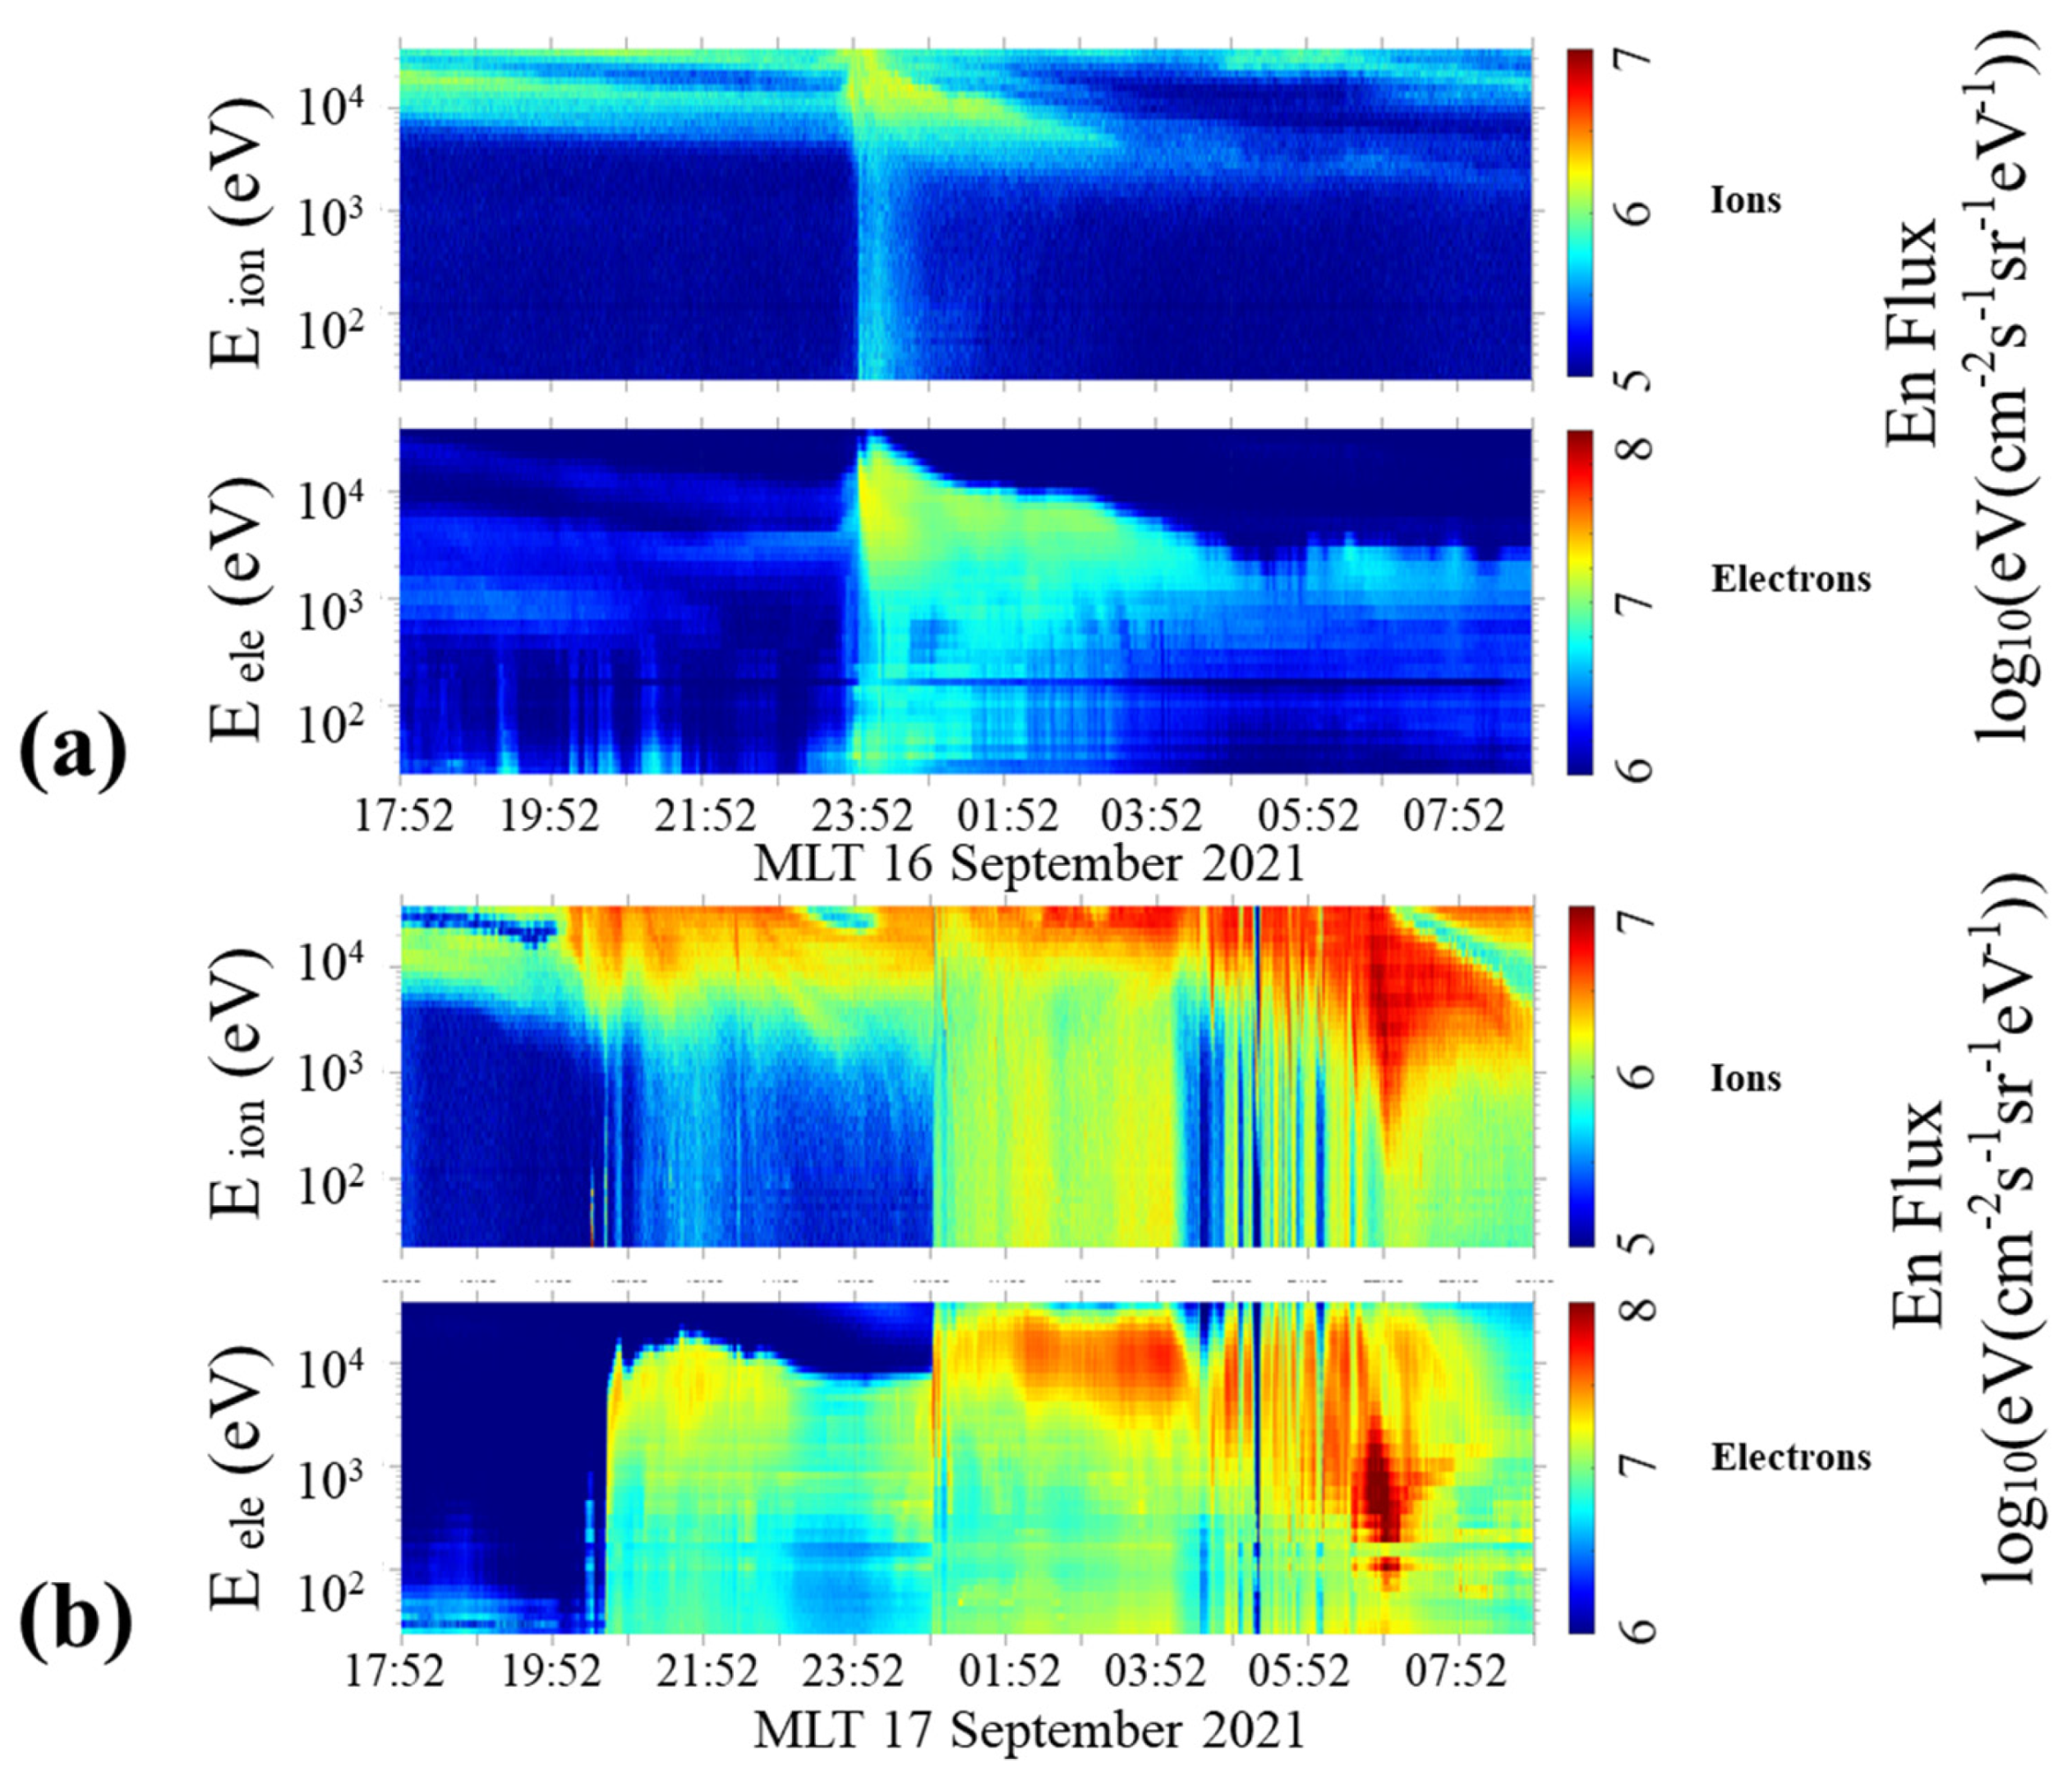
4.1. Space Plasma Environment Measurements

The LEPA instrument can measure an in situ plasma environment on the geosynchronous orbit. The LEPA instrument has a total of 48 energy steps and 63 accepting directions (7 elevation angles × 9 azimuth angles). Figure 12 and Figure 13 illustrate ion and electron energy flux distributions during UTC 13:00~16:00 on 2 December 2021 at all 48 energy steps and 63 measuring directions. The 9 rows and 7 columns represent measurements at the corresponding 9 azimuth angle channels covering 180° and 7 elevation angle channels covering 100°, respectively. The x-axis represents time recorded by the LEPA and y-axis represents the energy measured from about 20 eV to above 30 keV. The figures show that the ion energy flux is about 105~106 eV∙cm−2∙s−1∙sr−1∙eV−1 and the electron energy flux is about 106~107 eV∙cm−2∙s−1∙sr−1∙eV−1, in agreement with the background plasma distribution on the geosynchronous orbit [16,17].
The LEPA instrument also recorded the severe plasma environment disturbances during the geomagnetic storm that occurred on 17 September 2021. Figure 14 plots the Dst index variation from 16 to 20 September 2021 and the maximum decrease around 21:00 on 17 September 2021. Figure 15 shows ion and electron energy flux responses with the magnetic local time (MLT) and energies of the storm; obvious enhancements in the energy spectra can be recognized for both ions and electrons, with the highest energy flux of 107 eV∙cm−2∙s−1∙sr−1∙eV−1 and 108 eV∙cm−2∙s−1∙sr−1∙eV−1, respectively. A sharp onset of electron intensities at >10 keV can be seen during 00:00~06:00 MLT on 18 September 2021 while the Kp index varied in the range of 3~5, which is consistent with the statistical results in [19].

4.2. Satellite Surface Charged Absolute Potential

Another main scientific objective of the LEPA is the satellite surface charged absolute potential measurement. The absolute charged potential can be derived from the measured ion or electron energy spectra. When the satellite is charged to a negative potential, an obvious enhancement in the ion energy spectrum occurs, which indicates that ions at a low energy were accelerated to a higher energy. Typical surface absolute potential charging events on the FY-4B satellite measured by the LEPA are summarized in Table 5. The satellite charged to a high surface absolute potential of −2000 V on 9 September 2021 and 10 October 2021. Other absolute potential charging events also happened on 22 September 2021, 10 October 2021, and 31 October 2021 with the maximum potential of −600 V, −200 V, and −500 V, respectively. If the surface absolute potential reaches −10 kV for example, ions will be accelerated to at least 10 keV. Then, the ion energy spectrum will show an obvious response at >10 keV. These charging potentials resulted in threshold energies in the ion energy flux distributions. Similarly, charging events were also recorded in the past decades from instruments onboard the Applied Technology Satellite 6 [20,21,22] and Los Alamos National Laboratory satellites [23].

5. Conclusions and Discussions

The low-energy particle analyzer (LEPA), an integrated instrument for China’s FY-4B satellite, measures low-energy plasma electrons and ions on the geosynchronous orbit. Both the ion sensor and the electron sensor utilize the top hap electrostatic analyzer to detect low-energy plasmas, with an enlarged field of view of 180° × 100° by the symmetric deflectors. The paper introduced the calibrated specifications, in-flight performance, and preliminary observational results of the LEPA instrument.
The LEPA has total 48 energy steps and 63 measuring directions on the orbit, and all the measuring channels respond well to the space plasma environment. Typical space environment disturbances as geomagnetic storms are monitored, and several satellite surface charging events in their shadow and nonshadow periods are recorded. The preliminary observational results show that the LEPA instrument performed well in measuring space plasmas on the geosynchronous orbit.

Author Contributions

Conceptualization, B.S., A.C., M.L., L.K., A.Z., X.Z. (Xiaoxin Zhang) and W.Z.; methodology, B.S., L.K. and A.Z.; software, W.W., Z.T. and X.Z. (Xiangzhi Zheng); validation, B.S., A.C., M.L. and B.L.; formal analysis, B.S., A.C., M.L., B.L. and X.W.; investigation, B.S. and L.K.; resources, W.W.; data curation, B.S. and B.L.; writing—original draft preparation, B.S.; writing—review and editing, L.K., A.C. and M.L.; visualization, B.S.; supervision, L.K. and A.Z.; project administration, L.K., A.Z., X.Z. and J.W.; funding acquisition, L.K., A.Z., X.Z. and W.Z. All authors have read and agreed to the published version of the manuscript.

Funding

This research was funded by the Chinese National Space Administration (D050103).

Institutional Review Board Statement

Not applicable.

Informed Consent Statement

Not applicable.

Data Availability Statement

The data are not publicly available for the time being due to approval process. The data that support the findings of this study are available from the corresponding author upon reasonable request.

Acknowledgments

The authors want to thank all the LEPA team members for their very dedicated work. The ground calibration data that support this paper are available from the corresponding author upon reasonable request. The Kp index data from 16 September 2021 to 17 September 2021 are taken from the space weather forecast center (http://www.swpc.noaa.gov).

Conflicts of Interest

The authors declare no conflict of interest.

References

  1. André, M.; Vaivads, A.; Khotyaintsev, Y.; Laitinen, T.; Nilsson, H.; Stenberg, G.; Fazakerley, N.; Trotignon, J.G. Magnetic reconnection and cold plasma at the magnetopause. Geophys. Res. Lett. 2010, 37, L22108. [Google Scholar] [CrossRef]
  2. André, M.; Cully, M. Low-energy ions: A previously hidden solar system particle population. Geophys. Res. Lett. 2012, 39, L03101. [Google Scholar] [CrossRef]
  3. Garrett, H.B. The charging of spacecraft surfaces. Rev. Geophys. Space Phys. 1981, 19, 577–616. [Google Scholar] [CrossRef]
  4. Deforest, S.E. Spacecraft charging at synchronous orbit. J. Geophys. Res. 1972, 77, 651–659. [Google Scholar] [CrossRef]
  5. Tibble, A.C. The Space Environment: Implications for Spacecraft Design; Princeton University Press: Princeton, NJ, USA, 1995. [Google Scholar]
  6. Wu, J.G.; Eliasson, L.; Lundstedt, H.; Hilgers, A.; Anderson, L.; Norberg, O. Space environment effects on geostationary spacecraft: Analysis and prediction. Adv. Space Res. 2000, 26, 21–36. [Google Scholar] [CrossRef]
  7. Coates, A.J.; Bowles, J.A.; Gowen, R.A.; Hancock, B.K.; Johnstone, A.D.; Kellock, S.J. The AMPTE UKS three-dimensional ion experiment. IEEE Trans. Geosci. Remote Sens. 1985, 3, 287–292. [Google Scholar] [CrossRef]
  8. Paschmann, G.; Loidl, H.; Obermayer, P.; Ertl, M.; Laborenz, R.; Sckopke, N.; Baumjohann, W.; Carlson, C.W.; Curtis, D.W. The plasma instrument for AMPTE IRM. IEEE Trans. Geosci. Remote Sens. 1985, 3, 262–266. [Google Scholar] [CrossRef]
  9. Rème, H.; Bosqued, J.M.; Sauvaud, J.A.; Cros, A.; Dandouras, J.; Aoustin, C.; Bouyssou, J.; Camus, T.; Cuvilo, J.; Martz, C.; et al. The Cluster Ion Spectrometry (CIS) Experiment. Space Sci. Rev. 1997, 79, 303–350. [Google Scholar] [CrossRef]
  10. Dichter, B.K.; Galica, G.E.; McGarity, J.O.; Tsui, S.; Golightly, M.J.; Lopate, C.; Connell, J.J. Specification, design, and calibration of the Space Weather Suite of Instruments on the NOAA GOES-R program spacecraft. IEEE Trans. Nucl. Sci. 2015, 62, 2776–2783. [Google Scholar] [CrossRef]
  11. Pollock, C.; Moore, T.; Jacques, A.; Burch, J.; Gliese, U.; Saito, Y.; Omoto, T.; Avanov, L.; Barrie, A.; Coffey, V.; et al. Fast Plasma Investigation for Magnetospheric Multiscale. Space Sci. Rev. 2016, 199, 331–406. [Google Scholar] [CrossRef]
  12. Sauvaud, J.A.; Fedorov, A.; Aoustin, C.; Seran, H.C.; Comte, E.L.; Petiot, M. The Mercury Electron Analyzers for the Bepi Colombo mission. Adv. Space Res. 2010, 46, 1139–1148. [Google Scholar] [CrossRef]
  13. Kong, L.G.; Wang, S.J.; Wang, X.Y.; Zhang, A.B.; Zhu, G.W.; Yu, D.J.; Ren, Q.Y.; Reme, H.; Aoustin, C.; Zhang, X.G.; et al. In-flight performance and preliminary observational results of Solar Wind Ion Detectors(SWIDs) on Chang’E-1. Planet. Space Sci. 2012, 62, 23–30. [Google Scholar] [CrossRef]
  14. Kasper, J.C.; Abiad, R.; Austin, G.; Balat-Pithelin, M.; Bale, S.D.; Belcher, J.W.; Berg, P.; Bergner, H.; Berthomier, M.; Bookbinder, J.; et al. Solar Wind Electrons Alphas and Protons (SWEAP) Investigation: Design of the Solar Wind and Coronal Plasma Instrument Suite for Solar Probe Plus. Space Sci. Rev. 2016, 204, 131–186. [Google Scholar] [CrossRef]
  15. McComas, D.J.; Alexander, N.; Allegrini, F.; Bagenal, F.; Beebe, C.; Clark, G.; Crary, F.; Desai, M.I.; De Los Santos, A.; Demkee, D.; et al. The Jovian Auroral Distributions Experiment (JADE) on the Juno Mission to Jupiter. Space Sci. Rev. 2017, 213, 547–643. [Google Scholar] [CrossRef]
  16. Vampola, A.L. Analysis of Environmentally Induced Spacecraft Anomalies. J. Spacecr. Rockets 1994, 31, 154. [Google Scholar] [CrossRef]
  17. Lai, S.T.; Tautz, M. High-level spacecraft charging in eclipse at geosynchronous altitudes: A statistical study. J. Geophys. Res. 2006, 111, A09201. [Google Scholar] [CrossRef]
  18. Wurz, P.; Balogh, A.; Coffey, V.; Dichter, B.K.; Kasprzak, W.T.; Lazarus, A.J.; Lennartsson, W.; McFadden, J.P. Calibration techniques. In Calibration of Particle Instruments in Space Physics; Wüest, M., Evans, D.S., von Steiger, R., Eds.; ESA Communications: Noordwijk, The Netherlands, 2007; pp. 117–276. [Google Scholar]
  19. Fernandes, P.A.; Larsen, B.A.; Thomsen, M.F.; Skoug, R.M.; Reeves, G.D.; Denton, M.H.; Friedel, R.H.W.; Funsten, H.O.; Goldstein, J.; Henderson, M.G.; et al. The plasma environment inside geostationary orbit: A Van Allen Probes HOPE survey. J. Geophys. Res. Space Phys. 2017, 122, 9207–9227. [Google Scholar] [CrossRef]
  20. Olsen, R.C.; McIlwain, C.E.; Whipple, E.C., Jr. Observations of differential charging effects on ATS 6. J. Geophys. Res. 1981, 86, 6809–6819. [Google Scholar] [CrossRef]
  21. Olsen, R.C. A threshold effect for spacecraft charging. J. Geophys. Res. 1983, 88, 493–499. [Google Scholar] [CrossRef]
  22. Olsen, R.C. Record charging events from Applied Technology Satellite 6. J. Spacecr. Rocket. 1987, 24, 362–366. [Google Scholar] [CrossRef]
  23. Ganushkina, N.Y.; Swiger, B.; Dubyagin, S.; Matéo-Vélez, J.-C.; Liemohn, M.W.; Sicard, A.; Payan, D. Worst-case severe environments for surface charging observed at LANL satellites as dependent on solar wind and geomagnetic conditions. Space Weather 2021, 19, e2021SW002732. [Google Scholar] [CrossRef]
Figure 1. Schematic diagram (a) and a photograph (b) of the low-energy particle analyzer.
Atmosphere 14 01834 g001
Figure 2. The low-energy particle analyzer in the calibration system.
Atmosphere 14 01834 g002
Figure 3. (a) Energy–angle response for the electron azimuth channel 5 at a beam energy of 5 keV. (b) Elevation angle distribution for the electron azimuth channel 5 at a beam energy of 5 keV. (c) Energy distribution for the electron azimuth channel 5 at a beam energy of 5 keV.
Atmosphere 14 01834 g003
Figure 4. Linear fitting line between the electron beam energy and the peak ESA voltages. The electron analyzer constant for the azimuth channel 5 is derived from the slope of the fitting line, which is 6.78 from the calibrated electron energies of 1 keV, 5 keV, 10 keV, 15 keV, and 30 keV.
Atmosphere 14 01834 g004
Figure 5. (a) Energy–angle response for the ion azimuth channel 5 at a beam energy of 5 keV. (b) Elevation angle distribution for the ion azimuth channel 5 at a beam energy of 5 keV. (c) Energy distribution for the ion azimuth channel 5 at a beam energy of 5 keV.
Atmosphere 14 01834 g005
Figure 6. Linear fitting line between the ion beam energy and the peak voltage of the Gaussian fitting energy spectrum. The ion analyzer constant for the azimuth channel 5 is derived from the slope of the line, which is 6.39 from calibration ion energies of 1 keV, 5 keV, 10 keV, 15 keV, and 30 keV.
Atmosphere 14 01834 g006
Figure 7. Polynomial fitting line between the peak elevation angle and the electron deflector factor R. In total, nine elevation angles are selected from the elevation angle range between −45° and 55° during the calibration. The elevation angle for a certain incident electron energy is derived from the fitting formula, combining the deflector voltages.
Atmosphere 14 01834 g007
Figure 8. Polynomial fitting line between the peak elevation angle and the ion deflector factor, R. In total, nine elevation angles are selected from the elevation angle range between −45° and 55° during the calibration. The elevation angle for a certain incident ion energy is derived from the fitting formula, combining the deflector voltages.
Atmosphere 14 01834 g008
Figure 9. (a) Azimuth response for the 5 keV electron beam source. The support structure is located at electron azimuth angles of 60° and 120°. (b) Azimuth response for the 5 keV ion beam source. The support structure is located at ion azimuth angles of 60° and 120°.
Atmosphere 14 01834 g009
Figure 10. (a) Electron geometric factor variation with the elevation angle for the electron azimuth channel 5. (b) Ion geometric factor variation with the elevation angle for the ion azimuth channel 5. (c) Geometric factor variation with the azimuth sectors angle at the elevation angle of 0°.
Atmosphere 14 01834 g010
Figure 11. (a) The waveforms of the LEPA’s inner hemisphere sweeping high voltages varied in 48 logarithmically spaced steps. The varied high voltages ranges are +2.8 V to +4997.3 V for the electron sensor and −2.9 V to −4979.7 V for the ion sensor. (b) The waveforms of the LEPA’s FOV deflector sweeping high voltages related to the inner electrode voltages. For each ESA step, seven deflector voltages are scanned, which indicates 336 deflector voltage steps in the 48 ESA voltage sweeping period.
Atmosphere 14 01834 g011
Figure 12. Ion energy differential fluxes during UTC 13:00~16:00 on 2 December 2021 at all 63 measuring directions. The 9 rows and 7 columns represent measurements at the corresponding 9 ion azimuth angle channels and 7 ion elevation angle channels, respectively.
Atmosphere 14 01834 g012
Figure 13. Electron energy differential fluxes during UTC 13:00~16:00 on 2 December 2021 at all 63 measuring directions. The 9 rows and 7 columns represent measurements at the corresponding 9 electron azimuth angle channels and 7 electron elevation angle channels, respectively.
Atmosphere 14 01834 g013
Figure 14. Dst index variation from 16 to 20 September 2021 UTC. The Dst decrease indicates a geomagnetic storm that occurred on 17 September 2021.
Atmosphere 14 01834 g014
Figure 15. The ion and electron energy responses of the LEPA instrument with the magnetic local time (MLT) and energies of the geomagnetic storm on 17 September 2021. From 16 September 2021 (a) to 17 September 2021 (b), obvious enhancements in the energy spectra can be recognized for both ions and electrons, which represent significant plasma disturbances caused by the storm.
Atmosphere 14 01834 g015
Table 1. Main parameters of the calibration system.
ItemsRange or Value
Energy range of beam sources30 eV~30 keV
Energy divergence≤2.0%
Azimuth angle range of the turntable±180°
Elevation angle range of the turntable±90°
Precision for positioning of the turntableTranslation: ≤0.1 mm
Rotation: ≤0.1°
Table 2. Analyzer constants for different electron azimuth channels.
Electron Azimuth ChannelElectron Analyzer Constant
Anode 1 (160~180°)6.77
Anode 2 (140~160°)6.74
Anode 3 (120~140°)6.67
Anode 4 (100~120°)6.60
Anode 5 (80~100°)6.78
Anode 6 (60~80°)6.55
Anode 7 (40~60°)6.59
Anode 8 (20~40°)6.55
Anode 9 (0~20°)6.55
Table 3. Analyzer constants for different ion azimuth channels.
Ion Azimuth ChannelIon Analyzer Constant
Anode 1 (160~180°)6.33
Anode 2 (140~160°)6.06
Anode 3 (120~140°)6.27
Anode 4 (100~120°)6.22
Anode 5 (80~100°)6.39
Anode 6 (60~80°)6.28
Anode 7 (40~60°)6.62
Anode 8 (20~40°)6.54
Anode 9 (0~20°)6.89
Table 4. Performances of the low-energy particle analyzer.
ParametersElectron SensorIon Sensor
Energy range a20.3 eV~33.9 keV19.2 eV~31.9 keV
Energy steps4848
Energy resolution0.190.20
Analyzer constant6.786.39
Elevation angle FOV100°100°
Azimuth angle FOV180°180°
Elevation angle resolution16.7°16.7°
Azimuth angle resolution20°20°
Measuring directions9 × 79 × 7
Geometric factor b1.1 × 10−3 cm2·sr·eV/eV1.4 × 10−3 cm2·sr·eV/eV
Time resolution1 s1 s
a The inner hemisphere voltage varies from ±3 V to ±5000 V. Positive and negative voltages are for electron and ion measurement, respectively. b Geometric factor at the elevation angle of 0° for the azimuth channel 5. Efficiency is included.
Table 5. Typical surface absolute potential charging events measured by LEPA.
PeriodMaximum Charged Potential
9 September 202115:25~16:10−2000 V
22 September 2021 15:10~15:25−600 V
10 October 2021 15:20~15:50−2000 V
10 October 2021 22:00~23:00−200 V
31 October 2021 20:30~23:30−500 V
Disclaimer/Publisher’s Note: The statements, opinions and data contained in all publications are solely those of the individual author(s) and contributor(s) and not of MDPI and/or the editor(s). MDPI and/or the editor(s) disclaim responsibility for any injury to people or property resulting from any ideas, methods, instructions or products referred to in the content.

