

Evaluation of Western North Pacific Typhoon Track Forecasts in Global and Regional Models during the 2021 Typhoon Season
1
Key Laboratory of Meteorological Disaster, Ministry of Education, Joint International Research Laboratory of Climate and Environmental Change, Collaborative Innovation Center on Forecast and Evaluation of Meteorological Disasters, Nanjing University of Information Science and Technology, Nanjing 210044, China
2
Shanghai Typhoon Institute of China Meteorological Administration, Shanghai 200030, China
3
Asia-Pacific Typhoon Collaborative Research Center, Shanghai 200030, China
4
Department of Atmospheric Sciences, SOEST, University of Hawaii at Manoa, Honolulu, HI 96822, USA
*
Author to whom correspondence should be addressed.
Atmosphere 2023, 14(3), 499; https://doi.org/10.3390/atmos14030499
Submission received: 7 February 2023
/
Revised: 24 February 2023
/
Accepted: 2 March 2023
/
Published: 4 March 2023
(This article belongs to the Special Issue Advances in Tropical Cyclone Prediction: Observation, Simulation, and Verification)
Abstract
:The track forecasts of tropical cyclones (TC) in the western North Pacific (WNP) basin during 2021 typhoon season with five global models and four regional models are evaluated here. The results show that the average direct position errors (DPEs) of the global and regional models are approximately 80, 150, 200, 300, and 400 km at 24 h, 48 h, 72 h, 96 h, and 120 h lead-times, respectively. The European Centre for Medium-Range Weather Forecasts Integrated Forecasting System (ECMWF-IFS) achieved the best track forecast performance at each lead among the five global models. Among the four regional models, The China Meteorological Administration Tropical Regional Atmosphere Model for the South China Sea (CMA-TRAMS) attained the smallest DPEs within a 72 h lead, while The Hurricane Weather Research and Forecasting (HWRF) achieved the best track forecast performance at 96 h and 120 h leads. Most of the models produced an obvious westward systematic bias on track forecast from a 24 h to a 120 h lead. Further correlation and cluster analyses indicate that initial TC intensity and size and environmental steering flow can be regarded as good predictors for TC DPEs. TCs with a stronger initial intensity, a bigger initial size, and a larger environmental steering flow in general attain a smaller DPE, and the improvements may go up to 36% at short lead-time.
1. Introduction
TC prediction is a societally important issue, and there is an increasing emphasis on accurate track forecasts [1,2]. Due to improvements in observations, numerical modeling, data assimilation, and forecasting techniques, TC forecasts have improved steadily over the last few decades. Compared to several decades ago, current TC track forecast errors have steadily decreased [3,4,5]. At present, TC track forecasts in the real-time operational forecast centers are primarily from four sources: (1) official subjective guidance, (2) Numerical Weather Prediction (NWP) models, (3) Ensemble Prediction Systems (EPS), and (4) statistical prediction methods (such as multi-model consensus, statistical-dynamical model, etc.) [6,7]. The NWP model can be further subdivided into a coarse-scale global model and a finer-scale regional model.
With the increase of the number of competitive operational NWP models, it becomes a very difficult task for operational meteorologists to judge which track forecast is most reliable. TC forecast verification can thus provide important information on the accuracy and characteristics of a model. Therefore, a series of TC track error analyses have been carried out for global and regional models. For instance, Chen et al. [8] performed a TC forecast error analysis on a new global model that adopted the Geophysical Fluid Dynamics Laboratory (GFDL) nonhydrostatic Finite-Volume Cubed-Sphere Dynamical Core (FV3) and physical parameterizations from the National Centers from Environmental Prediction’s Global Forecast System (NCEP-GFS). For TC track prediction, the new generation FV3 forecasts are substantially better over the northern Atlantic (AL) basin, the northern Pacific (EP), and the western North Pacific (WNP) ocean than the operational NCEP-GFS. It is anticipated that with further improvement of the dynamical core and physical parameterizations, the new generation FV3 model has great potential to become one of the leading operational TC forecasting systems in the world.
Haiden and Richardson [9] noted that after implementing a substantial upgrade of the European Centre for the Medium-Range Weather Forecasts (ECMWF) Integrated Forecasting System (IFS) on 11 May 2021, the TC forecast position error over all ocean basins at day 3 decreased slightly in 2021 compared to the previous year but had not yet reached the lowest level from two years earlier. However, at day 5, position errors had increased. Hodges and Klingaman [10] explored the prediction performance of TCs in WNP in the Met Office (UKMO) global forecasting system from 2008 to 2017, with 1-day to 7-day leads. While TC location forecast errors were significantly reduced with model system upgrades over the period studied (2008–2017), such errors were still higher than those of the ECMWF-IFS for the same period. Goldenberg et al. [11] demonstrated that the Hurricane Weather Research and Forecasting (HWRF) Model had made large improvements since 2012, when a convection-permitting third nest was used with more frequent physics calls. However, operational HWRF track forecasts generally remained inferior to the global model track forecast [12]. Zhang et al. [13] pointed out that there were two limitations for the operational HWRF: firstly, the operational HWRF is storm-centric and has a small outermost domain, and, secondly, the operational HWRF is only able to use one set of high-resolution movable multi-level nests per forecast cycle.
The aforementioned TC evaluation works focused on verifying the accuracy of the TC track forecasts of the individual models. In order to compare the performances from different global and regional models, the Working Group on Numerical Experimentation (WGNE) has conducted the intercomparison studies of TC track forecasts using operational global models since 1991 [1,14,15]. In addition, the Shanghai Typhoon Institute of China Meteorological Administration (STI/CMA) issued post-season TC forecast verification reports on operational official guidance, NWP models, statistical prediction methods, and EPSs for each WNP typhoon season [16].
With the continued updating and improvement of global and regional models, it is necessary for operational meteorologists to understand the latest knowledge of model performance and characteristics to make reliable TC track forecasts and assess potential societal impacts. The objective of the current study is to (1) determine the TC track forecast performance of a number of operational global and regional NWP models during the 2021 WNP typhoon season, (2) identify statistically significant track error trends, and (3) analyze the characteristics of track forecast direct position error (DPE) under different types of environmental features surrounding the TCs as well as different intensity and structure characteristics of the TCs at the initial time.
The remainder of this article is structured as follows. Section 2 provides an overview of TC track forecast data, the best-track datasets, and the verification metrics and methods. Section 3 presents the general performance of TC track forecasts, including mean DPEs and systematic track forecast biases in 2021, and the trends of the models’ DPEs in the past several years. In Section 4, we explore the correlation coefficients between initial TC intensity, size, environmental steering flow, and DPE. We then present a cluster analysis to identify the different DPE distribution characteristics under different categories of initial conditions. Finally, Section 5 provides a summary and discussion.
2. Data and Methods
2.1. Study Area
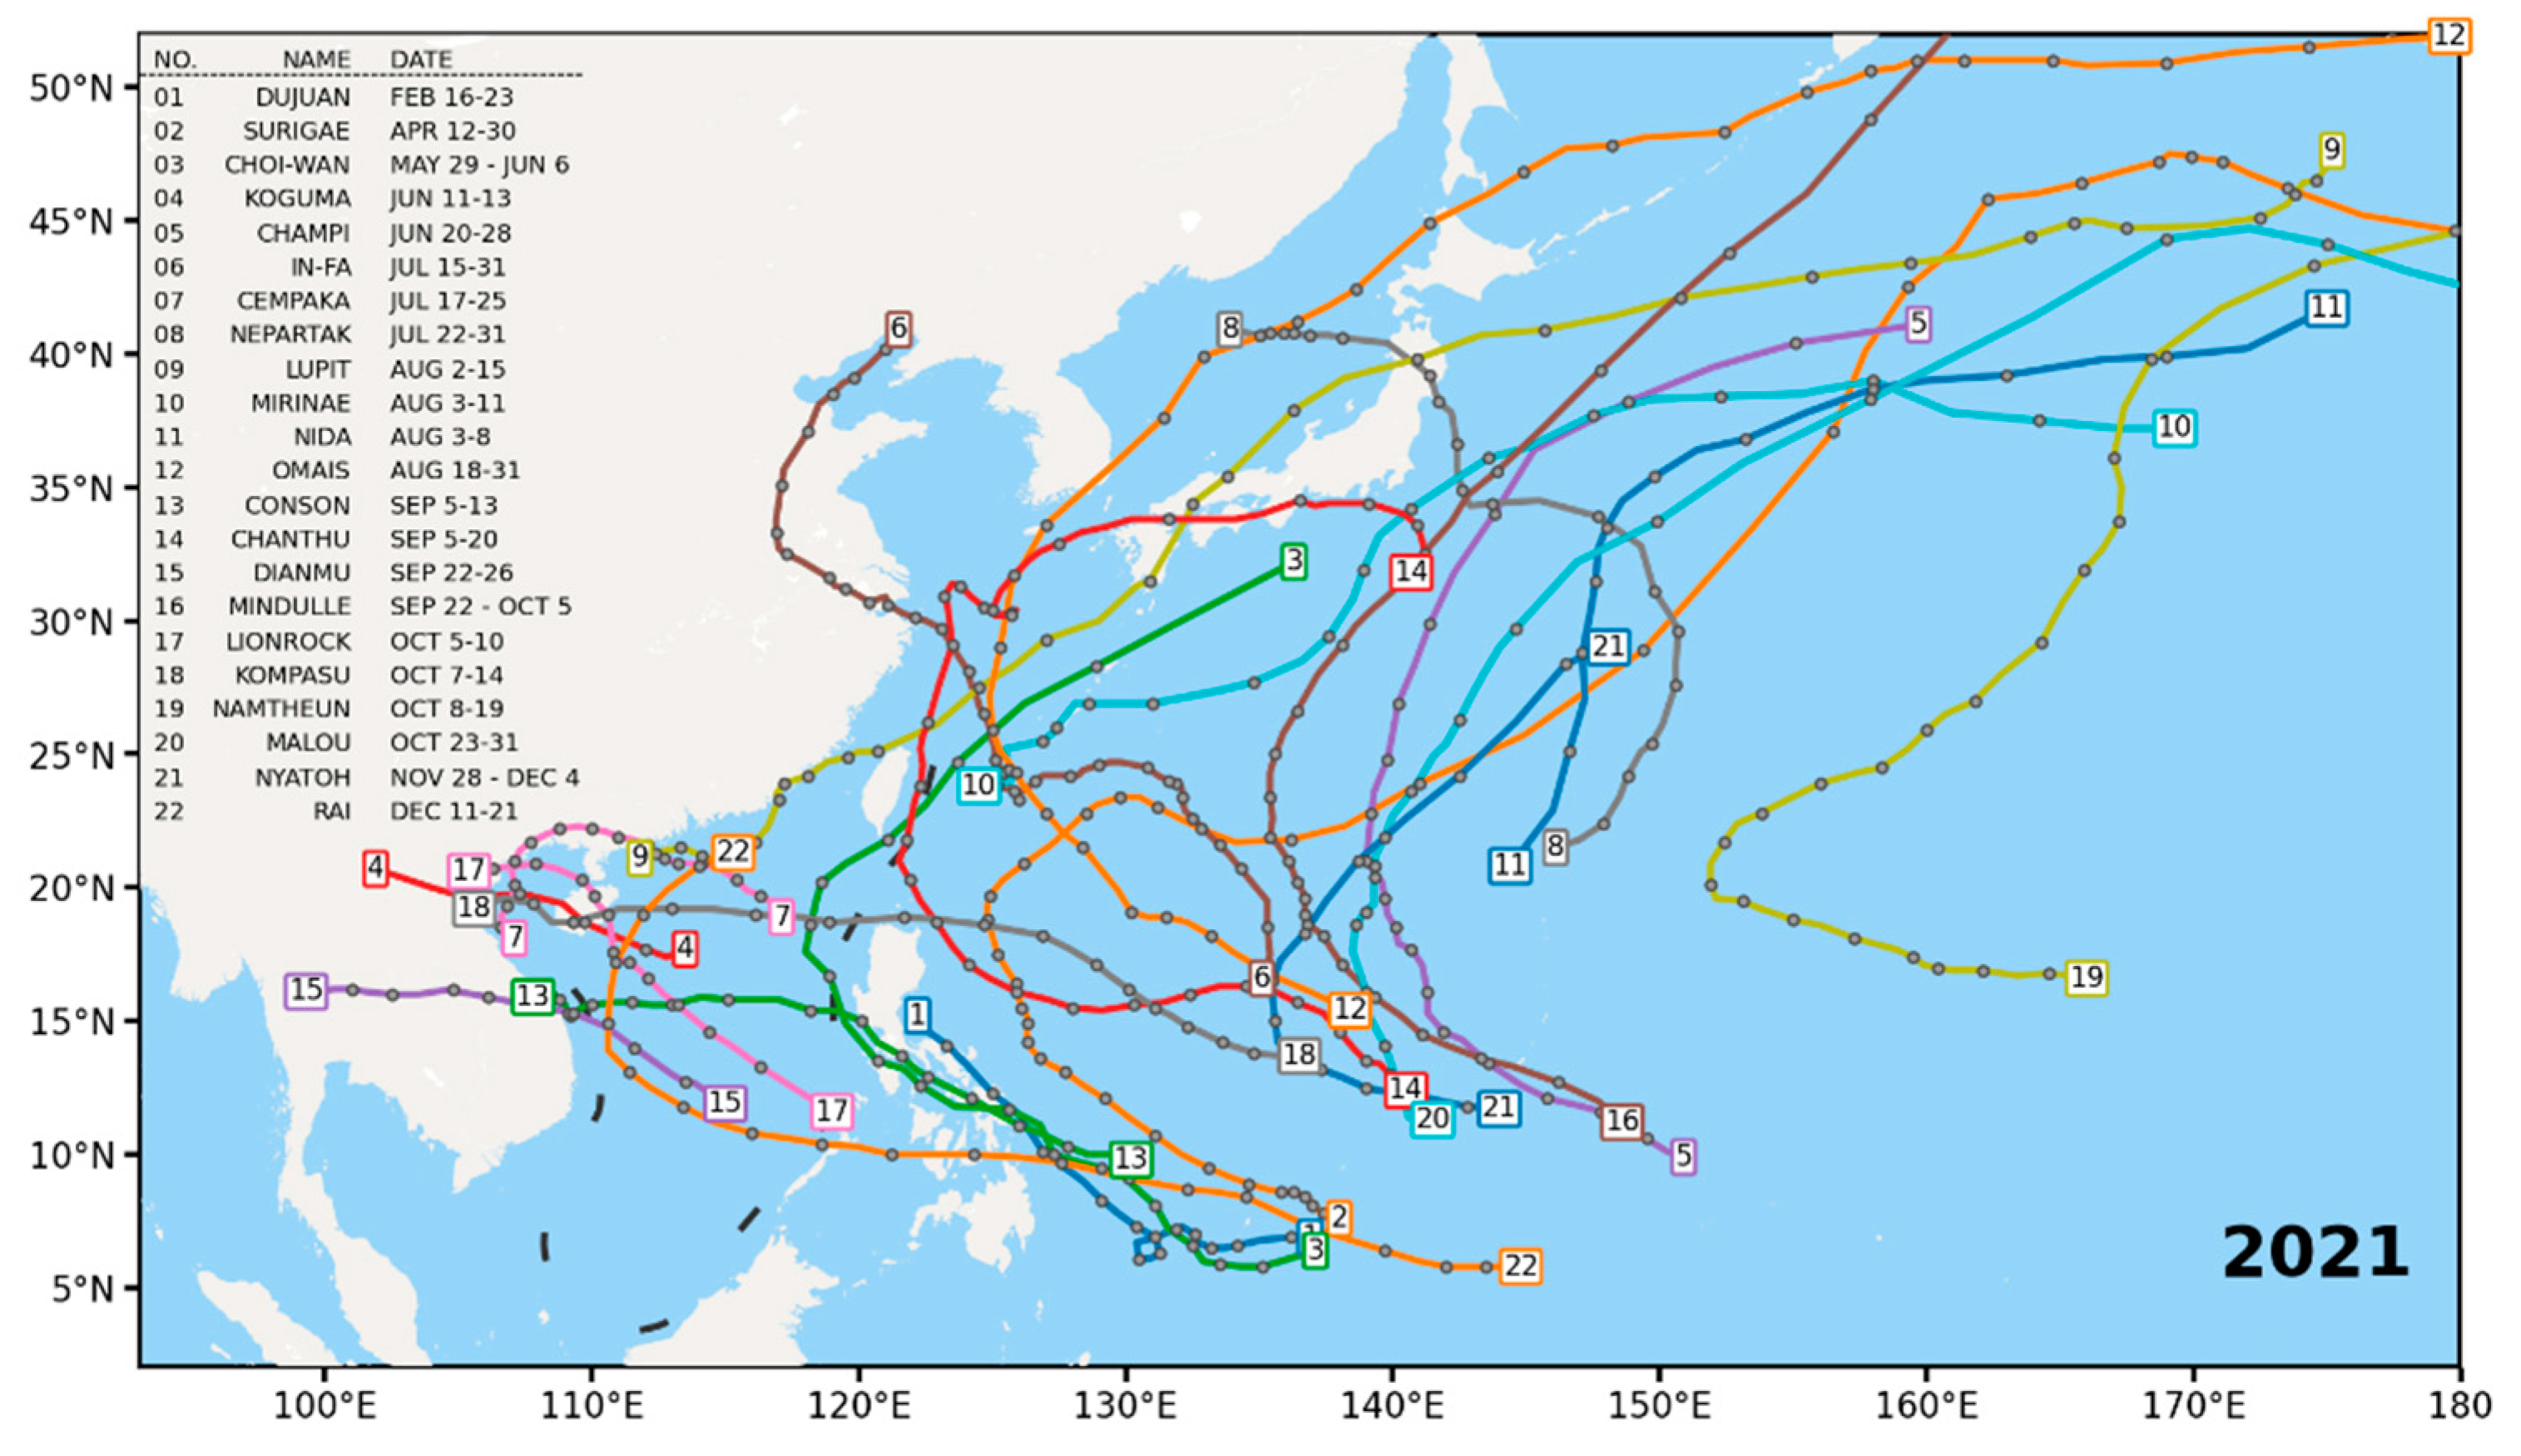
The WNP basin (including the South China Sea) experiences the largest number of tropical cyclones (TCs) among all the TC basins of the world. Overall, twenty-two named TCs formed in the WNP typhoon season of 2021 (Figure 1), which was slightly below the 30-year average (25.2, averaged from 1991 to 2020). Among the twenty-two named TCs, nine of them reached typhoon (TY) intensity, which was also below the climatological mean (13.3). Eight named TCs formed from August to September, which is generally regarded as the peak formation period in the WNP basin. This number was lower than the 30-year average (10.7), mainly due to inactive convection over the WNP ocean [17]. In addition, thirteen of the twenty-two named TCs made landfall in China, the Philippines, Japan, Korea, and Vietnam, leading to various degrees of meteorological disasters in the aforementioned countries.
2.2. Forecast Data
The primary forecast data for this study are the operational TC track forecasts of five global NWP models (ECMWF-IFS, NCEP-GFS, UKMO Unified Model System (UKMO-MetUM), the Japan Meteorological Agency Global Spectral Model (JMA-GSM), and the CMA Global Forecast System (CMA-GFS)), and four regional NWP models (HWRF, CMA Regional Typhoon forecasting Model (CMA-TYM), CMA Tropical Regional Atmosphere Model for the South China Sea (CMA-TRAMS), and Regional TC-forecasting model based on Global/Regional Assimilation and PrEdiction System (GRAPES-TCM)) for the WNP typhoon season of 2021. For the global models, the forecast lead times are 24, 48, 72, 96, and 120 h. Among the four regional models, HWRF and CMA-TYM have the lead times of 24, 48, 72, 96, and 120 h, whereas CMA-TRAMS and GRAPES-TCM only issue the TC forecasts within 72 h (Table 1).
2.3. Best Track Data
For the WNP region, there are four agencies that issue the TC best track data in terms of TC intensity, position, wind radii, and extratropical transition time. These agencies are the Regional Specialized Meteorological Center of Tokyo (RSMC-Tokyo), the Joint Typhoon Warning Center (JTWC) of the United States of America, the STI/CMA, and the Hong Kong Observatory (HKO) of China. The TC position and intensity information usually differ among the best-track datasets [18,19] due to the different techniques used to estimate the position and the intensity of TCs. Therefore, differences in TC track and intensity forecast verification performance may vary, depending on which best-track dataset is used as the reference [17,20].
To verify the TC track forecast datasets from both the global and the regional models, the TC best track dataset from RSMC-Tokyo is chosen as the verification work reference in this study, as RSMC-Tokyo is the selected regional center that issues specialized activities in WNP TC forecast within the framework of the World Weather Watch Program (WWRP) of the World Meteorological Organization (WMO).
2.4. Verification Metric and Methods
The DPE (in km) is the verification metric used in this study for the analysis of the global and regional model track forecast performance. DPE is defined as the great-circle distance between the best track and forecasted positions, and was used by Neumann and Pelissier [21] and Peng and Fei et al. [7]:
where and represent the longitude and latitude of the observed (denoted by subscript b) and forecasted (denoted by subscript f) TC center position, respectively. Number 6371 (unit: km) denotes the earth’s radius.
To demonstrate the track forecast performances of the global and regional models, their DPE will be examined, with the use of a number of common verification methods––specifically, the mean DPE, systematic track forecast bias.
3. General Performance of TC Track Forecasts
3.1. Mean DPE
The annual mean DPSs and sample sizes at the forecast lead times at 24, 48, 72, 96, and 120 h for both the global and regional models over the WNP in 2021 are displayed in Table 2. In general, the mean DPEs for most of these models at the lead times of 24, 48, 72, 96, and 120 h are approximately 80, 150, 200, 300, and 400 km, respectively. For all the forecast lead times, the DPEs of ECMWF-IFS are the smallest among the five global models. For the forecast lead times at 24, 48, 96, and 120 h, the DPEs of NCEP-GFS are the second smallest. UKMO-MetUM has the second smallest DPE at the forecast lead time at 72 h.
Among the four regional models, CMA-TRAMS has the smallest DPEs at the forecast lead times of 24, 48, and 72 h. However, for the forecast lead times at 96 h and 120 h, the DPEs of HWRF are 293.7 and 311.6 km, which are the smallest among the regional models.
3.2. Trend of Mean DPEs
The time series of the annual mean DPEs from the five global models and four regional models at the forecast lead times of 24, 48, and 72 h are shown in Figure 2. Note that the historical forecast data collected from these models do not have same length. For example, the forecast data of JMA-GSM and GRAPES-TCM are longest, covering the period from 2007 to 2021. They are followed by NCEP-GFS, ECMWF-IFS, and CMA-TRAMS, which covers the period of 2010–2021. UKMO-MetUM has a forecast period of 2011–2021. For the CMA-TYM and HWRF, the length of their forecast data are only five years (2017–2021) in this study. The CMA-GFS released its forecast results formally in 2021. Thus, it is excluded from the current trend analysis.
As seen from Figure 2, the minimum mean DPEs of the TC tracks over the WNP for the global and regional models at 24, 48, and 72 h around 2015 reached approximately 60, 100, and 150 km, respectively. For most of the global and regional models, the TC track forecast performances were stable from 2015 to 2020. However, compared with the previous 3 or 4 years, the DPEs in 2021 were higher for almost all of the models. The result above is consistent with the error trend characteristics of TC track forecasts issued by official operational centers over WNP from 2007 to 2021 [17].
A linear regression for the time series of the mean DPEs indicates that the trends of the DPEs for all five global models are negative within a 72 h lead (Figure 2a–c). For the lead times at 24 and 48 h, the year-to-year error reductions (ERs) of the DPEs for UKMO-MetUM are −4.7 and −6.7 km, respectively, which are the largest reductions among all the global models (Table 3). JMA-GSM has the largest ER (−9.9 km) among the global models at a 72 h lead. For the regional models (Figure 2d–f), GRAPES-TCM and CMA-TRAMS have the negative ERs within the lead time of 72 h since 2007 and 2010, respectively. However, the ERs are positive for CMA-TYM and HWRF during 2017–2021.
It should be noted that, for the ECMWF-IFS, the linear trend at a 24 h lead does not pass the F test at the 90% confidence level (Table 3). This means that the ECMWF-IFS’s 24 h TC track forecast did not improve significantly from 2010 to 2021. It is worth mentioning that the mean DPE at 24 h lead for ECMWF-IFS already reached 70 km in 2010. Furthermore, the general TC track forecast performance of ECMWF-IFS was stable at a 24 h lead. A maximum DPE at a 24 h lead is 82 km in 2012, whereas a minimum DPE of 56.2 km occurred in 2016. Therefore, although the ER for ECMWF-IFS at 24 h lead is only −1.0 km and is not statistically significant, ECMWF-IFS still shows the best comprehensive track forecast capability compared to other global or regional models during the past 10 years.
3.3. Systematic Track Forecast Bias
Figure 3 shows the annual average TC forecast positions relative to the observed position at each lead time for all of the global (Figure 3a) and regional (Figure 3b) models. The objective of Figure 3 is to show the forecasted mean distribution characteristic of the displacement errors of a given model at different lead times. Through Figure 3, one can reveal the systematic TC track forecast bias for individual models.
For NCEP-GFS in 2021, the forecasted TC positions shift to southwest within a 120 h lead. However, the values of the relative position bias are less than 100 km from a 24 to a 120 h lead (Figure 3a). The average relative position bias for NCEP-GFS is only 82.8 km at a 120 h lead, which is three times smaller than its mean DPE at the corresponding forecast lead in 2021. For JMA-GSM, the forecasted TC positions shift to the west within a 72 h lead with the relative position bias being less than 70 km. The model forecasted TC positions shift west-northwestward at 96 h and 120 h leads. The characteristics of the systematic track forecast bias for ECMWF-IFS within a 72 h lead resemble those of JMA-GSM. However, the TC positions forecasted by ECMWF-IFS at 96 h and 120 h leads shift west-southwestward. For CMA-GFS, the position bias shifts to the west within a 48 h lead, and then it gradually turns toward the west-southwest at 72 h and 96 h leads and the southwest at a 120 h lead. The systematic track forecast bias of UKMO-MetUM shifts west-southwestward from a 24 to a 120 h lead. With the increase in forecast lead time, the model position bias also becomes larger. The systematic track forecast bias is 325.6 km at 120 h lead for UKMO-MetUM, which is the largest among all the global models.
Each regional model shows its own respective characteristic of the systematic track forecast bias. For CMA-TYM, the direction of the systematic track forecast bias spreads steadily west-northwestward within a 96 h lead, and then turns west-southwestward at a 120 h lead. The position bias of this model reaches about 100 km at a 96 h lead, but becomes 51 km at a 120 h lead. CMA-TRAMS and HWRF, on the other hand, have northward systematic track forecast biases at a 24 h lead, and change to northwestward biases at a 48 h lead and west-northwestward biases at a 72 h lead. HWRF shifts its systematic position bias southwestward at a 96 h lead and east-northeastward at a 120 h lead. GRAPES-TCM has a steady systematic position bias in the same direction for all the leads, whereas the values of the position bias are 53.4, 110.8 and 177.4 km at 24, 48, and 72 h leads, respectively.
The relative position error result for all the global models (Figure 3a) shows clearly an overall westward systematic track forecast bias in 2021. Furthermore, compared with the previous two years, the systematic biases of global models in 2021 are much bigger than those in 2019 and 2020 (Figure 3a,c,e). Meanwhile, the majority of the regional models have a systematic track forecast bias similar to the global models, except for HWRF, which has the characteristic of an eastward systematic position bias at a 120 h lead (Figure 3b). The overall characteristic of systematic biases for regional models in 2021 is similar to it in 2019 (Figure 3f).
4. Cluster Analysis of DPEs
In this section, DPEs of the global and regional models are further analyzed. The DPEs are binned according to various characteristics of TC initial intensity and size as well as its environmental conditions such as environmental steering flow.
4.1. Initial TC Intensity
The correlation coefficients are computed between initial TC minimum sea level pressure (MSLP, use to indicate TC intensity) and DPE. It should be noted that a higher initial TC MSLP represents a weaker TC. The statistical results show that all the global and regional models have positive correlations from a 24 h to a 120 h lead (Figure 4). This implies that models with a higher initial TC MSLP in general have a larger DPE for each lead time, and vice versa. For the global models (Figure 4a), the highest positive correlation is 0.481, which is obtained from ECMWF-IFS at a 120 h lead. The smallest correlation coefficients occur at a 72 h lead on most of the global models, with the average value of 0.162. At 24 h and 120 h leads, four out of five global models (UKMO-MetUM, NCEP-GFS, JMA-GSM, and ECMWF-IFS) have significant positive correlations at the 95% confidence level between the DPE and the initial TC MSLP. The percentages of the significant positive correlation reduce to two-fifths and one-fifth at 48 h and 96 h leads, respectively. At a 72 h lead, the correlations for all five global models do not pass the significance test. For the regional models (Figure 4b), most of these models reach the highest correlation coefficients at a 24 h lead, except for CMA-TRAMS, and all these models pass the t-test at the 95% confidence level at this lead. With the lead time increasing, the corresponding correlation coefficients decrease till 96 h, and then increase again at 120 h.
According to the correlation analysis result above, all the DPEs of both the global and regional models are binned into two groups, with the first group consisting of initial TC intensity weaker than “typhoon” (TY) and the second group consisting of initial TC intensity equal or stronger than TY. The standard for a TC to reach the TY intensity is when the TC reaches a maximum sustained surface wind speed of 32.6 m·s−1 [22]. The two groups are labeled by “weak TC” and “strong TC”, respectively. The mean DPEs and standard deviations (SDs) of the two groups are calculated at different leads (from 24 to 120 h) for each of the global and regional models. The cluster analysis results indicate that both the mean DPEs and the SDs of strong TCs are smaller than weak TCs for each model across all lead times (Figure 5). For the global models, the maximum differences of the DPEs between the “weak TC” group and the “strong TC” group are 28.3 (UKMO-MetUM, Figure 5d), 49.0 (NCEP-GFS, Figure 5c), 39.0 (CMA-GFS, Figure 5e), 48.5 (NCEP-GFS, Figure 5c), and 90.3 km (CMA-GFS, Figure 5e), while the minimum differences of the DPEs are 14.3 (ECMWF-IFS, Figure 5a), 15.1 (JMA-GSM, Figure 5b), 10.7 (UKMO-MetUM, Figure 5d), 21.1 (ECMWF-IFS, Figure 5a), and 56.9 km (UKMO-MetUM, Figure 5d) at 24, 48, 72, 96, and 120 h leads, respectively. For the regional models, the maximum differences of the DPEs between the “weak TC” group and the “strong TC” group are 47.3 (GRAPES-TCM, Figure 5g), 29.1 (CMA-TYM, Figure 5f), 28.1 (CMA-TRAMS, Figure 5h), 16.0 (HWRF, Figure 5i), and 29.9 km (HWRF, Figure 5i), while the minimum differences of the DPEs are 13.1 (CMA-TRAMS, Figure 5h), 21.5 (GRAPES-TCM, Figure 5g), 15.5 (GRAPES-TCM, Figure 5g), 8.7 (CMA-TYM, Figure 5f), and 16.6 km (CMA-TYM, Figure 5f) at 24, 48, 72, 96, and 120 h leads, respectively. Overall, the differences above are consistent with Figure 4, indicating that the models with higher correlation coefficients between the initial TC intensity and DPEs tend to have larger differences between the “weak” and “strong” TC group.
4.2. Initial TC Size
Correlation analyses between forecast DPEs and initial TC size are carried out to examine the potential influence of initial TC size on models’ track forecast capability. The TC size is determined based on Knaff and Zehr [23]. In their paper, a modified rankine vortex was used to estimate the TC size:
where is the climatological tangential wind 500 km from the TC center, x is the shape factor, is the intensity in knots, and is the radius of maximum winds in kilometers.
In the current study, the TC size is computed from the National Centers for Environmental Prediction-Global Final Analysis (NCEP-FNL) data that has a 1° × 1° grid resolution (https://rda.ucar.edu/datasets/ds083.2/ accessed on 12 November 2022, NCEP/NOAA 2000) [24].
As shown in Figure 6, the overall trends of correlation coefficients between the DPE and initial TC size for most of the global and regional models are increasing from a 24 to a 120 h lead. However, the peaks of the correlation coefficients occur at 72 h, 96 h, and 96 h leads for ECMWF-IFS, JMA-GSM, and HWRF, respectively. For all of the global and regional models, the correlation coefficients are negative at 24 h and 48 h leads, which implies that within a 48 h lead, cyclones with a bigger initial size have a smaller track forecast error, and vice versa. At a 72 h lead, the correlations in ECMWF-IFS, GRAPES-TCM, and CMA-TRAMS have shifted from a negative to a positive value. At 96 h and 120 h leads, most of the global and regional models (except for JMA-GSM) possess a positive correlation (Figure 6a). This points out that at the longer leads, a larger track error is generated when initial TC size is larger.
It is worth mentioning that the aforementioned correlations at a 24 h lead in two global models (ECMWF-IFS and NCEP-GFS) and three regional models (CMA-TRAMS, GRAPES-TCM, and HWRF) pass the 95% confidence level interval (Figure 6). At a 48 h lead, only CMA-TRAMS pass the significance test. At 72 h and 96 h leads, all the models hardly pass the significance test. NCEP-GFS passes the 95% confidence level at a 120 h lead. The associated correlation coefficient is 0.31, the highest among all the models.
A cluster analysis is further carried out by separating initial TC size into a “small TC” and a “big TC” group. Our calculation shows that the mean TC size parameter is 0.83 for the 2021 WNP typhoon season. Therefore, the “small TC” (“big TC”) group contains TC cases whose initial size parameter is smaller (larger) than 0.83. As shown in Figure 7, a distinctive characteristic is that the “big TC” group has a better track forecast at 24 h and 48 h leads, because both the mean DPEs and the SDs are smaller in the “big TC” group than in the “small TC” group. The result is consistent among all the global and regional models. From a 72 h lead, the relationship starts to alter. At a 72 h lead, whereas most of the models still have smaller DPEs and SDs in the “big TC” group, it becomes opposite for ECMWF-IFS and GRAPES-TCM. At 96 h and 120 h leads, the track forecast performance of the “small TC” group surpasses the “big TC” group for most of the models, except for JMA-GSM at a 120 h lead.
4.3. Environmental Steering Flow
Chan and Gray [25] investigated the relationship between TC movement and the mid-tropospheric flow (500–700 hPa) averaged in a 5–7° annulus from the TC center. They found that mid-tropospheric flow has the best correlation with TC motion. In this study, we calculated the environmental steering flow for each TC case by taking a simple arithmetic average of the winds at 700, 650, 600, 550, and 500 hPa over a 5–7° annulus around the observed TC centers. The data used for the calculation are from NCEP-FNL. The correlation coefficients between the values of environmental steering flow and the DPEs were further calculated for each model.
As shown in Figure 8, both the global and regional models have nearly all negative correlation coefficients from a 24 h to a 120 h lead, except for ECMWF-IFS and CMA-GFS at a 120 h lead. The correlation coefficient values are ranged from −0.86 to −0.68, from −0.74 to −0.51, from −0.55 to −0.32, from −0.40 to −0.04, and from −0.27 to 0.09 at 24 h, 48 h, 72 h, 96 h, and 120 h, respectively. Interestingly, the correlations for all the models pass the 95% confidence level within a 72 h lead. This indicates that at the early forecast stages (i.e., within 72 h), TC track forecast skill for all the global and regional models depends significantly on environmental steering flow. A smaller DPE is acquired when a TC is located in a relatively strong steering flow environment.
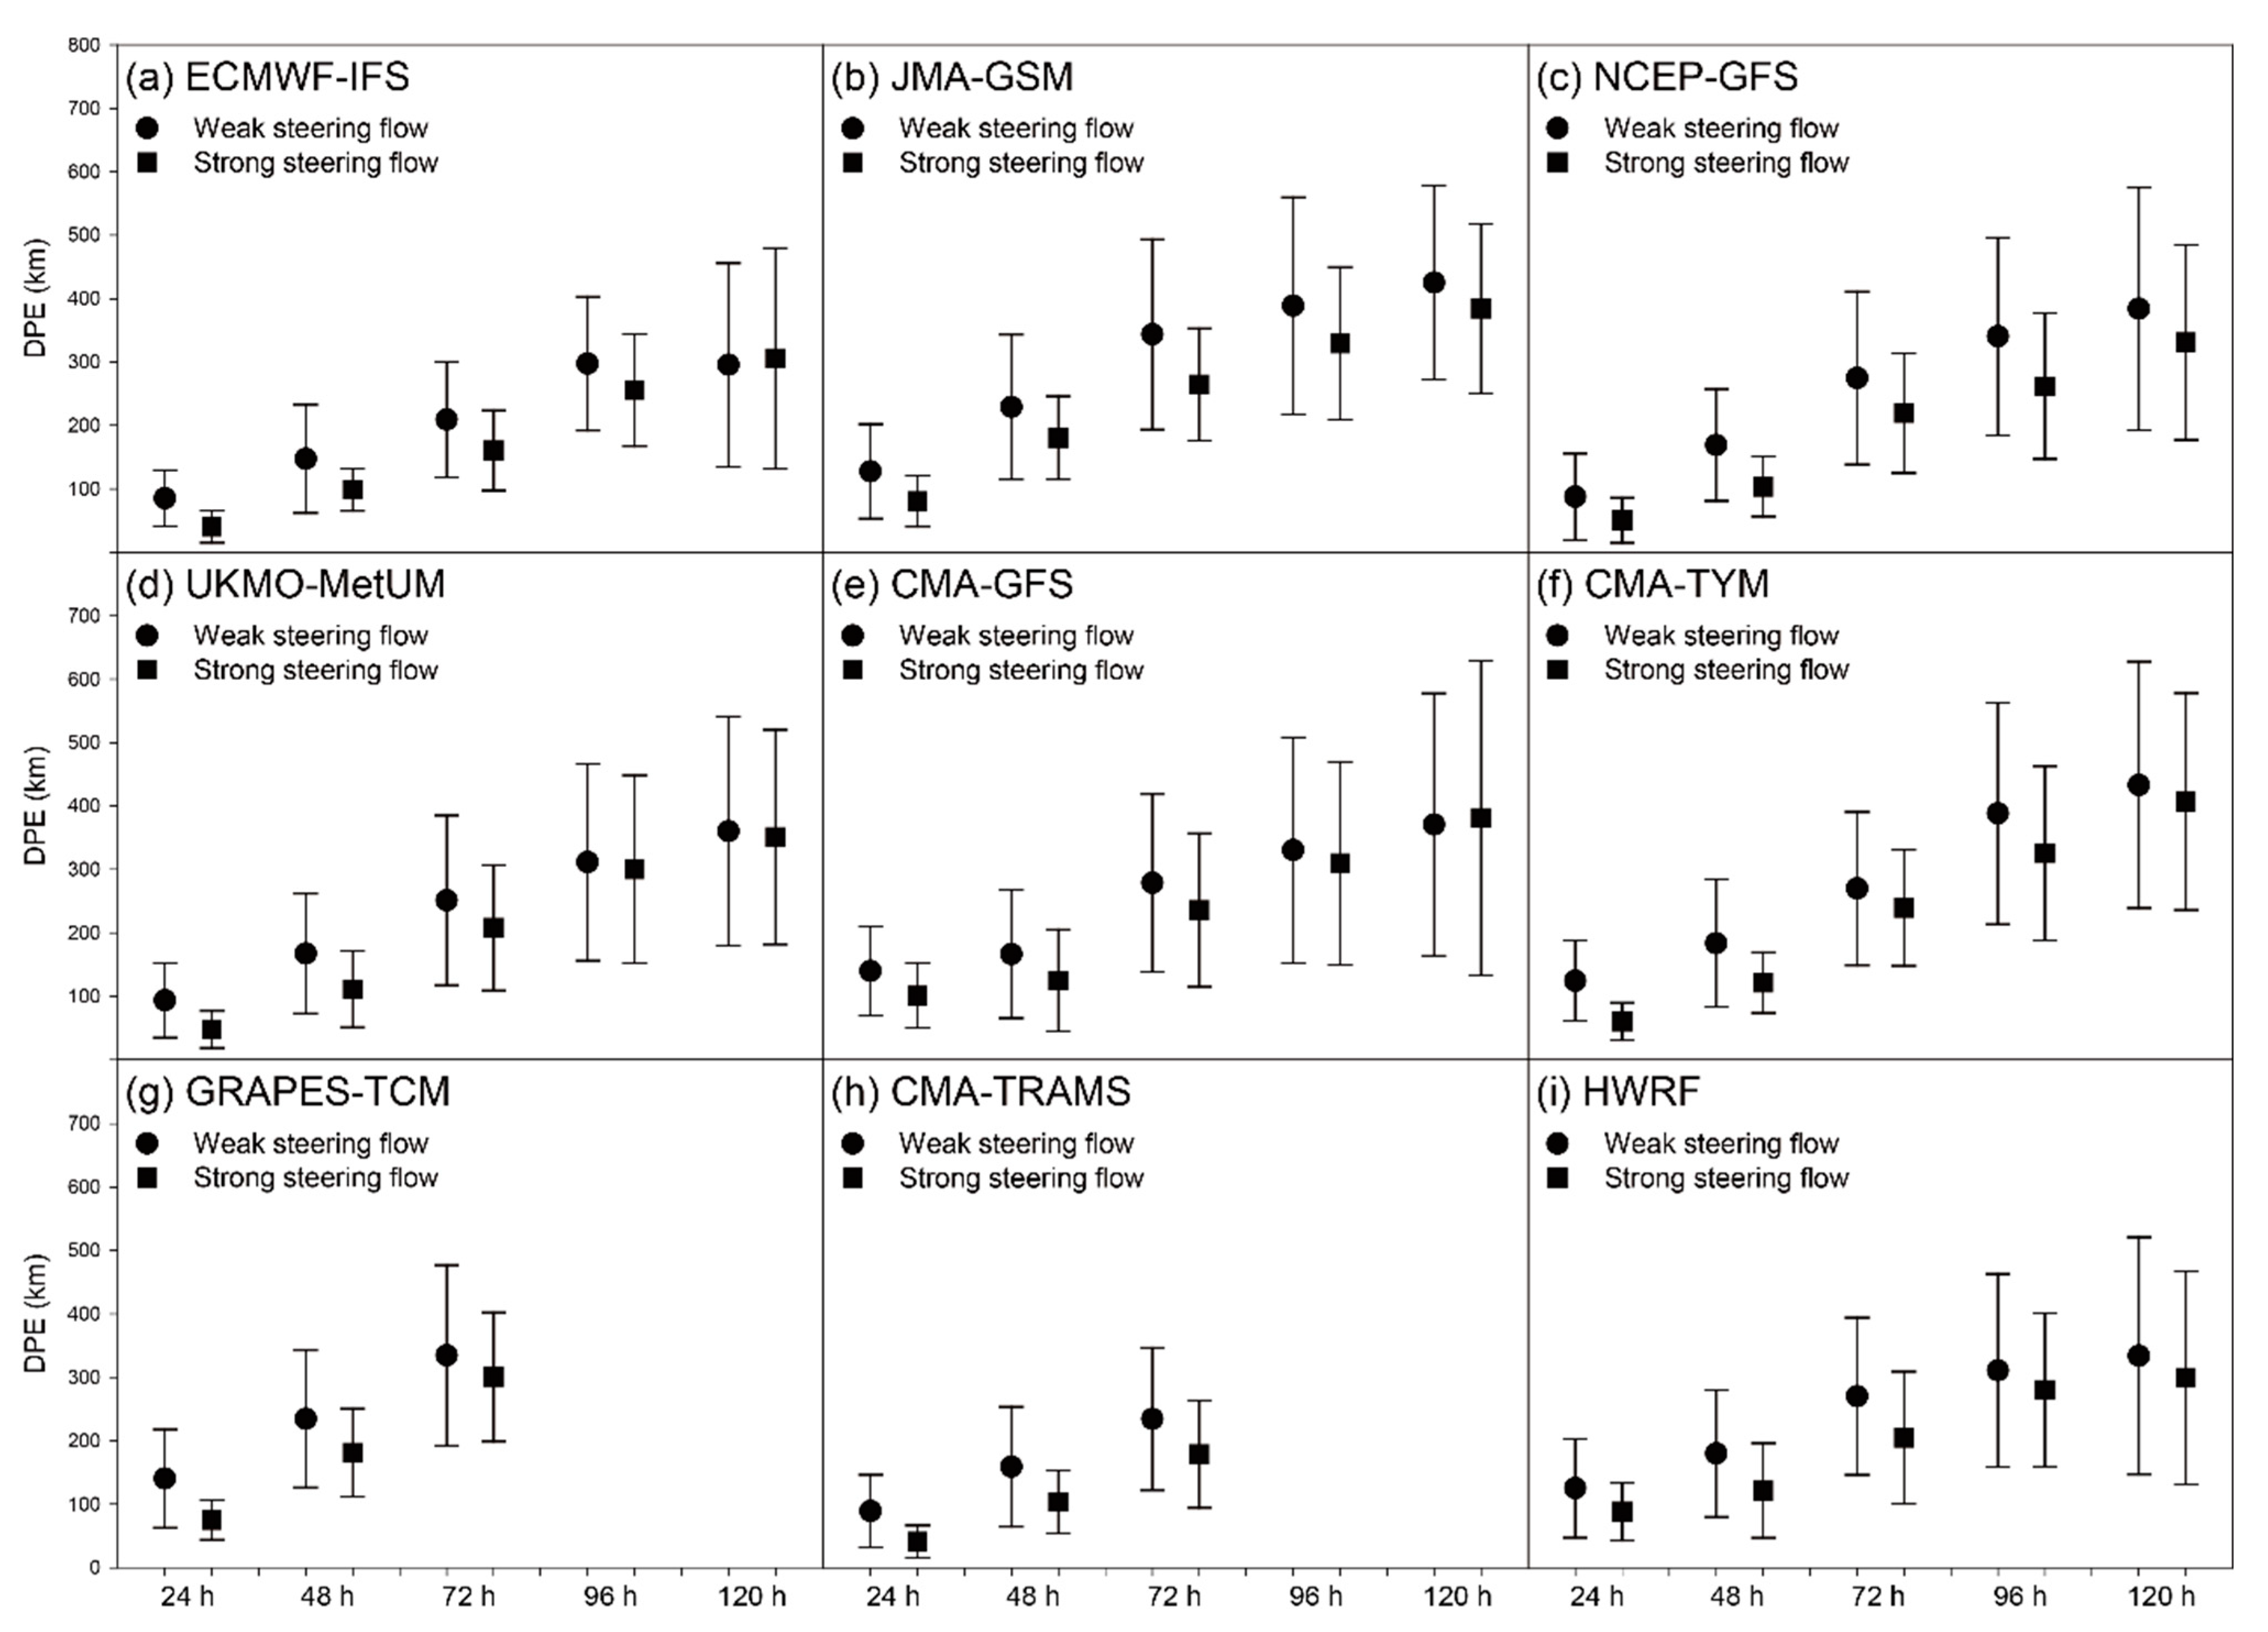
Given the strong correlation between the DPE and the environmental steering flow, we further conduct a composite analysis to understand the impact of intensity of the steering flow on the track forecast error in different models. All forecast cases are decomposed into a “weak steering flow” and a “strong steering flow” group. Because the mean steering flow in the 2021 WNP typhoon season is 3.1 m·s−1, the “weak steering flow” (“strong steering flow”) group is defined when it is less (more) than 3.1 m·s−1. Figure 9 shows that the “strong steering flow” group performs better and has smaller track forecast errors than the “weak steering flow” group for all the models at each lead, except for ECMWF-IFS and CMA-GFS at a 120 h lead. The difference of the track forecast performance between two groups is particularly evident at shorter lead times. For instance, the mean DPEs of the “weak steering flow” and the “strong steering flow” group are 85.1 and 40.3 km for ECMWF-IFS at a 24 h lead, while their SDs are 44.2 and 25.3 km, respectively. This implies that the mean DPE of the “strong steering flow” group is only half of that in the other group for ECMWF-IFS at a 24 h lead. Moreover, the annual mean DPE of ECMWF-IFS “strong steering flow” group at a 24 h lead is 36% lower than that of the corresponding “weak steering flow” group (Figure 9a).
5. Summary and Discussion
The aim of this study is to evaluate and analyze the tropical cyclone (TC) track forecast performance of five global models (ECMWF-IFS, JMA-GSM, NCEP-GFS, UKMO-MetUM, and CMA-GFS) and four regional models (GRAPES-TCM, CMA-TYM, CMA-TRAMS, and HWRF) for the western North Pacific (WNP) typhoon season in 2021. The DPEs of the global and regional models are approximately 80, 150, 200, 300, and 400 km at 24, 48, 72, 96, and 120 h leads, respectively. Among the five global models, ECMWF-IFS delivered the best track forecast performance at each lead, followed by NCEP-GFS and UKMO-MetUM. Among the four regional models, CMA-TRAMS attained the smallest DPEs within a 72 h lead, while HWRF had the best track forecast performance at 96 and 120 h leads.
A subjective trend analysis shows that the DPEs of both the global and regional models in 2021 are a little higher than previous years, suggesting that the 2021 track forecast is more challenging. It is worth noting that several models reached their lowest DPEs around 2015, and the track forecast performance within a 72 h lead has been stagnating since 2015. This calls for a further in-depth study to understand this stagnating feature. Furthermore, all the global models produced obvious westward systematic position biases from 24 h to 120 h leads. The regional models have the same characteristic of the systematic position bias, except for HWRF at a 120 h lead. Real-time forecasters in the operational centers should be aware of the general track forecast bias characteristic.
Further correlation and cluster analyses were carried out to examine how and to what extent TC intensity and size and large-scale environmental characteristics may affect the track forecast DPEs of the global and regional models. By analyzing the correlation coefficients between initial TC intensity and DPE, we found that initial TC intensity could be considered as a good predictor for TC track forecasts, especially at early forecast lead times. This conclusion is consistent with the results of Hansen et al. [26] and Chen et al. [8]. Furthermore, TCs with stronger initial intensity often gained smaller DPEs than TCs with weaker initial intensity. After examining the relationship between TC track forecast DPEs and initial TC size, we also found that TCs with an initially bigger size tended to attain less DPEs within a 48 h lead, and vice versa. This result would be valuable for providing guidance to operational forecasters. The result should stimulate further research to understand how the initial TC size may affect subsequent track forecasts and to what extent TC track forecasts may be degraded because of an erroneous estimation of the initial size of the TC.
It is well known that the environmental steering flow is the primary factor among all factors influencing the TC track [25,27,28], accounting for as much as 70–90% of the motion [29]. Therefore, even though forecasters could refer to substantial forecast guidance from various global and regional models, they still insist on using the steering flow theory to determine the direction and speed of the movement of a TC. In this study, significant negative correlations between the environmental steering flow and DPE at the 95% confidence level are found for all models from 24 h to 72 h leads, implying that the track forecast errors at those lead times tend to be small when the initial environmental steering flow is large. A cluster analysis further confirmed this result. For instance, the DPEs of ECMWF-IFS “strong steering flow” group are only half of its corresponding “weak steering flow” group at an early forecast lead (24 h).
The results derived from the current study may provide useful guidance for TC forecasters. Through the current analyses, operational forecasters may learn the advantages and disadvantages of different models and their latest updated forecast features. Once operational forecasters correct possible track forecast errors based on model systematic biases, lead time, and TC environmental characteristics, they might be able to determine whether the best forecast is likely to be provided by one or by a cluster of global and/or regional models at each lead. Further studies are needed to reveal the detail forecast performance related to which model attains better forecasts under different synoptic flow types. In addition, in view of the fact that large DPEs still exist for each model, it is necessary to conduct case studies to reveal the cause of the unusual tracks and to explore physical mechanisms responsible for the large DPEs in future work.
Author Contributions
Conceptualization, T.L. and G.C.; methodology, G.C.; software, M.Y. and X.Z.; formal analysis, G.C.; writing—original draft preparation, G.C.; writing—review and editing, T.L.; visualization, G.C., M.Y. and X.Z.; funding acquisition, T.L. and G.C. All authors have read and agreed to the published version of the manuscript.
Funding
This research was funded by National Natural Science Foundation of China (NSFC) grant number 42088101 and the National Key R&D Program of China grant number 2021YFC3000805.
Institutional Review Board Statement
Not applicable.
Informed Consent Statement
Not applicable.
Data Availability Statement
The TC forecast data and the TC best-track data are available at CMA Tropical Cyclone Data Center (https://tcdata.typhoon.org.cn/en/index.html, accessed on 25 January 2023).
Acknowledgments
This work was jointly supported by NSFC project 42088101 and the National Key R&D Program of China (2021YFC3000805). We thank Wan Rijin of STI for his assistance in providing the TC forecast data of models.
Conflicts of Interest
The authors declare no conflict of interest.
References
- Yamaguchi, M.; Ishida, J.; Sato, H.; Nakagawa, M. WGNE Intercomparison of Tropical Cyclone Forecasts by Operational NWP Models: A Quarter Century and Beyond. Bull. Am. Meteorol. Soc. 2017, 98, 2337–2349. [Google Scholar] [CrossRef]
- Gall, R.; Franklin, J.L.; Marks, F.; Rappaport, E.N.; Toepfer, F. The Hurricane Forecast Improvement Project. Bull. Am. Meteorol. Soc. 2013, 94, 329–343. [Google Scholar] [CrossRef]
- Yu, H.; Chen, G.; Zhou, C.; Wong, W.K.; Yang, M.; Xu, Y.; Chen, P.; Wan, R.; Hu, X. Are We Reaching the Limit of Tropical Cyclone Track Predictability in the Western North Pacific? Bull. Am. Meteorol. Soc. 2022, 103, E410–E428. [Google Scholar] [CrossRef]
- Landsea, C.W.; Cangialosi, J.P. Have we reached the limits of predictability for tropical cyclone track forecasting? Bull. Am. Meteorol. Soc. 2018, 99, 2237–2243. [Google Scholar] [CrossRef] [Green Version]
- WMO. Sixth WMO International Workshop on Tropical Cyclones (IWTC-VI); Tropical Meteorology Research Programme Report Series; Secretariat of the World Meteorological Organization: Geneva, Switzerland, 2007; p. 92. Available online: http://www.aoml.noaa.gov/hrd/Landsea/WWRP2007_1_IWTC_VI.pdf (accessed on 17 December 2022).
- Peng, X.; Fei, J.; Huang, X.; Cheng, X. Evaluation and Error Analysis of Official Forecasts of Tropical Cyclones during 2005–14 over the Western North Pacific. Part I: Storm Tracks. Weather Forecast. 2017, 32, 689–712. [Google Scholar] [CrossRef]
- Chen, G.; Yu, H.; Cao, Q.; Zeng, Z. The performance of global models in TC track forecasting over the western North Pacific from 2010 to 2012. Trop. Cyclone Res. Rev. 2013, 2, 149–158. [Google Scholar] [CrossRef]
- Chen, J.-H.; Lin, S.-J.; Zhou, L.; Chen, X.; Rees, S.; Bender, M.; Morin, M. Evaluation of Tropical Cyclone Forecasts in the Next Generation Global Prediction System. Mon. Weather Rev. 2019, 147, 3409–3428. [Google Scholar] [CrossRef]
- Haiden, T.; Richardson, D. Evaluation of ECMWF Forecasts, Including the 2021 Upgrade; ECMWF Technical Memorandum No. 884; ECMWF: Reading, UK, 2021; p. 56. Available online: https://www.ecmwf.int/sites/default/files/elibrary/2021/20142-evaluation-ecmwf-forecasts-including-2021-upgrade.pdf (accessed on 18 December 2022).
- Hodges, K.I.; Klingaman, N.P. Prediction Errors of Tropical Cyclones in the Western North Pacific in the Met Office Global Forecast Model. Weather Forecast. 2019, 34, 1189–1209. [Google Scholar] [CrossRef]
- Goldenberg, S.B.; Gopalakrishnan, S.G.; Tallapragada, V.; Quirino, T.; Marks, F.; Trahan, S.; Zhang, X.; Atlas, R. The 2012 triply nested, high-resolution operational version of the Hurricane Weather Research and Forecasting Model (HWRF): Track and intensity forecast verifications. Weather Forecast. 2015, 30, 710–729. [Google Scholar] [CrossRef]
- Tallapragada, V.; Kieu, C.; Kwon, Y.; Trahan, S.; Liu, Q.; Zhang, Z.; Kwon, I.-H. Evaluation of storm structure from the operational HWRF during 2012 Implementation. Mon. Weather Rev. 2014, 142, 4308–4325. [Google Scholar] [CrossRef]
- Zhang, X.; Gopalakrishnan, S.G.; Trahan, S.; Quirino, T.S.; Liu, Q.; Zhang, Z.; Alaka, G.; Tallapragada, V. Representing multiple scales in the Hurricane Weather Research and Forecasting modeling system: Design of multiple sets of movable multilevel nesting and the basin-scale HWRF forecast application. Weather Forecast. 2016, 31, 2019–2034. [Google Scholar] [CrossRef]
- Muroi, C.; Sato, N. Intercomparison of Tropical Cyclone Track Forecast by ECMWF, UKMO and JMA Operational Global Models; Japan Meteorological agency JMA/NPD technical report No. 31; Japan Meteorological Agency: Tokyo, Japan, 1994; p. 26. [Google Scholar]
- Tsuyuki, T.; Sakai, R.; Mino, H. The WGNE intercomparison of typhoon track forecasts from operational global models for 1991-2000. WMO-Bull. 2002, 5, 253–257. [Google Scholar]
- Chen, G.; Yang, M.; Zhang, X.; Wan, R. Verification of Tropical Cyclone Operational Forecast in 2021; WMO Typhoon Landfall Forecast Demonstration Project Technical Report; WMO: Geneva, Switzerland, 2022; p. 34. Available online: http://www.tlfdp.net/#/main/verification-reports (accessed on 10 December 2022).
- RSMC-Tokyo. Review of the 2021 Typhoon Season; ESCAP/WMO Typhoon Committee Technical Report; RSMC-Tokyo: Tokyo, Japan, 2022; p. 15. Available online: https://typhooncommittee.org/54th/docs/item%205/5.1.Summary_Of_2021_Typhoon_Season_20220311.pdf (accessed on 10 December 2022).
- Bai, L.; Yu, H.; Black, P.G.; Xu, Y.; Ying, M.; Tang, J.; Guo, R. Reexamination of the Tropical Cyclone Wind–Pressure Relationship Based on Pre-1987 Aircraft Data in the Western North Pacific. Weather Forecast. 2019, 34, 1939–1954. [Google Scholar] [CrossRef]
- Lee, T.C.; Knutson, T.R.; Kamahori, H.; Ying, M. Impacts of climate change on tropical cyclones in the western North Pacific basin. Part I: Past observations. Trop. Cyclone Res. Rev. 2012, 1, 213–230. [Google Scholar] [CrossRef]
- Yu, H.; Chan, S.T.; Brown, B.; Kunitsugu, M.; Fukada, E.; Park, S.; Lee, W.; Xu, Y.; Phalla, P.; Sysouphanthavong, B.; et al. Operational tropical cyclone forecast verification practice in the western North Pacific region. Trop. Cyclone Res. Rev. 2012, 1, 361–372. [Google Scholar] [CrossRef]
- Neumann, C.S.; Pelissier, J.M. An Analysis of Atlantic Tropical Cyclone Forecast Errors, 1970–1979. Mon. Weather Rev. 1981, 109, 1248–1266. [Google Scholar] [CrossRef]
- GB/T 19201-2006; Grade of Tropical Cyclones. China Standards Press: Beijing, China, 2006.
- Knaff, J.A.; Zehr, R.M. Reexamination of Tropical Cyclone Wind–Pressure Relationships. Weather Forecast. 2007, 22, 71–88. [Google Scholar] [CrossRef]
- National Centers for Environmental Prediction/National Weather Service/NOAA/U.S. Department of Commerce (2000) NCEP FNL Operational Model Global Tropospheric Analyses, continuing from July 1999; Research Data Archive at the National Center for Atmospheric Research, Computational and Information Systems Laboratory: Boulder, CO, USA, 2000. [CrossRef]
- Chan, J.C.L.; Gray, W.M. Tropical Cyclone Movement and Surrounding Flow Relationships. Mon. Weather Rev. 1982, 110, 1354–1374. [Google Scholar] [CrossRef]
- Hansen, J.A.; Goerss, J.S.; Sampson, C. GPCE-AX: An Anisotropic Extension to the Goerss Predicted Consensus Error in Tropical Cyclone Track Forecasts. Weather Forecast. 2011, 26, 416–422. [Google Scholar] [CrossRef]
- Holland, G.J. Tropical Cyclone Motion. A Comparison of Theory and Observation. J. Atmos. Sci. 1984, 41, 68–75. [Google Scholar] [CrossRef]
- Carr, L.E., III; Elsberry, R.L. Observational Evidence for Predictions of Tropical Cyclone Propagation Relative to Environmental Steering. J. Atmos. Sci. 1990, 47, 542–546. [Google Scholar] [CrossRef]
- Neumann, C.J. The Joint Typhoon Warning Center (JTWC92) Model. SAIC Final Rep., Contrach N00014-90-c-6042, p. 85. 1992. Available online: http://www.dtic.mil/dtic/tr/fulltext/u2/a258646.pdf (accessed on 29 August 2021).
Figure 1.
Best tracks (as determined by RSMC-Tokyo) of named TCs over the WNP in 2021. The numbers represent the genesis and dissipation points of named TCs.
Figure 1.
Best tracks (as determined by RSMC-Tokyo) of named TCs over the WNP in 2021. The numbers represent the genesis and dissipation points of named TCs.

Figure 2.
The time series of the annual mean DPEs of global models (a–c) and regional models (d–f) at forecast lead times of 24, 48, and 72 h. The colored dashed lines are the linear regression lines.
Figure 2.
The time series of the annual mean DPEs of global models (a–c) and regional models (d–f) at forecast lead times of 24, 48, and 72 h. The colored dashed lines are the linear regression lines.
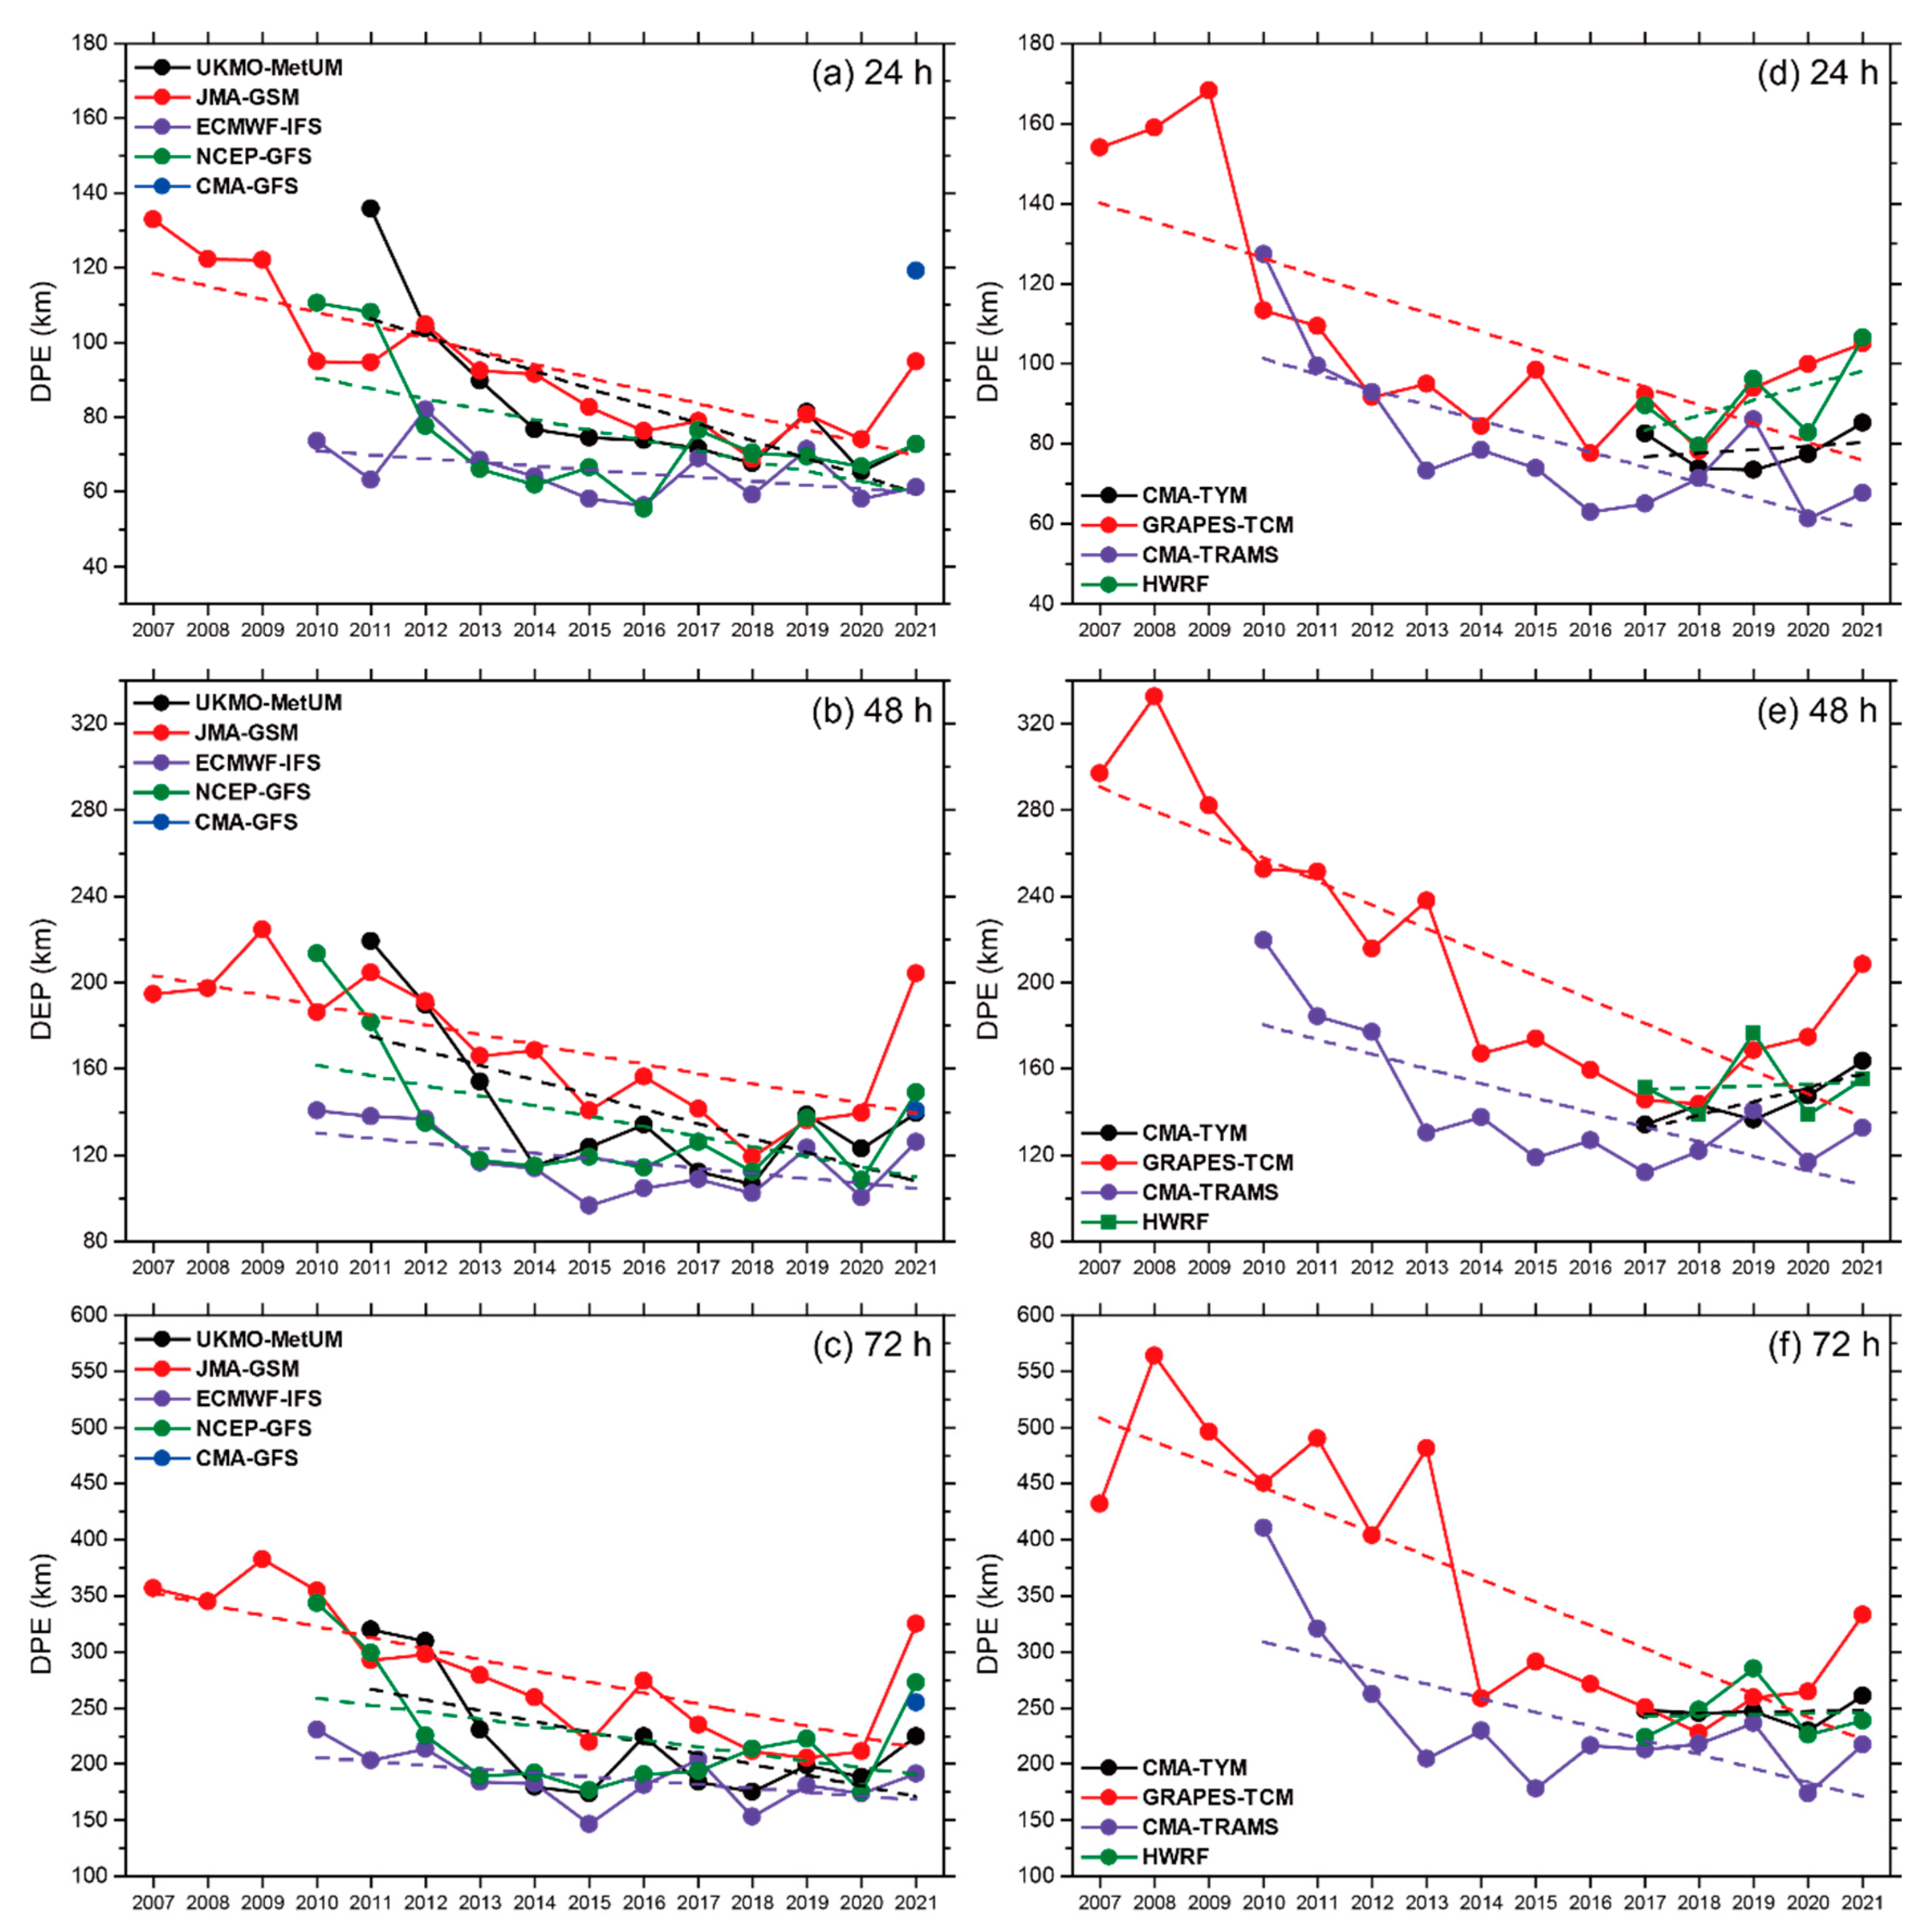
Figure 3.
Annual mean relative positions between forecast and observed TC centers for global models (a,c,e) and regional models (b,d,f) in 2019, 2020, and 2021. The colored symbols inside the charts represent the annual mean relative positions of corresponding models at a different lead time.
Figure 3.
Annual mean relative positions between forecast and observed TC centers for global models (a,c,e) and regional models (b,d,f) in 2019, 2020, and 2021. The colored symbols inside the charts represent the annual mean relative positions of corresponding models at a different lead time.

Figure 4.
Correlation coefficients between DPEs and initial MSLP of TC for global (a) and regional (b) models. The symbols with filled color in (a,b) indicate significant correlations at the 95% confidence intervals.
Figure 4.
Correlation coefficients between DPEs and initial MSLP of TC for global (a) and regional (b) models. The symbols with filled color in (a,b) indicate significant correlations at the 95% confidence intervals.
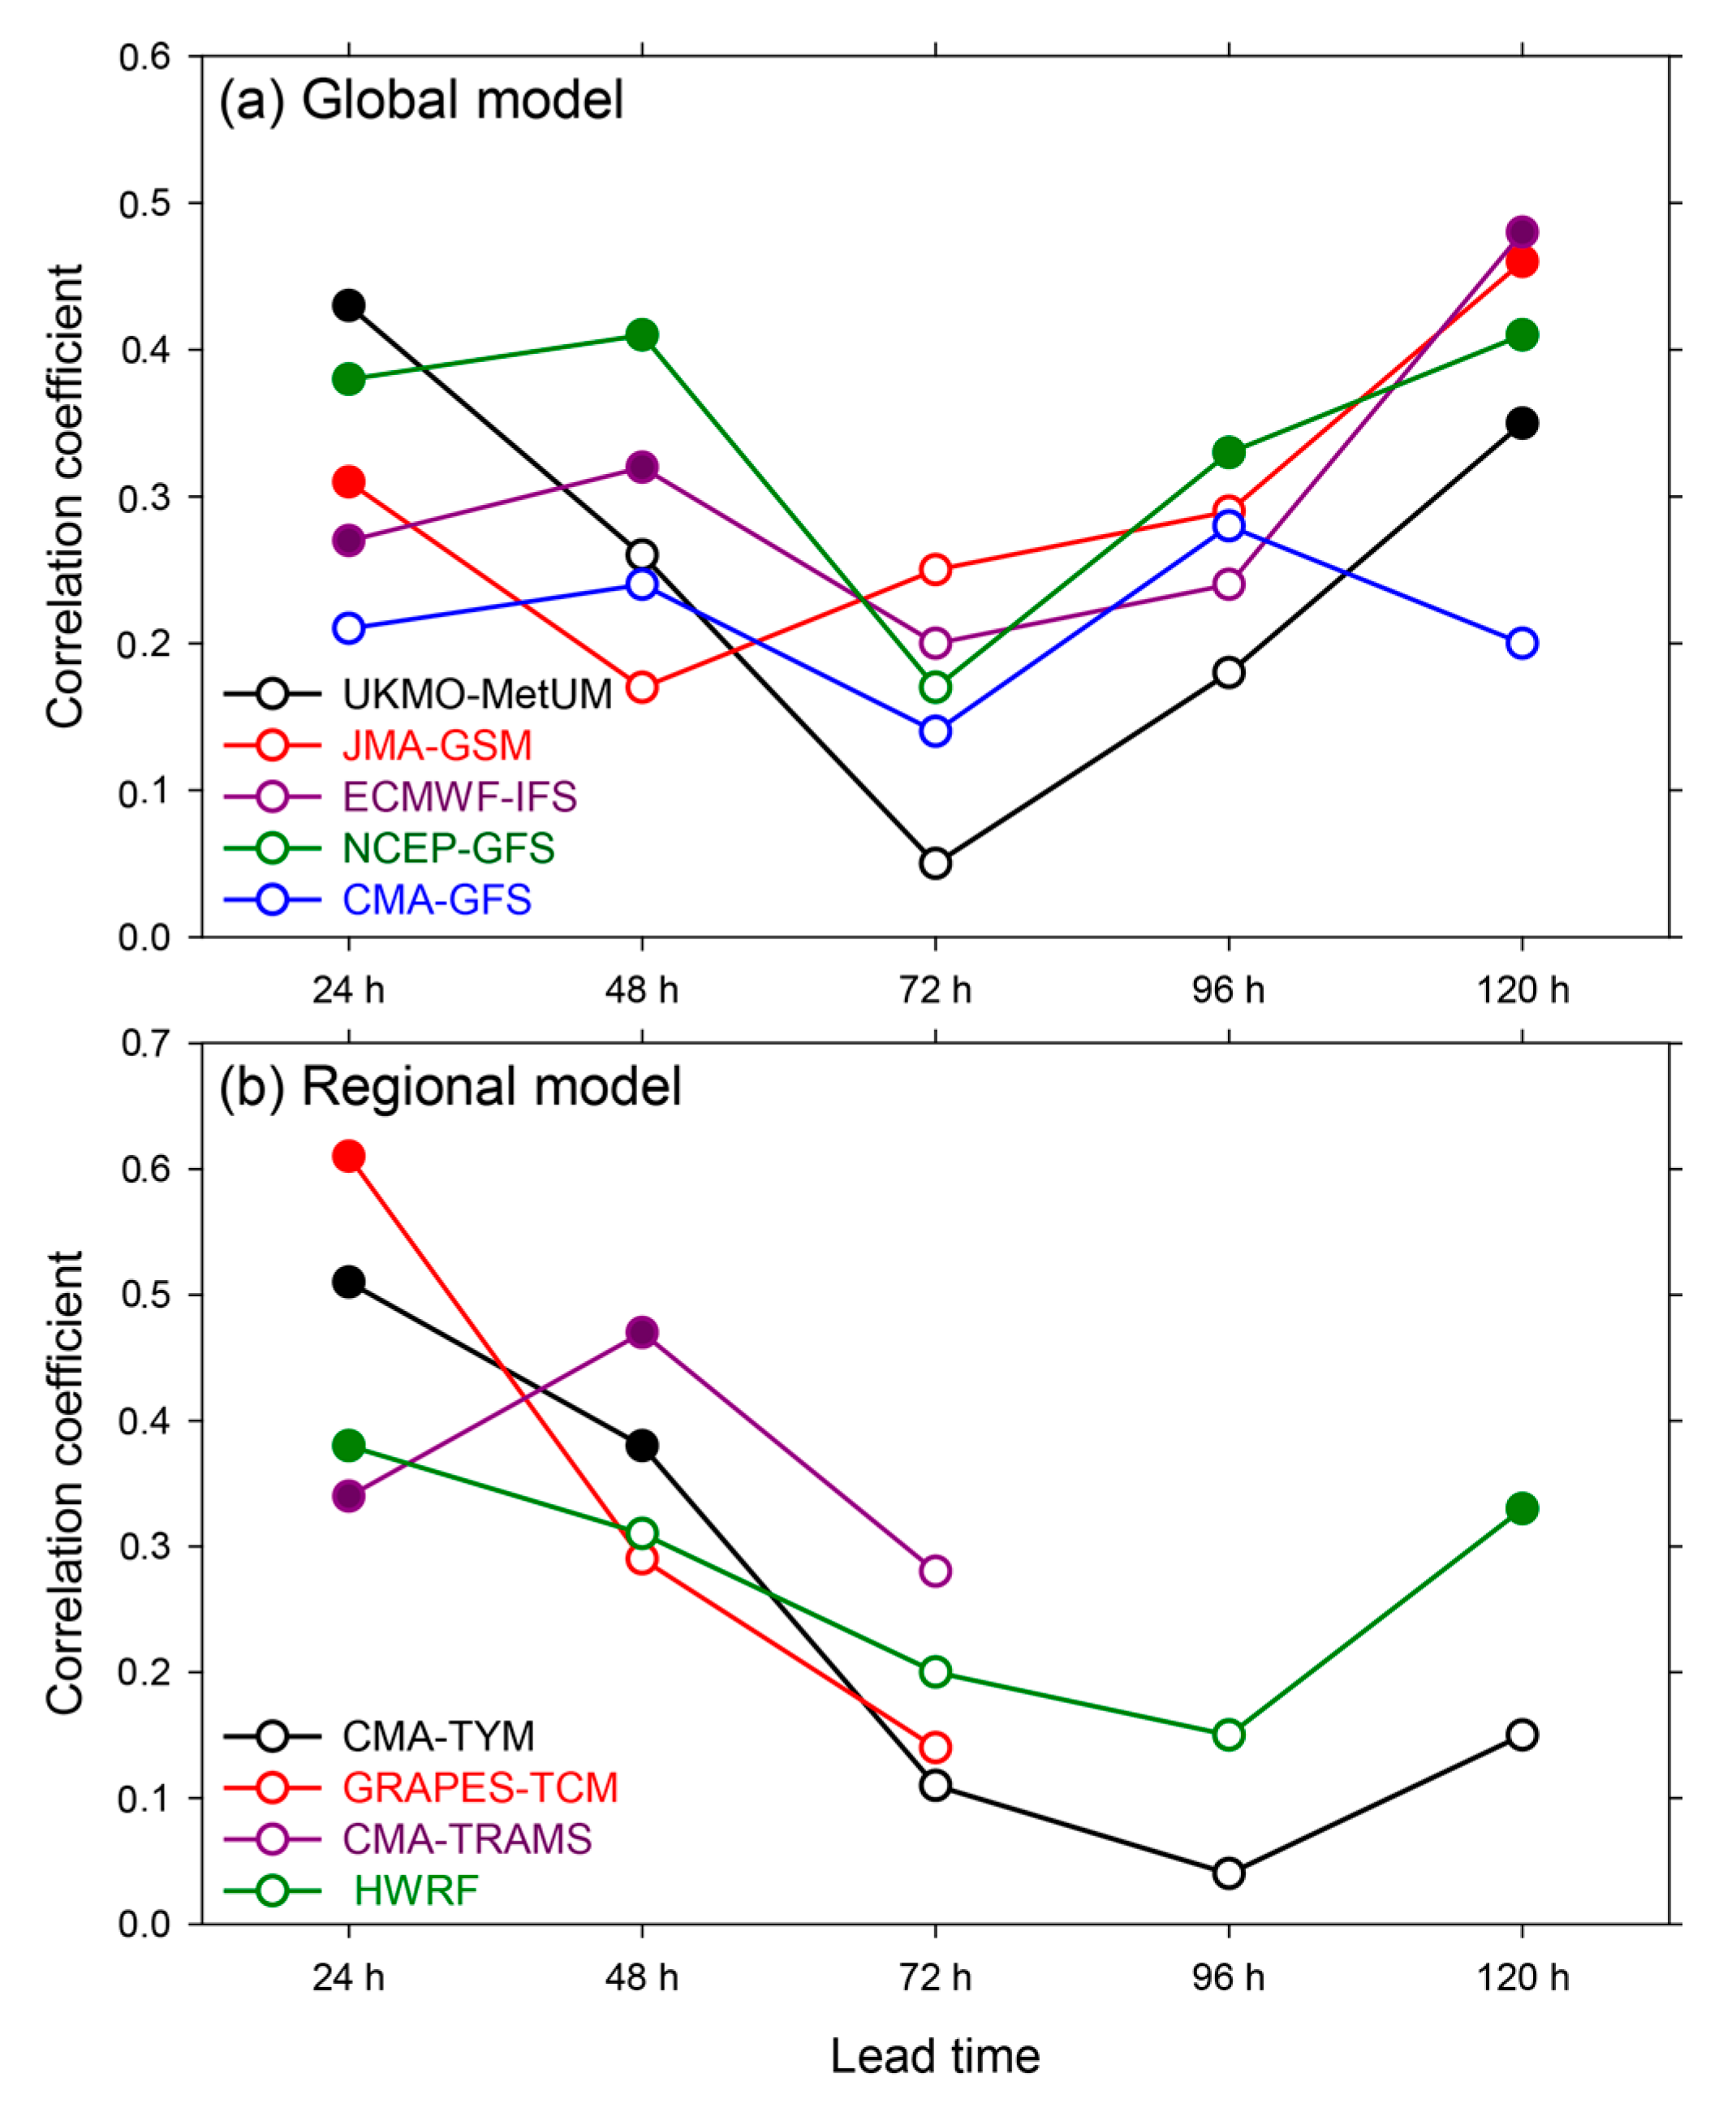
Figure 5.
Cluster comparison of TC forecast DEPs by initial intensity for: (a) ECMWF-IFS, (b) JMA-GSM; (c) NCEP-GFS; (d) UKMO-MetUM, (e) CMA-GFS, (f) CMA-TYM, (g) GRAPES-TCM, (h) CMA-TRAMS, and (i) HWRF. The circles or blocks indicate mean DPEs, bars at bottom (top) mark the mean DPEs minus (plus) the corresponding standard deviation.
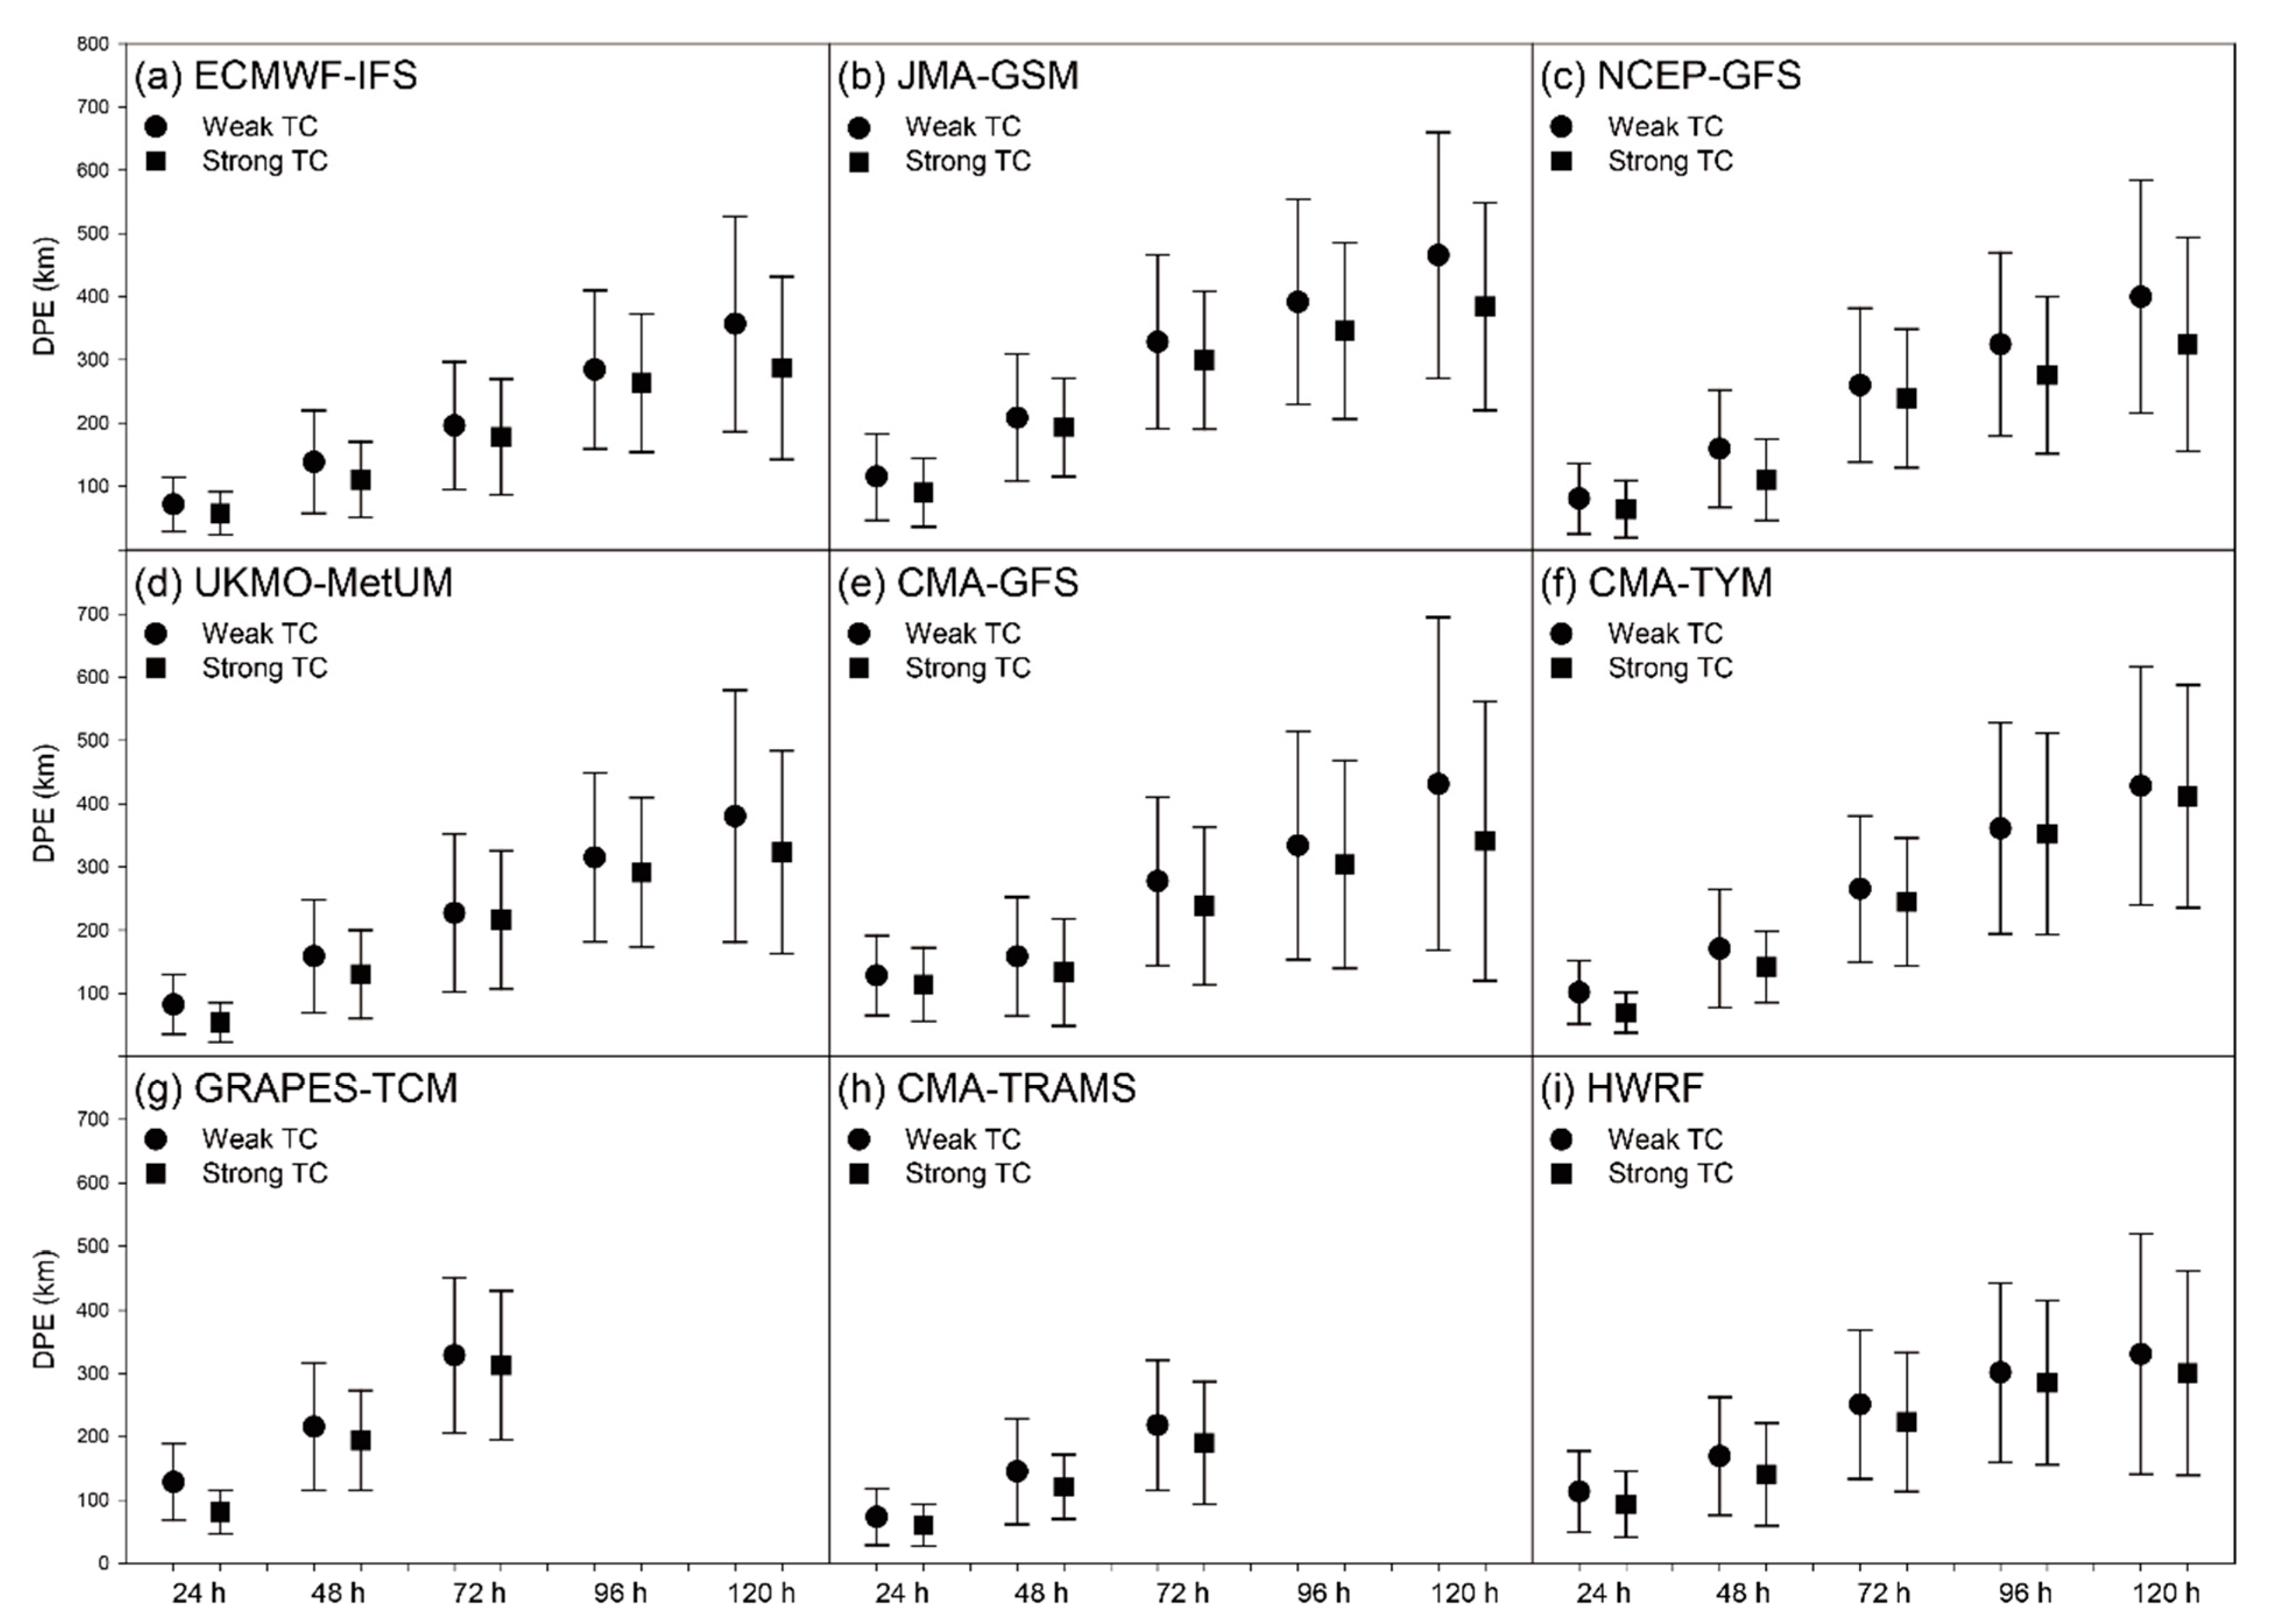
Figure 6.
Same as in Figure 4, except for correlation coefficients between DPEs and initial TC size.
Figure 6.
Same as in Figure 4, except for correlation coefficients between DPEs and initial TC size.
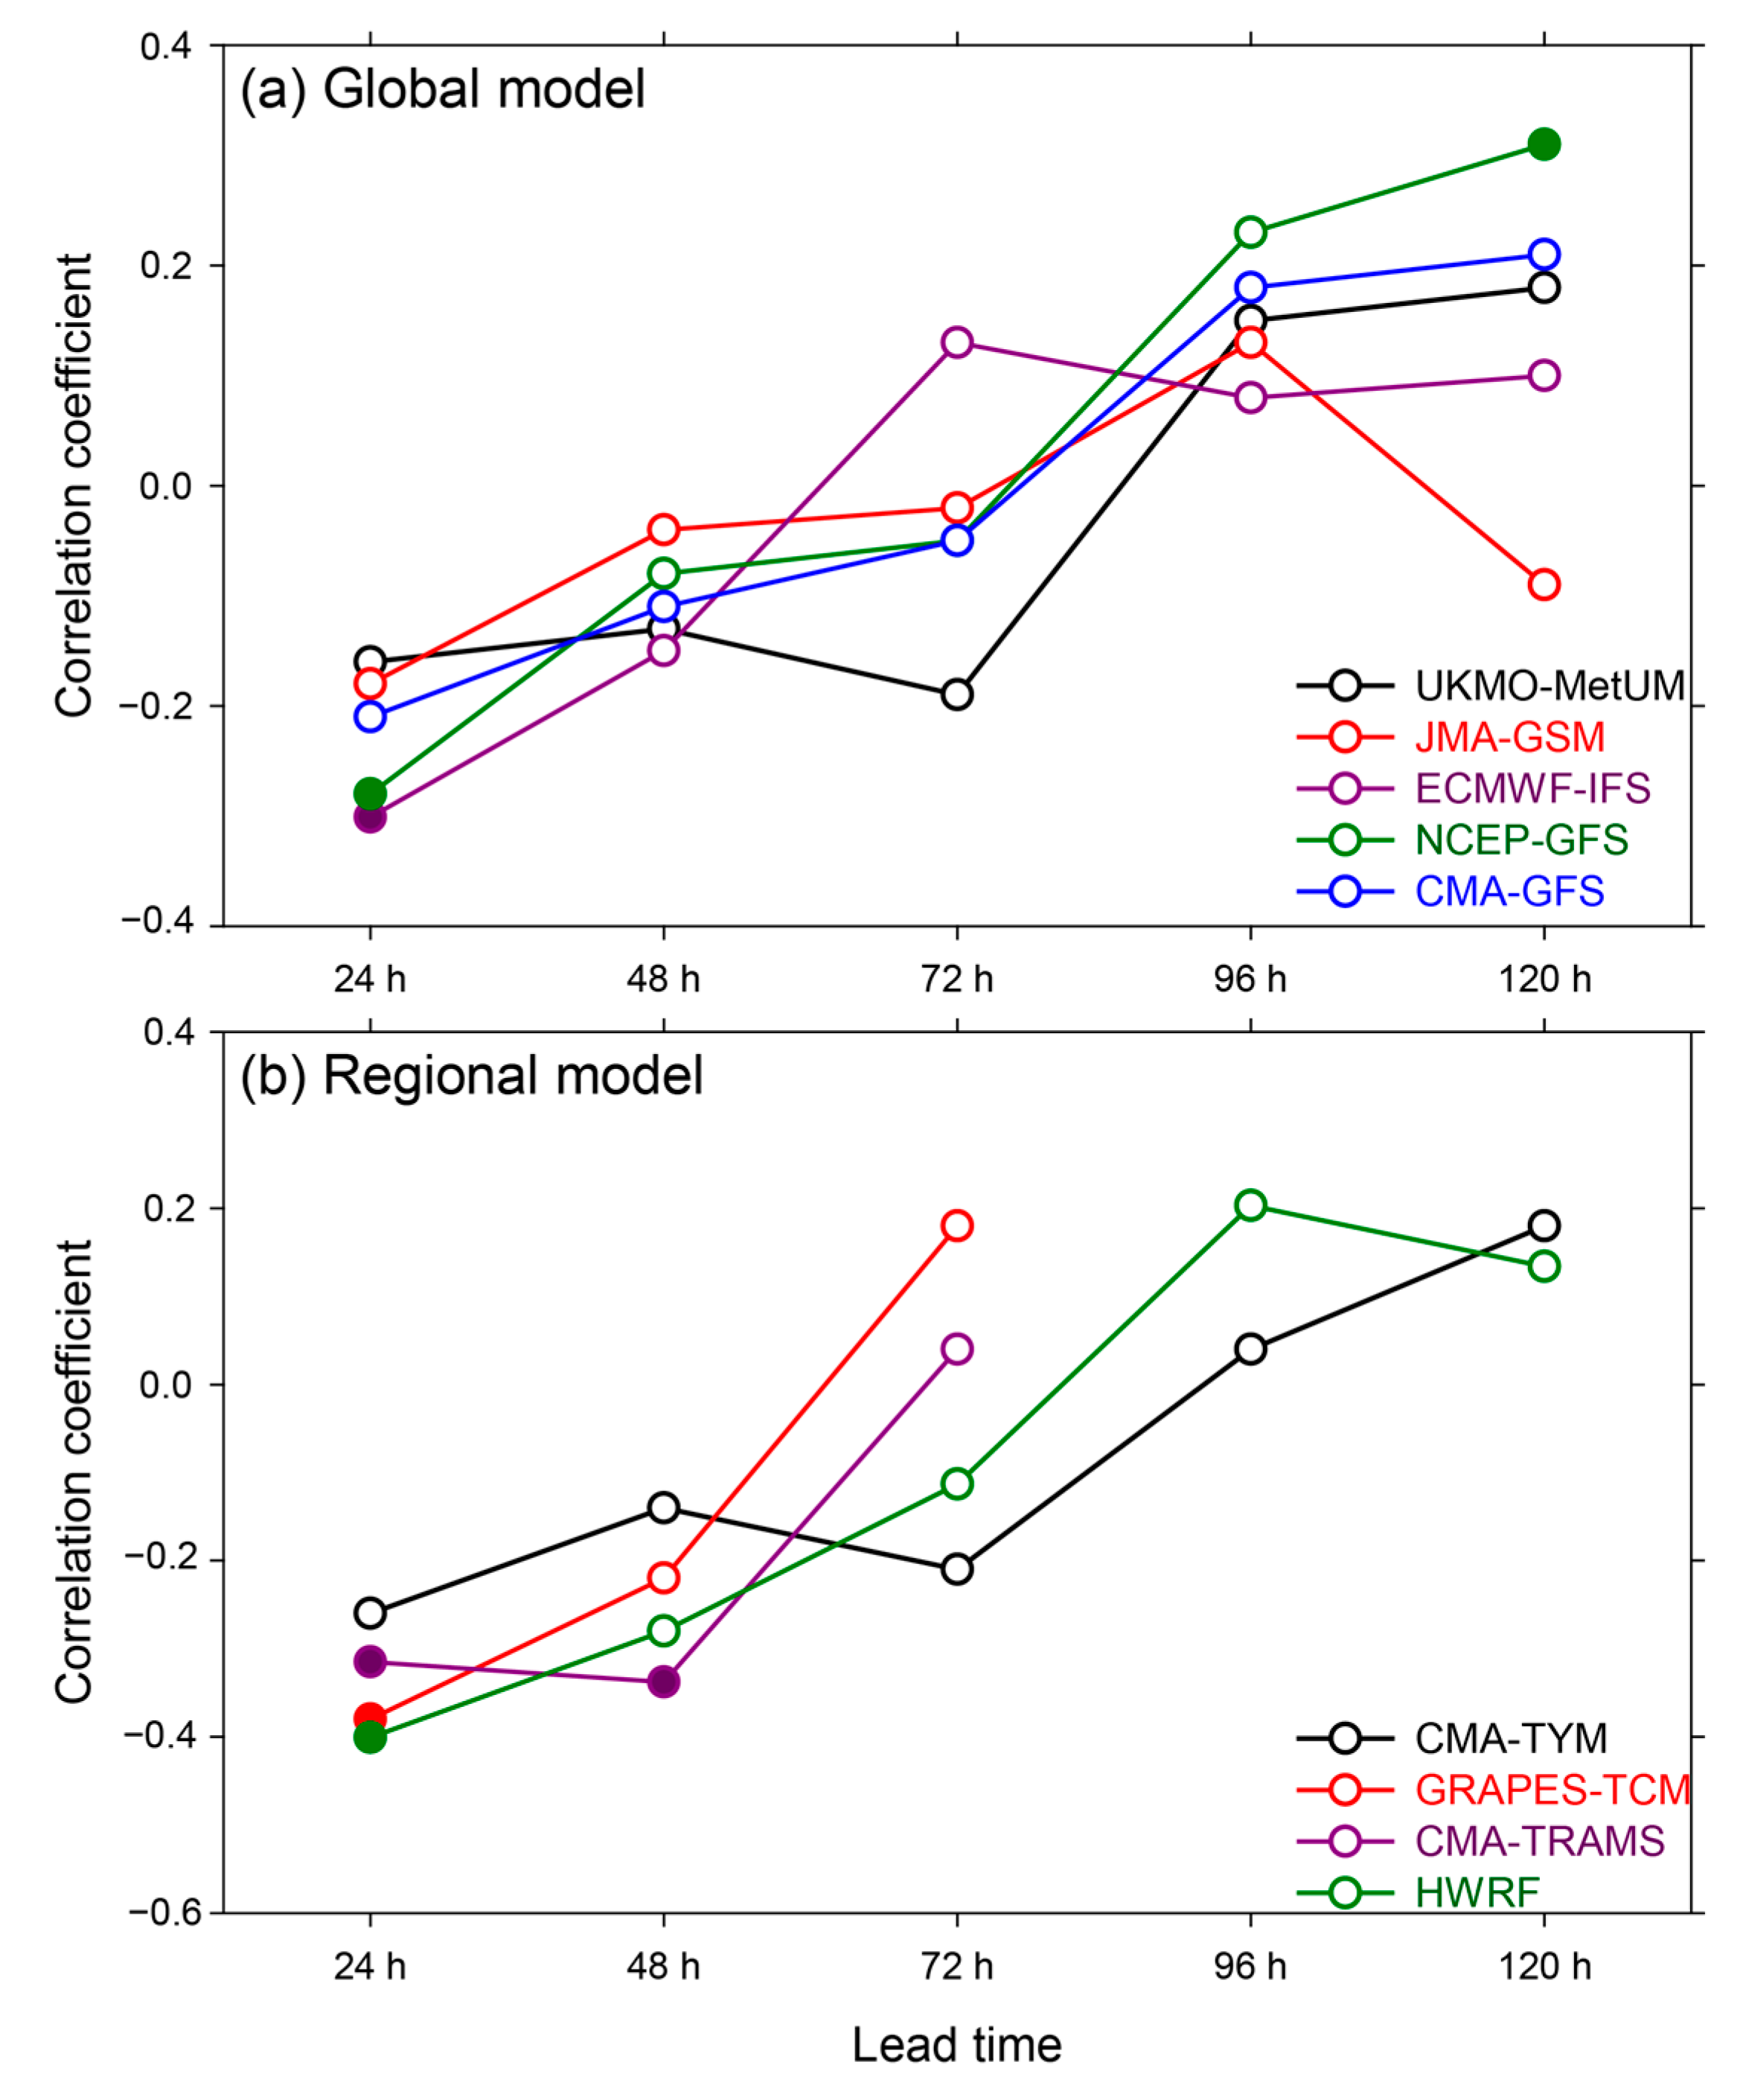
Figure 7.
Same as in Figure 5, except for cluster comparison of TC forecast DEPs by initial TC size.
Figure 7.
Same as in Figure 5, except for cluster comparison of TC forecast DEPs by initial TC size.
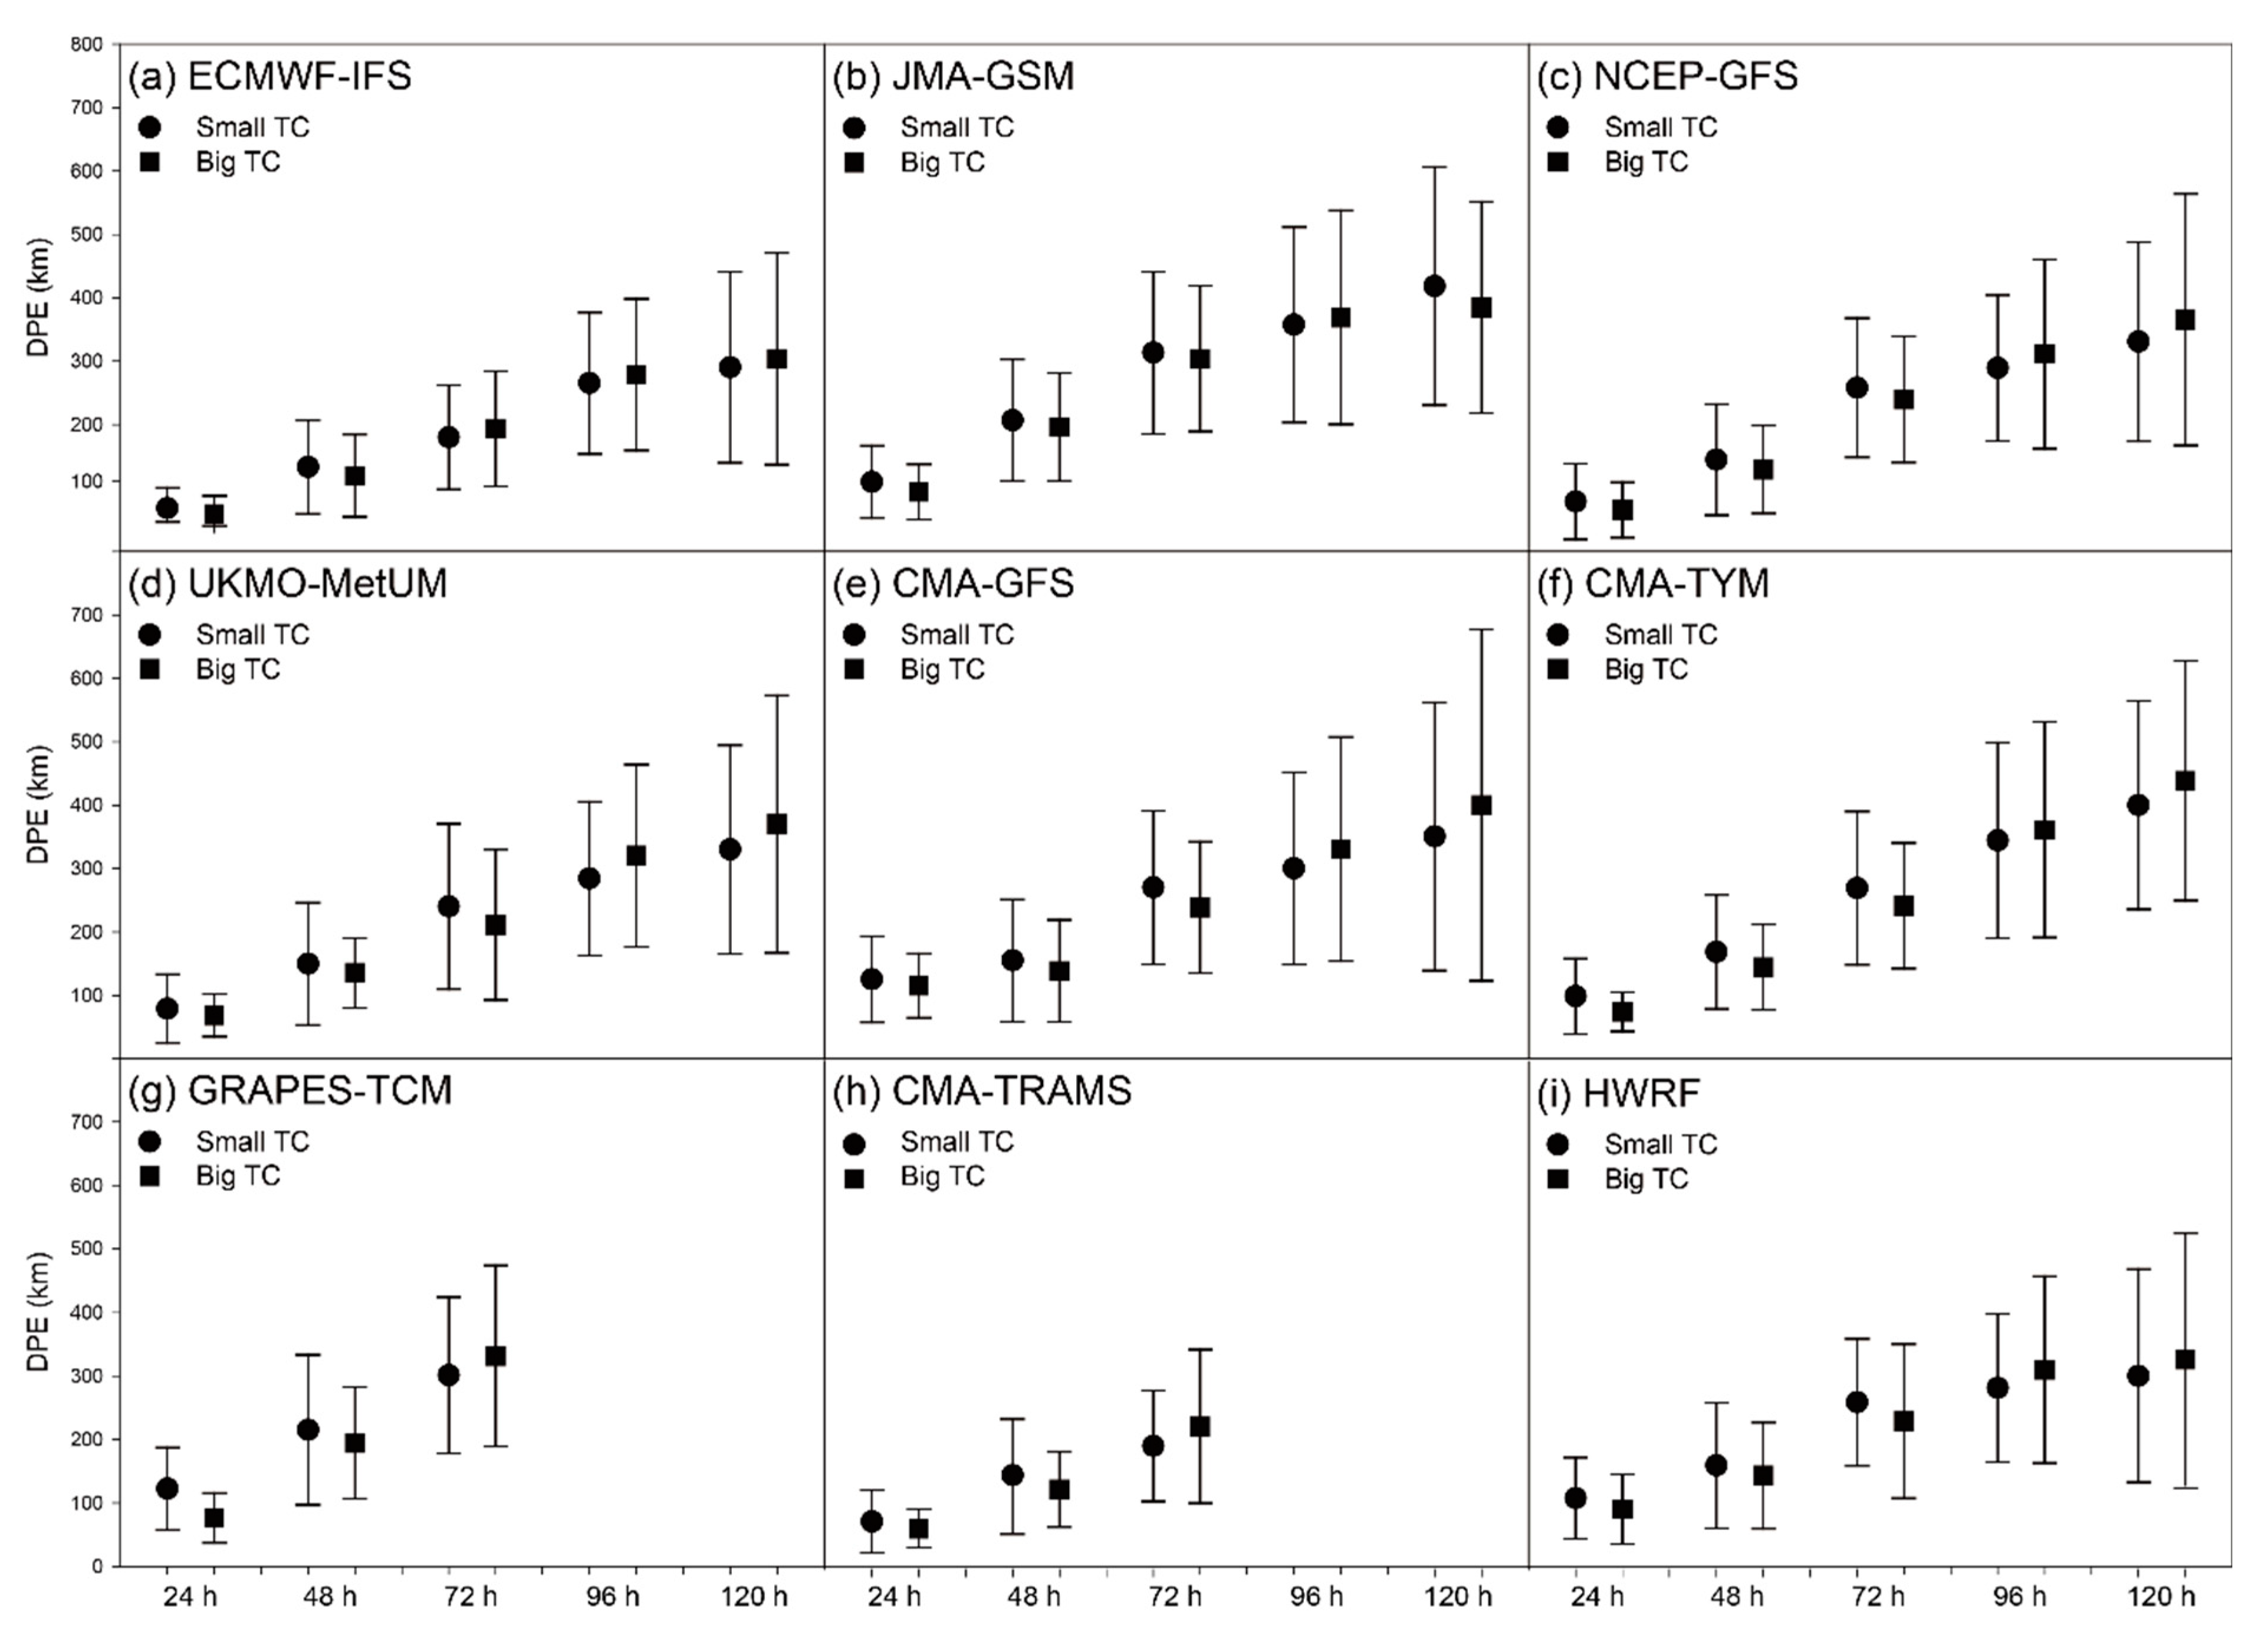
Figure 8.
Same as in Figure 4, except for correlation coefficients between DPEs and initial environmental steering flow.
Figure 8.
Same as in Figure 4, except for correlation coefficients between DPEs and initial environmental steering flow.
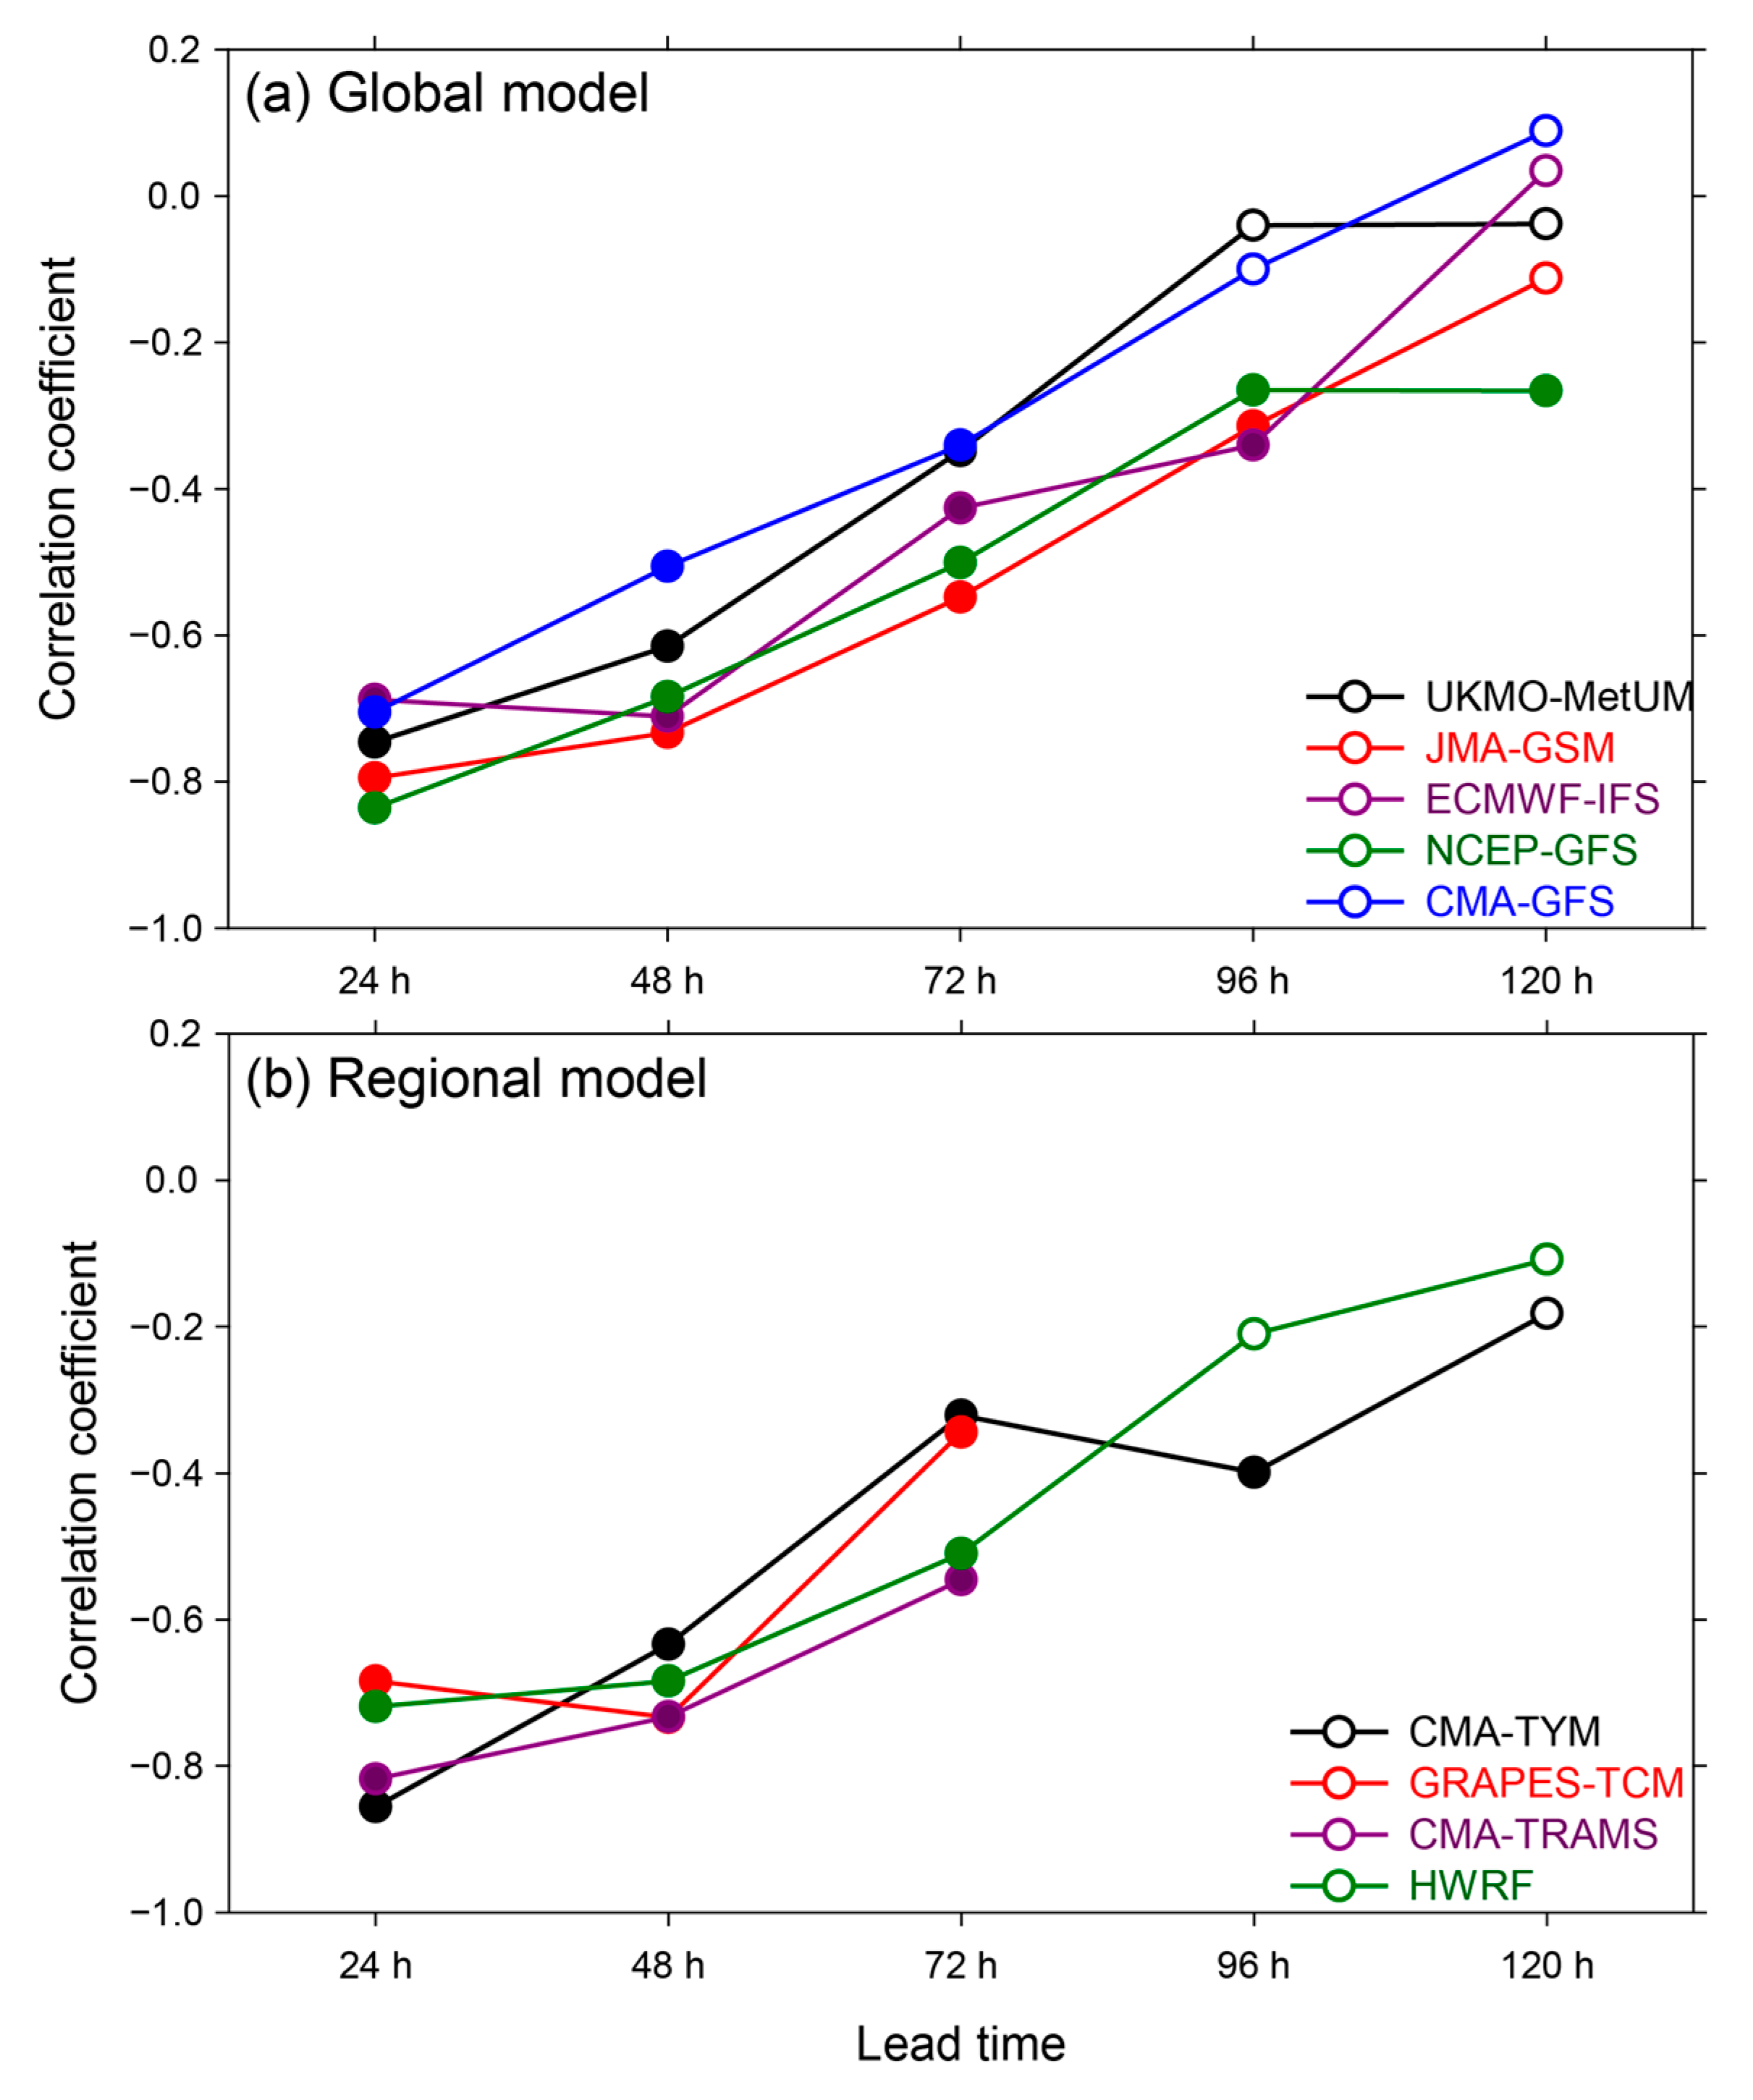
Figure 9.
Same as in Figure 5, except for cluster comparison of TC forecast DEPs by initial environmental steering flow.
Figure 9.
Same as in Figure 5, except for cluster comparison of TC forecast DEPs by initial environmental steering flow.

Table 1.
Summary of operational numerical weather prediction model used in this study.
| Model Type | Model Acronym | Description | Lead Times for Verification |
|---|---|---|---|
| Global model | ECMWF-IFS | ECMWF Integrated Forecasting System | 24, 48, 72, 96, and 120 h |
| JMA-GSM | JMA Global Spectral Model | 24, 48, 72, 96, and 120 h | |
| NCEP-GFS | NCEP Global Forecast System | 24, 48, 72, 96, and 120 h | |
| UKMO-MetUM | UKMO Unified Model System | 24, 48, 72, 96, and 120 h | |
| CMA-GFS | CMA Global Forecast System | 24, 48, 72, 96, and 120 h | |
| Regional model | GRAPES-TCM | Regional TC-forecasting model based on Global/Regional Assimilation and PrEdiction System | 24, 48, and 72 h |
| CMA-TYM | CMA Regional Typhoon forecasting Model | 24, 48, 72, 96, and 120 h | |
| CMA-TRAMS | CMA Tropical Regional Atmosphere Model for the South China Sea | 24, 48, and 72 h | |
| HWRF | The atmosphere-ocean coupled Hurricane Weather Research and Forecast modeling system | 24, 48, 72, 96, and 120 h |
Table 2.
Mean DPEs (Unit: km) for global and regional models at the lead times of 24, 48, 72, 96, and 120 h in 2021. The numbers in brackets are sample size.
Table 2.
Mean DPEs (Unit: km) for global and regional models at the lead times of 24, 48, 72, 96, and 120 h in 2021. The numbers in brackets are sample size.
| 24 h | 48 h | 72 h | 96 h | 120 h | ||
|---|---|---|---|---|---|---|
| Global model | ECMWF-IFS | 63.5 (164) | 125.2 (128) | 186.2 (98) | 270.6 (71) | 297.3 (50) |
| JMA-GSM | 99.0 (293) | 201.5 (228) | 307.1 (171) | 362.3 (126) | 399.5 (88) | |
| NCEP-GFS | 73.7 (340) | 138.4 (267) | 247.1 (199) | 298.2 (137) | 348.6 (97) | |
| UKMO-MetUM | 75.8 (171) | 141.8 (132) | 221.8 (96) | 305.5 (67) | 357.0 (47) | |
| CMA-GFS | 119.2 (252) | 140.7 (154) | 254.6 (162) | 317.7 (128) | 376.2 (102) | |
| Regional model | GRAPES-TCM | 107.3 (164) | 206.9 (135) | 317.7 (109) | / | / |
| CMA-TYM | 88.0 (360) | 158.7 (287) | 255.1 (217) | 356.6 (150) | 417.9 (105) | |
| CMA-TRAMS | 69.6 (174) | 130.7 (138) | 206.3 (105) | / | / | |
| HWRF | 106.4 (108) | 155.2 (89) | 239.0 (65) | 293.7 (46) | 311.6 (39) | |
Table 3.
Year-to-year error reduction (ER) of DPE and F-test confidence level (FCL) of the global and regional models.
Table 3.
Year-to-year error reduction (ER) of DPE and F-test confidence level (FCL) of the global and regional models.
| 24 h | 48 h | 72 h | |||||
|---|---|---|---|---|---|---|---|
| ER (km) | FCL (%) | ER (km) | FCL (%) | ER (km) | FCL (%) | ||
| Global model | ECMWF-IFS | −1.0 | <90 | −2.3 | 90 | −3.4 | 90 |
| JMA-GSM | −3.5 | 99 | −4.6 | 99 | −9.9 | 99 | |
| NCEP-GFS | −2.8 | 95 | −4.7 | 90 | −6.2 | <90 | |
| UKMO-MetUM | −4.7 | 99 | −6.7 | 95 | −9.6 | 95 | |
| CMA-GFS | / | / | / | / | / | / | |
| Regional model | GRAPES-TCM | −4.6 | 99 | −11.0 | 99 | −20.5 | 99 |
| CMA-TYM | 0.9 | <90 | 6.4 | 90 | 1.0 | <90 | |
| CMA-TRAMS | −3.9 | 99 | −6.8 | 99 | −12.5 | 95 | |
| HWRF | 3.7 | <90 | 0.8 | <90 | 0.9 | <90 | |
Disclaimer/Publisher’s Note: The statements, opinions and data contained in all publications are solely those of the individual author(s) and contributor(s) and not of MDPI and/or the editor(s). MDPI and/or the editor(s) disclaim responsibility for any injury to people or property resulting from any ideas, methods, instructions or products referred to in the content. |
© 2023 by the authors. Licensee MDPI, Basel, Switzerland. This article is an open access article distributed under the terms and conditions of the Creative Commons Attribution (CC BY) license (https://creativecommons.org/licenses/by/4.0/).
Share and Cite
MDPI and ACS Style
Chen, G.; Li, T.; Yang, M.; Zhang, X. Evaluation of Western North Pacific Typhoon Track Forecasts in Global and Regional Models during the 2021 Typhoon Season. Atmosphere 2023, 14, 499. https://doi.org/10.3390/atmos14030499
AMA Style
Chen G, Li T, Yang M, Zhang X. Evaluation of Western North Pacific Typhoon Track Forecasts in Global and Regional Models during the 2021 Typhoon Season. Atmosphere. 2023; 14(3):499. https://doi.org/10.3390/atmos14030499
Chicago/Turabian StyleChen, Guomin, Tim Li, Mengqi Yang, and Xiping Zhang. 2023. "Evaluation of Western North Pacific Typhoon Track Forecasts in Global and Regional Models during the 2021 Typhoon Season" Atmosphere 14, no. 3: 499. https://doi.org/10.3390/atmos14030499
Note that from the first issue of 2016, this journal uses article numbers instead of page numbers. See further details here.