

Centennial Variation and Mechanism of the Extreme High Temperatures in Summer over China during the Holocene Forced by Total Solar Irradiance

Abstract
:1. Introduction
2. Data and Methods
3. Results
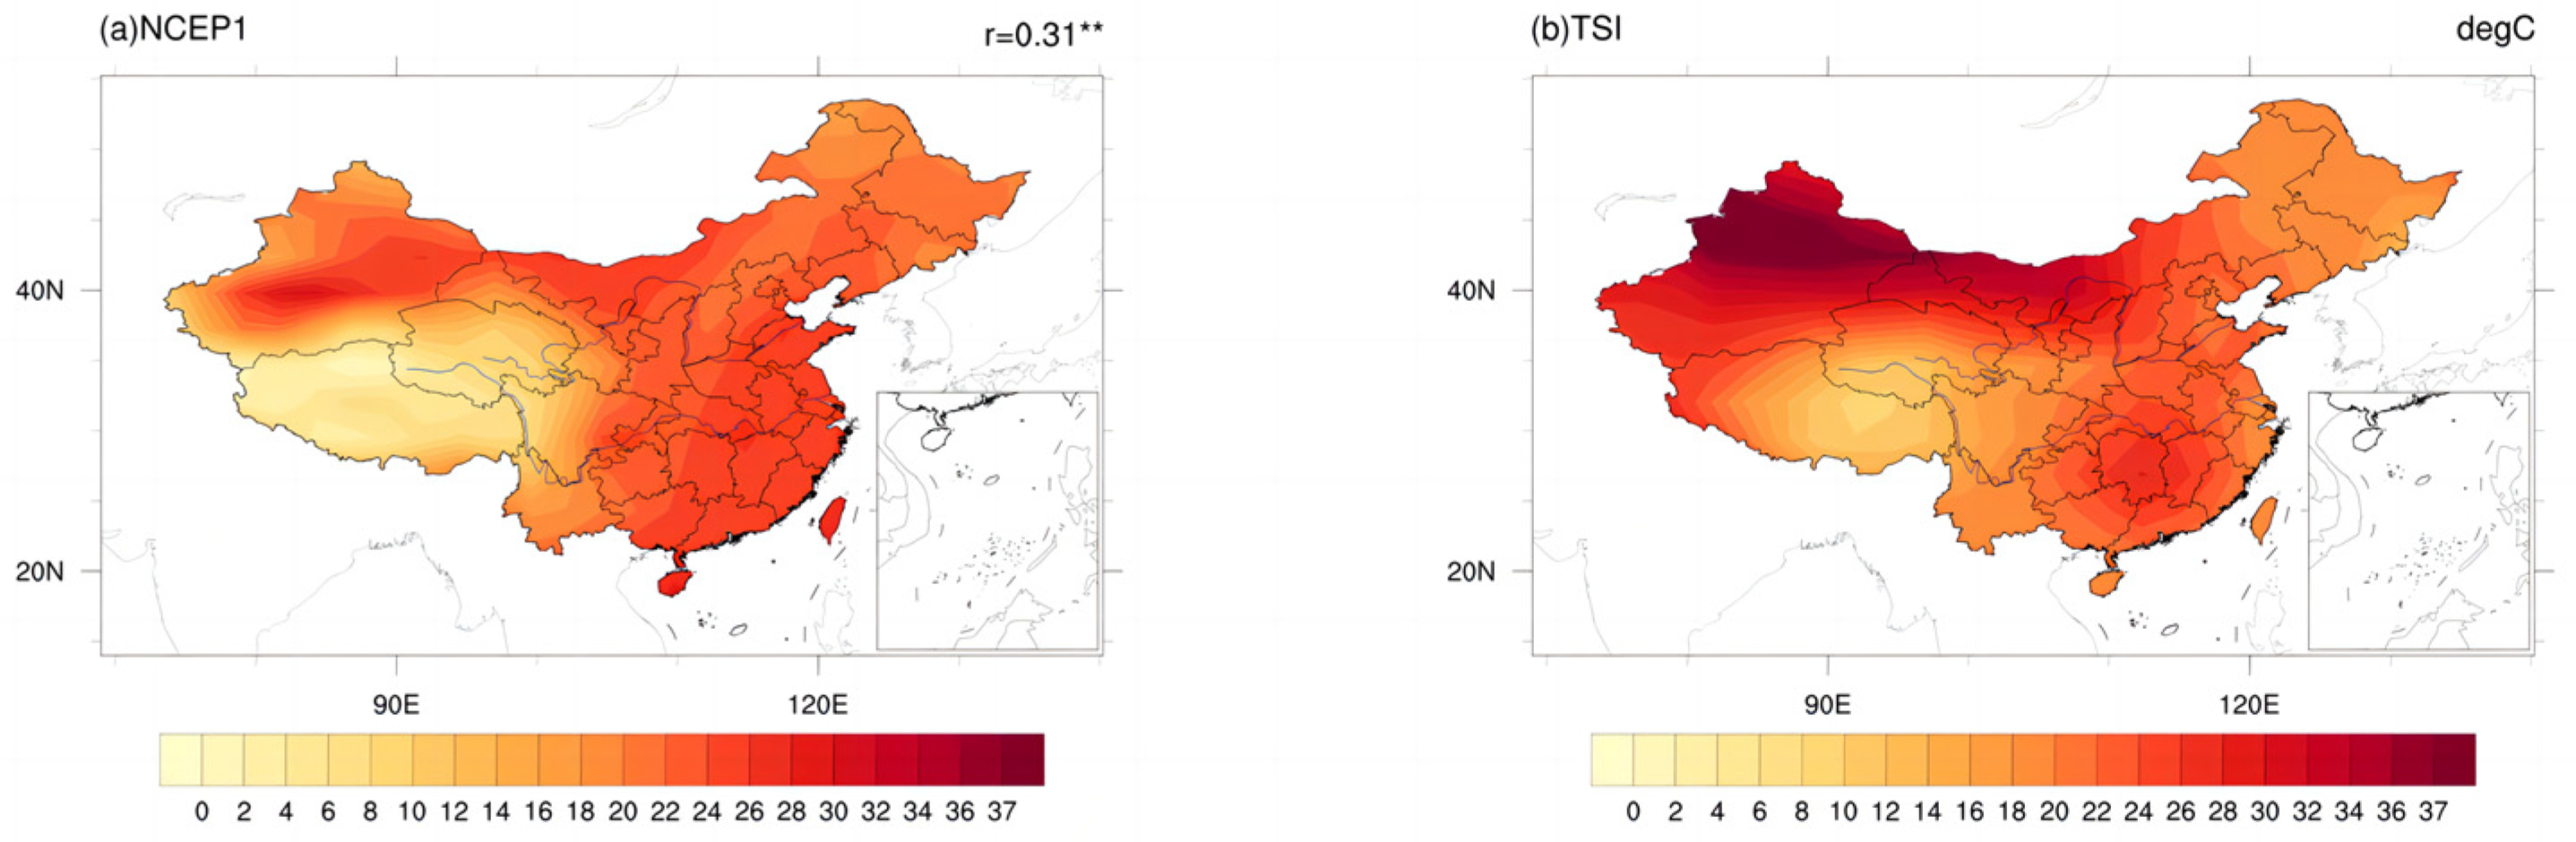
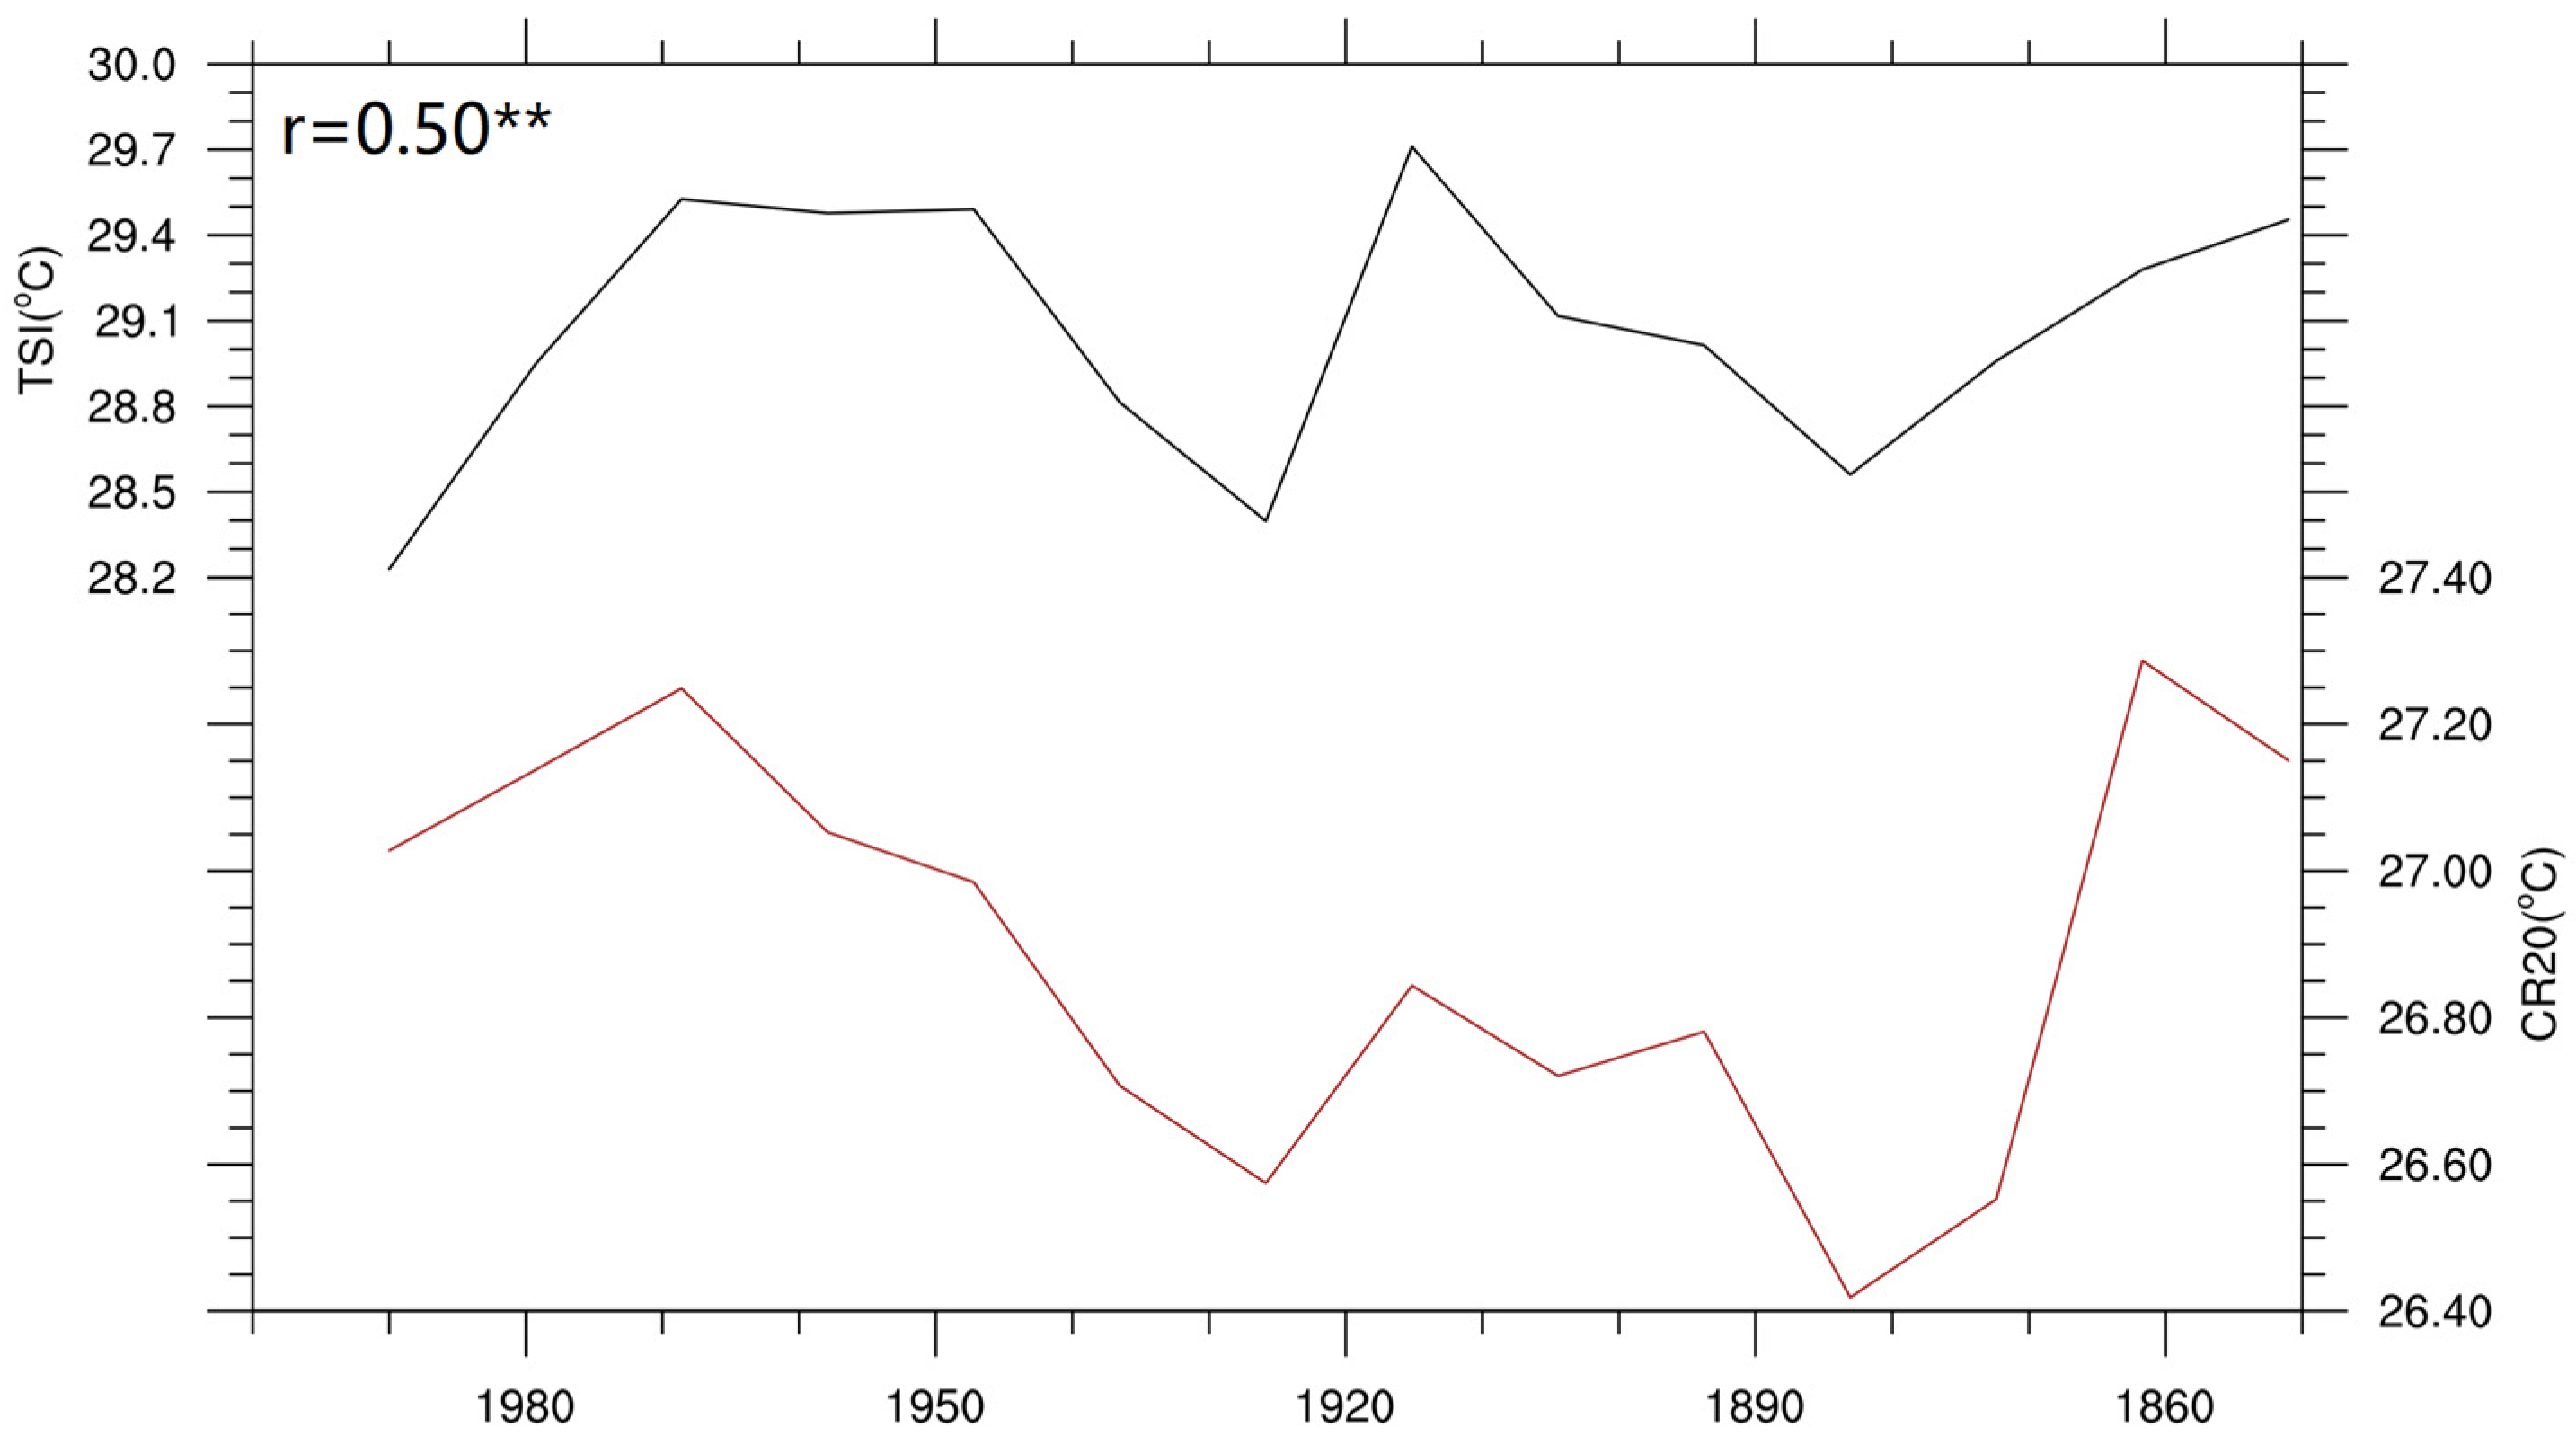
3.1. Verification of Model Simulation Results
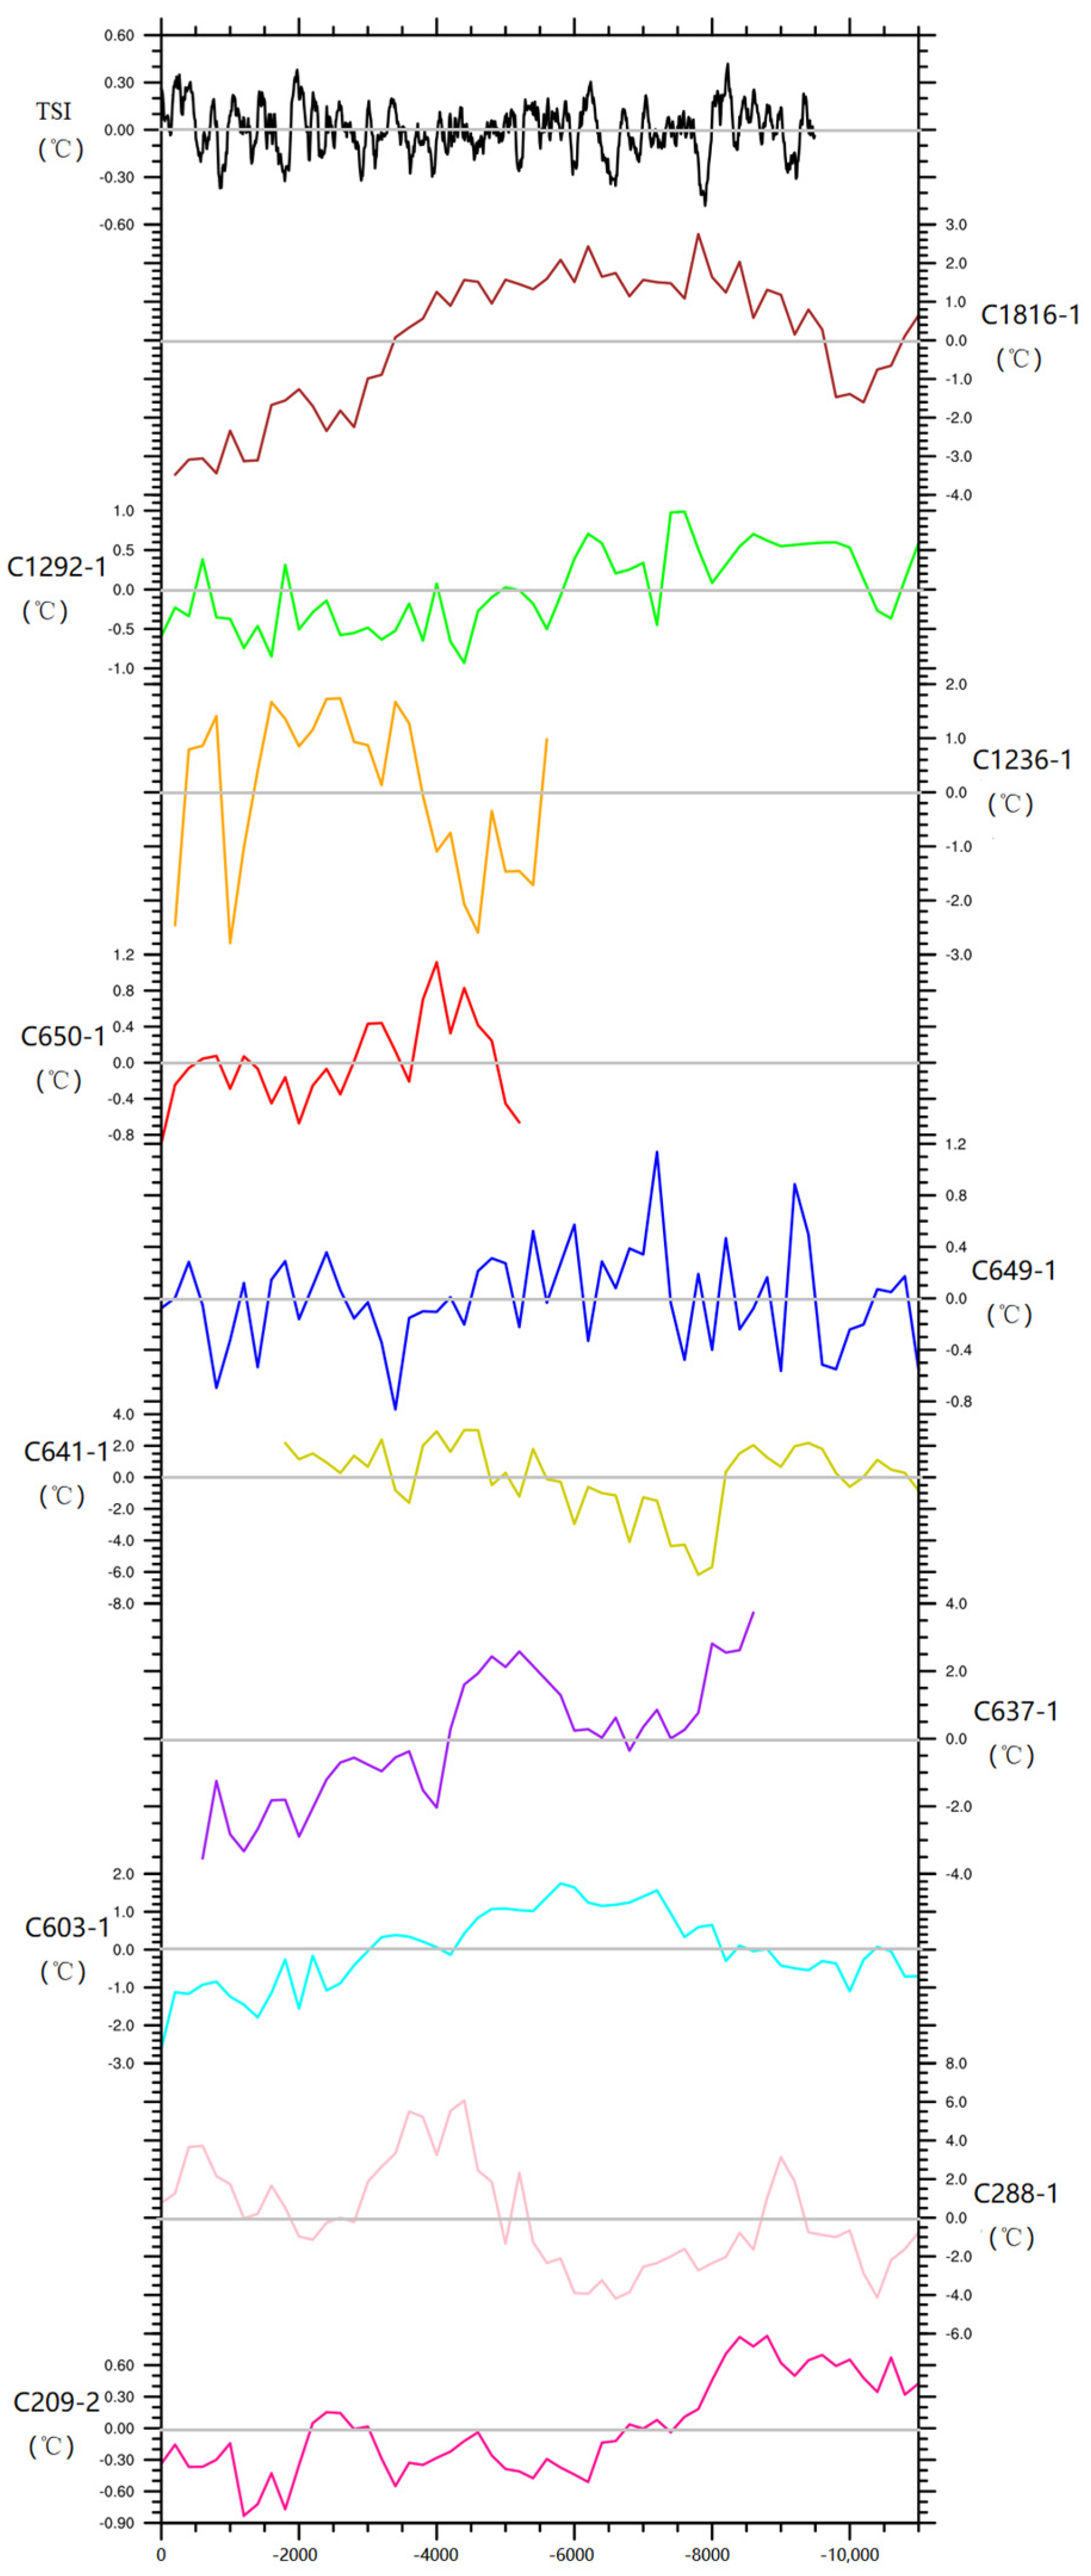
3.2. Characteristics
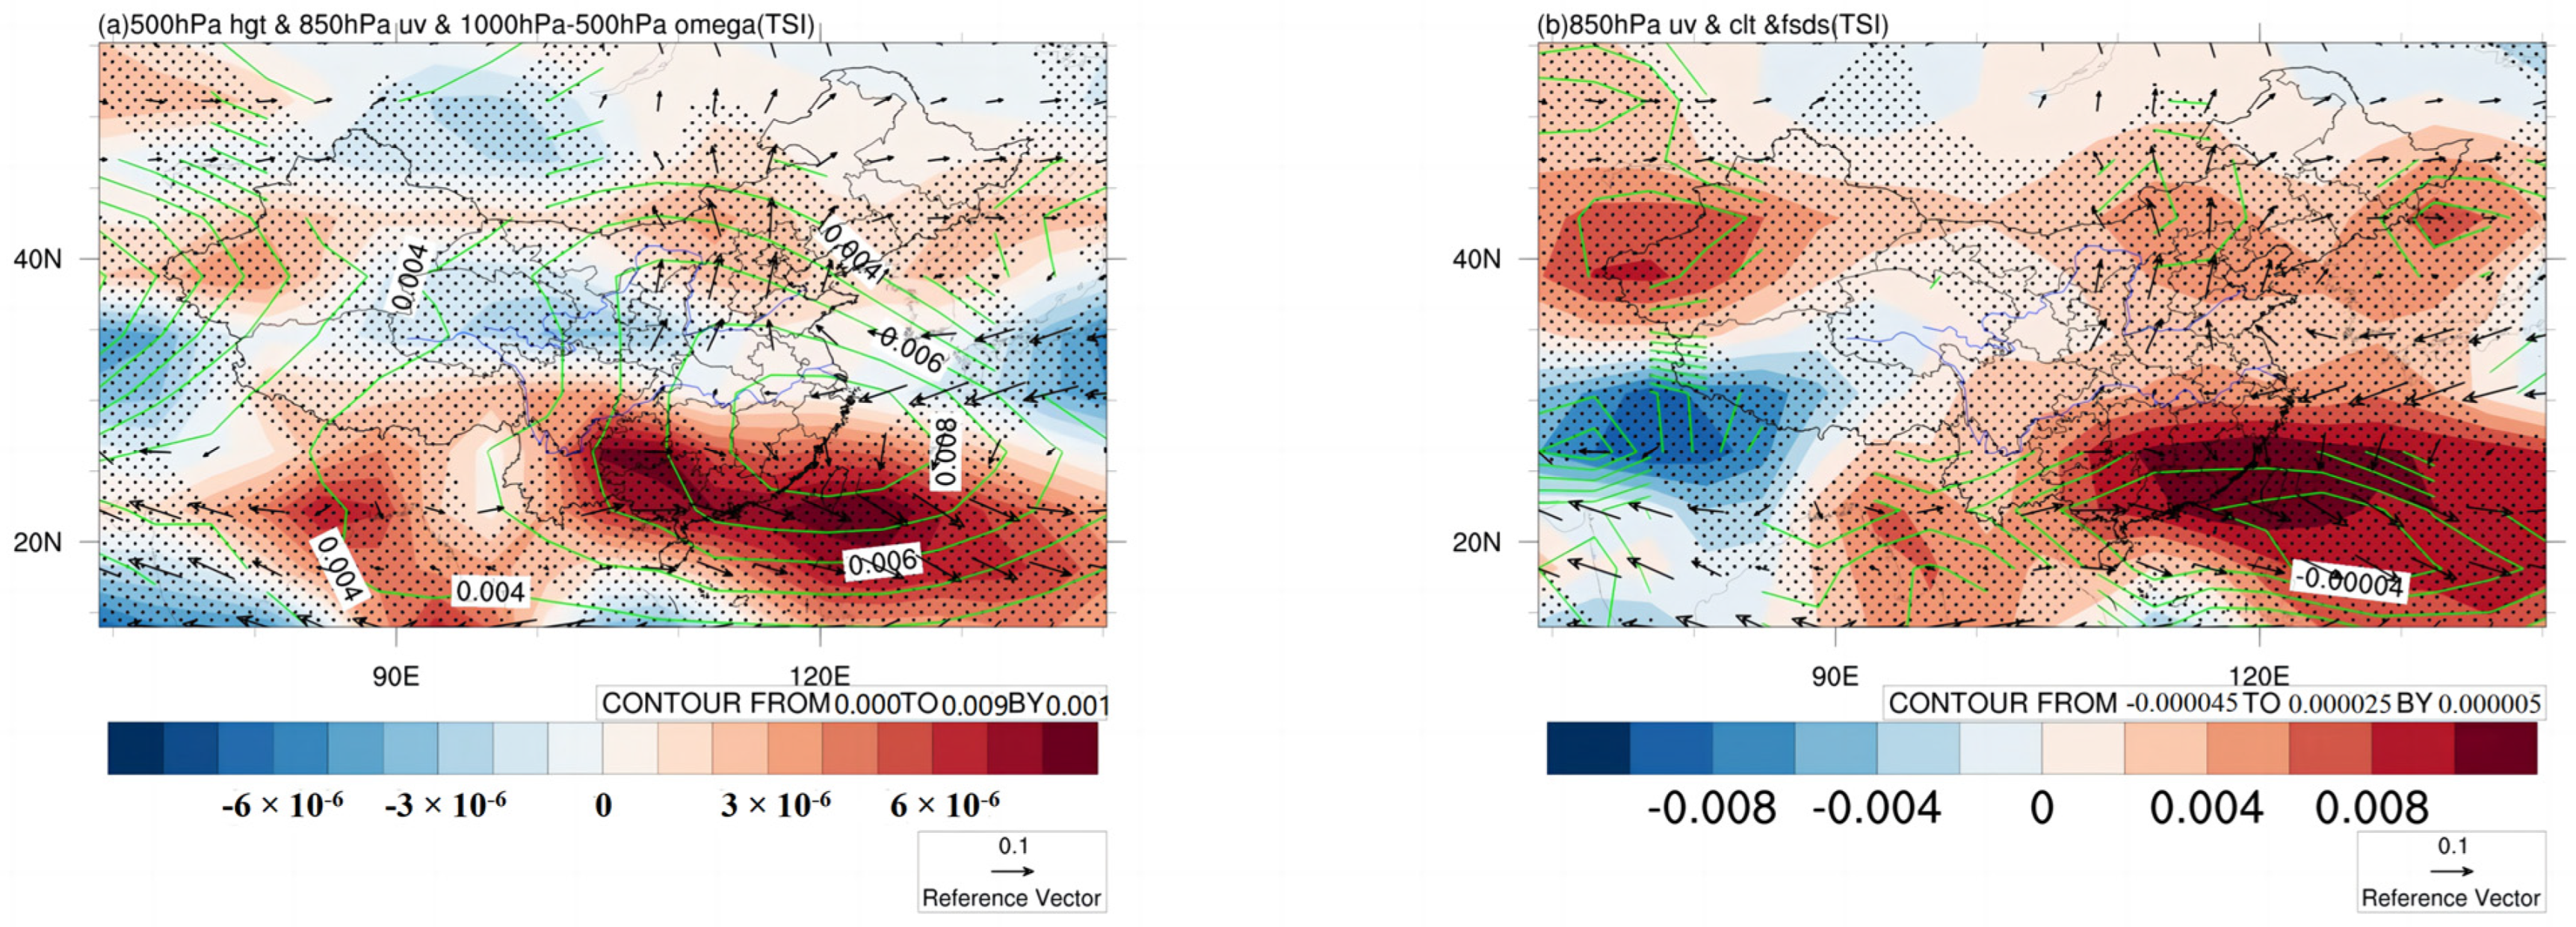
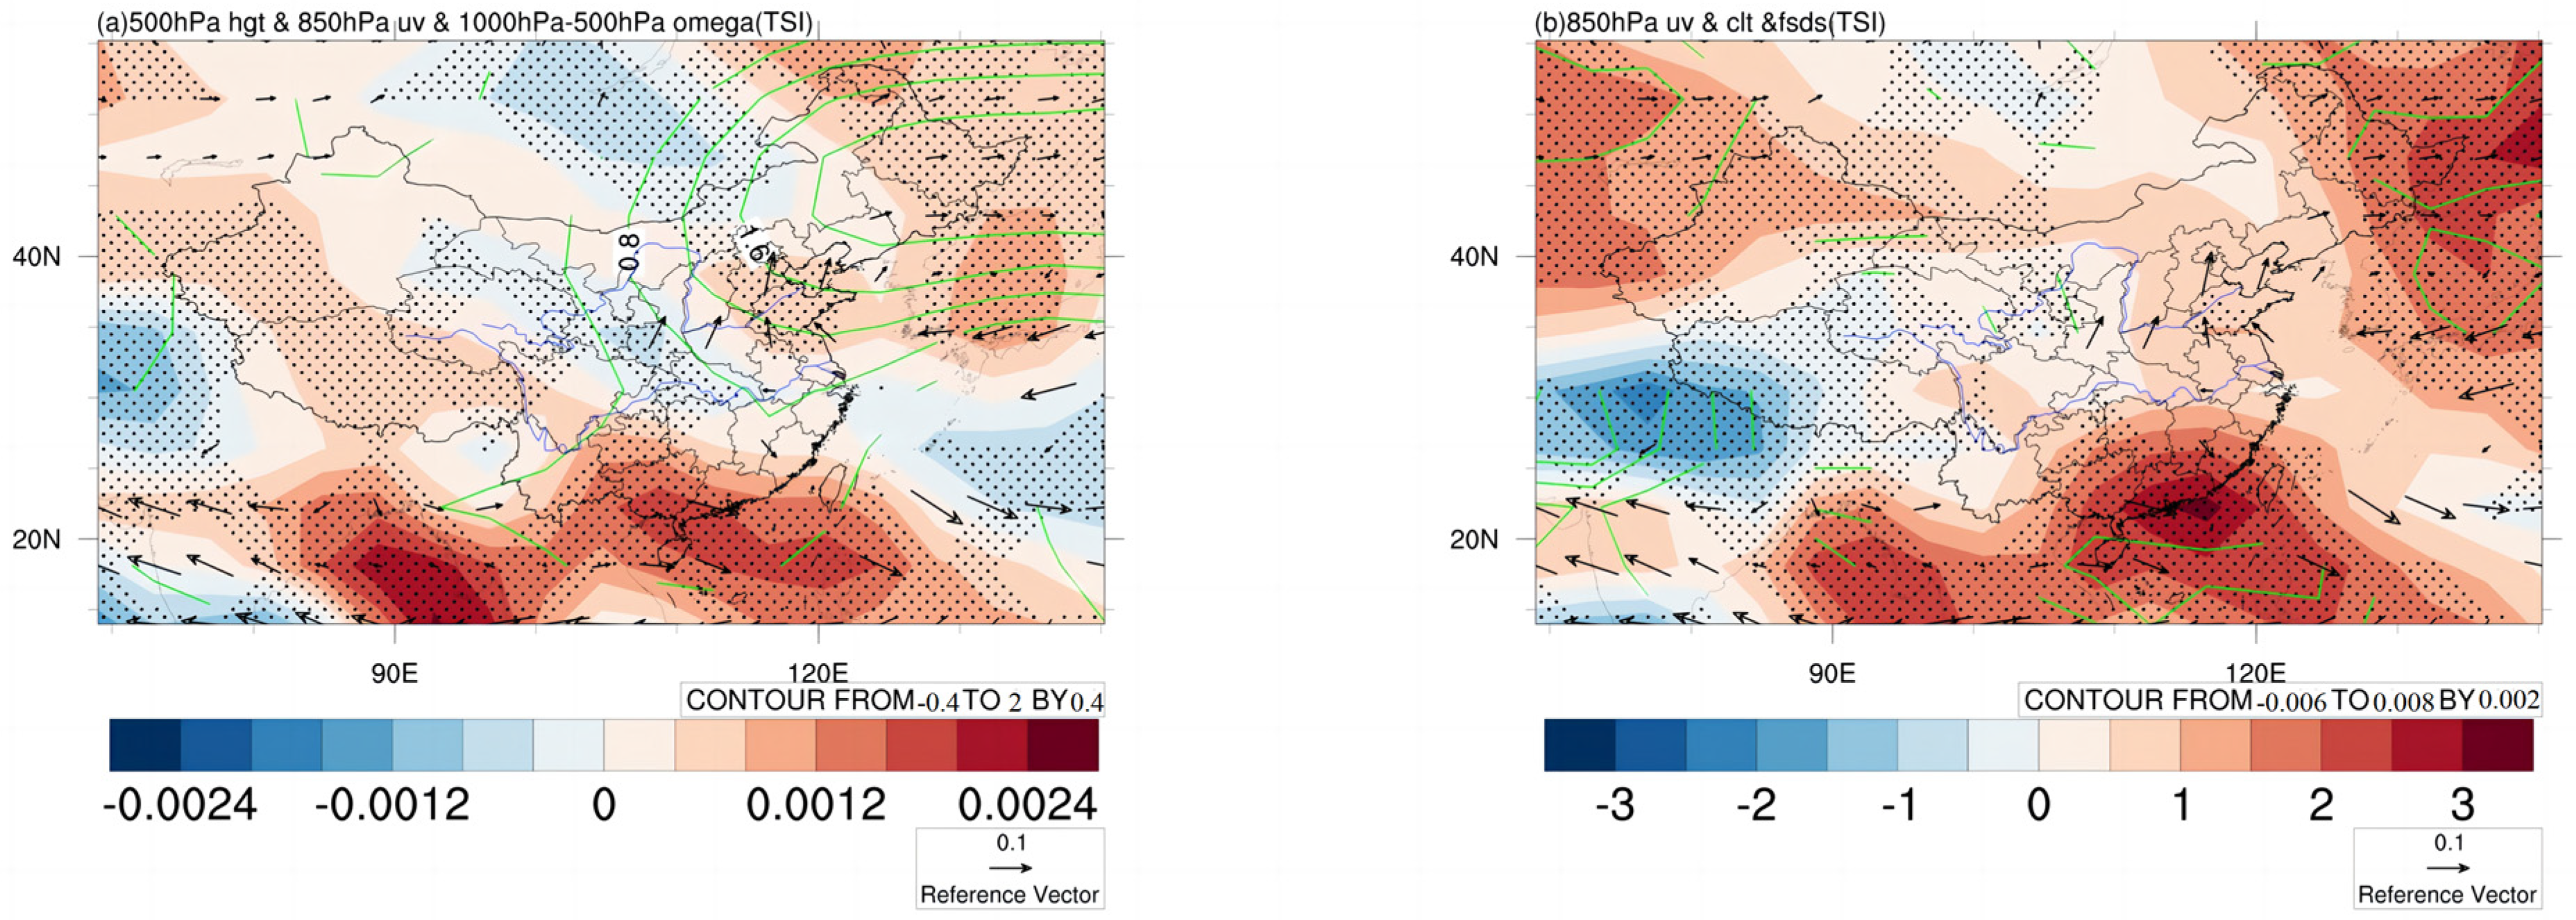
3.3. Physical Mechanisms
4. Discussion
5. Conclusions
Author Contributions
Funding
Data Availability Statement
Conflicts of Interest
References
- Easterling, D.R.; Meehl, G.A.; Parmesan, C.; Changnon, S.A.; Karl, T.R.; Mearns, L.O. Climate extremes: Observations, modeling, and impacts. Science 2000, 289, 2068–2074. [Google Scholar] [PubMed] [Green Version]
- Meehl, G.A.; Tebaldi, C. More intense, more frequent, and longer lasting heat waves in the 21st century. Science 2004, 305, 994. [Google Scholar] [CrossRef] [PubMed] [Green Version]
- IPCC. Climate Change 2021: The Physical Science Basis [M/OL]. 2021. Available online: https://www.ipcc.ch/report/ar6/wg1/downloads/report/IPCC_AR6_WGI_Full_Report.pdf (accessed on 24 June 2023).
- Ge, Q.; Liu, J.; Fang, X.; Yang, B.; Hao, Z.; Shao, X.; Zheng, J. General characteristics of temperature change and centennial warm periods during the past 2000 years. Acta Geogr. Sin. 2013, 68, 579–592. [Google Scholar]
- IPCC. Climate Change 2013: The Physical Science Basis [M/OL]; In Press; Cambridge University Press: Cambridge, UK, 2013; Available online: https://www.ipcc.ch/report/ar5/wg1/ (accessed on 24 June 2023).
- Dahe, Q.; Stocker, T. Highlights of the IPCC Working Group I Fifth Assessment Report. Clim. Chang. Res. 2014, 10, 1. [Google Scholar]
- Marcott, S.A.; Shakun, J.D.; Clark, P.U.; Mix, A.C. A reconstruction of regional and global temperature for the past 11,300 years. Science 2013, 399, 1198–1201. [Google Scholar] [CrossRef] [Green Version]
- Fang, X.; Hou, G. Synthetically reconstructed Holocene temperature change in China. Sci. Geogr. Sin. 2011, 31, 385–393. [Google Scholar]
- Wu, H.; Li, Q.; Yu, Y.; Jiang, W.; Lin, Y.; Sun, A.; Luo, Y. Quantitative climate reconstruction in China during the mid-Holocene. Quat. Sci. 2017, 37, 982–998. [Google Scholar] [CrossRef]
- Xiaoying, P.; Wei, Z.; Yinjuan, Z. Preliminary research in the Holocene Hypsithermal climate change. J. S. China Norm. Univ. Nat. Sci. Ed. 2005, 2, 52–60. [Google Scholar]
- Wang, S.; Gong, D. The temperature of China in several characteristic periods of the Holocene. Prog. Nat. Sci. 2000, 10, 325–332. (In Chinese) [Google Scholar]
- Ge, Q.; Wang, S.; Zheng, J. Reconstruction of China’s temperature change sequence in the past 5000 years. Prog. Nat. Sci. 2006, 16, 689–696. (In Chinese) [Google Scholar]
- Hou, G.; Fang, X. Characteristics of Holocene Temperature Change in China. Prog. Geogr. 2011, 30, 1075–1080. [Google Scholar]
- Chen, X.; Xu, Y.; Xu, C.; Yao, Y. Assessment of Precipitation Simulations in China by CMIP5 Multi-models. Clim. Chang. Res. 2014, 10, 217–225. [Google Scholar]
- Taylor, K.E.; Stouffer, R.J.; Meehl, G.A. An overview of CMIP5 and the experiment design. Bull. Am. Meteorol. Soc. 2012, 93, 485–498. [Google Scholar] [CrossRef] [Green Version]
- Jiang, D.; Tian, Z. Last Glacial Maximum and mid-Holocene water vapor transport over East Asia: A modeling study. Quat. Sci. 2017, 37, 999–1008. [Google Scholar] [CrossRef]
- Wang, Z.; Wang, J.; Zhang, S.; Li, K.; Zuo, R.; Liu, J. Impact of different timescales on the characteristics and mechanisms of the Northern Hemisphere Summer Monsoon: Based on the CESM results. Quat. Sci. 2018, 38, 1494–1506. [Google Scholar] [CrossRef]
- Ren, X.; Shi, Z.G. Response of global temperature extremes in mid-Holocene: Results from MPI-ESM-P experiments. J. Earth Environ. 2019, 10, 465–478. [Google Scholar]
- He, F. Simulating Transient Climate Evolution of the Last deglaciation with CCSM3, Doctor of Philosophy, Atmospheric and Oceanic Sciences; University of Wisconsin: Madison, WI, USA, 2011; p. 161. [Google Scholar]
- Yan, M.; Liu, J. Physical processes of cooling and mega-drought during the 4.2 ka bp event: Results from trace-21 ka simulations. Clim. Past 2019, 15, 265–277. [Google Scholar] [CrossRef] [Green Version]
- Morrill, C.; Overpeck, J.T.; Cole, J.E. A synthesis of abrupt changes in the Asian summer monsoon since the last deglaciation. Holocene 2003, 13, 465–476. [Google Scholar] [CrossRef]
- Berkelhammer, M.; Sinha, A.; Mudelsee, M.; Cheng, G.D.; Edwards, R.L.; Cannariato, K. Persistent multidecadal power of the Indian Summer Monsoon. Earth Planet. Sci. Lett. 2010, 290, 166–172. [Google Scholar] [CrossRef]
- Fleitmann, D.; Burns, S.J.; Mudelsee, M.; Neff, U.; Kramers, J.; Mangini, A.; Matter, A. Holocene forcing of the Indian monsoon recorded in a stalagmite from Southern Oman. Science 2003, 300, 1737–1739. [Google Scholar] [CrossRef] [Green Version]
- Wang, Y.J.; Cheng, H.; Edwards, R.L.; He, Y.Q.; Kong, X.G.; An, Z.S.; Wu, J.Y.; Kelly, M.J.; Dykoski, C.A.; Li, X.D. The Holocene Asian monsoon: Links to solar changes and North Atlantic climate. Science 2005, 308, 854–857. [Google Scholar] [CrossRef]
- Knudsen, M.F.; Seidenkrantz, M.-S.; Jacobsen, B.H.; Kuijpers, A. Tracking the Atlantic Multidecadal Oscillation through the last 8000 years. Nat. Commun. 2011, 2, 178. [Google Scholar] [CrossRef] [Green Version]
- Feng, S.; Hu, Q.; Oglesby, R.J. AMO-like variations of Holocene sea surface temperatures in the North Atlantic Ocean. Clim. Past Discuss. 2009, 5, 2465–2496. [Google Scholar]
- Conroy, J.L.; Hudson, A.M.; Overpeck, J.T.; Liu, K.B. The primacy of multidecadal to centennial variability over late-Holocene forced change of the Asian Monsoon on the southern Tibetan Plateau. Earth Planet. Sci. Lett. 2017, 458, 337–348. [Google Scholar] [CrossRef] [Green Version]
- Tan, L.; Cai, Y.; An, Z.; Cheng, H.; Yi, L.; Lawrence Edwards, R. High-resolution monsoon precipitation variations in southern Shaanxi, Central China during 4200~2000 a B.P. as revealed by speleothem δ18O and Sr/Ca records. Quat. Sci. 2014, 34, 1238–1245. [Google Scholar] [CrossRef]
- Herschel, W. Observations tending to investigate the nature of the sun, in order to find the causes or symptoms of its variable emission of light and heat; with remarks on the use that may possibly be drawn from solar observations. Proc. R. Soc. Lond. 1801, 91, 265–318. [Google Scholar]
- Laut, P.; Gundermann, J. Solar cycle length hypothesis appears to support the ipcc on global warming. J. Atmos. Sol. Terr. Phys. 1999, 60, 1719–1728. [Google Scholar] [CrossRef]
- Tung, K.K.; Camp, C.D. Solar cycle warming at the Earth’s surface in NCEP and ERA-40 data: A linear discriminant analysis. J. Geophys. Res. Atmos. 2008, 113, 1–11. [Google Scholar] [CrossRef] [Green Version]
- Haigh, J.D. The Impact of Solar Variability on Climate. Science 1996, 272, 981–984. [Google Scholar] [CrossRef]
- Meehl, G.A.; Arblaster, J.M.; Matthes, K.; Sassi, F.; van Loon, H. Amplifying the Pacific climate system response to a small 11-year solar cycle forcing. Science 2009, 325, 1114–1118. [Google Scholar] [CrossRef] [Green Version]
- Wang, B.; Zhou, T.; Yu, Y. A perspective on Earth system model development. Acta Meteorol. Sin. 2008, 66, 857–869. [Google Scholar] [CrossRef]
- Zheng, P.; Song, J.; Zhang, F.; Bao, X. Common instruction of some OGCM. Mar. Forecast. 2008, 25, 108–120. [Google Scholar] [CrossRef]
- Vieira LE, A.; Solanki, S.K.; Krivova, N.A.; Usoskin, I. Evolution of the solar irradiance during the Holocene. Astron. Astrophys. 2011, 531, A6. [Google Scholar] [CrossRef] [Green Version]
- Stebich, M.; Rehfeld, K.; Schlütz, F.; Tarasov, P.E. Corrigendum to “Holocene vegetation and climate dynamics of NE China based on the pollen record from Sihailongwan Maar Lake”. Quat. Sci. Rev. 2015, 124, 275–289. [Google Scholar] [CrossRef] [Green Version]
- Herzschuh, U.; Kramer, A.; Mischke, S.; Zhang, C. Quantitative climate and vegetation trends since the late glacial on the northeastern Tibetan Plateau deduced from Koucha Lake pollen spectra. Quat. Res. 2009, 71, 162–171. [Google Scholar] [CrossRef]
- Yu, S.-Y. Quantitative reconstruction of mid- to late-Holocene climate in NE China from peat cellulose stable oxygen and carbon isotope records and mechanistic models. Holocene 2013, 11, 1507–1516. [Google Scholar] [CrossRef]
- Chang, J.; Zhang, E.L.; Liu, E.F.; Shulmeister, J. Summer temperature variability inferred from subfossil chironomid assemblages from the south-east margin of the Qinghai-Tibetan Plateau for the last 5000 years. Holocene 2017, 27, 1876–1884. [Google Scholar] [CrossRef]
- Zhang, E.; Chang, J.; Cao, Y.; Sun, W.; Shulmeister, J. Holocene high-resolution quantitative summer temperature reconstruction based on subfossil chironomids from the southeast margin of the Qinghai-Tibetan Plateau. Quat. Sci. Rev. 2017, 165, 1–12. [Google Scholar] [CrossRef]
- Zhao, J.; An, C.B.; Huang, Y.; Morrill, C.; Chen, F.H. Contrasting early Holocene temperature variations between monsoonal East Asia and westerly dominated Central Asia. Quat. Sci. Rev. 2017, 178, 14–23. [Google Scholar]
- Zhao, C.; Liu, Z.; Rohling, E.J.; Yu, Z.; Liu, W.; He, Y.; Zhao, Y.; Chen, F. Holocene temperature fluctuations in the northern Tibetan Plateau. Quat. Res. 2013, 80, 55–65. [Google Scholar] [CrossRef]
- Wu, D.; Chen, X.; Lv, F.; Brenner, M.; Curtis, J.; Zhou, A. Decoupled early Holocene summer temperature and monsoon precipitation in southwest China. Quat. Sci. Rev. 2018, 193, 54–67. [Google Scholar] [CrossRef]
- Hou, J.H.J.; Huang, Y.H.Y.; Zhao, J.Z.J.; Liu, Z.; Colman, S.; An, Z. Large Holocene summer temperature oscillations and impact on the peopling of the northeastern Tibetan Plateau. Geophys. Res. Lett. 2016, 43, 1323–1330. [Google Scholar] [CrossRef] [Green Version]
- Wen, R.L.; Xiao, J.L.; Chang, Z.G.; Zhai, D.Y.; Xu, Q.H.; Li, Y.C.; Itoh, S. Holocene precipitation and temperature variations in the East Asian monsoonal margin from pollen data from Hulun Lake in northeastern Inner Mongolia, China. Boreas 2010, 39, 262–272. [Google Scholar] [CrossRef]
- Ding, Q.H.; Wang, B. Circumglobal teleconnection in the Northern Hemisphere summer. J. Clim. 2005, 18, 3483–3505. [Google Scholar] [CrossRef]


| Experiment Name | Abbreviation | Spatial Resolution | Time Resolution | Time |
|---|---|---|---|---|
| Control experiment | CTRL | 3.75° × 3.75° | 10a | 10,000 BC–1990 AD |
| Orbital experiment | ORB | 3.75° × 3.75° | 10a | 10,000 BC–1990 AD |
| Total solar irradiance and Orbital experiment | TSI_ORB | 3.75° × 3.75° | 10a | 9490 BC–1990 AD |
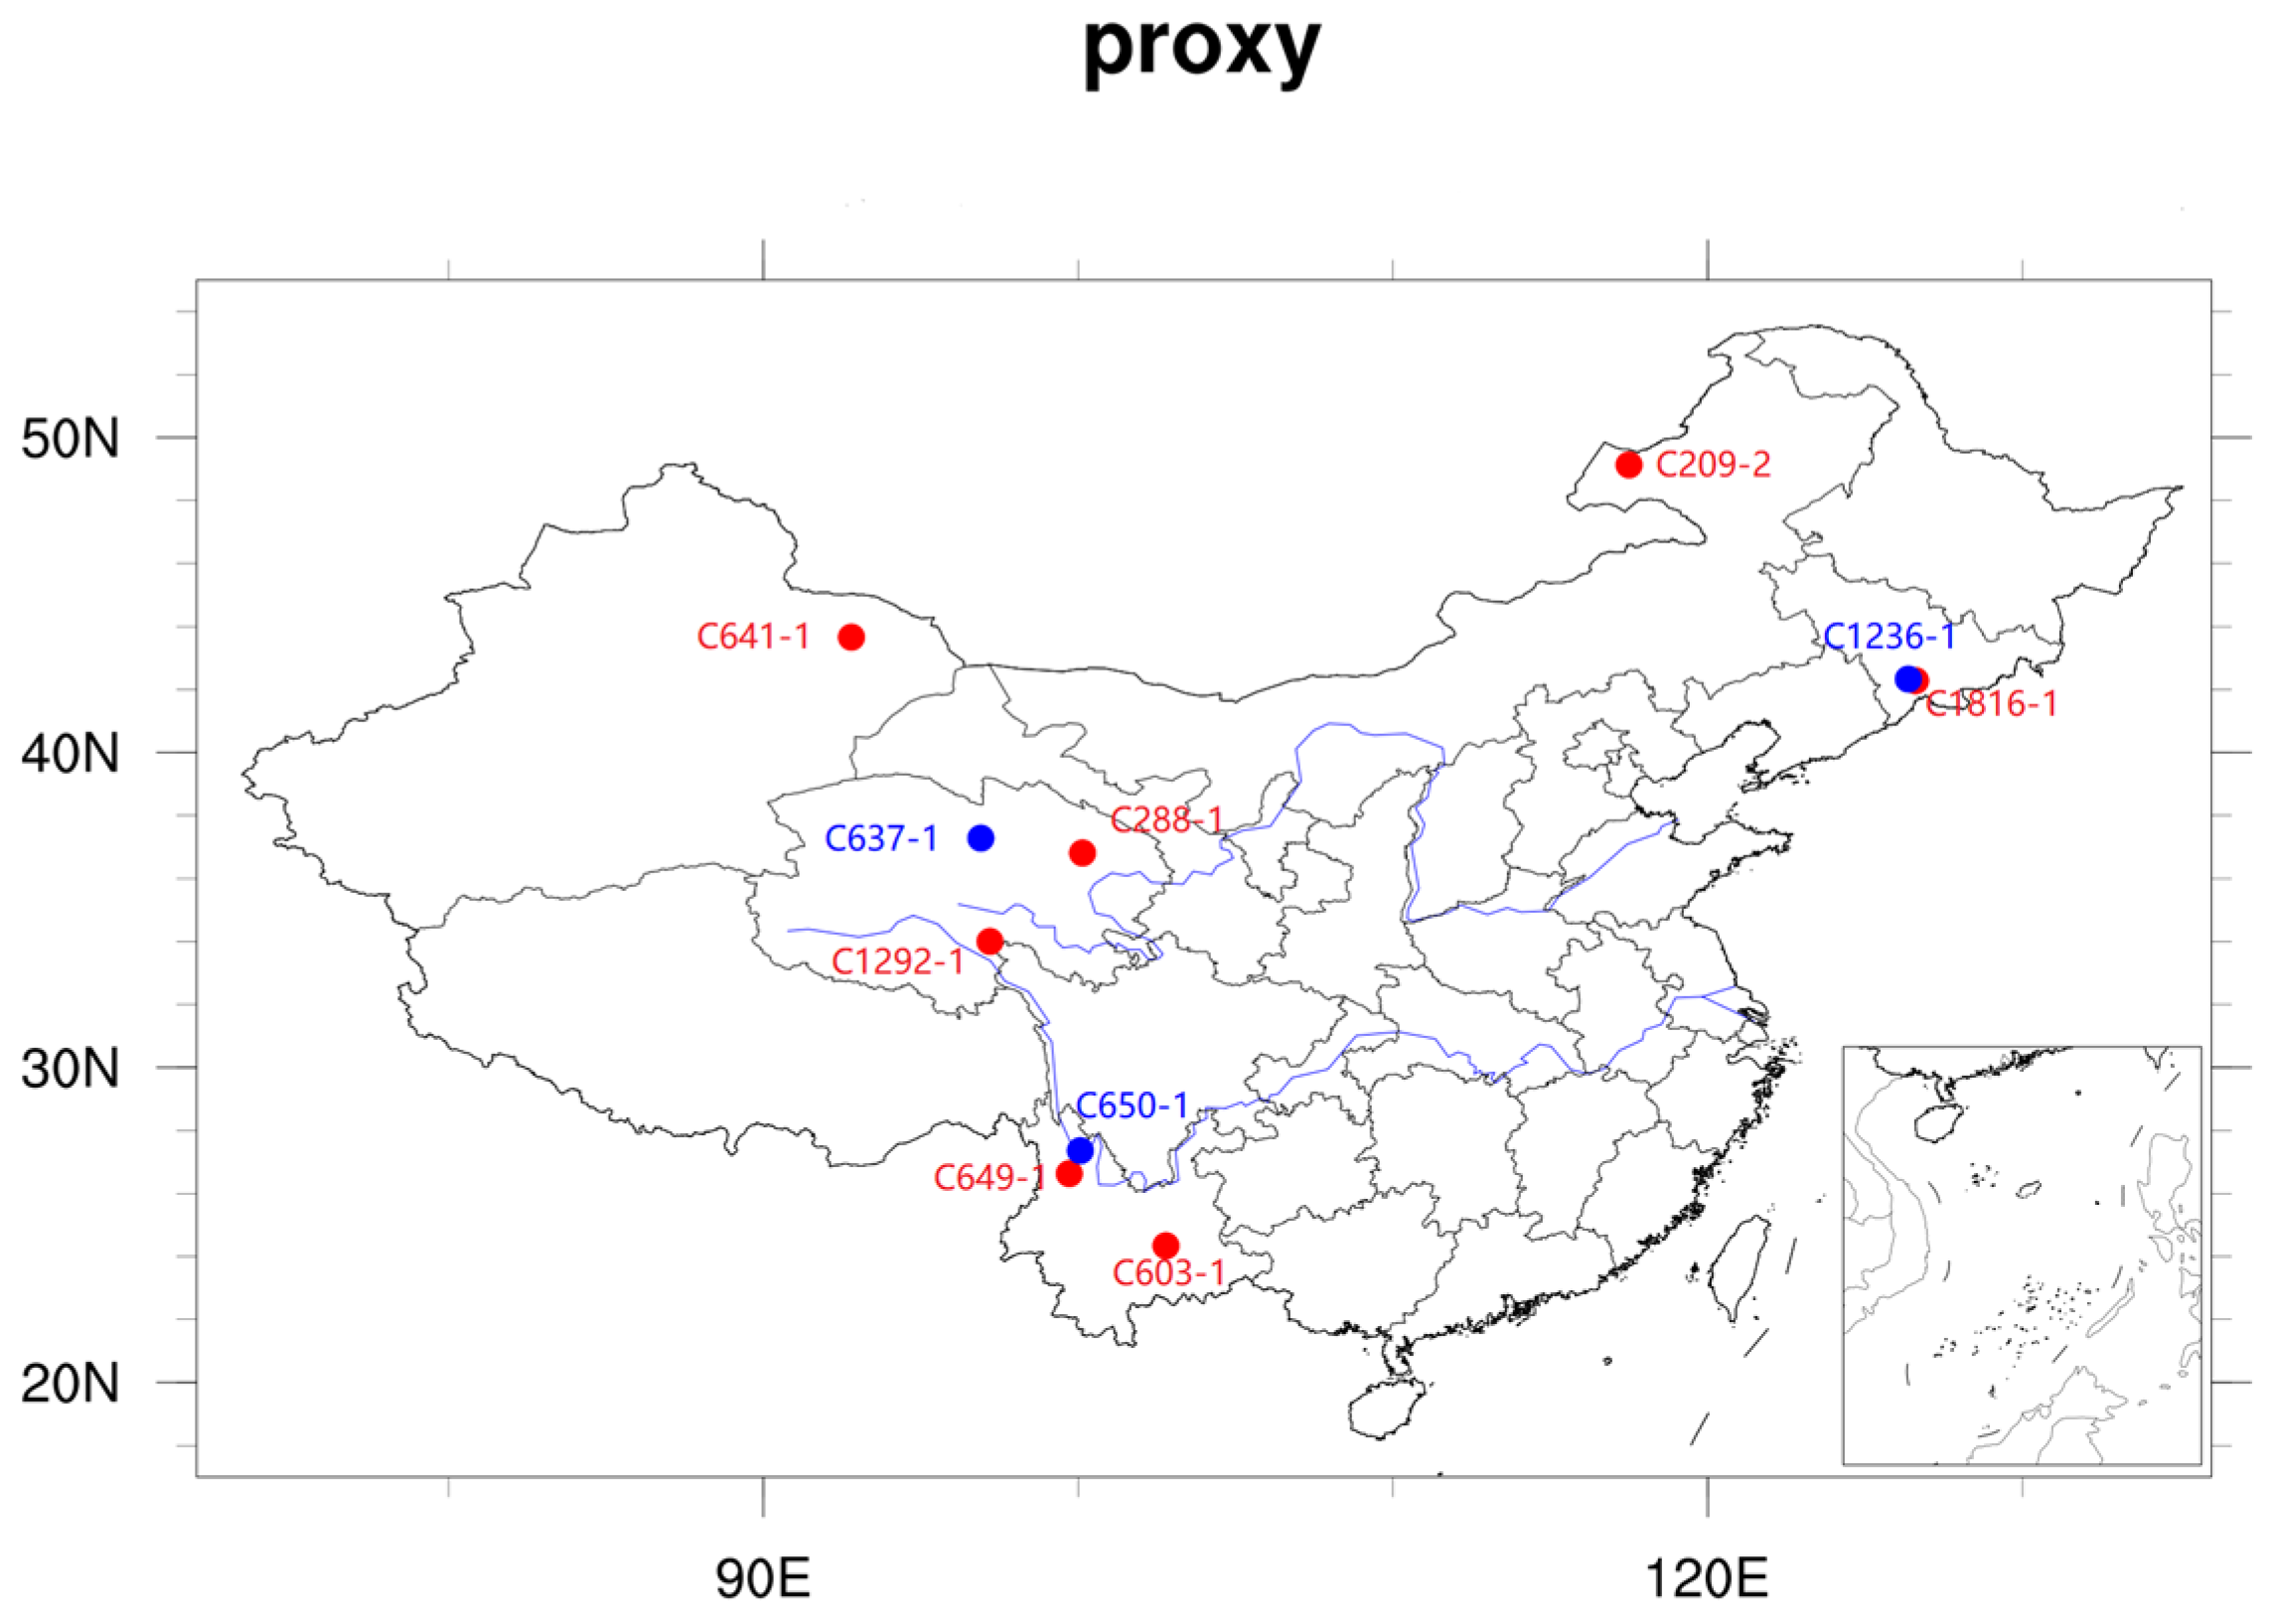
| ID | Lon & Lat | Time Resolution | Season | Time | Reference |
|---|---|---|---|---|---|
| C1816-1 | E 126.6, N 42.28 | 200a | summer | 11,000 BC–200 BC | Stebich M et al. (2015) [37] |
| C1292-1 | E 97.2, N 34 | 200a | summer | 11,000 BC–0 BC | Herzschuh U et al. (2009) [38] |
| C1236-1 | E 126.37, N 42.33 | 200a | summer | 5600 BC–200 BC | Shi-Yong Yu, (2013) [39] |
| C650-1 | E 100.07, N 27.36 | 200a | summer | 5200 BC–0 BC | Jie Chang et al. (2017) [40] |
| C649-1 | E 99.72, N 26.63 | 200a | summer | 11,000 BC–0 BC | Zhang E et al. (2017) [41] |
| C641-1 | E 92.8, N 43.66 | 200a | summer | 11,000 BC–1800 BC | Jiaju Zhao et al. (2017) [42] |
| C637-1 | E 96.91, N 37.28 | 200a | summer | 8600 BC–600 BC | Cheng Zhao et al. (2013) [43] |
| C603-1 | E 102.79, N 24.34 | 200a | summer | 11,000 BC–0 BC | Wu D et al. (2018) [44] |
| C288-1 | E 100.14, N 36.81 | 200a | summer | 11,000 BC–0 BC | Juzhi Hou et al. (2016) [45] |
| C209-2 | E 117.5, N 49.13 | 200a | summer | 11,000 BC–0 BC | Wen R.L. et al. (2010) [46] |
Disclaimer/Publisher’s Note: The statements, opinions and data contained in all publications are solely those of the individual author(s) and contributor(s) and not of MDPI and/or the editor(s). MDPI and/or the editor(s) disclaim responsibility for any injury to people or property resulting from any ideas, methods, instructions or products referred to in the content. |
© 2023 by the authors. Licensee MDPI, Basel, Switzerland. This article is an open access article distributed under the terms and conditions of the Creative Commons Attribution (CC BY) license (https://creativecommons.org/licenses/by/4.0/).
Share and Cite
Liu, L.; Sun, W.; Liu, J.; Wan, L. Centennial Variation and Mechanism of the Extreme High Temperatures in Summer over China during the Holocene Forced by Total Solar Irradiance. Atmosphere 2023, 14, 1207. https://doi.org/10.3390/atmos14081207
Liu L, Sun W, Liu J, Wan L. Centennial Variation and Mechanism of the Extreme High Temperatures in Summer over China during the Holocene Forced by Total Solar Irradiance. Atmosphere. 2023; 14(8):1207. https://doi.org/10.3390/atmos14081207
Chicago/Turabian StyleLiu, Lu, Weiyi Sun, Jian Liu, and Lingfeng Wan. 2023. "Centennial Variation and Mechanism of the Extreme High Temperatures in Summer over China during the Holocene Forced by Total Solar Irradiance" Atmosphere 14, no. 8: 1207. https://doi.org/10.3390/atmos14081207