Article

Investigating the Effect of Climate Change on Drought Propagation in the Tarim River Basin Using Multi-Model Ensemble Projections

1
State Key Laboratory of Desert and Oasis Ecology, Key Laboratory of Ecological Safety and Sustainable Development in Arid Lands, Xinjiang Institute of Ecology and Geography, Chinese Academy of Sciences, Urumqi 830011, China
2
University of Chinese Academy of Sciences, Beijing 100049, China
3
Faculty of Earth Sciences, University of Silesia in Katowice, 41-200 Sosnowiec, Poland
*
Author to whom correspondence should be addressed.
Atmosphere 2024, 15(1), 50; https://doi.org/10.3390/atmos15010050
Submission received: 29 November 2023 / Revised: 27 December 2023 / Accepted: 28 December 2023 / Published: 30 December 2023
(This article belongs to the Section Biosphere/Hydrosphere/Land–Atmosphere Interactions)

Abstract

:
Recent studies on China’s arid and semi-arid regions, particularly the Tarim River Basin (TRB), have shown an increase in the intensity and frequency of extreme weather events. This research examines the link between meteorological droughts, as measured by the Standardized Precipitation Evapotranspiration Index (SPEI), and hydrological droughts, as indicated by the Standardized Runoff Index (SRI) and the Standardized Terrestrial Water Storage Index (STI), over various time scales. Historical data indicate that SPEI drought frequency (DF) was 14.3–21.9%, with prevalent events in the northern oases. SRI DF ranged from 9.0% to 35.8%, concentrated around the Taklamakan and Kumtag Deserts, while STI DF varied between 4.4% and 32.7%, averaging 15% basin-wide. Future projections show an increased DF of SPEI in deserts and a decrease in oases; SRI DF decreased in deserts but increased in oases. STI changes were more moderate. The study also found a higher risk of drought progression from SPEI to SRI in the southwestern and northeastern oases, exceeding 50% probability, while central and eastern TRB had lower risks. The western TRB and inner Taklamakan Desert faced higher risks of SPEI to STI progression, with probabilities over 45%, in contrast to the lower risks in the eastern and central oases. The concurrence of SRI/STI with moderate to extreme SPEI droughts led to a higher probability and area of SRI/STI droughts, whereas consistent SPEI types showed a reduced induced probability and extent of SRI/STI droughts. This study enhances the understanding of drought propagation from meteorological to hydrological droughts in the TRB and contributes to the prevention of hydrological drought to a certain extent.

1. Introduction

Within the context of evolving climatic patterns, the scope of land affected by droughts is on a continuous upswing. This trend is characterized not only by its persistence but also by an escalation in its severity, particularly evidenced by the increasingly frequent manifestation of extensive and acute drought incidents [1]. Droughts rank among the foremost natural catastrophes, distinguished by their broad and enduring detrimental effects on ecosystems, societal structures, and economic stability [2]. Scholarly investigations into historical drought patterns have discerned four distinct classifications, delineated by the interplay between water availability and demand: meteorological, hydrological, agricultural, and socioeconomic droughts [3]. In the realm of these investigations, the criticality of water resource allocation coupled with the constraints posed by data scarcity in the context of socioeconomic evolution, has rendered meteorological and hydrological droughts as focal points of heightened scholarly intrigue.
Areas classified as arid or semi-arid are those where rainfall does not suffice to balance out the surface evaporation and vegetation transpiration [4]. These areas cover more than half of China’s land area [5]. Over the past several decades, an increase in both the occurrence and severity of extreme weather events has been observed in these regions of China, turning the climate anomalies of arid and semi-arid zones into a focal point of scientific research [6,7]. Notably, the Tarim River Basin (TRB) is located within this arid region of Northwest China. Presently, research concerning droughts in the TRB primarily revolves around devising distinct drought indices for various drought types, and evaluating the spatiotemporal variations of drought [8,9], with scant exploration into the interconnections among different types of droughts [10]. In reality, a close interrelation exists among varying drought types, with meteorological droughts often acting as the driver for other forms of drought. Meteorological droughts, induced by insufficient precipitation, impact the land surface, exerting varying degrees of effects on soil, vegetation, runoff, and groundwater, subsequently triggering hydrological drought [11]. Nevertheless, the temporal discrepancy inherent between meteorological and hydrological drought phases, coupled with the spatial heterogeneity of the underlying conditions and the climatic factors pertinent to hydrological droughts, constrains our understanding of drought progression. In the context of a warming globe, where climate alteration is predominantly driven by rising temperatures, it is both imperative and critical to explore the influence of these thermal increments on hydrological phenomena, particularly those related to meteorological drought-induced extremities. With a consensus on drought variability under changing phenomena, some studies have emerged to explore how droughts may evolve under different warming levels [12,13,14]. Nevertheless, research focusing on the progression of droughts, ranging from meteorological droughts of diverse intensities to hydrological droughts with varying severities, especially under various warming scenarios, is conspicuously lacking in the Xinjiang area of China. Insights gleaned from the datasets released by the sixth iteration of the Coupled Model Intercomparison Project (CMIP6) offer valuable data for scrutinizing the influence of climate change on drought dynamics. Emerging socioeconomic trajectories, encapsulated within Shared Socioeconomic Pathways (SSPs), are integrally aligned with Representative Concentration Pathways (RCPs) through unified policy presumptions, lending enhanced plausibility to prospective scenarios [15,16]. Five delineated SSP narratives—ranging from SSP1’s sustainability focus to SSP5’s fossil-fueled development—chart divergent yet possible trajectories of future societal evolutions, each posing distinct mitigation and adaptation quandaries.
The diffusion and evolution of drought from meteorological origins to hydrological impacts merit close scrutiny within the domain of water resource management. If drought propagation can be quantified, it becomes feasible to forecast hydrological droughts in a timely manner, based on known meteorological droughts, which would be significantly beneficial for water resource managers. Therefore, this research, which focuses on the Tarim River Basin, employs the Standardized Precipitation Evapotranspiration Index (SPEI) as a gauge for meteorological droughts. Concurrently, it utilizes the Terrestrial Water Storage Index (STI) and the Standardized Runoff Index (SRI) to quantify the hydrological deficit. This study, anchored in an analytical structure derived from three distinct drought indices, sets out to (1) unveil the characteristics and evolutionary trends of meteorological and hydrological droughts; (2) establish the transmission patterns of drought from meteorological phenomena to hydrological impacts; (3) predict the propagation of drought conditions within the purview of three CMIP6-informed future scenarios.

2. Study Area and Data
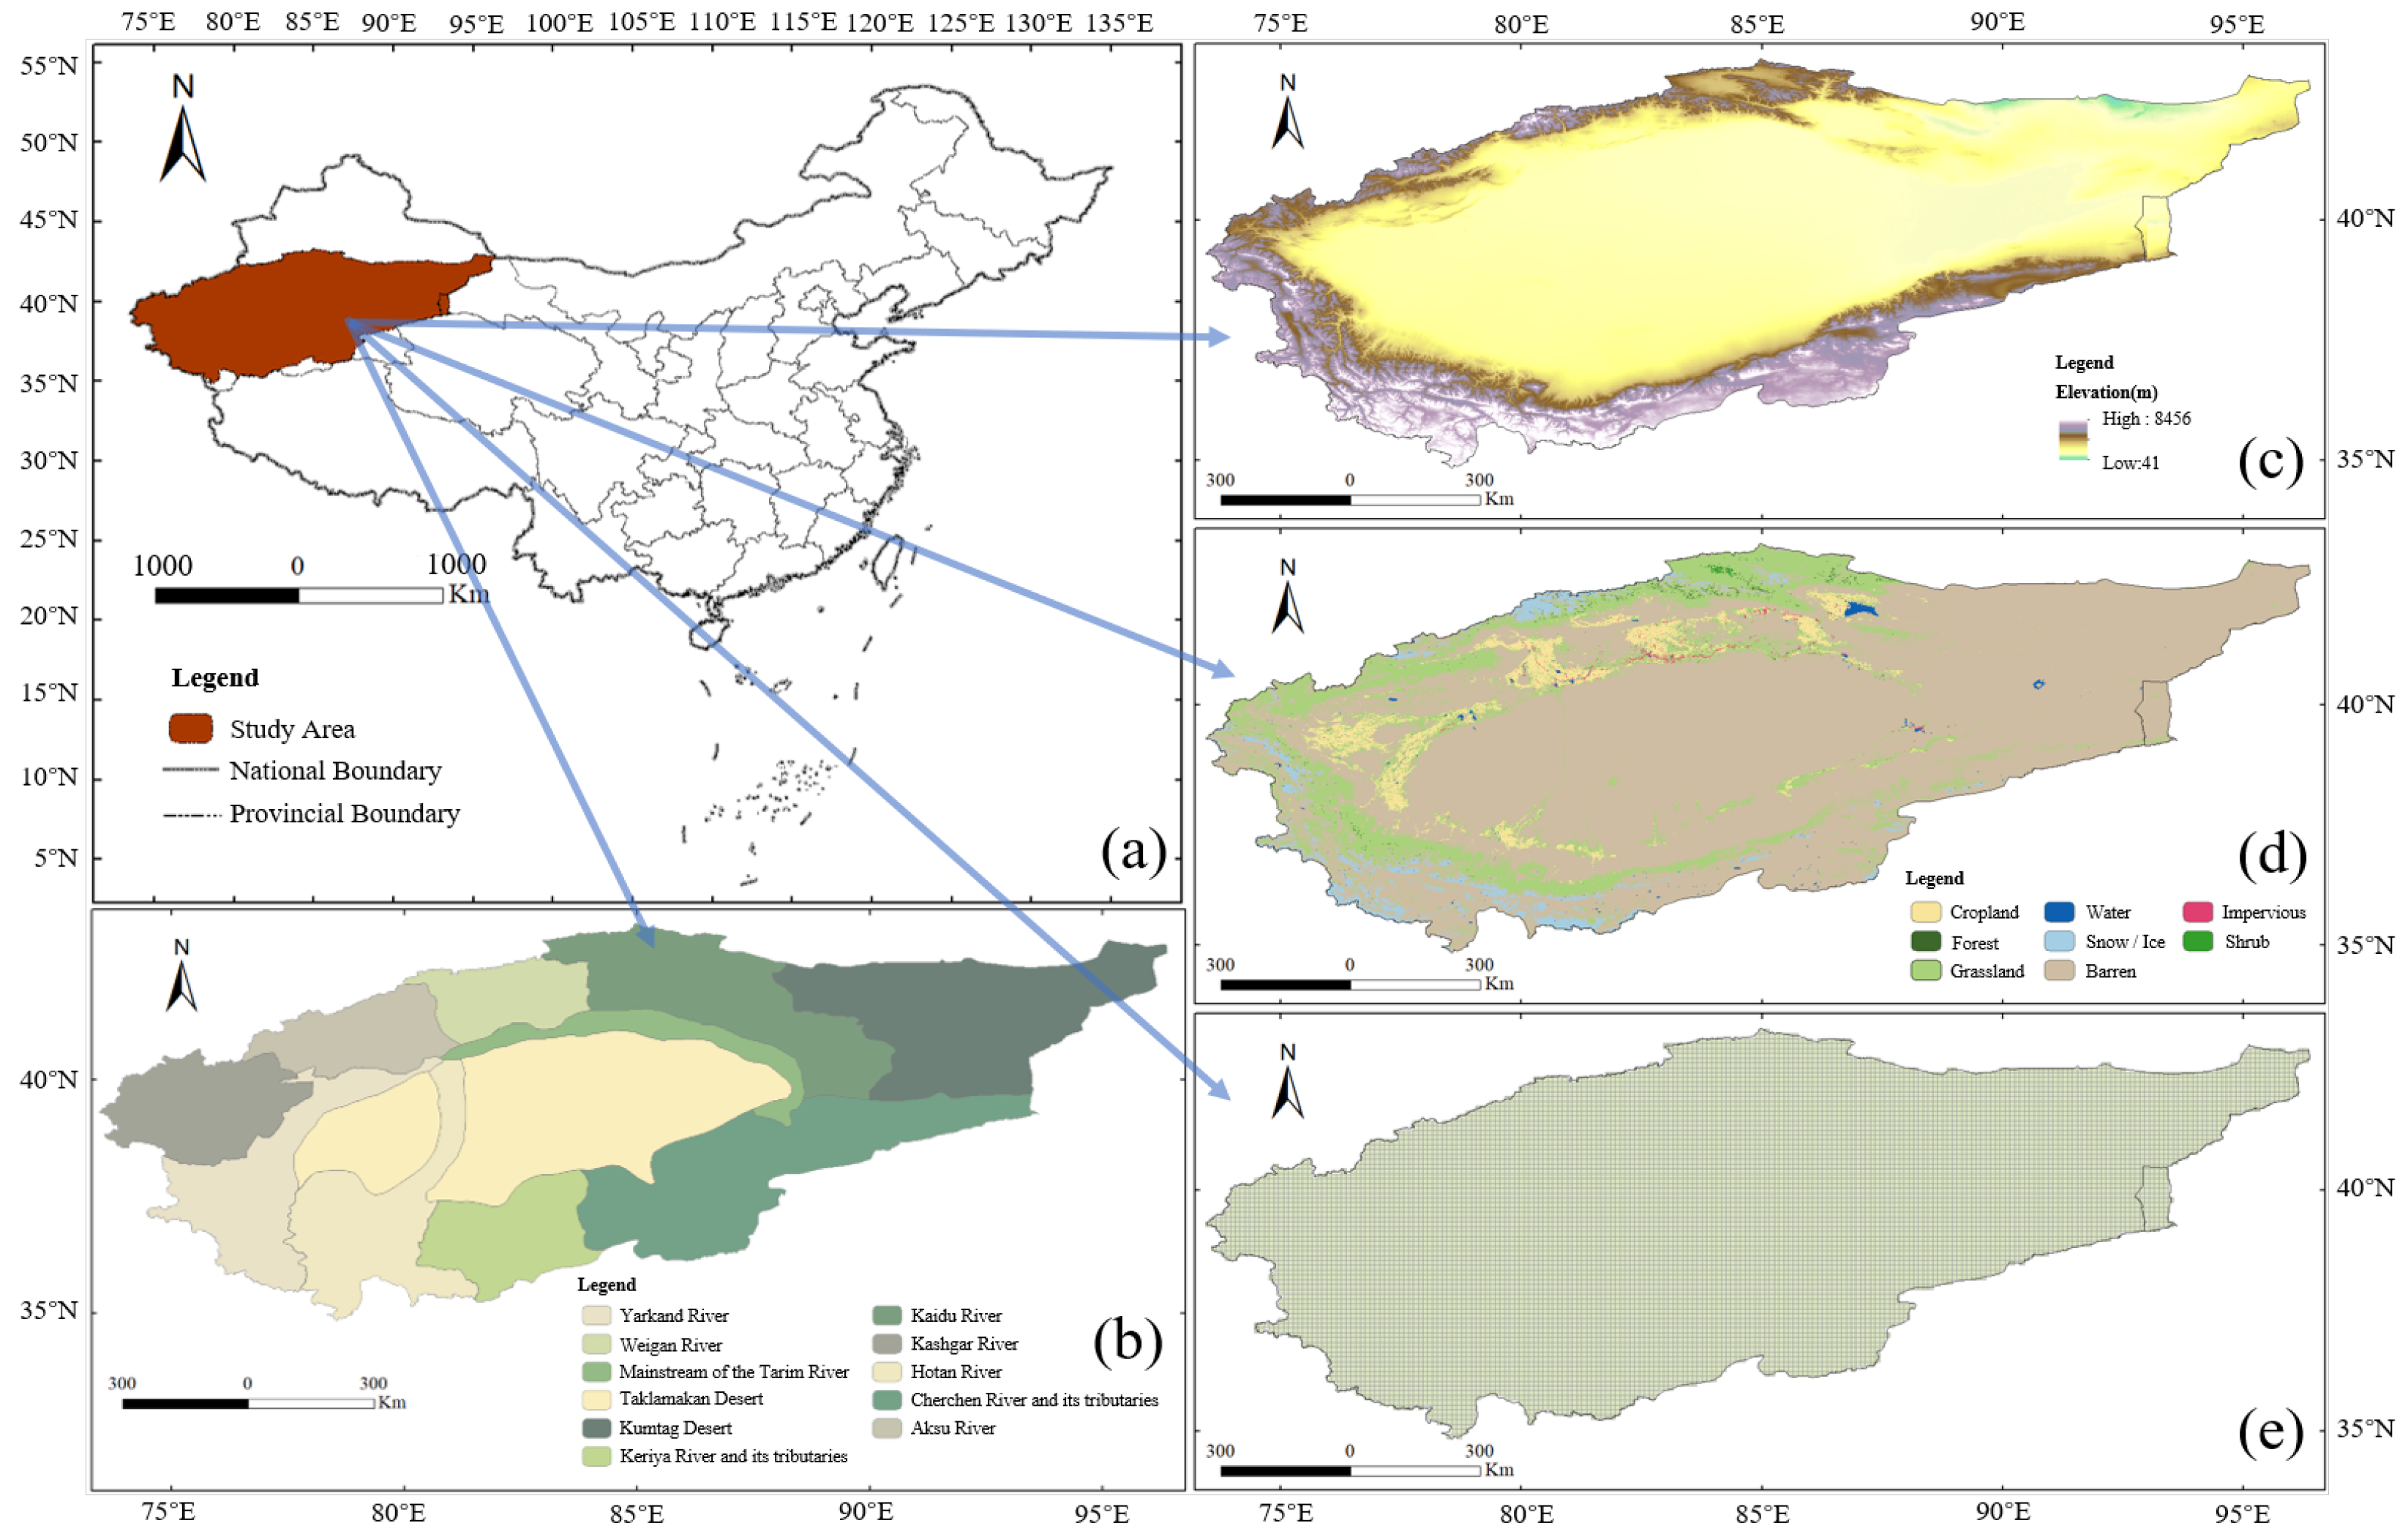
2.1. Study Area

The research focuses on the Tarim River Basin, hereinafter referred to as TRB, which is located in China’s arid northwest, covering Xinjiang and parts of western Gansu provinces. The basin consists of 11 sub-basins [17], with the primary land use being categorized as barren [18]. Within the basin, two major deserts are situated—the Taklamakan and the Kumtag Deserts. Surrounding the Taklamakan Desert, oases and farmlands are distributed, serving as the main areas of human activity. The TRB receives an annual precipitation of less than 50 mm, starkly contrasted with a potential evaporation rate ranging from 2000 to 3000 mm [19]. Its water resources, sourced predominantly from glacial and snow deposits, are exceedingly susceptible to the impacts of climate change [7,11]. Additionally, the basin’s vegetation cover is scant, underscoring the fragility of its ecological milieu. Figure 1 is an overview map of the TRB study area.

2.2. Data

The ERA5-Land dataset is an enhanced global dataset created by the European Centre for Medium-Range Weather Forecasts (ECMWF) for the land component of the fifth-generation European Reanalysis (ERA5). This dataset stands out for its high spatial resolution and hourly temporal resolution [20]. Data pertaining to temperature, precipitation, wind, and radiation for the period from 1 January 1975 to 31 December 2014, were sourced from the ERA5-Land hourly data (https://cds.climate.copernicus.eu/cdsapp#!/dataset/10.24381/cds.e2161bac?tab=form, accessed on 9 August 2023) for SPEI calculation, along with Runoff data for the same period for SRI calculation. These datasets provide coverage of the Earth’s surface in a grid of 0.1° × 0.1°.
The Global Land Data Assimilation System (GLDAS) datasets, derived from the integration of satellite, land surface models, and terrestrial observational data, are extensively utilized in research domains such as meteorological and climatic forecasting, hydrological cycle analysis, and water resource management. In this research, data from 1 January 1975 to 31 December 2014, encompassing variables such as surface runoff, groundwater, snow, and soil moisture, were obtained using the GLDAS_Noah025_M dataset (https://disc.gsfc.nasa.gov/datasets/GLDAS_NOAH025_M_2.0/summary, accessed on 1 March 2023) [21,22]. This dataset represents an integration of GLDAS with the Noah model. It was employed for the computation of STI. Relative to other datasets, the GLDAS_Noah025_M is characterized by its stable driving fields, advanced modeling techniques, and an extensive time series. Initially set at a spatial resolution of 0 . 25 ° × 0 . 25 ° , the data were subsequently resampled to a finer resolution of 0 . 1 ° × 0 . 1 ° , to facilitate more accurate computations and comparisons.
In this study, three SSPs-RCP scenarios, SSP126, SSP245, and SSP585, were selected in consideration of anthropogenic radiative forcing and socioeconomic scenarios, covering a spectrum from low to high future emissions scenarios. Five global circulation models under these scenarios were chosen, focusing on regional applicability and data availability, to analyze and forecast the evolution and spread of hydrological and meteorological droughts during projected periods [23,24]. Details of the models are provided in Table 1. Simulations were exclusively based on the first run (r1i1p1f1) of each model. Data for the historical period (1 January 1975 to 31 December 2014) and projected periods (1 January 2015 to 31 December 2094) were obtained (https://esgf-node.llnl.gov/search/cmip6/, accessed on 28 April 2023), with each GCM dataset being resampled to a spatial resolution of 0.1° × 0.1° using bilinear interpolation. The selection of variables in all model data corresponded with those chosen in ERA5-Land and GLDAS.

3. Methodology

3.1. Estimation of Drought Indices and Their Characteristics

3.1.1. Standardized Precipitation Evapotranspiration Index

In the research presented herein, the Standardized Precipitation Evapotranspiration Index (SPEI) is utilized as the evaluative measure for appraising meteorological drought conditions, employing the computation method established through the work of Vicente-Serrano et al. [25]. We determined the monthly potential evapotranspiration (PET) using the Penman–Monteith method, which is favored for its consideration of data availability [26]. In the majority of studies, the log-logistic distribution has been identified as the optimal method for calculating the SPEI [27]. The Kolmogorov–Smirnov test was employed to verify the fitting effectiveness of the cumulative distribution function. The computation is represented as follows:
E m i = P m i P E T m i
where m denotes the timescale ( m = 1 , 3 , 6 , 12 months) and i indicates a month within a year. Consequently, the SPEI for a given timescale m is calculated as follows:
S P E I m i = ϕ 1 ( F ( E m i ) )
Here, F represents the cumulative distribution function for the log-logistic distribution, modeling the time series data for the net difference in cumulative precipitation and PET over m months, while the function denoted by ϕ 1 corresponds to the reverse computation of the standard normal cumulative distribution.

3.1.2. Standardized Runoff Index

In our analysis, we utilize the Standardized Runoff Index (SRI), conceptualized by Shukla and Wood in 2008 [28], as a metric to quantify hydrological drought conditions. This index extends the conceptual framework of the Standardized Precipitation Index (SPI), as established by McKee et al. [29], enriching it with river discharge data to more accurately represent runoff deficits during distinct intervals. The methodology employed in our study for calculating SRI was informed by a review of previous research, wherein the gamma function is utilized as the cumulative distribution function for SPI computation [30]. The Kolmogorov–Smirnov test was employed to verify the fitting effectiveness of the cumulative distribution function. The methodological approach for this calculation is outlined as follows:
S R I m i = ϕ 1 ( F ( R m i ) )
where m denotes the timescale ( m = 1 , 3 , 6 , 12 months) represents the temporal scale, and i specifies a particular month of the year. Here, R m i is the cumulative runoff for the ith month over an m-month period, F is the cumulative distribution function of the Gamma distribution, used to model the time series of the cumulative runoff R m i , and the function denoted by ϕ 1 corresponds to the reverse computation of the standard normal cumulative distribution.

3.1.3. Standardized Terrestrial Water Storage Index

Introduced by Cui and colleagues [31], the Standardized Terrestrial Water Storage Index (STI) offers a quantification of hydrological droughts by assessing the variance of terrestrial water storage components, which include groundwater, soil moisture, surface waters, and cryospheric elements, from established climatic averages. This index serves as a metric for hydrological droughts and mirrors the changes in terrestrial hydric reserves, holding a correlative value with other indicators such as SPEI and SRI. STI is instrumental in gauging water shortages over diverse duration frameworks, such as 1 to 12 months, thereby providing a basis for comparative analysis with other recognized standardized drought measures. The cumulative distribution function for calculating the STI was derived referencing the normal function, as employed by the original proponents of STI. The Kolmogorov–Smirnov test was employed to verify the fitting effectiveness of the cumulative distribution function. The calculation of STI is executed as per the following methodology:
S T I m i = ϕ 1 ( F ( T m i ) )
where T m i is the cumulative terrestrial water storage for the ith month over an m-month period. The function F denotes the cumulative distribution function of the normal distribution, employed to fit the time series of T m i , while the function denoted by ϕ 1 corresponds to the reverse computation of the standard normal cumulative distribution.
The severity classification for the three drought indices is presented in Table 2. A lower value indicates a higher severity of drought. For the purpose of achieving comparability among various droughts, four uniform drought classification levels were selected: normal and light droughts, moderate droughts, severe droughts, and extreme droughts. These classifications adhere to the meteorological drought standards established by the China Meteorological Administration (GB/T 20481-2017), as well as the STI drought classification criteria proposed by the originators of the STI index [32,33].

3.2. Bias Correction

Resampling of all data was executed through the bilinear interpolation method, notable for its superior computational efficiency in comparison with more complex interpolation methods, thus ideal for rapidly processing voluminous data. Each variable of the resampled GCMs underwent correction via the non-parametric Quantile Mapping bias correction approach [34]. This approach, being independent of specific distribution assumptions, offers flexible applicability to various climate data types. Inherent uncertainties in a singular model, attributable to unique parameterizations, initial conditions, or model structure choices, are present. The integration of multiple model outputs in the Multi-Model Ensemble (MME) effectively mitigates these model-specific biases [24,35], contributing to a reduction in the overall predictive uncertainty. The MME predictions, formulated post-equal-weight allocation to the amended GCMs models, were subsequently employed in analyzing drought development and spread under scenarios SSP126, SSP245, and SSP585.

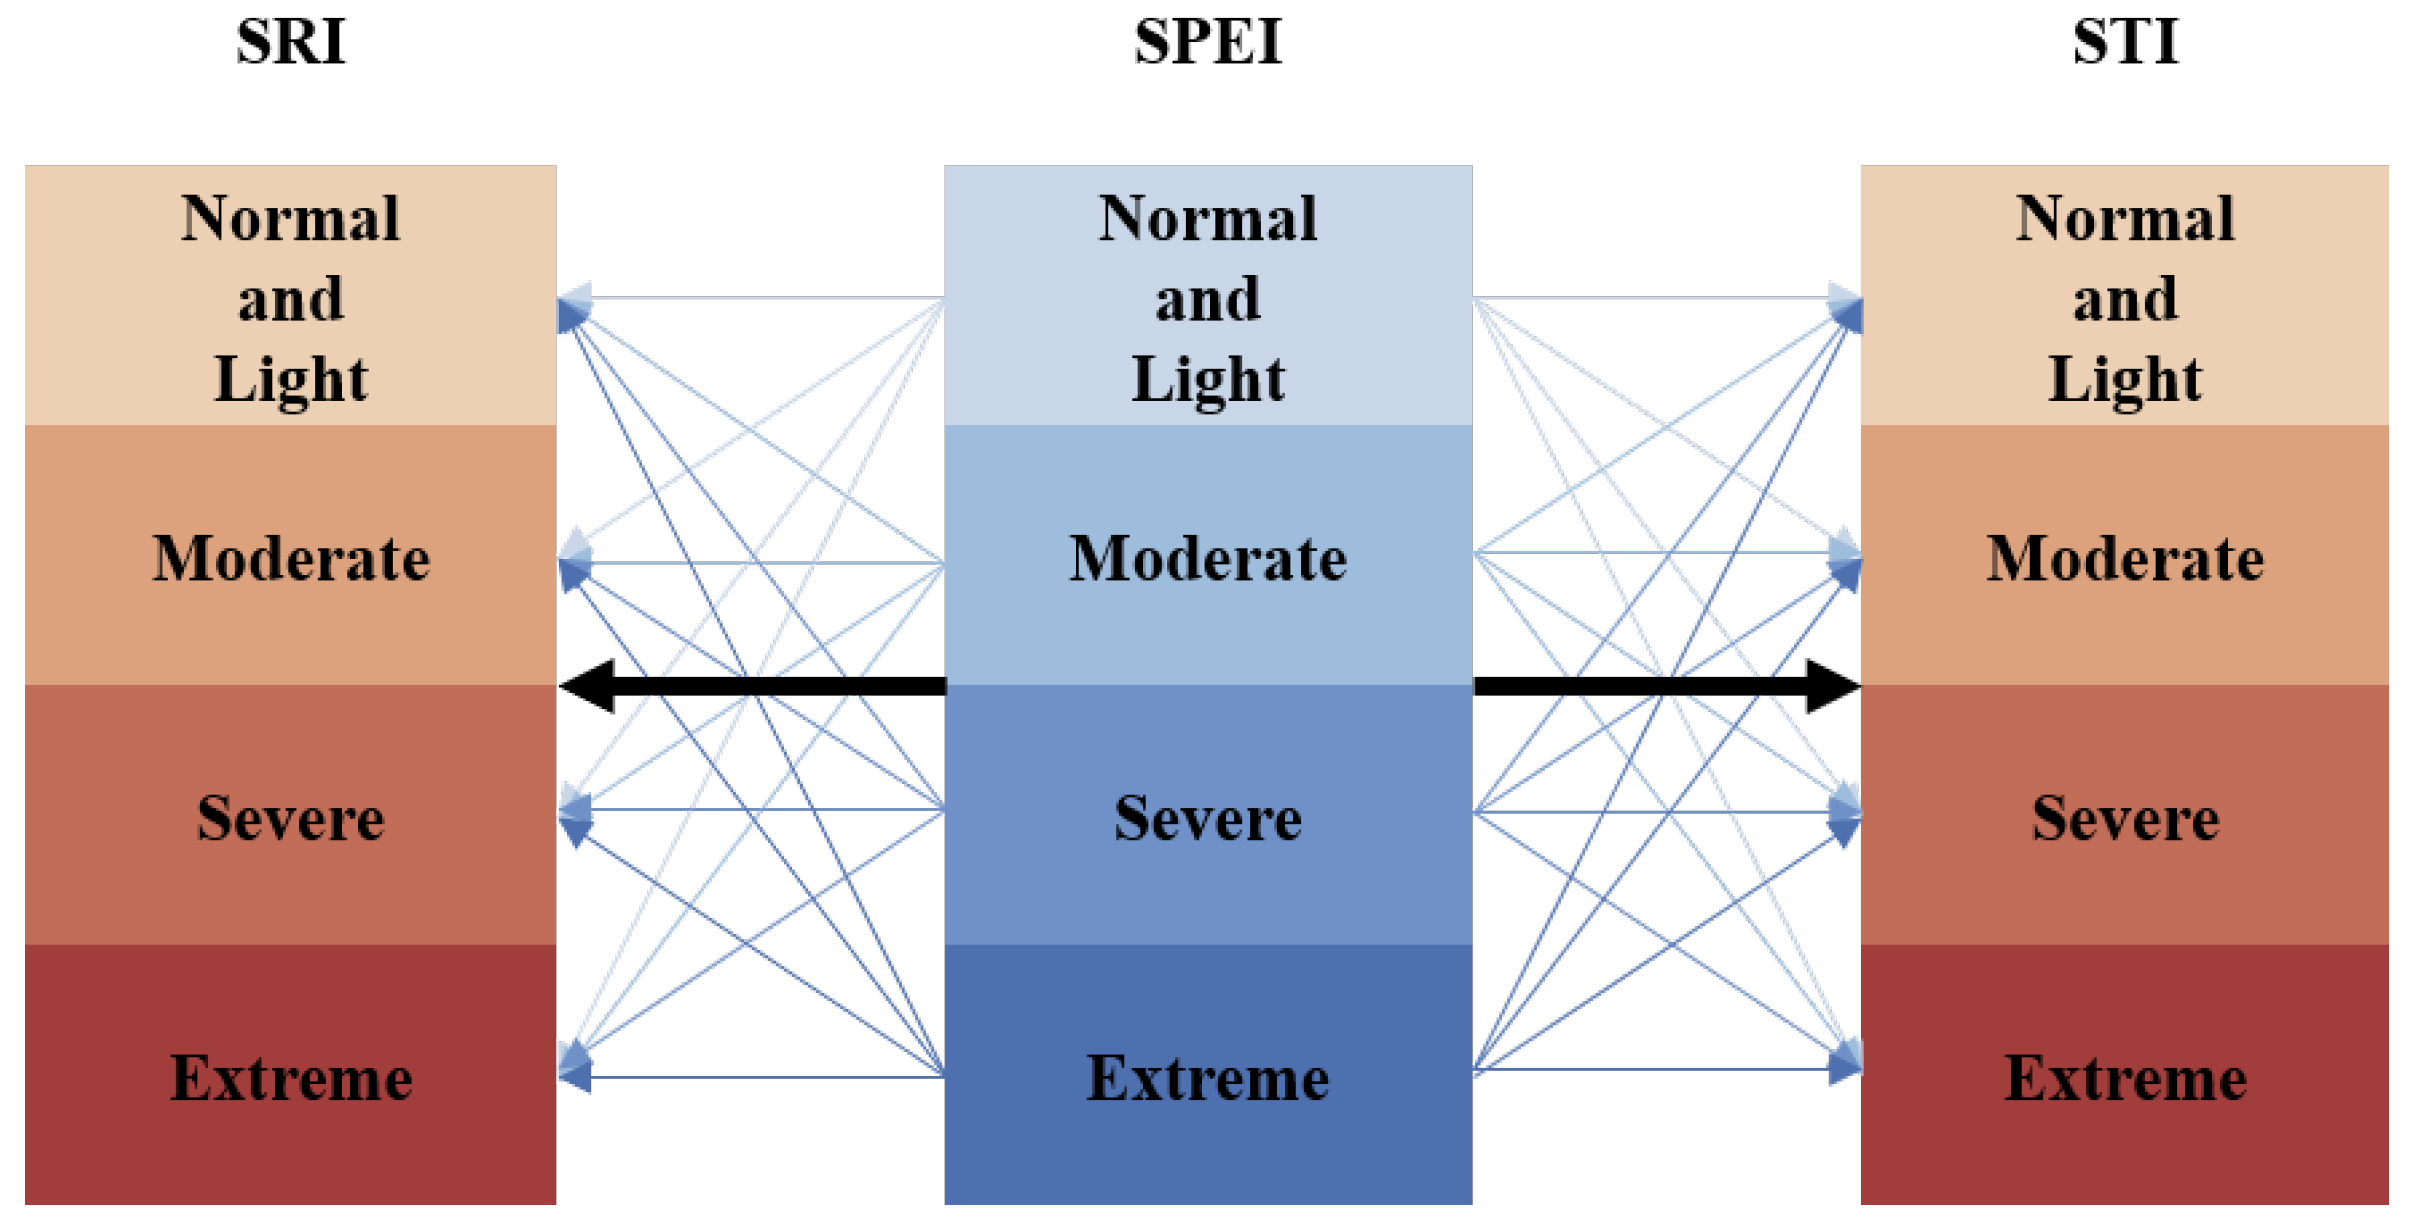
3.3. Conditional Probability

The probability of hydrological drought occurrences with differing intensities under various meteorological drought conditions was calculated in this study, facilitating an analysis of the transition likelihood from meteorological to hydrological droughts. A straightforward Bayesian network, a form of probabilistic graphical model (PGM), was employed for the computation of these conditional probabilities. In PGMs, the conditional dependency structures among random variables are graphically represented, enabling the deduction of inter-variable relationships [36]. Figure 2 illustrates the PGM relationships utilized herein. It is imperative to acknowledge the high sensitivity of this model to the chosen drought index thresholds. The model considered four drought scenarios: normal and light droughts, moderate, severe, and extreme conditions. The Bayesian framework was parameterized using a method of statistical inference known as Maximum Likelihood Estimation (MLE). The construction of this network was facilitated by the application of a Python-based algorithmic implementation. The general expression for conditional probability is given as:
P ( H C m | M C m ) = P ( H m , M m ) P ( M )
Here, P ( H | M ) is defined as the probability of occurrence of a specific hydrological drought given a particular meteorological drought condition, representing the propagation likelihood. C m categorizes drought intensity into four classes: C 1 for normal and light droughts, C 2 for moderate droughts, C 3 for severe droughts, and C 4 for extreme drought conditions. Additionally, P ( M , H ) indicates the joint probability of concurrent meteorological and hydrological drought events, whereas P ( M ) denotes the probability of the occurrence of meteorological droughts.

4. Results and Discussion

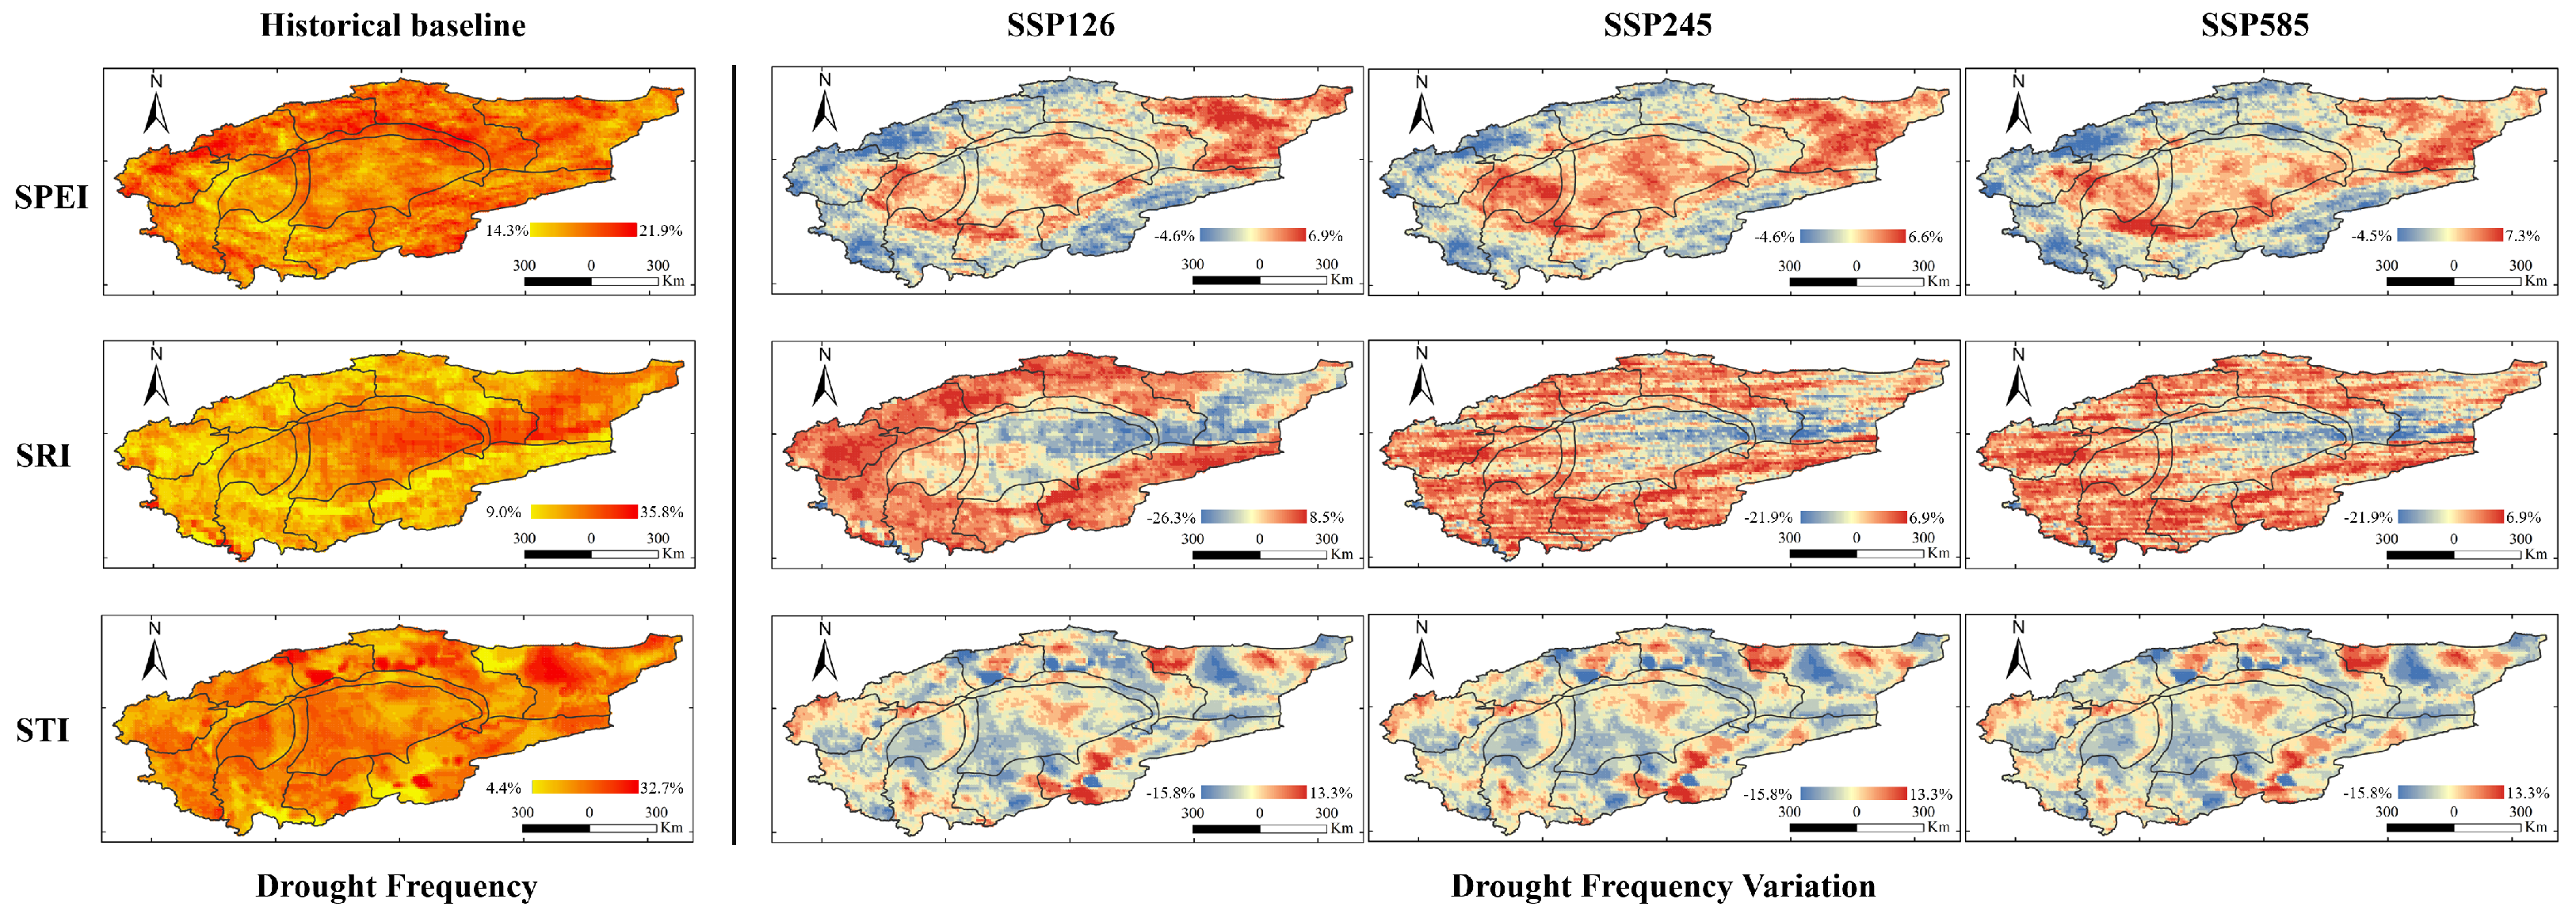
4.1. Spatiotemporal Patterns of Drought Changes under Climate Change

In this study, we performed a spatial analysis to evaluate the drought frequency (DF) of meteorological, hydrological, and agricultural droughts, as indicated by the SPEI, SRI, and SRI, respectively [37]. This analysis spanned historical (1975–2014) and projected periods (2015–2094) under the SSP126, SSP245, and SSP585 scenarios. Drought events were identified when index values dipped below −1.00, with DF representing the proportion of total observations classified as droughts [38]. For the purposes of this paper, SPEI will refer to meteorological droughts, SRI to hydrological droughts, and STI to agricultural droughts.
As illustrated in Figure 3, the monthly timescale analysis reveals that the DF of SPEI was recorded between 14.3% and 21.9% during the historical baseline period, with predominant drought events in the northern oasis areas, notably in the Mainstream of the Tarim River, Aksu River, and Weigan River basins. In the projected period, however, there was an apparent escalation in DF within the Taklamakan and Kumtag Deserts and their adjacent river basins, while a decrease in DF was observed in the oasis regions.
In the historical baseline interval, the SRI showed DF oscillating between 9.0% and 35.8%, reflecting relatively infrequent drought conditions. The majority of high-frequency droughts were geographically localized to the eastern regions surrounding the Taklamakan and Kumtag Deserts. In comparison, the projected periods indicate a trend towards more acute hydrological drought conditions, predominantly affecting oases. Concurrently, a reduction in hydrological drought DF is projected for the areas encircling the eastern Taklamakan and Kumtag Deserts.
Throughout the historical baseline interval, the DF for the STI was observed to be between 4.4% and 32.7%, with the Weigan River, Kaidu River, Kumtag Desert, and the Cherchen River regions consistently presenting high drought event occurrences. The DF in other areas hovered around 15%. When examining the projected periods, a reduction in drought severity was noted in regions that historically experienced high drought frequencies. Despite this relief, the aggregate frequency of droughts has escalated.

4.2. Propagation Time from Meteorological to Hydrological Drought

The impact and variation of drought conditions across various time durations are represented by drought indices on distinct cumulative time scales. It has been widely demonstrated by previous research that a lag in the hydrological drought’s response to meteorological droughts exists, as evidenced by correlations calculated between drought indices at different time scales or through the establishment of artificially delayed sequences of drought indices [39,40,41,42]. Evidence suggests that the robustness of the association across different drought classifications is reflected in the magnitude of the correlational coefficient. The designated response time scale—or accumulation period—mirrors the interval required for the cumulative shortfall of type B drought to align with that of type A drought [43]. In this context, the present study computed the Spearman correlation coefficients for SPEI at 1, 3, 6, and 12-month intervals against the hydrological drought indices SRI and STI, both assessed at a 1-month scale. The utilization of diverse time scales is intended to depict meteorological droughts across short, seasonal, intermediate, and extended durations. The time scale m that exhibits peak correlation serves as the response time scale, delineating the lag between the onset of meteorological and the subsequent manifestation of hydrological droughts.
The correlation analysis conducted using Spearman’s method at various temporal scales—1, 3, 6, and 12 months—has identified that, historically, the TRB exhibits a six-month lag in the propagation from meteorological to hydrological drought conditions. However, projections under SSP126, SSP245, and SSP585 scenarios indicate a reduction in this lag to approximately three months.
For the STI and SPEI comparison, the historical baseline and SSP585 scenarios suggest a consistent twelve-month lag, while the SSP126 and SSP245 scenarios project the lag to be just three months.
To elucidate the dynamics between meteorological and hydrological droughts further, forthcoming studies will concentrate on specific pairings: historical_SPEI6-SRI1, SSP126_SPEI3-SRI1, SSP245_SPEI3-SRI1, SSP585_SPEI3-SRI1, and historical_SPEI12-STI1, SSP126_SPEI3-STI1, SSP245_SPEI3-STI1, alongside SSP585_SPEI12-STI1.

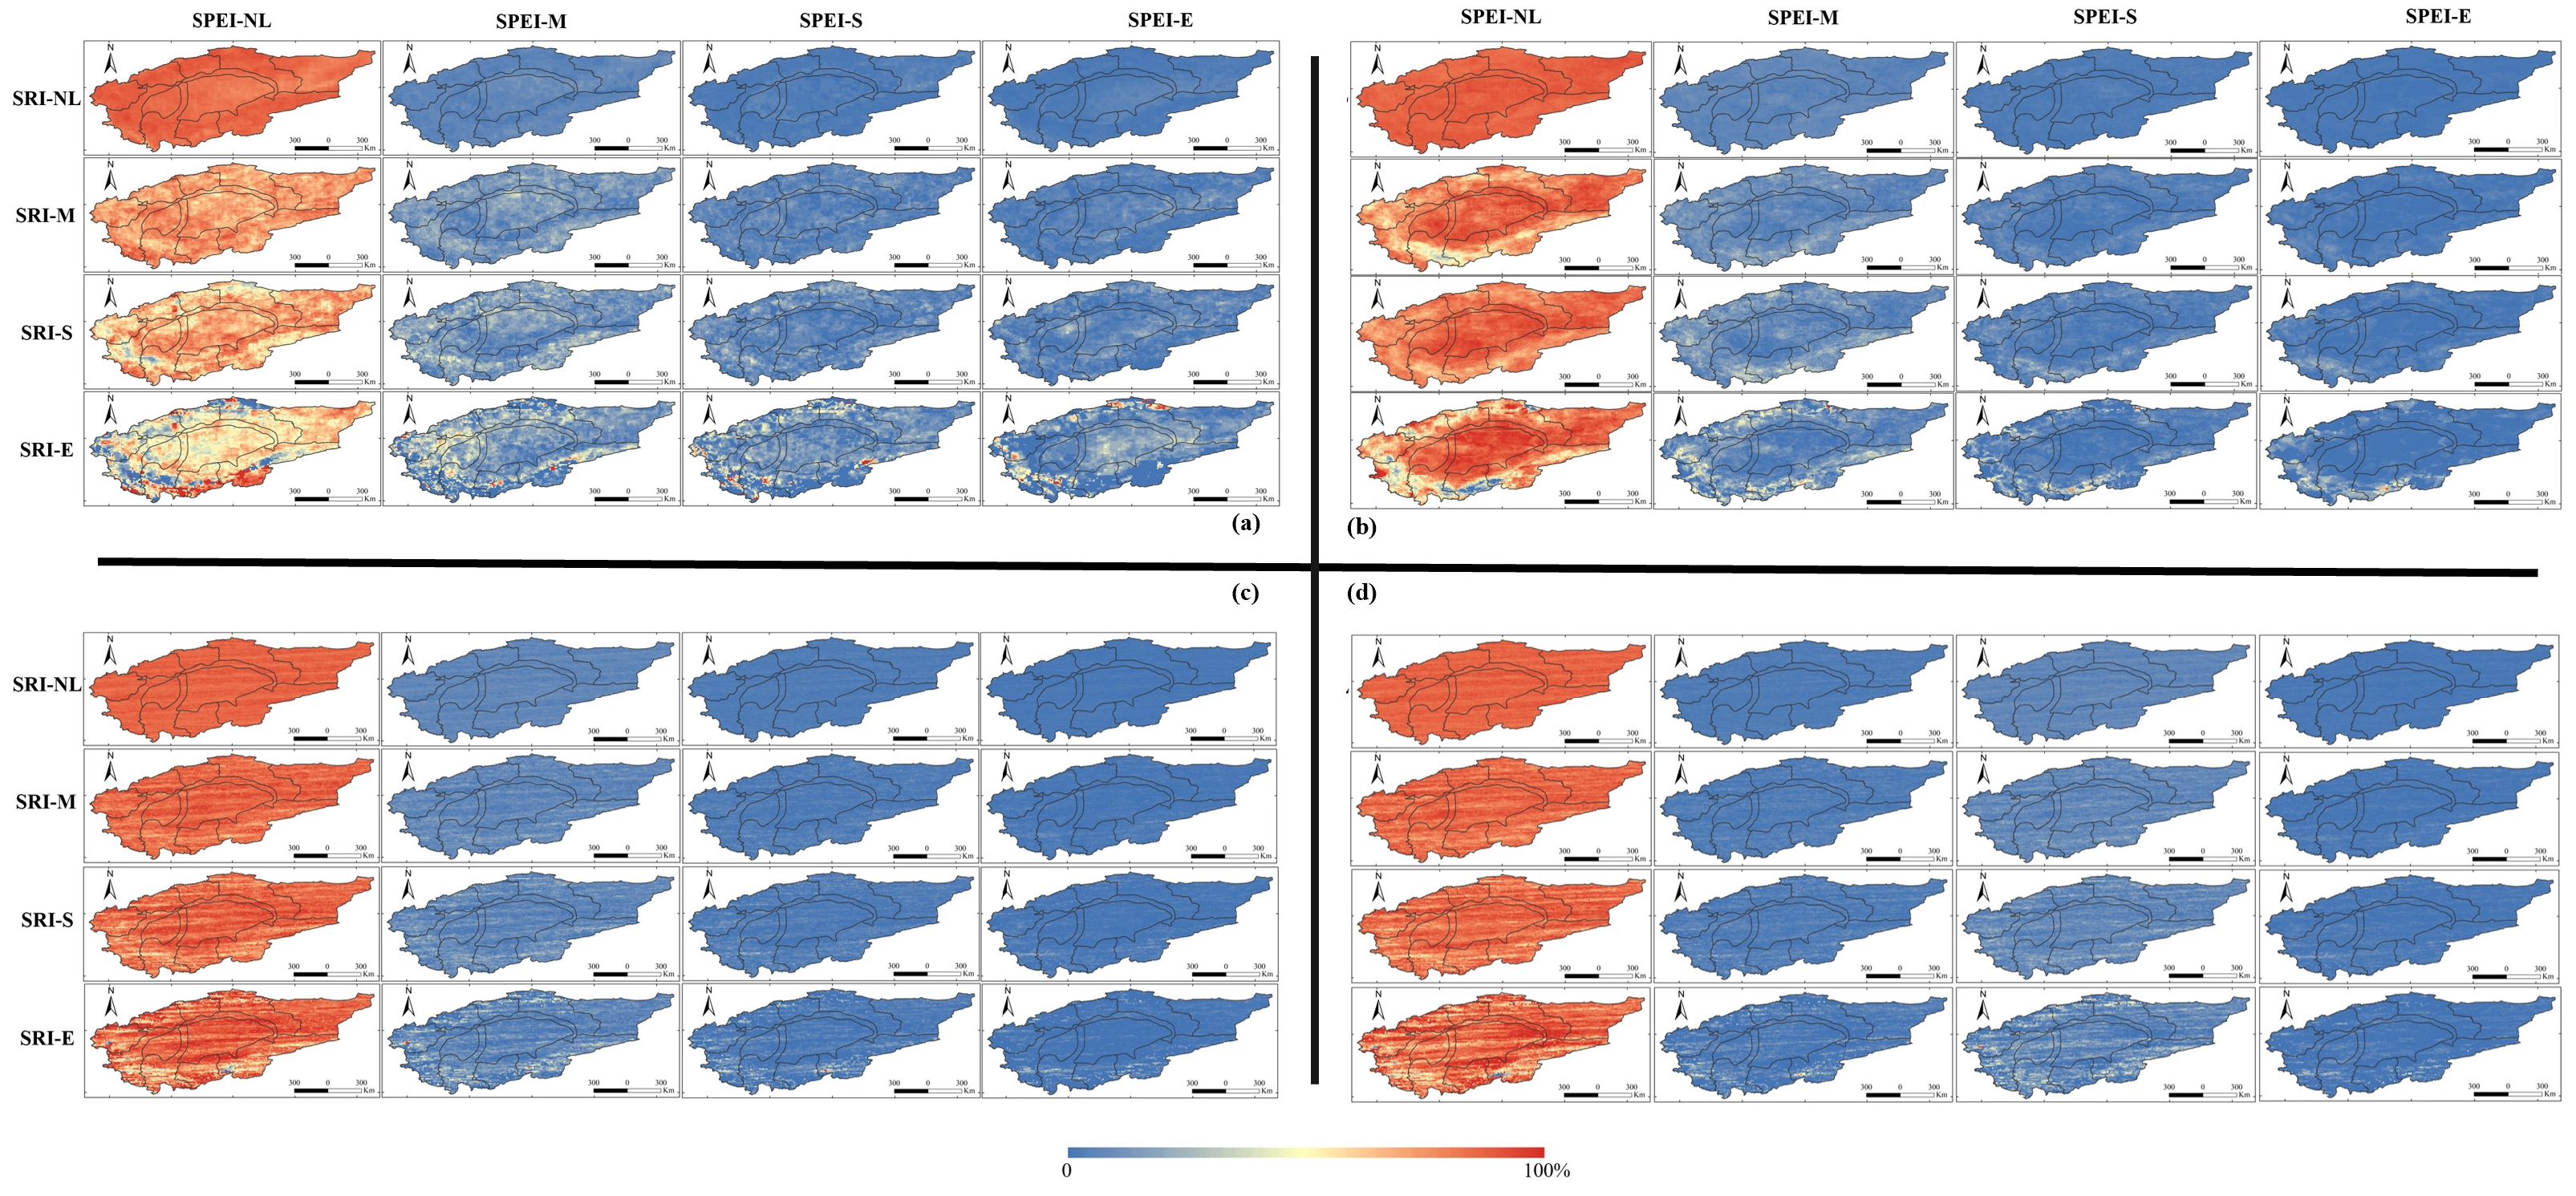
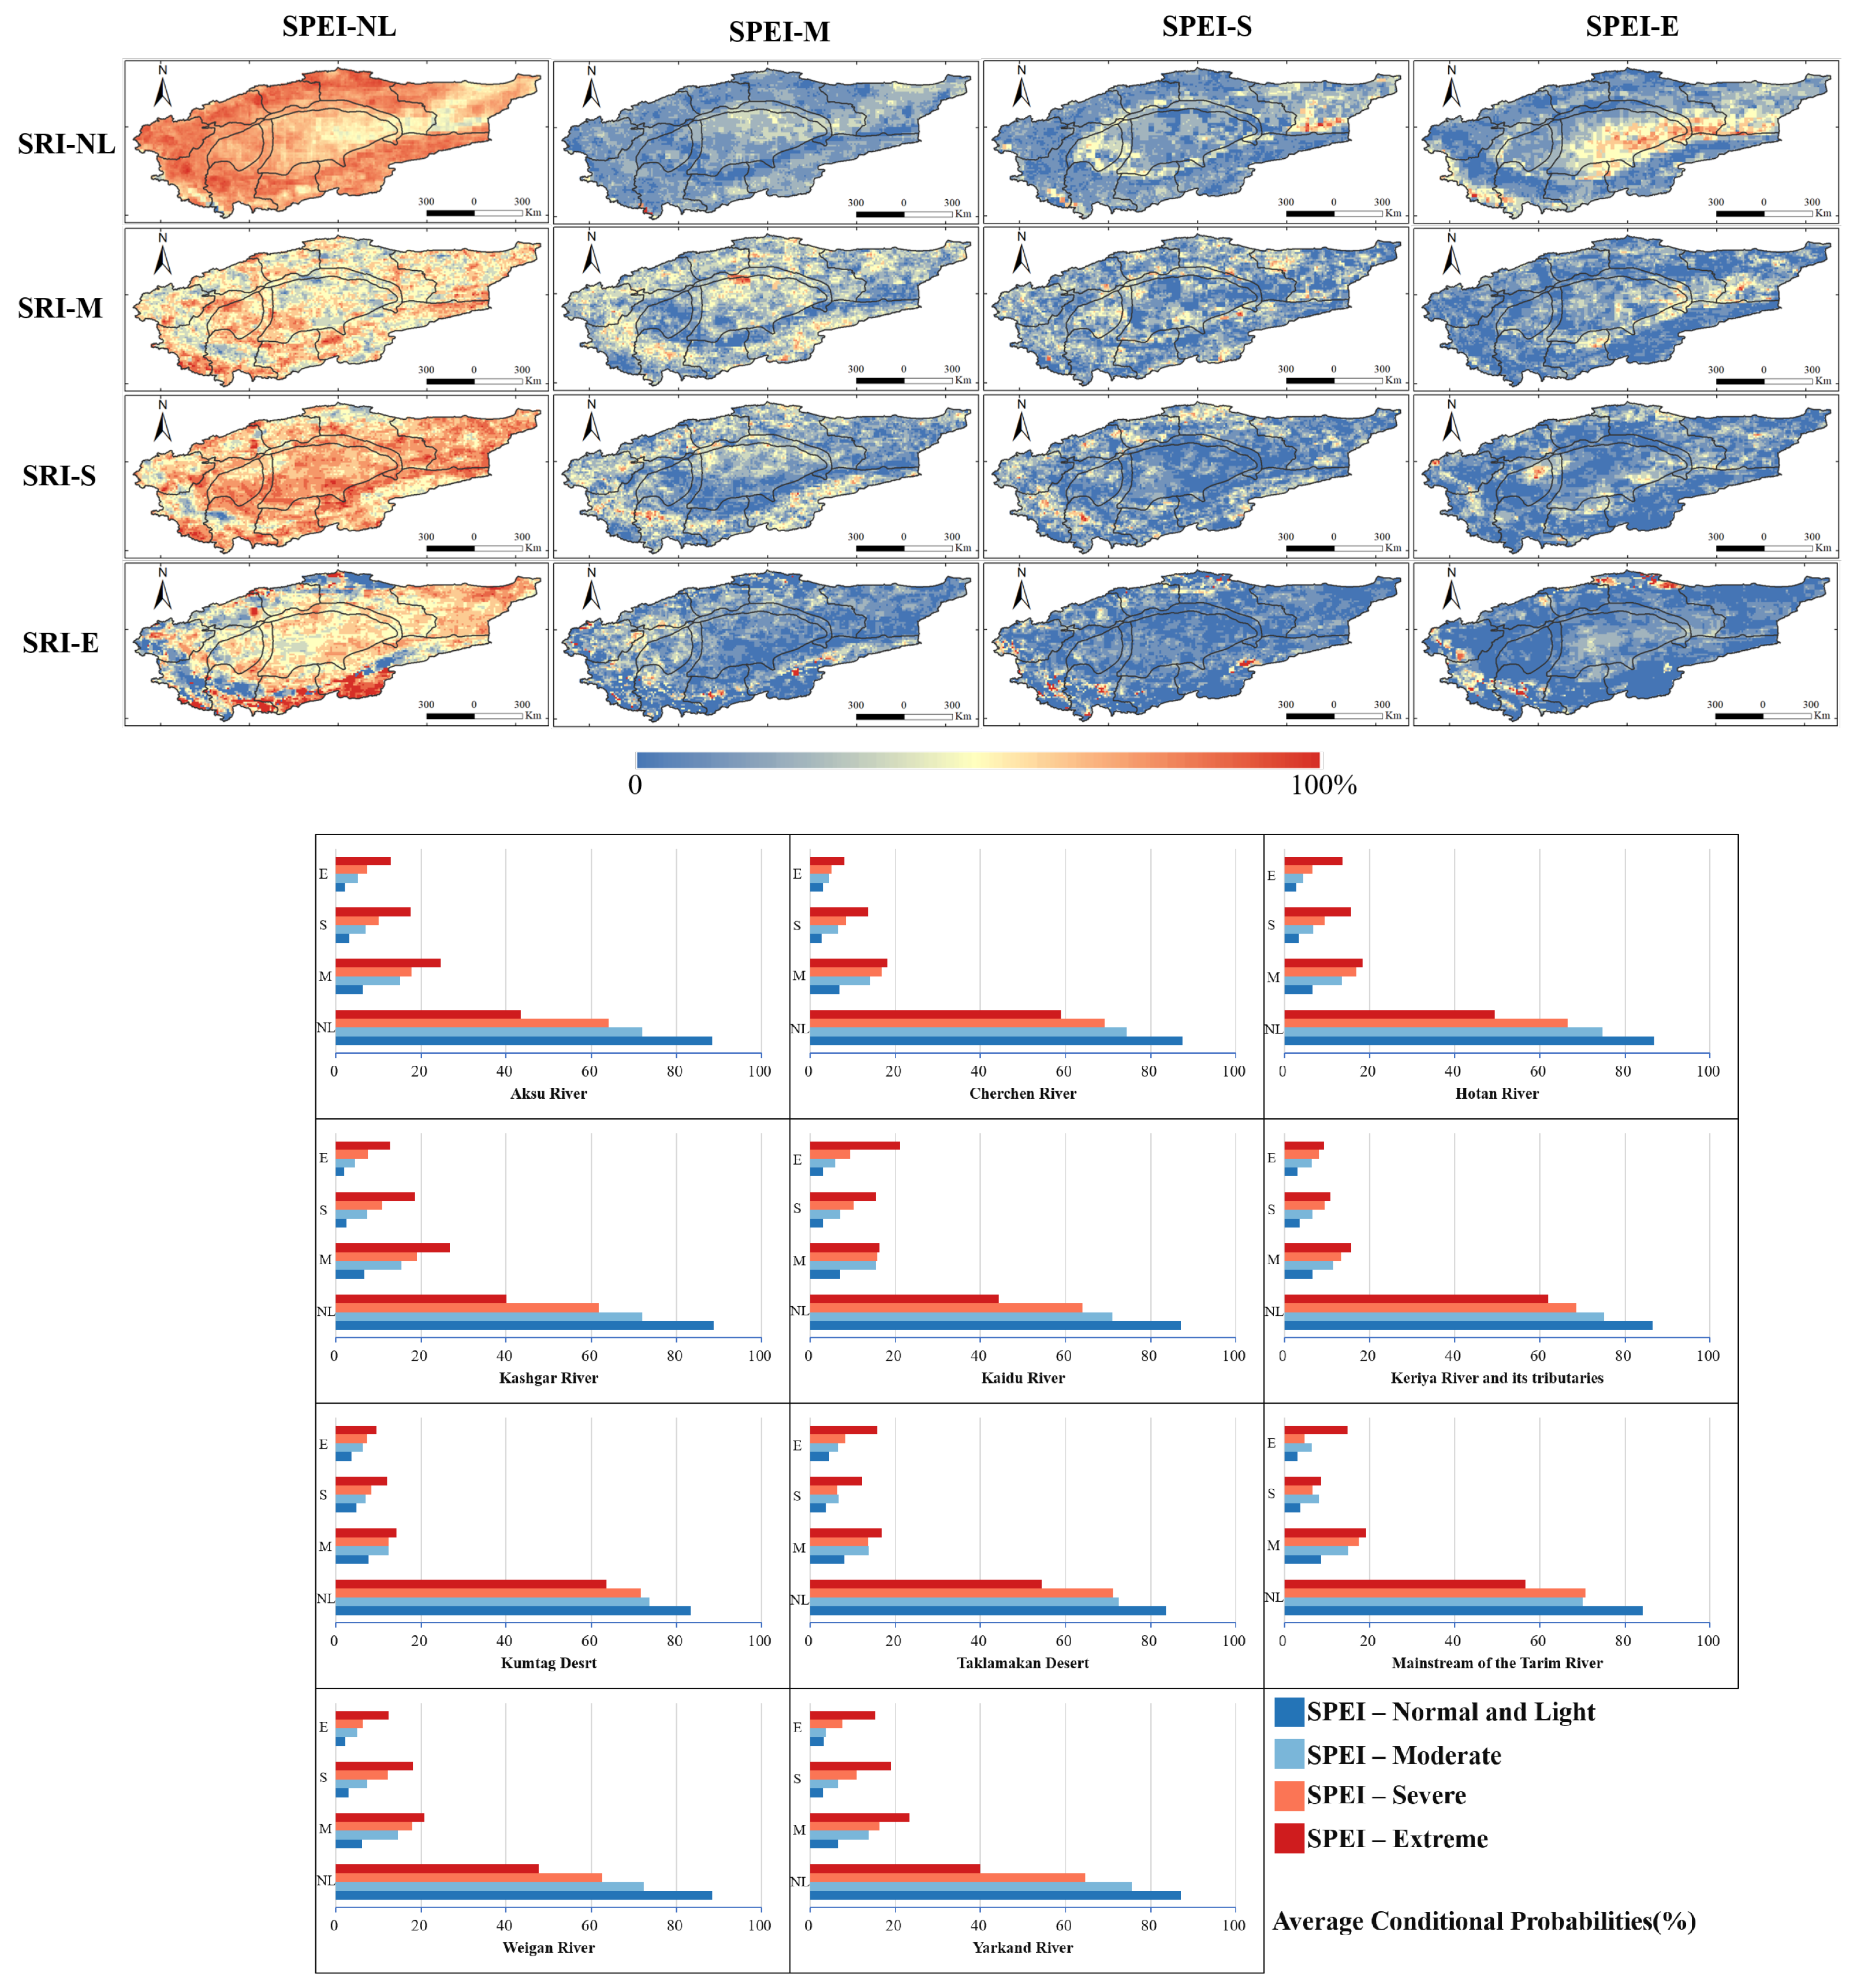
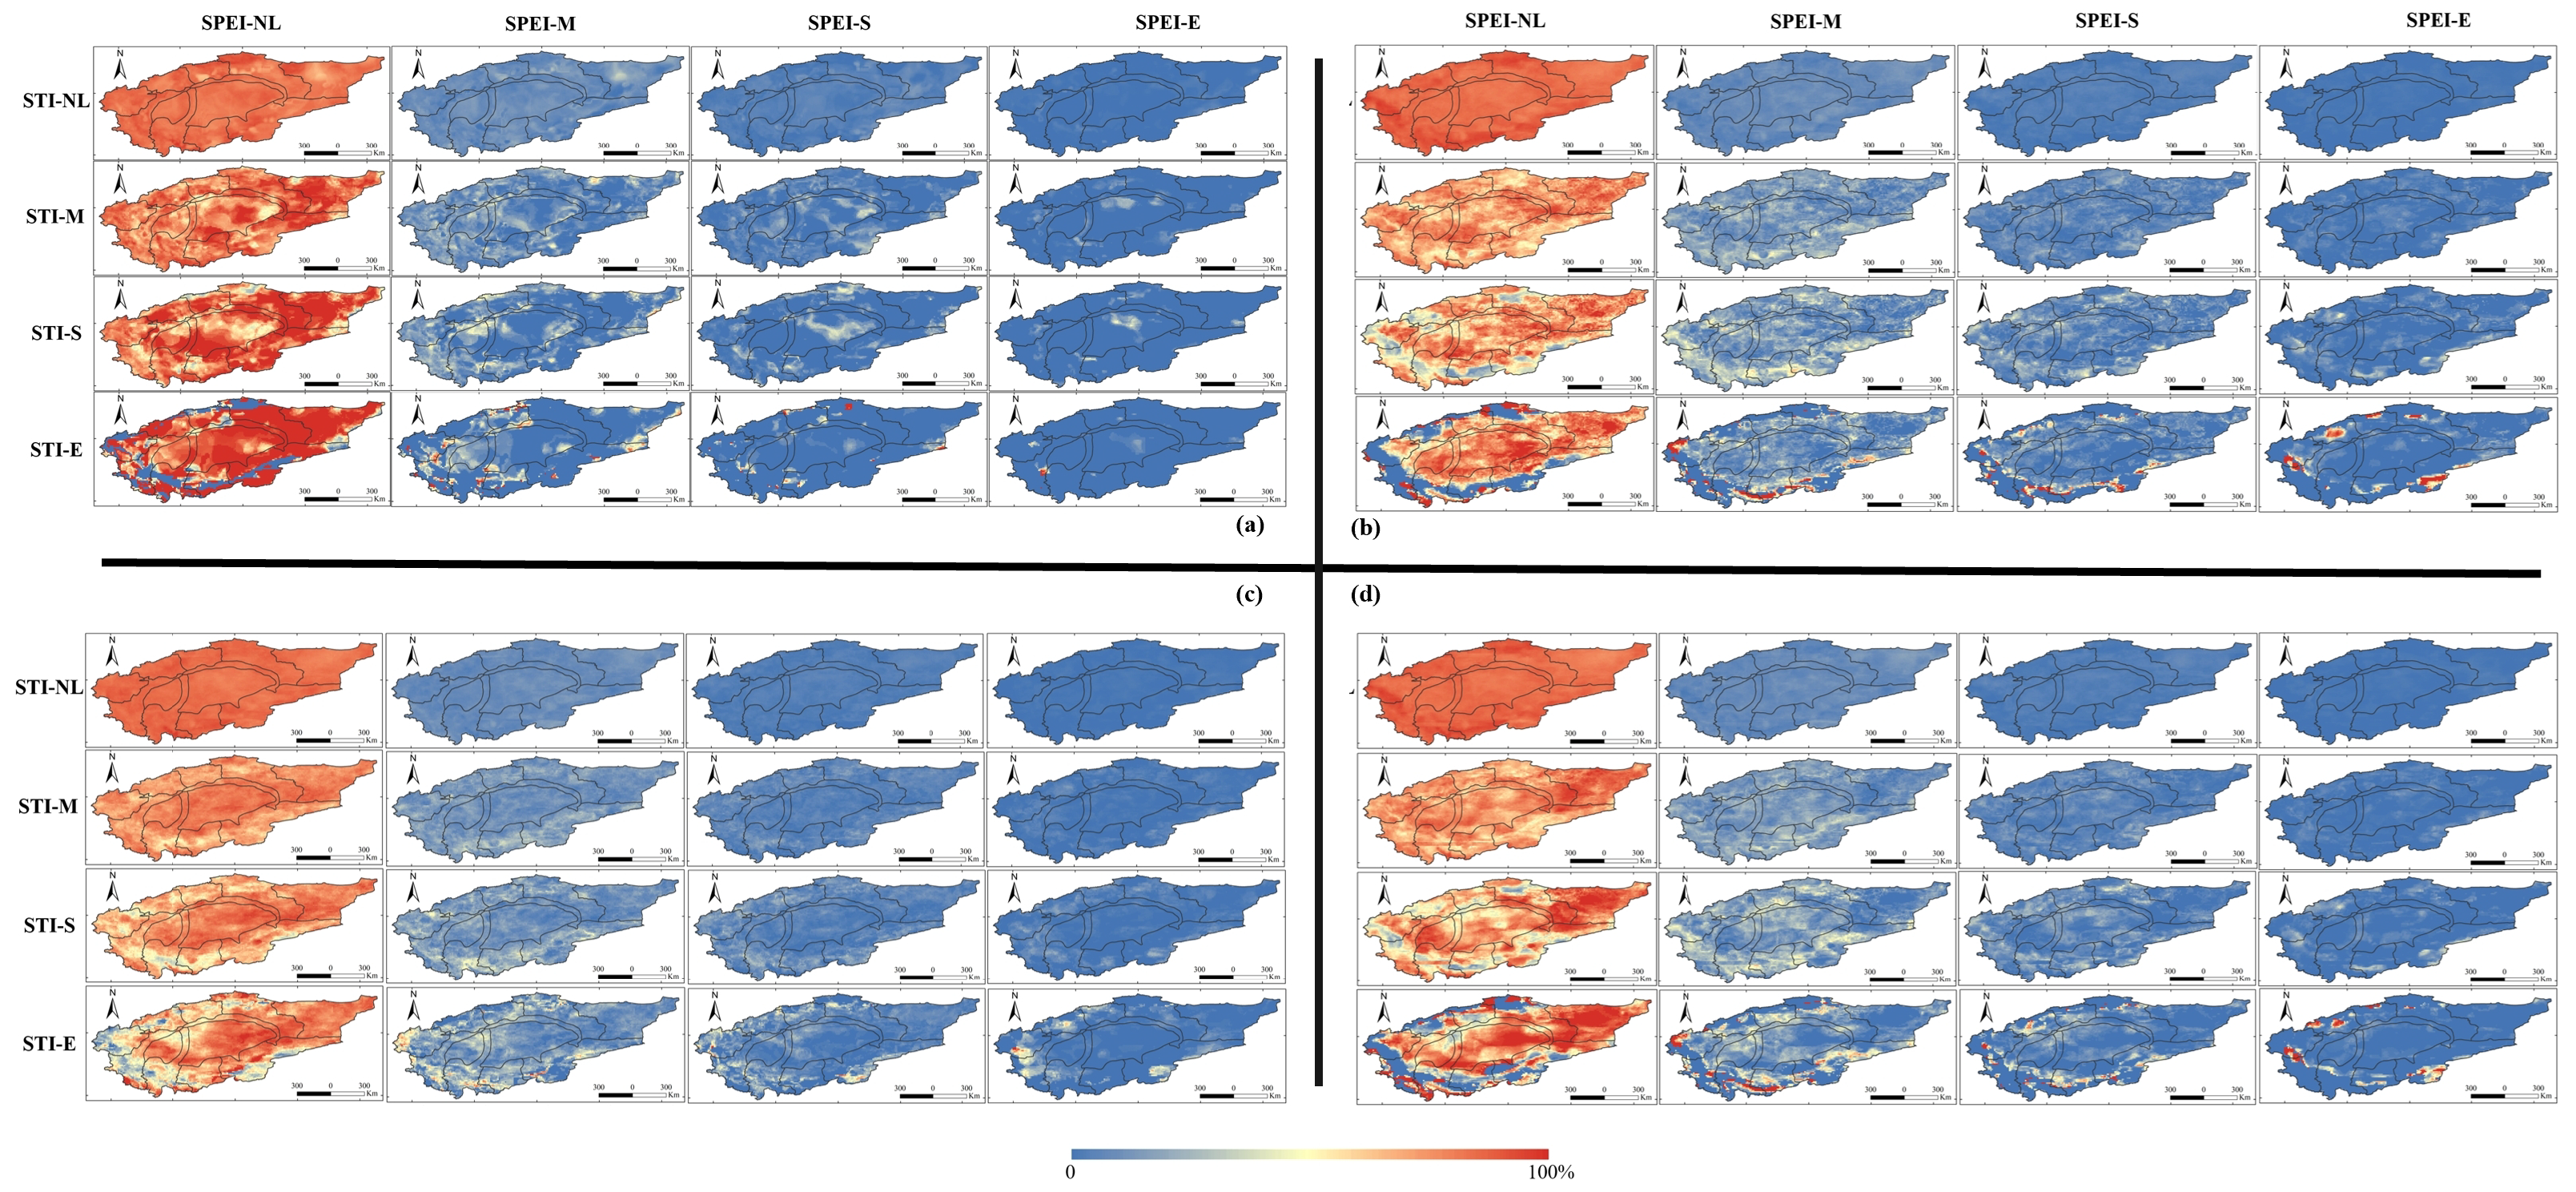
4.3. Drought Propagation Probability

The categorization of drought types into meteorological and hydrological distinctions yields four classifications: normal and light drought where the drought index is ≥−1.0, moderate drought at 1.50 drought index < 1.0 , severe drought within the range of 2.00 drought index < 1.50 , and extreme drought when the drought index is ≤−2.00. For the projected periods, the likelihood of meteorological drought propagation, contingent on the occurrence of hydrological droughts, was ascertained through the application of conditional probability estimates.
In the analysis of historical_SPEI6-SRI1 propagation probabilities, it was observed that under SPEI normal and light drought conditions, the occurrence of normal and light drought in SRI approaches a probability of nearly 100%. As SPEI drought severity intensifies, the probability of experiencing normal and light drought in SRI correspondingly diminishes, a trend more evident within oasis regions. As depicted in Figure 4’s P(NL|E), in scenarios of extreme SPEI droughts, the likelihood of encountering normal and light drought in SRI is virtually zero in the southwestern oases and southern Kaidu River areas. In contrast, in the two desert regions, the probability of observing normal and light drought in SRI remains over 50%.
Under conditions where the SRI corresponds to a consistent drought type, an escalation from moderate to extreme drought conditions as indicated by the SPEI is associated with a progressive increase in both the likelihood and spatial extent of droughts as identified by the SRI. Conversely, for a uniform drought classification according to the SPEI, the SRI reveals a gradual decline in the probability and coverage of droughts across varying intensities.
Analysis of the probability maps for drought propagation from SPEI across all drought categories to SRI droughts reveals that the oasis regions situated in both the southwestern and northeastern parts of the TRB are characterized by a heightened risk of drought propagation, including areas where the probability exceeds 50%. Areas with a lower risk of drought propagation are primarily located in the central and eastern sections of the basin.
Examining the propagation of historical SPEI12-STI1, as shown in Figure 5, it is observed that in scenarios where the SPEI indicates normal and light drought conditions, the likelihood of STI also exhibiting normal and light drought surpasses 60%. This probability diminishes as the SPEI’s severity escalates. In instances of extreme drought as indicated by SPEI, the incidence of normal and light drought conditions in southern oases and certain northern periphery oasis zones is almost negligible, while the desert regions remain largely unaffected.
Where SRI maintains a uniform drought classification, as shown in Figure 6, an escalation in drought severity from moderate to extreme, as projected by SPEI, correlates with a rise in both the occurrence probability and area of these droughts. In parallel, for a consistent drought type as per SPEI, the chances and spatial coverage of different levels of SRI droughts progressively diminish. These observations mirror the results seen in the historical_SPEI6-SRI1 study.
Analysis of the probability maps for drought propagation from diverse SPEI categories to SRI indicates that both the western region of the TRB and the core areas of the Taklamakan Desert are at increased risk of drought propagation, with sections exhibiting propagation probabilities surpassing 45%. In contrast, areas with a diminished likelihood of drought propagation are concentrated in the oasis zones of the basin’s eastern and central regions.
Relative to the historical baseline, as shown in Figure 7, the probability of SPEI propagation to STI shows a general decline across three projected future scenarios. Despite this decrease, the pattern of propagation in each scenario mirrors that of the historical period. This trend may be attributable to the cumulative time scale associated with SPEI.
Under SSP126_SPEI12-STI1 and SSP585_SPEI12-STI1 scenarios, when STI corresponds to a uniform drought type, the propagation mechanism of SPEI to STI, transitioning from moderate to extreme droughts, aligns with the historical baseline. However, this propagation exhibits stark spatial discrepancies in oasis regions and the central area of the TRB.

5. Conclusions

As early as the late 19th century, scientists began investigating the theory that the elevation of carbon dioxide levels in the atmosphere might precipitate a global temperature increase. A notable instance is the proposition of the greenhouse effect’s fundamental principles by Swedish chemist Svante Arrhenius in 1896. As for the future occurrence of climate change, the extant scientific consensus affirms its likelihood. Through exhaustive scientific inquiries and data scrutiny, international climate research bodies have consistently concurred that the Earth’s climate is exhibiting changes, predominantly evidenced by a rise in the global mean temperature, a surge in extreme meteorological phenomena, glacial recession, and an ascent of sea levels. These alterations are predominantly ascribed to anthropogenic activities [44].
Under future climate change scenarios, the analysis of climate change impacts on average drought characteristics reveals a decline in meteorological drought frequency in the TRB’s oasis regions, while an increase is noted in the central and eastern desert areas of the TRB. This trend may be attributed to an amplified regional water cycle with elevated temperatures, resulting in enhanced actual evapotranspiration and an augmented supply of atmospheric water vapor, alongside a boost in precipitation conversion rates [45,46]. Additionally, warming escalates transpiration from surface vegetation and soil moisture evaporation [47]. The desert regions, potentially receiving less precipitation than the oases, are expected to experience a rise in meteorological drought occurrences. In terms of hydrological droughts, as indicated by changes in SRI and STI, a notable increment is anticipated in the TRB for projected periods, potentially driven by the intensified melting of glaciers due to global warming [48]. This process may temporarily heighten river discharge and terrestrial water reserves. However, the resultant expansion of water bodies and the consequent increase in actual evapotranspiration will speed up the basin’s hydrological cycle and enhance atmospheric water vapor contribution. Consequently, this leads to a probable increase in the frequency of hydrological droughts.
In the context of SSP126, SSP245, and SSP585 scenarios, our research deployed a range of drought indices and MME forecasting methods to investigate the influence of climate change on drought attributes. A distinctive aspect of this study is the use of conditional probabilities to analyze the relationships between disparate meteorological and hydrological drought scenarios within the TRB basin, a focus relatively underexamined in prior studies. Our analysis indicates that, maintaining a consistent hydrological drought category, the evolution of meteorological droughts from moderate to extreme intensifies both the occurrence probability and spatial extent of hydrological droughts. On the other hand, under a steady meteorological drought condition, the propensity and scope for triggering hydrological droughts of various severities gradually lessen. Notably, these outcomes are consistent across various propagation time scales.
Our study also reveals that the oasis areas in the southwest and northeast of the TRB are more susceptible to the propagation of meteorological droughts into hydrological droughts triggered by insufficient runoff, compared to the central and eastern parts of the TRB where such risk is relatively lower. Moreover, in the western parts of the TRB and the core areas of the Taklamakan Desert, there is a heightened risk of meteorological droughts transitioning into hydrological droughts caused by depleted terrestrial water reserves. Meanwhile, this risk of propagation is substantially lower in the oasis zones of the eastern and central TRB. These findings can serve as valuable references for the future control and management of water resources in the basin, aiding in the prevention of hydrological droughts to a certain degree.
Our study omits the determination of the ideal cumulative distribution functions for SPEI, SRI, and STI, opting instead to employ computational methods previously established by others in analogous studies [49,50,51]. The inclusion of this determination step in the data preprocessing phase could markedly bolster the data accuracy and meticulousness [52,53,54,55]. Furthermore, the lack of prolonged observational data precludes the possibility of rectifying reanalysis data, which may partly account for certain discrepancies in our results. Our study has not yet investigated the influence of human activities on the trends in drought variability and the propagation of drought conditions. Notably, with the implementation of China’s two-child policy in 2014, the resultant population increase has escalated the demand for water resources [56], potentially accelerating the consumption of runoff and groundwater, and aggravating hydrological drought conditions [57]. However, human efforts to modify the natural environment, such as through the construction of water storage systems, can alleviate some regional water imbalances and lower the risk of hydrological droughts in certain areas, thereby indirectly delaying the transition from meteorological to hydrological droughts. Additional research is necessary to determine the impact of anthropogenic actions on the development and spread of hydrological droughts. The study’s scope includes areas with a high prevalence of barren land use, such as deserts, where human activity is minimal or non-existent. It may be beneficial for subsequent research to omit such regions to concentrate on areas where human activity is prevalent. Furthermore, examining the process by which meteorological droughts evolve into other drought forms is critical for a more comprehensive understanding of drought risks amidst climate change.

Author Contributions

X.D.: conceptualization, data curation, formal analysis, software, writing—original draft. Y.Y.: conceptualization, resources, funding acquisition, writing—review and editing. M.Y.: conceptualization, writing—review and editing. Q.W.: conceptualization, writing—review and editing. L.Z.: visualization, writing—review and editing. Z.G.: visualization, writing—review and editing. J.Z.: data curation, software. I.M.: investigation, formal analysis. W.M.: conceptualization, writing—original draft. R.Y.: funding acquisition, supervision. All authors have read and agreed to the published version of the manuscript.

Funding

This research has been supported by the Key Research and Development Program of Xinjiang (2022B01032-4) and National Natural Science Foundation of China (no. 42107084).

Institutional Review Board Statement

Not applicable.

Informed Consent Statement

Not applicable.

Data Availability Statement

Dataset available upon request to the corresponding authors. The data are not publicly available due to privacy restrictions.

Conflicts of Interest

The authors declare no conflict of interest.

References

  1. Cook, B.I.; Mankin, J.S.; Marvel, K.; Williams, A.P.; Smerdon, J.E.; Anchukaitis, K.J. Twenty-First Century Drought Projections in the CMIP6 Forcing Scenarios. Earth’s Future 2020, 8, e2019EF001461. [Google Scholar] [CrossRef]
  2. Mishra, A.K.; Singh, V.P. A review of drought concepts. J. Hydrol. 2010, 391, 202–216. [Google Scholar] [CrossRef]
  3. Wilhite, D.A.; Glantz, M.H. Understanding: The Drought Phenomenon: The Role of Definitions. Water Int. 1985, 10, 111–120. [Google Scholar] [CrossRef]
  4. Huang, J.; Yu, H.; Dai, A.; Wei, Y.; Kang, L. Drylands Face Potential Threat under 2 °C Global Warming Target. Nat. Clim. Chang. 2017, 7, 417–422. [Google Scholar] [CrossRef]
  5. Ma, Z.; Fu, C.; Yang, Q.; Zheng, Z.; Lü, M.; Li, M.; Duan, Y.; Chen, L. Drying Trend in Northern China and Its Shift during 1951–2016. Chin. J. Atmos. Sci. 2018, 42, 951–961. [Google Scholar] [CrossRef]
  6. Miao, L.; Ye, P.; He, B.; Chen, L.; Cui, X. Future Climate Impact on the Desertification in Dry Land Asia Using AVHRR GIMMS NDVI3g Data. Remote Sens. 2015, 7, 3863–3877. [Google Scholar] [CrossRef]
  7. Li, Z.; Hao, Z.; Shi, X.; Déry, S.J.; Li, J.; Chen, S.; Li, Y. An Agricultural Drought Index to Incorporate the Irrigation Process and Reservoir Operations: A Case Study in the Tarim River Basin. Glob. Planet. Chang. 2016, 143, 10–20. [Google Scholar] [CrossRef]
  8. Xia, J.; Yang, P.; Zhan, C.; Qiao, Y. Analysis of Changes in Drought and Terrestrial Water Storage in the Tarim River Basin Based on Principal Component Analysis. Hydrol. Res. 2019, 50, 761–777. [Google Scholar] [CrossRef]
  9. Chen, Y.-N.; Li, W.-H.; Xu, C.-C.; Hao, X.-M. Effects of Climate Change on Water Resources in Tarim River Basin, Northwest China. J. Environ. Sci. 2007, 19, 488–493. [Google Scholar] [CrossRef]
  10. Zhao, L.; Lyu, A.; Wu, J.; Hayes, M.; Tang, Z.; He, B.; Liu, J.; Liu, M. Impact of Meteorological Drought on Streamflow Drought in Jinghe River Basin of China. Chin. Geogr. Sci. 2014, 24, 694–705. [Google Scholar] [CrossRef]
  11. Yang, P.; Xia, J.; Zhang, Y.; Zhan, C.; Sun, S. How is the Risk of Hydrological Drought in the Tarim River Basin, Northwest China? Sci. Total Environ. 2019, 693, 133555. [Google Scholar] [CrossRef] [PubMed]
  12. Zhang, X.; Hao, Z.; Singh, V.P.; Zhang, Y.; Feng, S.; Xu, Y.; Hao, F. Drought Propagation under Global Warming: Characteristics, Approaches, Processes, and Controlling Factors. Sci. Total Environ. 2022, 838 Pt 2, 156021. [Google Scholar] [CrossRef] [PubMed]
  13. Zeng, J.; Li, J.; Lu, X.; Wei, Z.; Shangguan, W.; Zhang, S.; Dai, Y.; Zhang, S. Assessment of Global Meteorological, Hydrological and Agricultural Drought under Future Warming Based on CMIP6. Atmos. Ocean. Sci. Lett. 2022, 15, 100143. [Google Scholar] [CrossRef]
  14. Eyring, V.; Bony, S.; Meehl, G.A.; Senior, C.A.; Stevens, B.; Stouffer, R.J.; Taylor, K.E. Overview of the Coupled Model Intercomparison Project Phase 6 (CMIP6) Experimental Design and Organization. Geosci. Model Dev. 2016, 9, 1937–1958. [Google Scholar] [CrossRef]
  15. The CMIP6 landscape. Nat. Clim. Chang. 2019, 9, 727. [CrossRef]
  16. O’Neill, B.C.; Kriegler, E.; Riahi, K.; Ebi, K.L.; Hallegatte, S.; Carter, T.R.; Mathur, R.; van Vuuren, D.P. A New Scenario Framework for Climate Change Research: The Concept of Shared Socioeconomic Pathways. Clim. Chang. 2014, 122, 387–400. [Google Scholar] [CrossRef]
  17. Wu, L. Tarim River Basin Boundary; National Cryosphere Desert Data Center: Lanzhou, China, 2023. [Google Scholar] [CrossRef]
  18. Yang, J.; Huang, X. The 30 m annual land cover datasets and its dynamics in China from 1985 to 2022. Datasets 2023, 1, 8176941. [Google Scholar] [CrossRef]
  19. Yu, Y.; Yu, R.; Chen, X.; Yu, G.; Gan, M.; Disse, M. Agricultural Water Allocation Strategies along the Oasis of Tarim River in Northwest China. Agric. Water Manag. 2017, 187, 24–36. [Google Scholar] [CrossRef]
  20. Muñoz Sabater, J. ERA5-Land Hourly Data from 1950 to Present; Copernicus Climate Change Service (C3S) Climate Data Store (CDS): Reading, UK, 2019. [Google Scholar] [CrossRef]
  21. Beaudoing, H.; Rodell, M.; NASA/GSFC/HSL. GLDAS Noah Land Surface Model L4 Monthly 0.25 × 0.25 Degree V2.0; Goddard Earth Sciences Data and Information Services Center (GES DISC): Greenbelt, MD, USA, 2019. [Google Scholar] [CrossRef]
  22. Rodell, M.; Houser, P.R.; Jambor, U.; Gottschalck, J.; Mitchell, K.; Meng, C.; Arsenault, K.; Cosgrove, B.; Radakovich, J.; Bosilovich, M.; et al. The Global Land Data Assimilation System. Bull. Am. Meteor. Soc. 2004, 85, 381–394. [Google Scholar] [CrossRef]
  23. Guo, H.; Bao, A.; Chen, T.; Zheng, G.; Wang, Y.; Jiang, L.; De Maeyer, P. Assessment of CMIP6 in Simulating Precipitation Over Arid Central Asia. Atmos. Res. 2021, 252, 105451. [Google Scholar] [CrossRef]
  24. Zhang, X.; Hua, L.; Jiang, D. Assessment of CMIP6 model performance for temperature and precipitation in Xinjiang, China. Atmos. Ocean. Sci. Lett. 2022, 15, 100128. [Google Scholar] [CrossRef]
  25. Vicente-Serrano, S.M.; Beguería, S.; López-Moreno, J.I. A Multiscalar Drought Index Sensitive to Global Warming: The Standardized Precipitation Evapotranspiration Index. J. Clim. 2010, 23, 1696–1718. [Google Scholar] [CrossRef]
  26. Allen, R.G.; Pereira, L.S.; Raes, D.; Smith, M. Crop Evapotranspiration-Guidelines for Computing Crop Water Requirements-FAO Irrigation and Drainage Paper 56; FAO: Rome, Italy, 1998; Volume 300, p. D05109. Available online: https://www.fao.org/3/X0490E/x0490e00.htm (accessed on 15 January 2023).
  27. Li, H.; Li, Z.; Chen, Y.; Xiang, Y.; Liu, Y.; Kayumba, P.M.; Li, X. Drylands Face Potential Threat of Robust Drought in the CMIP6 SSPs Scenarios. Environ. Res. Lett. 2021, 16, 114004. Available online: https://iopscience.iop.org/article/10.1088/1748-9326/ac2bce (accessed on 24 May 2023). [CrossRef]
  28. Shukla, S.; Wood, A.W. Use of a Standardized Runoff Index for Characterizing Hydrologic Drought. Geophys. Res. Lett. 2008, 35, L02405. [Google Scholar] [CrossRef]
  29. McKee, T.B.; Doesken, N.J.; Kleist, J. The Relationship of Drought Frequency and Duration to Time Scales. In Proceedings of the 8th Conference on Applied Climatology, Anaheim, CA, USA, 17–22 January 1993; Volume 17, pp. 179–183. Available online: https://climate.colostate.edu/pdfs/relationshipofdroughtfrequency.pdf (accessed on 20 May 2023).
  30. Li, L.; Zhao, L.; Ge, J.; Yang, P.; Wu, F. Investigating Drought Propagation Time, Relationship, and Drivers in Perennial River Basins of China. Water 2022, 14, 2812. [Google Scholar] [CrossRef]
  31. Cui, A.; Li, J.; Zhou, Q.; Zhu, R.; Liu, H.; Wu, G.; Li, Q. Use of a Multiscalar GRACE-Based Standardized Terrestrial Water Storage Index for Assessing Global Hydrological Droughts. J. Hydrol. 2021, 603, 126871. [Google Scholar] [CrossRef]
  32. Lian, H.; Han, X.; Liu, Y.; Han, Y.; Yang, W.; Xiong, W. Study on Spatiotemporal Characteristics of Atmospheric Drought from 1981 to 2020 in the Mu Us Sandy Land of China Based on SPEI Index. J. Desert Res. 2022, 42, 71–80. [Google Scholar]
  33. Li, S.; Zeng, L.; Zhang, C.-J.; Xiao, C.; Zhang, Q.; Gong, W.-T. Spatio-temporal Variations and Propagation from Meteorological to Hydrological Drought in the Upper Yangtze River Basin Over the Last 120 Years. Adv. Clim. Chang. Res. 2023, 19, 263–277. [Google Scholar]
  34. Tong, Y.; Gao, X.; Han, Z.; Xu, Y.; Xu, Y.; Giorgi, F. Bias Correction of Temperature and Precipitation Over China for RCM Simulations Using the QM and QDM Methods. Clim. Dyn. 2021, 57, 1425–1443. [Google Scholar] [CrossRef]
  35. Shin, Y.; Lee, Y.; Choi, J.T.; Park, J.-S. Integration of Max-Stable Processes and Bayesian Model Averaging to Predict Extreme Climatic Events in Multi-Model Ensembles. Stoch. Environ. Res. Risk Assess. 2018, 33, 47–57. Available online: https://api.semanticscholar.org/CorpusID:125289406 (accessed on 3 January 2023). [CrossRef]
  36. Jehanzaib, M.; Sattar, M.N.; Lee, J.-H.; Kim, T.-W. Investigating Effect of Climate Change on Drought Propagation from Meteorological to Hydrological Drought Using Multi-Model Ensemble Projections. Stoch. Environ. Res. Risk Assess. 2020, 34, 7–21. [Google Scholar] [CrossRef]
  37. Tan, Y.X.; Ng, J.L.; Huang, Y.F. Spatiotemporal Variability Assessment and Accuracy Evaluation of Standardized Precipitation Index and Standardized Precipitation Evapotranspiration Index in Malaysia. Earth Sci. Inform. 2023, 16, 67–89. [Google Scholar] [CrossRef]
  38. Guo, H.; Bao, A.; Liu, T.; Jiapaer, G.; Ndayisaba, F.; Jiang, L.; Kurban, A.; De Maeyer, P. Spatial and Temporal Characteristics of Droughts in Central Asia During 1966–2015. Sci. Total Environ. 2018, 624, 1523–1538. [Google Scholar] [CrossRef] [PubMed]
  39. Ding, Y.; Xu, J.; Wang, X.; Cai, H.; Zhou, Z.; Sun, Y.; Shi, H. Propagation of meteorological to hydrological drought for different climate regions in China. J. Environ. Manag. 2021, 283, 111980. [Google Scholar] [CrossRef] [PubMed]
  40. Huang, S.; Huang, Q.; Chang, J.; Leng, G.; Xie, Y. The propagation from meteorological to hydrological drought and its potential influence factors. J. Hydrol. 2017, 547, 184–195. [Google Scholar] [CrossRef]
  41. Shi, P.; Tang, H.; Qu, S.; Wen, T.; Zhao, L.; Li, Q. Characteristics of Propagation from Meteorological Drought to Hydrological Drought in Southwest China. Water Resour. Prot. 2023, 39, 49–56. [Google Scholar] [CrossRef]
  42. Barker, L.J.; Hannaford, J.; Chiverton, A.; Svensson, C. From meteorological to hydrological drought using standardised indicators. Hydrol. Earth Syst. Sci. 2016, 20, 2483–2505. [Google Scholar] [CrossRef]
  43. Kumar, R.; Musuuza, J.L.; Van Loon, A.F.; Teuling, A.J.; Barthel, R.; Ten Broek, J.; Mai, J.; Samaniego, L.; Attinger, S. Multiscale Evaluation of the Standardized Precipitation Index as a Groundwater Drought Indicator. Hydrol. Earth Syst. Sci. 2016, 20, 1117–1131. [Google Scholar] [CrossRef]
  44. Intergovernmental Panel on Climate Change. Climate Change 2007: Impacts, Adaptation and Vulnerability; Intergovernmental Panel on Climate Change: Geneva, Switzerland, 2001; Available online: https://www.ipcc.ch/report/ar4/wg2/ (accessed on 15 December 2023).
  45. Li, R.; Wang, C.; Wu, D. Changes in Precipitation Recycling over Arid Regions in the Northern Hemisphere. Theor. Appl. Climatol. 2018, 131, 489–502. [Google Scholar] [CrossRef]
  46. Li, R.; Wang, C. Precipitation Recycling Using a New Evapotranspiration Estimator for Asian-African Arid Regions. Theor. Appl. Climatol. 2020, 140, 1–13. [Google Scholar] [CrossRef]
  47. Zhan, Y.J.; Zhang, W.; Yan, Y.; Wang, C.X.; Rong, Y.J.; Zhu, J.Y.; Lu, H.T.; Zheng, T.C. Analysis of actual evapotranspiration evolution and influencing factors in the Yangtze River Basin. Acta Ecol. Sin. 2021, 41, 6924–6935. [Google Scholar]
  48. Wang, C.; Zhang, S.; Zhang, F.; Li, K.; Yang, K. On the Increase of Precipitation in Northwestern China Under Global Warming. Adv. Earth Sci. 2021, 36, 980–989. [Google Scholar] [CrossRef]
  49. Zhang, L.; Yu, Y.; Malik, I.; Wistuba, M.; Sun, L.; Yang, M.; Wang, Q.; Yu, R. Water Resources Evaluation in Arid Areas Based on Agricultural Water Footprint—A Case Study on the Edge of the Taklimakan Desert. Atmosphere 2023, 14, 67. [Google Scholar] [CrossRef]
  50. He, J.; Li, B.; Yu, Y.; Sun, L.; Zhang, H.; Malik, I.; Wistuba, M.; Yu, R. Temporal Variability of Temperature, Precipitation and Drought Indices in Hyper-Arid Region of Northwest China for the Past 60 Years. Atmosphere 2022, 13, 1561. [Google Scholar] [CrossRef]
  51. Sun, Y.; Chen, X.; Yu, Y.; Qian, J.; Wang, M.; Huang, S.; Xing, X.; Song, S.; Sun, X. Spatiotemporal Characteristics of Drought in Central Asia from 1981 to 2020. Atmosphere 2022, 13, 1496. [Google Scholar] [CrossRef]
  52. Abu Arra, A.; Şişman, E. Characteristics of Hydrological and Meteorological Drought Based on Intensity-Duration-Frequency (IDF) Curves. Water 2023, 15, 3142. [Google Scholar] [CrossRef]
  53. Cheval, S. The Standardized Precipitation Index—An overview. Rom. J. Meteorol. 2015, 12, 17–64. [Google Scholar]
  54. Laimighofer, J.; Laaha, G. How standard are standardized drought indices? Uncertainty components for the SPI & SPEI case. J. Hydrol. 2022, 613, 128385. [Google Scholar] [CrossRef]
  55. Yao, N.; Zhao, H.; Li, Y.; Biswas, A.; Feng, H.; Liu, F.; Pulatov, B. National-Scale Variation and Propagation Characteristics of Meteorological, Agricultural, and Hydrological Droughts in China. Remote Sens. 2020, 12, 3407. [Google Scholar] [CrossRef]
  56. Wang, A.; Wang, Y.; Su, B.; Kundzewicz, Z.W.; Tao, H.; Wen, S.; Qin, J.; Gong, Y.; Jiang, T. Comparison of changing population exposure to droughts in river basins of the Tarim and the Indus. Earth’s Future 2020, 8, e2019EF001448. [Google Scholar] [CrossRef]
  57. Liu, Y.; Chen, Y. Impact of Population Growth and Land-Use Change on Water Resources and Ecosystems of the Tarim River Basin in Western China. Int. J. Sustain. Dev. World Ecol. 2006, 13, 295–305. [Google Scholar] [CrossRef]
Figure 1. Overview of the study area. (a) The specific geographic location of the Tarim River Basin as referred to in this study in China; (b) sub-basin divisions of the Tarim River Basin; (c) topography of the Tarim River Basin; (d) land use and cover change types in the Tarim River Basin; (e) the range of gridded data used in this study.
Atmosphere 15 00050 g001
Figure 2. Schematic diagram of a probabilistic graphical model.
Atmosphere 15 00050 g002
Figure 3. DF on a one-month timescale for SPEI, SRI, and STI during the historical baseline period. Variations in DF during the projected periods as compared to the historical period, with negative values indicating a decrease and positive values indicating an increase.
Atmosphere 15 00050 g003
Figure 4. Probability of different classes of SRI1 under different classes of SPEI6 during the historical baseline period. Average probability of different classes of SRI1 under different classes of SPEI6 in each sub-basin of TRB.
Atmosphere 15 00050 g004
Figure 5. Probability of different classes of STI1 under different classes of SPEI12 during the historical baseline period. Average probability of different classes of STI1 under different classes of SPEI12 in each sub-basin of TRB.
Atmosphere 15 00050 g005
Figure 6. Propagation probability of different classes of SPEI into SRI under all scenarios: (a) historical baseline period, (b) SSP126 projected period, (c) SSP245 projected period, (d) SSP585 projected period.
Atmosphere 15 00050 g006
Figure 7. Propagation probability of different classes of SPEI into STI under all scenarios: (a) historical baseline period, (b) SSP126 projected period, (c) SSP245 projected period, (d) SSP585 projected period.
Atmosphere 15 00050 g007
Table 1. Basic information on the five CMIP6 GCMs applied in this study.
ModelInstituteHorizontal Resolution
ACCESS-ESM1-5Commonwealth Scientific and Industrial Organization (CSIRO) 1 . 875 ° × 1 . 25 °
EC-Earth3EC-Earth-Consortium 0 . 7 ° × 0 . 7 °
EC-Earth3-VegEC-Earth-Consortium 0 . 7 ° × 0 . 7 °
GFDL-ESM4Geophysical Fluid Dynamics Laboratory (NOAAGFDL) 1 . 25 ° × 1 °
IPSL-CM6A-LRInstitute Pierre Simon Laplace (IPSL) 2 . 5 ° × 1 . 26 °
Table 2. Categorization of drought severity by the drought indices.
CategorizationSPEI/SRI/STI
Normal and Light≥−1.00
Moderate 1.50 to 1.00
Severe 2.00 to 1.50
Extreme≤−2.00
Disclaimer/Publisher’s Note: The statements, opinions and data contained in all publications are solely those of the individual author(s) and contributor(s) and not of MDPI and/or the editor(s). MDPI and/or the editor(s) disclaim responsibility for any injury to people or property resulting from any ideas, methods, instructions or products referred to in the content.

