
Effects of Biochar Amendment on N2O Emissions from Soils with Different pH Levels
by
 ,
,
Feng Lin
1,†, 
Hong Wang
2,†,
Hiba Shaghaleh
3,* ,
,
Amar Ali Adam Hamad
3,
Yaojun Zhang
4,
Bairen Yang
5 and
Yousef Alhaj Hamoud
6,*
1
School of Environmental Engineering, Nanjing Institute of Technology, Nanjing 211167, China
2
College of Resource and Environment, Anhui Science and Technology University, Chuzhou 233100, China
3
College of Environment, Hohai University, Nanjing 210098, China
4
International Joint Research Laboratory for Global Change Ecology, School of Life Sciences, Henan University, Kaifeng 475004, China
5
School of Environmental Science and Engineering, Yancheng Institute of Technology, Yancheng 224051, China
6
College of Hydrology and Water Resources, Hohai University, Nanjing 210098, China
*
Authors to whom correspondence should be addressed.
†
These authors contributed equally to this article.
Atmosphere 2024, 15(1), 68; https://doi.org/10.3390/atmos15010068
Submission received: 13 December 2023
/
Revised: 30 December 2023
/
Accepted: 3 January 2024
/
Published: 5 January 2024
(This article belongs to the Special Issue Gas Emissions in Agriculture)
Abstract
:Biochar application has the potential for mitigating N2O emissions from agricultural soils and has been suggested as a management practice to ameliorate soil fertility and increase crop productivity. Nevertheless, the influence of biochar addition on N2O emissions from soils with different pH levels is not yet clear, which results in a poor understanding of the mechanisms regarding biochar application to soil N2O mitigation. A 40-day incubation experiment was carried out in the present study to investigate the impact of biochar on N2O emissions from soils with different natural pH. Four treatments (control, nitrogen fertilizer application, biochar amendment, and N plus biochar amendment) were set up separately in soils with three different natural pH levels (acidic vegetable soil, neutral rice soil, and alkaline soil). Our results showed that adding biochar significantly decreased N2O emissions by 20.8% and 47.6% in acidic vegetable soil for both N and no N addition treatments, respectively. For neutral and alkaline soils, the reduction of N2O emissions by biochar amendment was only significant for N addition treatments in alkaline soil. Soil pH and NO3−-N concentration were significantly affected by biochar amendment (soil pH increased by 1.43–1.56, 0.57–0.70, and 0.29–0.37 units for acidic vegetable soil, neutral rice soil, and alkaline soil, respectively). Thus, biochar amendment could be used as an effective management practice for mitigating N2O emissions from acidic and alkaline soils.
1. Introduction
Nitrous oxide (N2O) is an important long-lived greenhouse gas with 298 times greater global warming potential than CO2 over a 100-year horizon [1]. Moreover, N2O also plays a critical role in atmospheric photochemistry processes, which are involved in stratospheric ozone depletion [2]. The increasing rate of atmospheric N2O concentration is estimated to be 0.95 ppb yr−1 for the last decade, and the concentration of N2O increased to 331 ppb in 2018 [3]. Globally, agricultural soil is the major source of atmospheric N2O emissions, which account for 80% of the increase in worldwide terrestrial N2O emissions due to an excessive application of nitrogen fertilizer [4,5].
Biochar, produced from the low-temperature pyrolysis of biomass in a completely or partially oxygen-deficient environment, has been recommended as a means to improve soil fertility and enhance crop productivity, and, meanwhile, as an effective strategy for combating climate change [6]. To date, many studies have shown that biochar has the potential to manipulate soil nitrification, denitrification, and N immobilization [7,8,9]; such impact on these processes may further influence soil N2O emissions from the agroecosystem. Additionally, all these processes are affected by various environmental factors (e.g., soil pH, soil temperature, and soil moisture) [10,11,12,13,14].
Soil pH is a key factor influencing soil N2O emissions, as it regulates the production pathways of N2O emissions [10]. Weslien et al. [15] reported that the mean annual N2O emission was strongly correlated with soil pH, and N2O emission increased with decreased soil pH. In contrast, He et al. [16] found that soil N2O emissions increased in acidic soil with increased pH. As Butterbach-Bahl et al. [17] mentioned, scientific knowledge of soil N2O emissions controlled by different soil pH levels is still scarce. Furthermore, applying biochar (generally with rich carbon content and high pH) to soil may increase organic carbon contents, pH, and aeration, subsequently changing soil N2O emissions [18,19]. Zhang et al. [20] reported that adding biochar mixed with N fertilizer decreased N2O emissions in acidic soils by 10–23%, compared to N fertilizer alone. Nelissen et al. [21] observed that biochar amendment decreased N2O emissions in neutral soils. In comparison, Clough et al. [22] found increased N2O emissions in biochar treatment in alkaline soils. Conversely, Dong et al. [23] found that biochar suppressed N2O production in alkaline soils. According to Shakoor et al. [24], applying biochar can raise the complexity of its effects on N2O emissions under different pH levels. Therefore, different soil pH may interfere with N2O emissions in biochar-addition soils, making adding biochar either effective or futile.
To our knowledge, few studies have examined the influence of biochar addition on N2O emissions in soils with various natural pH levels. For this study, we conducted a laboratory incubation by incorporating biochar and N fertilizer into soils with different natural pH. This incubation study aimed to investigate the influence of biochar amendment on N2O emissions from three soils with different natural pH levels (acidic vegetable soil, neutral rice soil, and alkaline soil).
2. Materials and Methods
2.1. Soil and Biochar
All samples were collected from three typical arable soils in the upper 15 cm layer. The three kinds of soil samples were collected from a vegetable field (Suoshi Village, 32°04′ N, 118°58′ E) and a rice field (Jiangsu Academy of Agricultural Sciences, 32°03′ N, 118°87′ E) located in Nanjing, Jiangsu province, China, and a coastal saline field (field station of Nanjing Agricultural University, 33°19′ N, 120°45′ E) located in Dafeng, Jiangsu province, China, respectively. Visible plant detritus and fragments were removed from soil samples after being air-dried. Then, soil samples were passed through a 2 mm stainless steel sieve. The biochar used in our incubation was produced from wheat straw, which was pyrolyzed at 500 °C. Similar to soil samples, the biochar was ground and passed through a 2 mm sieve before incubation. The physicochemical properties of the selected biochar and soil samples are shown in Table 1.
2.2. Incubation Experiment
A 40-day incubation experiment was carried out to examine the impact of biochar amendment on N2O emission. Four treatments were performed: control, only N application (N), only biochar amendment (B), and N plus biochar amendment (NB). Four replicates were conducted for each treatment. Biochar at a rate of 4% (w/w, dry weight) and 80 g of soil (oven-dry weight) was added to an Erlenmeyer flask (250 mL) and mixed thoroughly. Soil moisture was regulated to 60% water-holding capacity (WHC), and samples were pre-incubated at 25 °C in the dark for one week to stabilize the microbial activity and avoid an undesired microbial peak. For N and NB treatments, 34.8 mg of urea containing 16 mg of N was dissolved and added to each flask. The flasks were covered with parafilm to prevent water evaporation and maintain soil humidity. In addition, the flasks were weighed and distilled water was added to compensate water losses when needed. Meanwhile, four other replicates for each treatment were set up and sampled to determine the changes in soil mineral N (NO3−-N, NH4+-N) concentrations on days 3, 5, 10, 20, and 40.
2.3. N2O Measurements
Gas samples from the headspace of the flasks were collected using a gas-tight syringe on days 1, 2, 3, 4, 5, 6, 7, 9, 10, 12, 15, 18, 20, 22, 25, 30, 35, and 40 of the incubation. The headspace air in the flasks was mixed with ambient air for 5 min at a rate of 200 mL min−1 before taking a sample for each measurement. Then, the flasks were sealed with rubber stoppers and fitted with butyl rubber for 2 h for gas sampling. The ambient air sample was the initial concentration to calculate the N2O emission rate. The headspace air in the flasks was collected to measure the increase in gas concentration. After gas sampling, flasks were flushed with ambient air and kept open. The N2O concentration was determined by a gas chromatograph (GC) (7890A GC System, Agilent Technologies, Santa Clara, CA, USA) equipped with an electron capture detector (ECD). The ECD and column were set at 300 °C and 40 °C, respectively. A mixture of argon–CH4 (5%) was used as the carrier gas, and the flow rate was set at 40 mL min−1. The N2O flux was calculated using a nonlinear fitting approach as follows:
where h is the height of the chamber in m, C is the concentration in ppb, and t is the time in s. The slope dC/dt is the slope of the gas concentration curve, which can be estimated using the exponential regression method [25].
2.4. Chemical Analysis of Soil and Biochar
Soil mineral N (NH4+-N and NO3−-N) was extracted by 2 M KCl at a soil/water ratio of 1:5 and shaken (200 rev min−1) at 25 °C for 1 h. Concentrations of soil NH4+-N and NO3−-N were determined by an ultraviolet spectrophotometer (HITACHI U-2900, Tokyo, Japan) following two-wavelength ultraviolet spectrometry [26]. The total N content of soil and biochar was determined by Nessler’s colorimetric method, and the total C content of soil and biochar was determined by the combustion method [27]. Soil and biochar pH were analyzed by a PHS-3 C mv/pH detector (Shanghai, China) in a volume ratio of 1:2.5 (soil or biochar/water).
2.5. Data Analysis
A statistical analysis was conducted using SPSS software version 21 (IBM, Armonk, NY, USA). The data were presented as means ± SE (n = 4). A one-way analysis of variance (ANOVA) was performed to evaluate the significant differences in cumulative N2O emissions among all the treatments for each soil. A two-way ANOVA was performed to examine the differences in chemical characteristics and cumulative N2O emissions affected by biochar, N fertilizer, and their interactions. A linear regression analysis was performed to test the correlation between soil pH and N2O emissions.
3. Results
3.1. Soil pH
Soil pH varied from 4.78 to 6.97 in acidic vegetable soil, from 7.05 to 8.00 in neutral rice soil, and from 8.18 to 8.76 in alkaline soil across all treatments (Figure 1). For all soils, biochar amendment increased soil pH compared to no biochar treatments (Figure 1). On the last day of the incubation, biochar amendment increased soil pH by 1.43 and 1.56 units, 0.70 and 0.57 units, and 0.37 and 0.29 units in the N addition and no N addition treatments for acidic vegetable soil, neutral rice soil and alkaline soil, respectively. The increase was more pronounced in acidic vegetable soil. In contrast, applying N fertilizer reduced soil pH compared to the control across the entire incubation period. Compared to the control, N plus biochar amendment showed an increase in soil pH for all soils. Meanwhile, soil pH for the NB treatments was lower than that for the B treatments. The two-way ANOVA showed that soil pH was significantly influenced by biochar and N fertilizer for each soil type (p ≤ 0.001, Table 2). In contrast, their interactions were insignificant for all soils after the 40-day incubation.
3.2. Soil NH4+-N and NO3−-N
At the beginning of the incubation, soil NH4+-N concentrations increased after N addition for all soils (Figure 2a,c,e). NH4+-N decreased sharply on day 5 for N addition treatments in neutral rice soil. In acidic vegetable soil, NH4+-N for N addition treatments decreased to the level of non-nitrogen treatments in the middle of the incubation on day 20. In comparison, NH4+-N increased on day 5 and decreased gradually with incubation time in alkaline soil. Soil NH4+-N concentration for NB treatment was lower than that for N treatment. For no N addition treatments, soil NH4+-N concentrations remained low and rarely changed in all soils. The two-way ANOVA showed that adding biochar and N did not significantly affect NH4+-N concentrations in acidic vegetable and neutral rice soil after 40-day incubation (Table 2). Nevertheless, their interactions significantly influenced NH4+-N concentration in acidic vegetable soil. Converse to acidic vegetable soil, biochar and N fertilizer significantly influenced the NH4+-N concentration in alkaline soil (p < 0.05) but were not significantly affected by their interactions.
Relative to no N addition treatments, soil NO3−-N concentrations remained high in acidic vegetable and neutral rice soil throughout the entire incubation period for the N addition treatments (Figure 2b,d), while in alkaline soil, soil NO3−-N concentration was relatively low for the N addition treatments at the beginning of the incubation and increased with incubation time (Figure 2f). The concentration of NO3−-N was higher in acidic vegetable soil (118.8–174.8 mg kg−1) than in neutral rice (48.9–103.0 mg kg−1) and alkaline (16.4–83.8 mg kg−1) soils. The NO3−-N concentrations for the control and biochar-only (B) treatments remained low during the entire incubation period in all soils. Across all the treatments, soil NO3−-N concentrations were highest in the nitrogen-only treatment and lowest in the biochar-only (B) treatments. The two-way ANOVA showed soil NO3−-N was significantly affected by biochar and N fertilizer (p < 0.05) but not significantly affected by their interactions in all soils (Table 2).
3.3. Nitrous Oxide Emissions
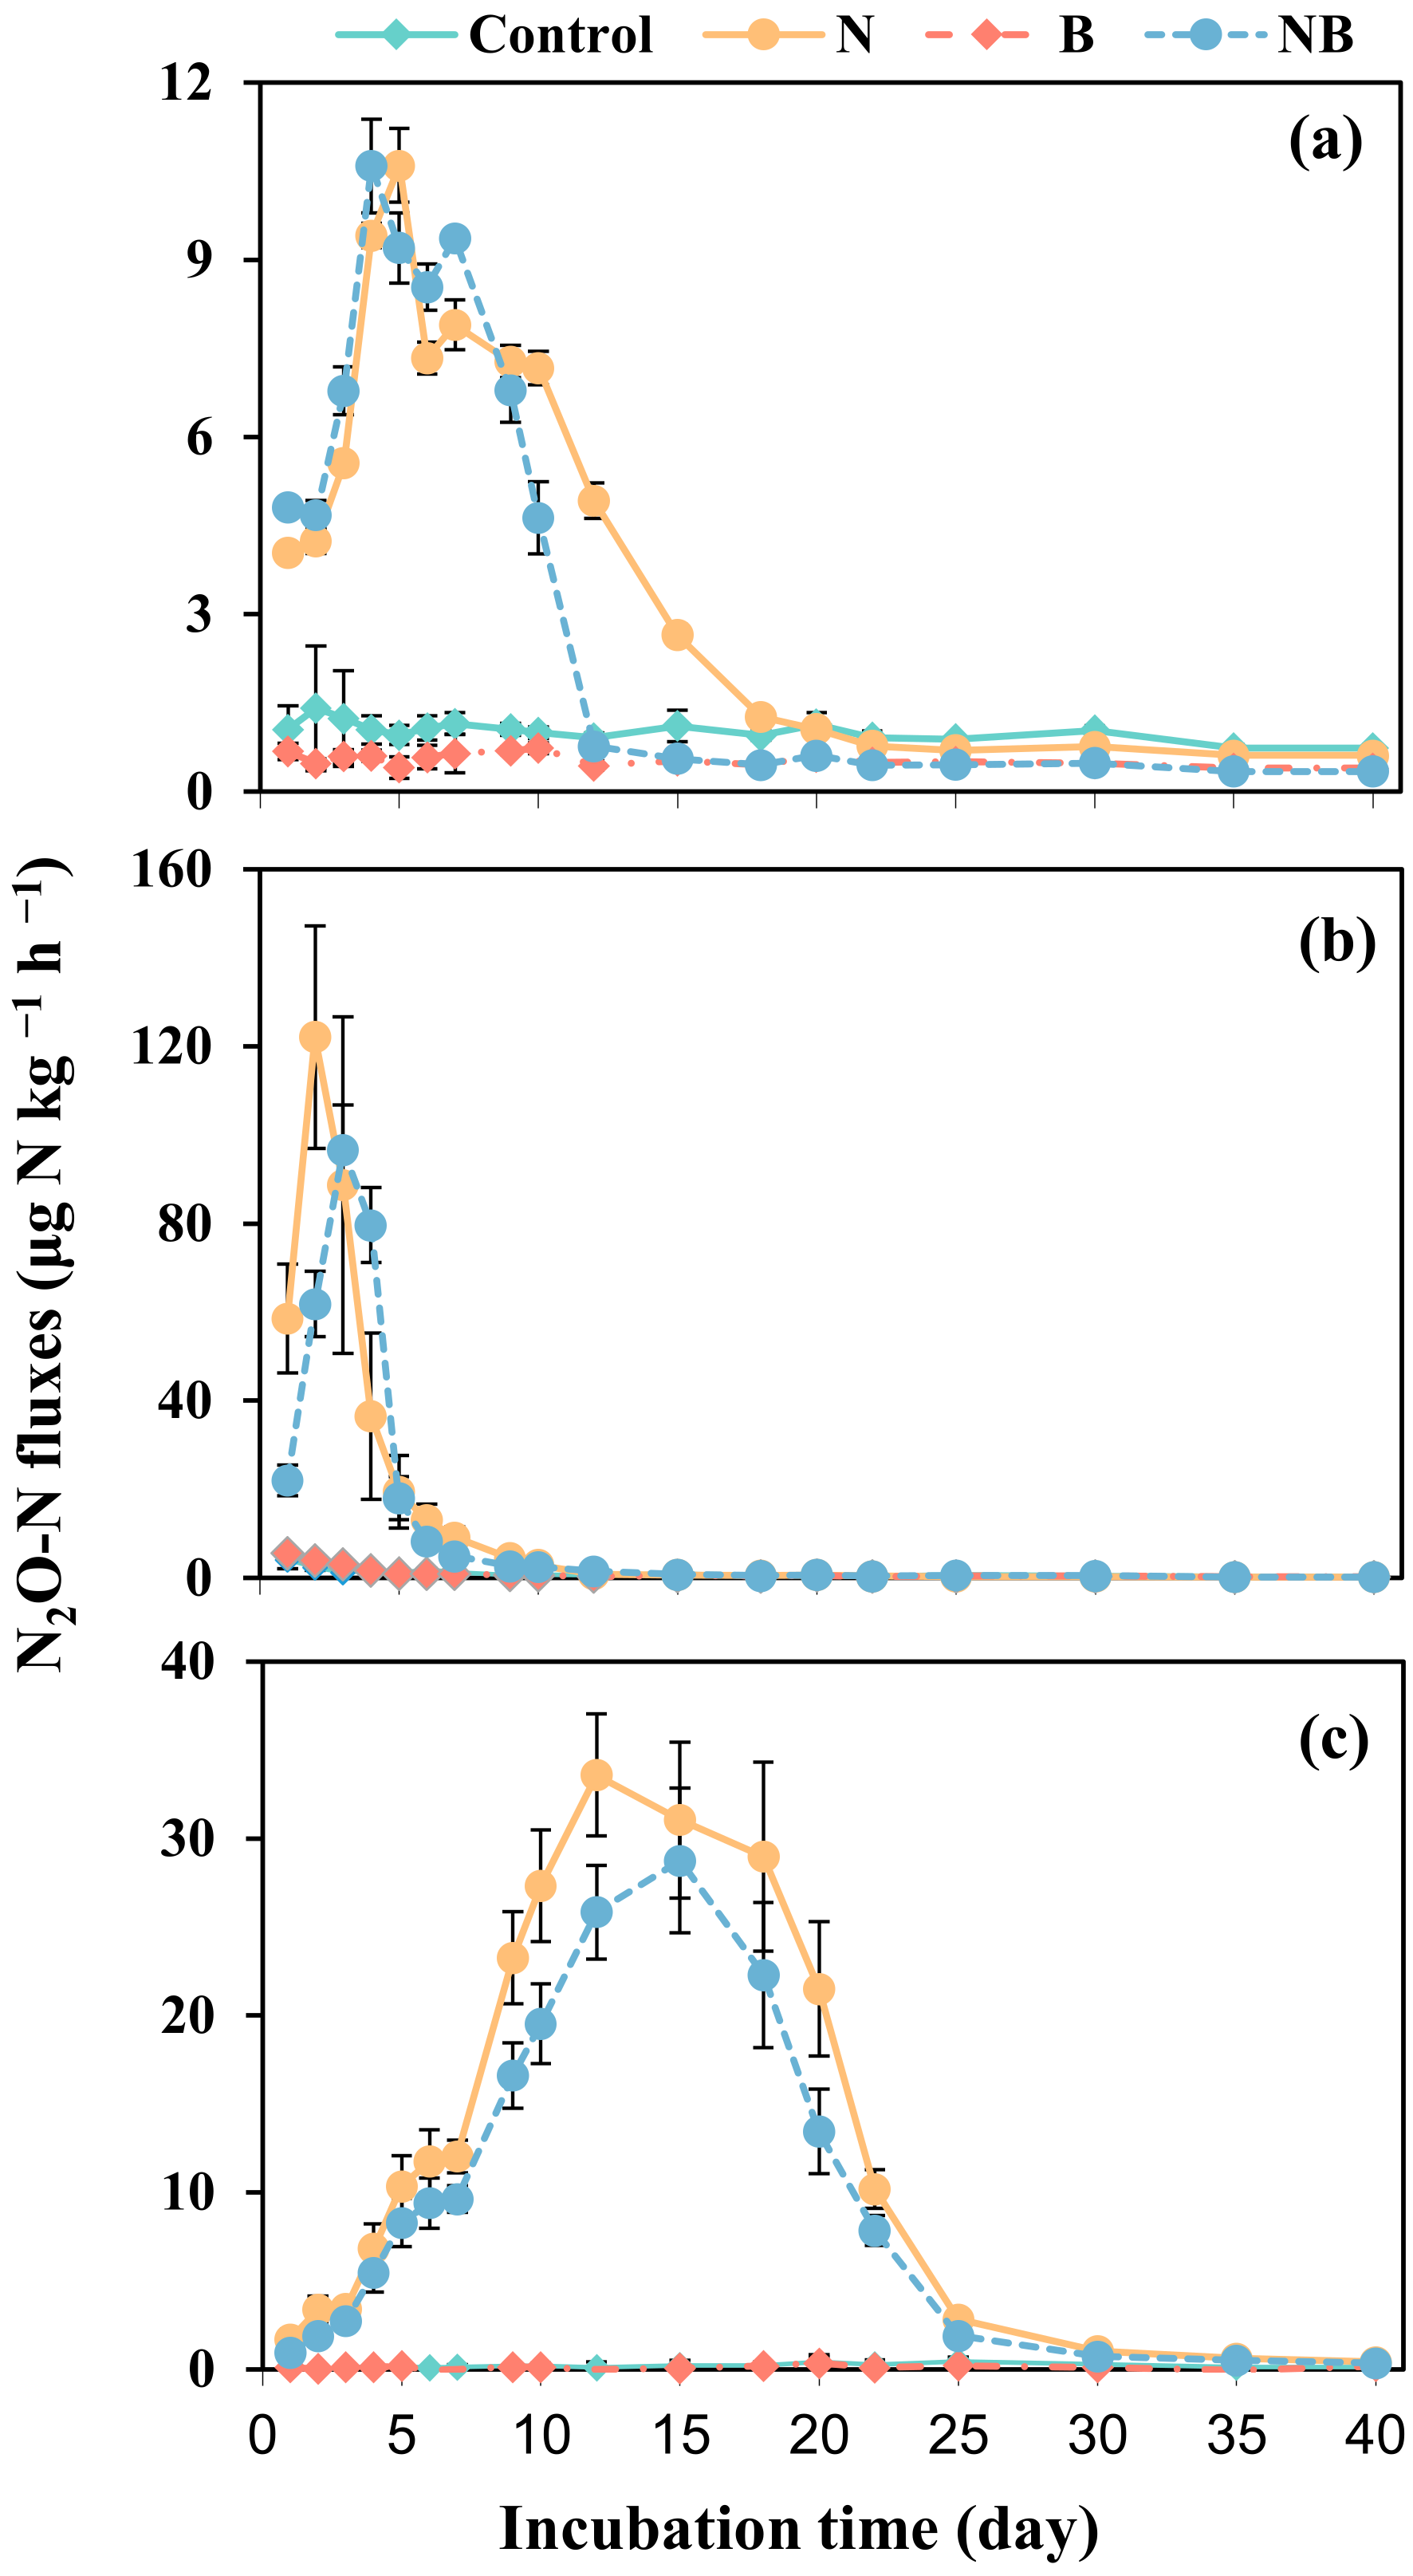
The N2O fluxes showed different temporal variations in the three soils across the incubation (Figure 3). The flux peak was highest in neutral rice soil (122.12 μg N kg−1 h−1) and lowest in acidic vegetable soil (10.59 μg N kg−1 h−1). N2O flux peaks occurred on day 4 and day 5 for NB and N treatment for acidic vegetable soil. The N2O fluxes for NB treatment declined more quickly than for N treatment and reached a steadily low level 6 days earlier than the N treatment (Figure 3a). The pattern of N2O fluxes in neutral rice soil showed a typical pulse release followed by the N addition. The N2O fluxes climbed rapidly to the top on days 2 and 3 for N and NB treatment. Afterward, N2O fluxes declined sharply during the next 2 or 3 days and remained relatively low till the end of incubation (Figure 3b). For alkaline soil, after N addition, the fluxes of N2O increased and reached their peaks on days 12 and 15 for N and NB treatment, respectively, then declined until day 25 of the incubation, and then kept relatively stable for the rest of the period (Figure 3c). The flux peak was lowest in acidic vegetable soil (10.59 μg N kg−1 h−1) and highest in neutral rice soil (122.12 μg N kg−1 h−1). Across the entire incubation period, N2O fluxes were relatively low and steady for the control and B treatments in all soils (Figure 3).
The highest cumulative N2O emissions were measured in N treatment, averaging 2.72, 9.03, and 11.28 mg N kg−1 for acidic vegetable, neutral rice, and alkaline soil, respectively (Figure 4). In acidic vegetable soil, the cumulative N2O emissions were significantly depressed by biochar addition for B (47.6%) and NB (20.8%) treatments relative to the control and N treatments, respectively. Although biochar addition decreased cumulative N2O emissions by 10.6% and 15.4% for B and NB treatments in neutral rice soil, the differences were insignificant. In alkaline soil, NB treatment significantly reduced cumulative N2O emissions by 22.3% relative to N treatment. Meanwhile, the difference between the control and B treatment was not significant. The two-way ANOVA showed that cumulative N2O emission was significantly affected by biochar, N fertilizer, and their interactions in acidic vegetable and alkaline soils (p < 0.05). Nevertheless, cumulative N2O emission was only significantly influenced by N fertilizer in neutral rice soil (Table 2).
4. Discussion
Nitrification, denitrification, and nitrifier denitrification are the three primary microbial processes for N2O production in soil [24]. Previous studies have indicated that the activity of the nitrifier peaked at approximately 60% WHC (water holding capacity) and decreased with a drop in oxygen, while the activity of the denitrifier increased above 70% WHC [10]. In our study, WHC was maintained at 60% across the entire incubation period, and the coupling of NH4+-N decrease and NO3−-N increase was observed clearly in alkaline soil (Figure 2e,f), indicating a strong nitrification process in alkaline soil. However, the coupling of NH4+-N and NO3−-N did not occur in acidic and neutral soils (Figure 2a–d). Chen et al. [28] also demonstrated that the nitrification process is generally higher in alkaline soil than in acidic soil because the oxidization process regulated by autotrophic nitrifier was stronger under slightly alkaline conditions. The availability of mineral nitrogen (NH4+-N, NO3−-N) is a major factor influencing soil nitrous oxide release. Generally, applying N fertilizer increased soil N2O emissions in agricultural systems [29,30]. Consistent with this, all three soils showed large N2O emission peaks after the addition of exogenous nitrogen in our study (Figure 3). The addition of exogenous nitrogen increased NH4+ concentration, and high NH4+ contents suppressed NO2− transformed into NO3− and stimulated NO2− accumulation, which contributed to an increase in N2O emissions [31]. Thus, adding biochar may alter the availability of mineral nitrogen substrates (NH4+-N, NO3−-N) and further affect N2O production. In our incubation, biochar amendment accelerated the NH4+-N consumption when compared with the N fertilization-only treatments, especially for the acidic soil (Figure 2a). This might be attributed to the fact that biochar amendments accelerated nitrification and inhibited the influence of high NH4+ content on NO2− transforming to NO3−, then suppressed N2O formation [32]. In addition, NH4+ could have been directly sorbed by biochar, which reduced the N availability for N2O formation by nitrification [33]. The reduction in mineral N was also attributed to enhancing NH3 volatilization due to increased soil pH with biochar amendment [34]. Throughout the incubation, soil NO3−-N concentrations were much lower for biochar-amended treatments than those for unamended treatments (Figure 2b,d,f), and biochar amendment significantly influenced soil NO3−-N contents in all soils (Table 2). This might be because biochar with a high C: N ratio suppresses the activity of denitrifiers via microbial N immobilization [35]. Alternatively, the surface absorption of NO3− by biochar decreases NO3− availability [36]. The depressed amount of available NO3− could result in a decrease in N2O emissions.
Soil pH is a crucial factor influencing N2O production and release [37]. In the current study, biochar amendment significantly influenced soil pH in all soils (Table 2; Figure 1). It has been reported that biochar can be used as a conditioner to ameliorate acid soils [38] due to its high concentrations of carbonates and organic anions. In our study, biochar addition significantly inhibited cumulative N2O emission by 20.8% and 47.6%, and increased soil pH by 1.43 and 1.56 units in acidic vegetable soil for both N addition and no N addition treatments, respectively (Figure 1 and Figure 4). The decrease in N2O might be related to the large gap between the pH of biochar and acidic vegetable soil, which increased the soil pH. Previous studies analogously reported that biochar amendment significantly reduced N2O emissions in acidic soil, which used an equally high pH (around 10.9) biochar as in this study [39,40,41]. Similar to acidic vegetable soil, biochar amendment significantly reduced cumulative N2O emissions for N addition treatments in alkaline soil. This could be ascribed to the incorporation of biochar with high C: N ratios increasing soil microbial N immobilization, which results in a decrease in N2O emission [42]. Wu et al. [43] also found that biochar amendment significantly decreased cumulative N2O emission in alkaline soil. The authors attributed this to the liming effect of biochar, which reduced the N2O/N2 ratio and resulted in lower N2O emissions [44]. Although nitrification was identified as the predominant process in alkaline soil in our incubation, importing organic C and available nitrogen might promote microbial growth and activity, consequently accelerating oxygen consumption and creating temporary anaerobic microsites favorable for denitrification [45]. Therefore, the reduction of N2O in alkaline soil in our incubation might be partially associated with biochar’s liming effect, which favored the N2 formation [35].
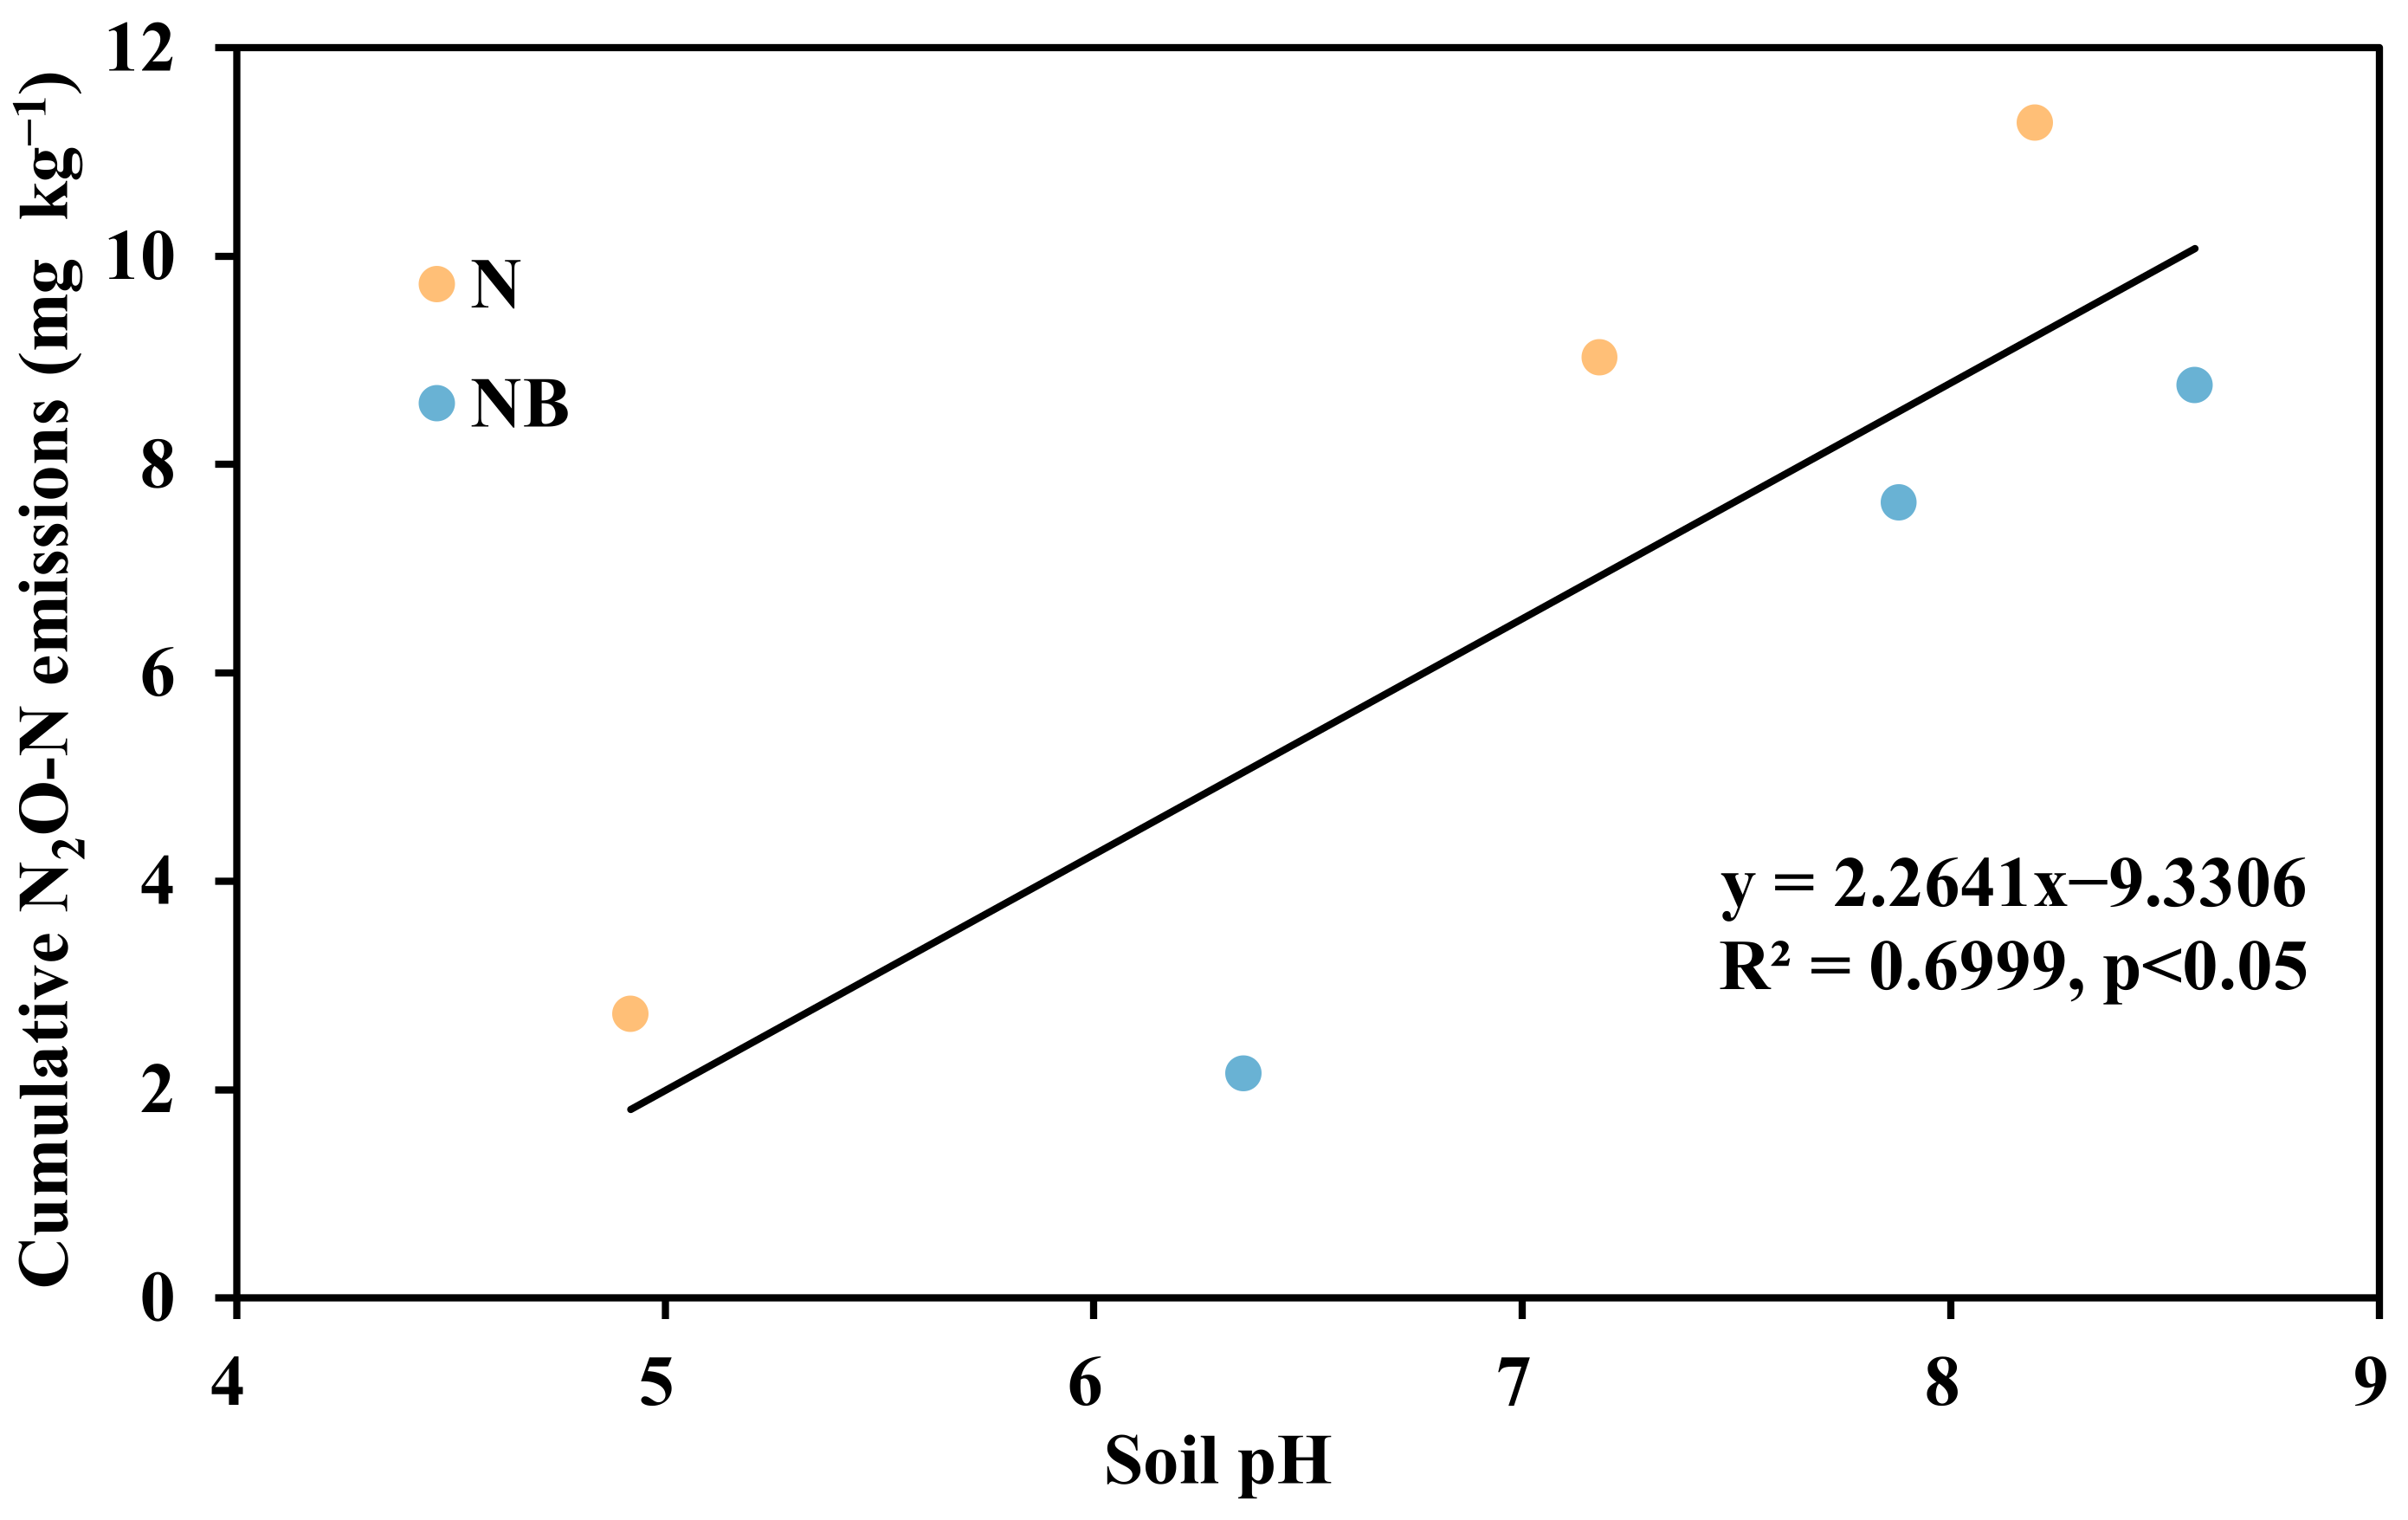
Previous studies have shown that adding biochar could increase soil porosity and aeration, and suppress N2O emissions [10,43]. Nevertheless, biochar amendment did not significantly decrease N2O emissions for neutral rice soil, despite the soil aeration of neutral soil being the same as the other two soils (the same soil texture for all soils and the same WHC for all treatments). Thus, the present study may indicate that the influence of enhanced soil aeration with biochar is minimal. Among all three soils, cumulative N2O emissions were highest in alkaline soil and lowest in acidic soil for N addition treatments (Figure 4). Furthermore, for N addition treatments across all the soils, cumulative N2O emissions were, to a significant degree, positively correlated with soil pH (Figure 5). Generally, the nitrification process in alkaline soils is higher than that in acidic soils [24,46], hence increasing N2O emissions.
5. Conclusions
Our study showed that (1) biochar addition significantly decreased cumulative N2O emission for both N and no N addition treatments and can buffer soil acidity in acidic vegetable soil; (2) biochar addition also significantly decreased N2O emissions in alkaline soil for N addition treatment. In all the soils, biochar amendment reduced available nitrogen contents. A positive relationship was observed between cumulative N2O emissions and soil pH across N addition treatments.
These results suggest that the incorporation of biochar into soils could be an effective management strategy for mitigating soil N2O emissions, but its effectiveness varies with changing soil pH. Since our study was conducted as a short-term incubation without growing plants, additional long-term studies are required to evaluate the effect of biochar amendment on N2O emissions across different soil types under field conditions.
Author Contributions
Conceptualization, H.S. and Y.A.H.; data curation, H.S. and A.A.A.H.; formal analysis, A.A.A.H. and B.Y.; investigation, Y.Z. and B.Y.; methodology, F.L., H.W. and Y.Z.; supervision, Y.A.H.; validation, Y.A.H.; writing—original draft, F.L., H.W., H.S. and Y.A.H.; writing—review and editing, H.S. and Y.A.H. All authors have read and agreed to the published version of the manuscript.
Funding
This work was supported by grants from the Fund of Nanjing Institute of Technology (No. CKJB202006) and Anhui Science and Technology University (BOFA 202205, CIPT202203), the Jiangsu Funding Program for Excellent Postdoctoral Talent (2023ZB897 and 2023ZB869), and the Foreign Youth Talent Project (2019/423402).
Institutional Review Board Statement
Not applicable.
Informed Consent Statement
Not applicable.
Data Availability Statement
The data presented in this study are available on request from the corresponding author. The data are not publicly available due to privacy.
Conflicts of Interest
The authors declare no conflicts of interest.
References
- Stocker, T. Climate Change 2013: The Physical Science Basis: Working Group I Contribution to the Fifth Assessment Report of the Intergovernmental Panel on Climate Change; Cambridge University Press: Cambridge, UK, 2014. [Google Scholar]
- Crutzen, P.J. The influence of nitrogen oxides on atmospheric ozone content. In A Pioneer on Atmospheric Chemistry and Climate Change in the Anthropocene; Crutzen, P., Ed.; Springer: Cham, Switzerland, 2016; pp. 108–116. [Google Scholar]
- World Meteorological Organization. Greenhouse Gas Bulletin. In The State of Greenhouse Gases in the Atmosphere Based on Global Observations through 2018; WMO: Geneva, Switzerland, 2019; Volume 15, p. 8. [Google Scholar]
- Tian, H.; Yang, J.; Xu, R.; Lu, C.; Canadell, J.G.; Davidson, E.A.; Jackson, R.B.; Arneth, A.; Chang, J.; Ciais, P.; et al. Global soil nitrous oxide emissions since the preindustrial era estimated by an ensemble of terrestrial biosphere models: Magnitude, attribution, and uncertainty. Glob. Chang. Biol. 2019, 25, 640–659. [Google Scholar] [CrossRef] [PubMed]
- Maaz, T.M.; Sapkota, T.B.; Eagle, A.J.; Kantar, M.B.; Bruulsema, T.W.; Majumdar, K. Meta-analysis of yield and nitrous oxide outcomes for nitrogen management in agriculture. Glob. Chang. Biol. 2021, 27, 2343–2360. [Google Scholar] [CrossRef] [PubMed]
- Lehmann, J.; Cowie, A.; Masiello, C.A.; Kammann, C.; Woolf, D.; Amonette, J.E.; Cayuela, M.L.; Camps-Arbestain, M.; Whitman, T. Biochar in climate change mitigation. Nat. Geosci. 2021, 14, 883–892. [Google Scholar] [CrossRef]
- Ball, P.N.; MacKenzie, M.D.; DeLuca, T.H.; Holben, W.E. Wildfire and charcoal enhance nitrification and ammonium-oxidizing bacterial abundance in dry montane forest soils. J. Environ. Qual. 2010, 39, 1243–1253. [Google Scholar] [CrossRef] [PubMed]
- Guo, S.; Wu, J.; Han, Z.; Li, Z.; Xu, P.; Liu, S.; Wang, J.; Zou, J. The legacy effect of biochar application on soil nitrous oxide emissions. GCB Bioenergy 2023, 15, 478–493. [Google Scholar] [CrossRef]
- Hamad, A.A.A.; Ni, L.; Shaghaleh, H.; Elsadek, E.; Hamoud, Y.A. Effect of Carbon Content in Wheat Straw Biochar on N2O and CO2 Emissions and Pakchoi Productivity under Different Soil Moisture Conditions. Sustainability 2023, 15, 5100. [Google Scholar] [CrossRef]
- Case, S.; Whitaker, J.; McNamara, N.; Reay, D. The effect of biochar addition on N2O and CO2 emissions from a sandy loam soil-The role of soil aeration. Soil Biol. Biochem. 2012, 51, 125–134. [Google Scholar] [CrossRef]
- Kumar, A.; Medhi, K.; Fagodiya, R.K.; Subrahmanyam, G.; Mondal, R.; Raja, P.; Malyan, S.K.; Gupta, C.K.; Pathak, H. Molecular and ecological perspectives of nitrous oxide producing microbial communities in agro-ecosystems. Rev. Environ. Sci. Biotechnol. 2020, 19, 717–750. [Google Scholar] [CrossRef]
- Malyan, S.K.; Kumar, S.S.; Fagodiya, R.K.; Ghosh, P.; Kumar, A.; Singh, R.; Singh, L. Biochar for environmental sustainability in the energy-water-agroecosystem nexus. Renew. Sust. Energ. Rev. 2021, 149, 111379. [Google Scholar] [CrossRef]
- Hamad, A.A.A.; Wei, Q.; Xu, J.; Hamoud, Y.A.; He, M.; Shaghaleh, H.; Wei, Q.; Li, X.; Qi, Z. Managing Fertigation Frequency and Level to Mitigate N2O and CO2 Emissions and NH3 Volatilization from Subsurface Drip-Fertigated Field in a Greenhouse. Agronomy 2022, 12, 1414. [Google Scholar] [CrossRef]
- Kaur, N.; Kieffer, C.; Ren, W.; Hui, D. How much is soil nitrous oxide emission reduced with biochar application? An evaluation of meta-analyses. GCB Bioenergy 2023, 15, 24–37. [Google Scholar] [CrossRef]
- Weslien, P.; Kasimir Klemedtsson, Å.; Börjesson, G.; Klemedtsson, L. Strong pH influence on N2O and CH4 fluxes from forested organic soils. Eur. J. Soil Sci. 2009, 60, 311–320. [Google Scholar] [CrossRef]
- He, L.; Liu, Y.; Zhao, J.; Bi, Y.; Zhao, X.; Wang, S.; Xing, G. Comparison of straw biochar-mediated changes in nitrification and ammonia oxidizers in agricultural oxisols and cambosols. Biol. Fertil. Soils 2016, 52, 137–149. [Google Scholar] [CrossRef]
- Butterbach-Bahl, K.; Baggs, E.M.; Dannenmann, M.; Kiese, R.; Zechmeister-Boltenstern, S. Nitrous oxide emissions from soils: How well do we understand the processes and their controls? Philos. Trans. R. Soc. B Biol. Sci. 2013, 368, 20130122. [Google Scholar] [CrossRef] [PubMed]
- Pokharel, P.; Qi, L.; Chang, S.X. Manure-based biochar decreases heterotrophic respiration and increases gross nitrification rates in rhizosphere soil. Soil Biol. Biochem. 2021, 154, 108–147. [Google Scholar] [CrossRef]
- Bo, X.; Zhang, Z.; Wang, J.; Guo, S.; Li, Z.; Lin, H.; Huang, Y.; Han, S.; Kuzyakov, Y.; Zou, J. Benefits and limitations of biochar for climate-smart agriculture: A review and case study from China. Biochar 2023, 5, 77. [Google Scholar] [CrossRef]
- Zhang, Y.; Wang, H.; Maucieri, C.; Liu, S.; Zou, J. Annual nitric and nitrous oxide emissions response to biochar amendment from an intensive greenhouse vegetable system in southeast China. Sci. Hortic. 2019, 246, 879–886. [Google Scholar] [CrossRef]
- Nelissen, V.; Saha, B.K.; Ruysschaert, G.; Boeckx, P. Effect of different biochar and fertilizer types on N2O and NO emissions. Soil Biol. Biochem. 2014, 70, 244–255. [Google Scholar] [CrossRef]
- Clough, T.J.; Bertram, J.E.; Ray, J.L.; Condron, L.M.; O’Callaghan, M.; Sherlock, R.R.; Wells, N.S. Unweathered wood biochar impact on nitrous oxide emissions from a bovine-urine-amended pasture soil. Soil Sci. Soc. Am. J. 2010, 74, 852–860. [Google Scholar] [CrossRef]
- Dong, W.; Walkiewicz, A.; Bieganowski, A.; Oenema, O.; Nosalewicz, M.; He, C.; Yuming, Z.; Hu, C. Biochar promotes the reduction of N2O to N2 and concurrently suppresses the production of N2O in calcareous soil. Geoderma 2020, 362, 114091. [Google Scholar] [CrossRef]
- Shakoor, A.; Shahzad, S.M.; Chatterjee, N.; Arif, M.S.; Farooq, T.H.; Altaf, M.M.; Tufail, M.A.; Dar, A.A.; Mehmood, T. Nitrous oxide emission from agricultural soils: Application of animal manure or biochar? A global meta-analysis. J. Environ. Manag. 2021, 285, 112170. [Google Scholar] [CrossRef] [PubMed]
- Kroon, P.S.; Hensen, A.; Van den Bulk, W.C.M.; Jongejan, P.A.C.; Vermeulen, A.T. The importance of reducing the systematic error due to non-linearity in N2O flux measurements by static chambers. Nutr. Cycl. Agroecosys. 2008, 82, 175–186. [Google Scholar] [CrossRef]
- Wang, J.; Zhang, M.; Xiong, Z.; Liu, P.; Pan, G. Effects of biochar addition on N2O and CO2 emissions from two paddy soils. Biol. Fert. Soils 2011, 47, 887–896. [Google Scholar] [CrossRef]
- Sparks, D.; Page, A.; Helmke, P.; Loeppert, R.; Soltanpour, P.; Tabatai, M.; Johnson, C.; Sumner, M. Methods of Soil Analysis: Part 3-Chemical Methods; John Wiley and Sons: Hoboken, NJ, USA, 2020; Volume 14. [Google Scholar]
- Chen, W.; Zheng, X.; Chen, Q.; Wolf, B.; Butterbach-Bahl, K.; Brüggemann, N.; Lin, S. Effects of increasing precipitation and nitrogen deposition on CH4 and N2O fluxes and ecosystem respiration in a degraded steppe in Inner Mongolia, China. Geoderma 2013, 192, 335–340. [Google Scholar] [CrossRef]
- Wang, Z.; Zheng, H.; Luo, Y.; Deng, X.; Herbert, S.; Xing, B. Characterization and influence of biochars on nitrous oxide emission from agricultural soil. Environ. Pollut. 2013, 174, 289–296. [Google Scholar] [CrossRef] [PubMed]
- Wang, J.; Smith, P.; Hergoualc’h, K.; Zou, J. Direct N2O emissions from global tea plantations and mitigation potential by climate-smart practices. Resour. Conserv. Recy. 2022, 185, 106501. [Google Scholar] [CrossRef]
- Venterea, R.T.; Clough, T.J.; Coulter, J.A.; Breuillin-Sessoms, F.; Wang, P.; Sadowsky, M.J. Ammonium sorption and ammonia inhibition of nitrite-oxidizing bacteria explain contrasting soil N2O production. Sci. Rep. 2015, 5, 12153. [Google Scholar] [CrossRef]
- He, L.; Zhao, X.; Wang, S.; Xing, G. The effects of rice-straw biochar addition on nitrification activity and nitrous oxide emissions in two Oxisols. Soil Till. Res. 2016, 164, 52–62. [Google Scholar] [CrossRef]
- Clough, T.J.; Condron, L.M.; Kammann, C.; Müller, C. A review of biochar and soil nitrogen dynamics. Agronomy 2013, 3, 275–293. [Google Scholar] [CrossRef]
- He, T.; Liu, D.; Yuan, J.; Ni, K.; Zaman, M.; Luo, J.; Lindsey, S.; Ding, W. A two years study on the combined effects of biochar and inhibitors on ammonia volatilization in an intensively managed rice field. Agr. Ecosyst. Environ. 2018, 264, 44–53. [Google Scholar] [CrossRef]
- Lan, Z.M.; Chen, C.R.; Rashti, M.R.; Yang, H.; Zhang, D.K. Stoichiometric ratio of dissolved organic carbon to nitrate regulates nitrous oxide emission from the biochar-amended soils. Sci. Total Environ. 2017, 576, 559–571. [Google Scholar] [CrossRef] [PubMed]
- Prendergast-Miller, M.T.; Duvall, M.; Sohi, S.P. Localisation of nitrate in the rhizosphere of biochar-amended soils. Soil Biol. Biochem. 2011, 43, 2243–2246. [Google Scholar] [CrossRef]
- Liu, Y.; Tang, H.; Muhammad, A.; Huang, G. Emission mechanism and reduction countermeasures of agricultural greenhouse gases—A review. Greenh. Gases 2019, 9, 160–174. [Google Scholar] [CrossRef]
- Yuan, J.H.; Xu, R.K. The amelioration effect of low temperature biochar generated from nine crop residues on an acidic Ultisol. Soil Use Manag. 2011, 27, 110–115. [Google Scholar] [CrossRef]
- Wang, H.; Yi, H.; Zhang, X.; Su, W.; Li, X.; Zhang, Y.; Gao, X. Biochar Mitigates Greenhouse Gas Emissions from an Acidic Tea Soil. Pol. J. Environ. Stud. 2020, 29, 323–330. [Google Scholar] [CrossRef] [PubMed]
- Ntacyabukura, T.; Uwiringiyimana, E.; Zhou, M.; Zhang, B.; Zhu, B.; Harerimana, B.; Nambajimana, J.D.; Nsabimana, G.; Nsengumuremyi, P. Effect of Biochar and Straw Application on Nitrous Oxide and Methane Emissions from Eutric Regosols with Different pH in Sichuan Basin: A Mesocosm Study. Atmosphere 2021, 12, 729. [Google Scholar] [CrossRef]
- Aamer, M.; Bilal Chattha, M.; Mahmood, A.; Naqve, M.; Hassan, M.U.; Shaaban, M.; Rasul, F.; Batool, M.; Rasheed, A.; Tang, H.; et al. Rice residue-based biochar mitigates N2O emission from acid red soil. Agronomy 2021, 11, 2462. [Google Scholar] [CrossRef]
- Baggs, E.M.; Rees, R.M.; Smith, K.A.; Vinten, A.J.A. Nitrous oxide emission from soils after incorporating crop residues. Soil Use Manage. 2010, 16, 82–87. [Google Scholar] [CrossRef]
- Wu, D.; Senbayram, M.; Zang, H.; Ugurlar, F.; Aydemir, S.; Brüggemann, N.; Kuzyakov, Y.; Bol, R.; Blagodatskaya, E. Effect of biochar origin and soil pH on greenhouse gas emissions from sandy and clay soils. Appl. Soil Ecol. 2018, 129, 121–127. [Google Scholar] [CrossRef]
- Van Zwieten, L.; Kimber, S.; Morris, S.; Downie, A.; Berger, E.; Rust, J.; Scheer, C. Influence of biochars on flux of N2O and CO2 from ferrosol. Soil Res. 2010, 48, 555–568. [Google Scholar] [CrossRef]
- Baggs, E.M. Soil microbial sources of nitrous oxide: Recent advances in knowledge, emerging challenges and future direction. Curr. Opin. Environ. Sustain. 2011, 3, 321–327. [Google Scholar] [CrossRef]
- Yoo, G.; Kim, Y.J.; Lee, Y.O.; Ding, W. Investigation of greenhouse gas emissions from the soil amended with rice straw biochar. KSCE J. Civ. Eng. 2016, 20, 2197–2207. [Google Scholar] [CrossRef]
Figure 1.
Changes in soil pH from (a) acidic vegetable soil, (b) neutral rice soil, and (c) alkaline soil during the 40-day incubation. The error bars indicate the standard errors of means (n = 3).
Figure 1.
Changes in soil pH from (a) acidic vegetable soil, (b) neutral rice soil, and (c) alkaline soil during the 40-day incubation. The error bars indicate the standard errors of means (n = 3).

Figure 2.
Dynamics of NH4+-N and NO3−-N from (a,b) acidic vegetable soil, (c,d) neutral rice soil, and (e,f) alkaline soil. The error bars indicate the standard errors of means (n = 3).
Figure 2.
Dynamics of NH4+-N and NO3−-N from (a,b) acidic vegetable soil, (c,d) neutral rice soil, and (e,f) alkaline soil. The error bars indicate the standard errors of means (n = 3).

Figure 3.
Temporal dynamics of N2O fluxes from (a) acidic vegetable soil, (b) neutral rice soil, and (c) alkaline soil during the 40-day incubation. The error bars indicate the standard errors of means (n = 3).
Figure 3.
Temporal dynamics of N2O fluxes from (a) acidic vegetable soil, (b) neutral rice soil, and (c) alkaline soil during the 40-day incubation. The error bars indicate the standard errors of means (n = 3).

Figure 4.
Cumulative N2O emissions for soils with different pH. The error bars indicate the standard errors of means (n = 3). Different letters among the treatments indicate significant differences at p < 0.05 level.
Figure 4.
Cumulative N2O emissions for soils with different pH. The error bars indicate the standard errors of means (n = 3). Different letters among the treatments indicate significant differences at p < 0.05 level.

Figure 5.
Relationship between cumulative N2O emissions and soil pH for N addition treatments across all the soils.
Figure 5.
Relationship between cumulative N2O emissions and soil pH for N addition treatments across all the soils.


Table 1.
The physicochemical properties of soil and biochar.
| Soil Type | Total C (g kg−1) | Total N (g kg−1) | Soil pH | Sand (%) | Silt (%) | Clay (%) | NH4+-N (mg kg−1) | NO3−-N (mg kg−1) | Bulk Density (g cm−3) |
|---|---|---|---|---|---|---|---|---|---|
| V | 15.9 | 2.1 | 5.40 | 54.4 | 30.36 | 15.18 | 22.95 | 172.63 | 1.11 |
| R | 12.8 | 1.1 | 7.56 | 69.5 | 10.16 | 20.32 | 11.79 | 7.10 | 1.36 |
| A | 11.2 | 0.8 | 8.80 | 69.7 | 20.15 | 10.08 | 13.46 | 1.37 | 1.56 |
| Biochar | 467.2 | 6.0 | 10.90 | - | - | - | <1 | <1.2 | 0.41 |
Abbreviations: V, acidic vegetable soil; R, neutral rice soil; A, alkaline soil.
Table 2.
Two-way ANOVA (F and p values) for the effects of biochar and N fertilizer on nitrous oxide emissions and soil properties.
Table 2.
Two-way ANOVA (F and p values) for the effects of biochar and N fertilizer on nitrous oxide emissions and soil properties.
| Soil Type | Variable | Biochar (B) | N Fertilizer (N) | N × B | |||
|---|---|---|---|---|---|---|---|
| F | p | F | p | F | p | ||
| V | Cum. N2O | 216.227 | <0.001 | 1871.412 | <0.001 | 47.065 | <0.001 |
| NH4+-N | 0.114 | 0.741 | 0.265 | 0.616 | 11.325 | 0.006 | |
| NO3−-N | 6.995 | 0.021 | 51.986 | <0.001 | 0.299 | 0.594 | |
| pH | 1423.772 | <0.001 | 64.216 | <0.001 | 2.691 | 0.127 | |
| R | Cum. N2O | 0.937 | 0.352 | 459.391 | <0.001 | 0.13 | 0.725 |
| NH4+-N | 0.039 | 0.846 | 3.414 | 0.089 | 3.728 | 0.077 | |
| NO3−-N | 314.596 | <0.001 | 700.507 | <0.001 | 2.135 | 0.17 | |
| pH | 1952.271 | <0.001 | 146.724 | <0.001 | 21.334 | 0.001 | |
| A | Cum. N2O | 10.132 | 0.008 | 575.44 | <0.001 | 8.656 | 0.012 |
| NH4+-N | 4.851 | 0.048 | 12.466 | 0.004 | 3.86 | 0.073 | |
| NO3−-N | 43.787 | <0.001 | 987.621 | <0.001 | 3.526 | 0.085 | |
| pH | 17.186 | 0.001 | 79.771 | <0.001 | 1.237 | 0.288 | |
Abbreviations: V, acidic vegetable soil; R, neutral rice soil; A, alkaline soil; Cum. N2O, cumulative nitrous oxide emissions.
Disclaimer/Publisher’s Note: The statements, opinions and data contained in all publications are solely those of the individual author(s) and contributor(s) and not of MDPI and/or the editor(s). MDPI and/or the editor(s) disclaim responsibility for any injury to people or property resulting from any ideas, methods, instructions or products referred to in the content. |
© 2024 by the authors. Licensee MDPI, Basel, Switzerland. This article is an open access article distributed under the terms and conditions of the Creative Commons Attribution (CC BY) license (https://creativecommons.org/licenses/by/4.0/).
Share and Cite
MDPI and ACS Style
Lin, F.; Wang, H.; Shaghaleh, H.; Ali Adam Hamad, A.; Zhang, Y.; Yang, B.; Alhaj Hamoud, Y. Effects of Biochar Amendment on N2O Emissions from Soils with Different pH Levels. Atmosphere 2024, 15, 68. https://doi.org/10.3390/atmos15010068
AMA Style
Lin F, Wang H, Shaghaleh H, Ali Adam Hamad A, Zhang Y, Yang B, Alhaj Hamoud Y. Effects of Biochar Amendment on N2O Emissions from Soils with Different pH Levels. Atmosphere. 2024; 15(1):68. https://doi.org/10.3390/atmos15010068
Chicago/Turabian StyleLin, Feng, Hong Wang, Hiba Shaghaleh, Amar Ali Adam Hamad, Yaojun Zhang, Bairen Yang, and Yousef Alhaj Hamoud. 2024. "Effects of Biochar Amendment on N2O Emissions from Soils with Different pH Levels" Atmosphere 15, no. 1: 68. https://doi.org/10.3390/atmos15010068
Note that from the first issue of 2016, this journal uses article numbers instead of page numbers. See further details here.