Article

Study on the Vertical Distribution and Transport of Aerosols in the Joint Observation of Satellite and Ground-Based LiDAR

1
School of Advanced Manufacturing Engineering, Hefei University, Hefei 230601, China
2
Science Island Branch of Graduate School, University of Science and Technology of China, Hefei 230026, China
3
Anhui Provincial Engineering Technology Research Center of Intelligent Vehicle Control and Integrated Design Technology, Hefei University, Hefei 230601, China
4
School of Mechanical and Energy Engineering, Ningbo Tech University, Ningbo 315100, China
5
Key Laboratory of Atmospheric Optics, Anhui Institute of Optics and Fine Mechanics, Chinese Academy of Sciences, Hefei 230031, China
*
Authors to whom correspondence should be addressed.
Atmosphere 2024, 15(2), 240; https://doi.org/10.3390/atmos15020240
Submission received: 8 January 2024 / Revised: 3 February 2024 / Accepted: 11 February 2024 / Published: 19 February 2024
(This article belongs to the Section Air Quality)

Abstract

:
The mechanism of aerosol pollution transport remains highly elusive owing to the myriad of influential factors. In this study, ground station data, satellite data, ground-based LiDAR remote sensing data, sounding data, ERA5 reanalysis and a backward trajectory model were combined to investigate the formation process and optical properties of winter aerosol pollution in Beijing and surrounding areas. The analysis of ground station data shows that compared to 2019 and 2021, the pandemic lockdown policy resulted in a decrease in the total number of pollution days and a decrease in the average concentration of particulate matter in the Beijing area in 2020. The terrain characteristics of the Beijing-Tianjin-Hebei (BTH) made it prone to northeast and southwest winds. The highest incidence of aerosol pollution in Beijing occurs in February and March during the spring and winter seasons. Analysis of a typical heavy aerosol pollution process in the Beijing area from 28 February to 5 March 2019 shows that dust and fine particulate matter contributed to the primary pollution; surface air temperature inversion and an average wind speed of less than 3 m/s were conducive to the continuous accumulation of pollutants, which was accompanied by the oxidation reaction of NO2 and O3, forming photochemical pollution. The heavy aerosol pollution was transmitted and diffused towards the southeast, gradually eliminating the pollution. Our results provide relevant research support for the prevention and control of aerosol pollution.

1. Introduction

COVID-19, caused by the SARS-CoV-2 virus, was first found in December 2019 and was identified as a global pandemic by the World Health Organization (WHO) on 11 March 2020 [1]. As of 7 June 2023, a total of 767 million confirmed cases and 6.94 million deaths have been reported globally [2]. Aerosols are composed of solid (sand, floating dust, etc.) or liquid (water droplets, fog, etc.) particles suspended in the atmosphere [3,4,5,6]. As aerosol pollution occurs, atmospheric visibility decreases [4]. In addition, there is increasing evidence indicating that COVID-19 virus transport via aerosols is possible [7]. Research has found that the COVID-19 virus can survive on inhalable aerosol particles for up to several hours or even days [7,8]. Therefore, COVID-19 and aerosol pollution have seriously affected public health and human activities [8,9,10]. In order to prevent the spread of the COVID-19 virus, strict control measures have been taken to prevent aerosol transmission of the virus, such as conducting disinfection work to reduce the re-entry of suspended particles (organic waste carrying the virus, ground waste) into the air [9,10].
In response to this major public health emergency, more than 100 countries have reportedly adopted strict lockdown policies (restrictions on human activities, public transportation, and industrial activities) to minimize the risk of virus transmission via aerosols [11,12]. The strict lockdown policy has the drawback of causing significant socio-economic losses and further increasing poverty rates [12,13]. In addition, restrictions on human activities have reduced aerosol emissions, leading to global environmental changes, such as air pollution and changes in the urban heat island effect [8,9,10]. This also provides an opportunity for research on human intervention in environmental change [9,14]. In general, the impact of the lockdown policy on aerosol pollution can be considered significant [15]. The lockdown policy improved meteorological environment quality in urban areas by significantly reducing PM2.5 emissions [15]. However, the causes and transport processes of aerosol pollution are very complex [16]. First, there are many sources of aerosols, including natural sources and anthropogenic emissions [17]. Moreover, in the atmosphere, aerosols are influenced by factors such as light, humidity, precipitation and temperature, leading to aggregation and changes [18,19]. In fact, these particles can exist in different mixed states. Aerosol optical depth (AOD) is one of the key physical qualities that characterize the degree of atmospheric turbidity and is also an important factor in determining aerosol climate effects. Through remote sensing observation, the spatial distribution of AOD can be obtained [20,21,22,23]. Recent studies have found that aerosols often undergo complex chemical reactions during the condensation process, further altering their composition and structure [6,24]. Atmospheric aerosols not only exert an influence on air quality but also on the climate system, which is known as aerosol–climate interaction. The impact of aerosols on climate includes the reflection and absorption of solar radiation, as well as the formation and characteristics of clouds, further affecting the energy balance of the Earth and climate change [25,26,27,28,29].
The BTH region is located in northern China and is one of China’s mega-city clusters, with dense population and industry [30]. The complex terrain, special location, and developed industry make it difficult to study aerosol pollution in the BTH (Beijing-Tianjin-Hebei) region [31]. Beijing is the capital of China and the primary city in the BTH region. Studying the characteristics, spatiotemporal distribution, and sources of aerosols under haze weather in this region helps to understand the aerosol characteristics of the BTH region [32]. Researchers have conducted research on the long-distance transport of PM2.5 and dust in the BTH area and have also studied the mixing process of local aerosols and dust [30,31]. However, the mechanism of aerosol pollution generation and transport are multifactorially coupled, and there are still many uncertainties that require further investment in research. In this paper, PM2.5, PM10, and meteorological elements data relating to the Beijing area in 2019 (pre-lockdown), 2020 (during the pandemic lockdown), and 2021 (post-lockdown) were selected for statistical analysis. February and March are the peak periods for PM2.5 and PM10. The typical aerosol pollution process from 28 February 28 to 5 March 2019 in the pre-lockdown period was also analyzed. The terrain characteristics of BTH, weather and climate change characteristics, human activities, aerosol mixing, and photochemical pollution reactions were taken into account. In this paper, ground station data, ground-based LiDAR, satellite observation data, and ERA5 reanalysis data are used to comprehensively reveal the mechanisms of aerosol pollution occurrence and transport. This study can provide support for governmental management of severe polluted weather and related research.

2. Data and Methods

2.1. Study Area and Period

Figure 1 shows the location of BTH in this study (36°05′–42°37′ N, 113°11′–119°45′ E). BTH is located high in the northwest (Yanshan–Taihang Mountains), low in the southeast (North China Plain), and adjacent to the Bohai Sea in the southeast (Figure 1a–c). The climate is temperate and semi-humid continental. Due to such topographical and climatic characteristics, the population of the BTH area is mainly distributed in the North China Plain (Figure 1d). According to the results of the seventh national population census, the BTH region has a population of over 110 million [33]. Beijing (39.9° N, 116.3° E), as the capital of China, has a permanent population of over 21 million. With the rapid development of China’s economy, the BTH region has a high incidence of severe aerosol pollution. During the spring and winter seasons, Beijing often suffers from sandstorms caused by northwest monsoon winds. At the same time, as a populous mega-city, it also faces significant challenges in environmental protection due to the huge amount of anthropogenic aerosol emissions.

2.2. Data and Methods

The PM2.5, PM10, and meteorological element data of Beijing in 2019 (pre-lockdown), 2020 (during the pandemic lockdown), and 2021 (post-lockdown) were selected for statistical analysis. After the outbreak of the pandemic, the BTH region activated a public health level-I emergency response (temporary plant closures, no gathering, strict traffic control). Concerning the pandemic, 25 January 2020 was determined as the starting time, and the strict urban lockdown lasted until 30 April 2020 [34]. After this, it was adjusted to public health level-II emergency response (partial lockdown). In addition, typical aerosol pollution processes from 28 February to 5 March 2019 (pre-lockdown) were analyzed.
The data (PM2.5, PM10, NO2, SO2, etc.) used to study the air pollution in Beijing and surrounding areas were selected from Beijing (39.9° N, 116.3° E) monitoring station (http://data.cma.cn, accessed on 1 January 2022). Ground-based LiDAR data near the site were used to obtain the continuous vertical distribution characteristics of aerosols. In this study, the vertical characteristics of aerosols were analyzed using 532 nm attenuated backscatter and aerosol type images from the Cloud-Aerosol LiDAR and Infrared Pathfinder Satellite Observations (CALIPSO) [35]. The deep blue (DB) algorithm was used to invert the AOD data of VIIRS. Research has shown that all daily AOD data in China are under quality control and can be used to retrieve aerosols on bright surfaces (deserts, barrens, etc.) [36]. ERA5 reanalysis data and the HYSPLIT_4 (Hybrid Single-Particle Integrated Trajectory) model were used to analyze the weather patterns and air particle trajectories favored in aerosol formation [37].
The echo signal of ground-based LiDAR is obtained as follows [4]:
P ( z ) · z 2 = C [ β m ( z ) + β a ( z ) ] exp { 2 0 z [ α m ( z ) + α a ( z ) ] d z }
where P(z) represents the atmospheric backscattered signal at distance z, P(zz2 represents the LiDAR range corrected signal, C is the instrument constant, α(z) is the atmospheric extinction coefficient at a distance z, β(z) represents the atmospheric backscatter coefficient at distance z, and the subscripts m and a represent air molecules and aerosol particles, respectively. In this study, the ground-based LiDAR used the 532 nm wavelength signal, and the backscattered signal data were obtained using Formula (1).

3. Results and Analysis

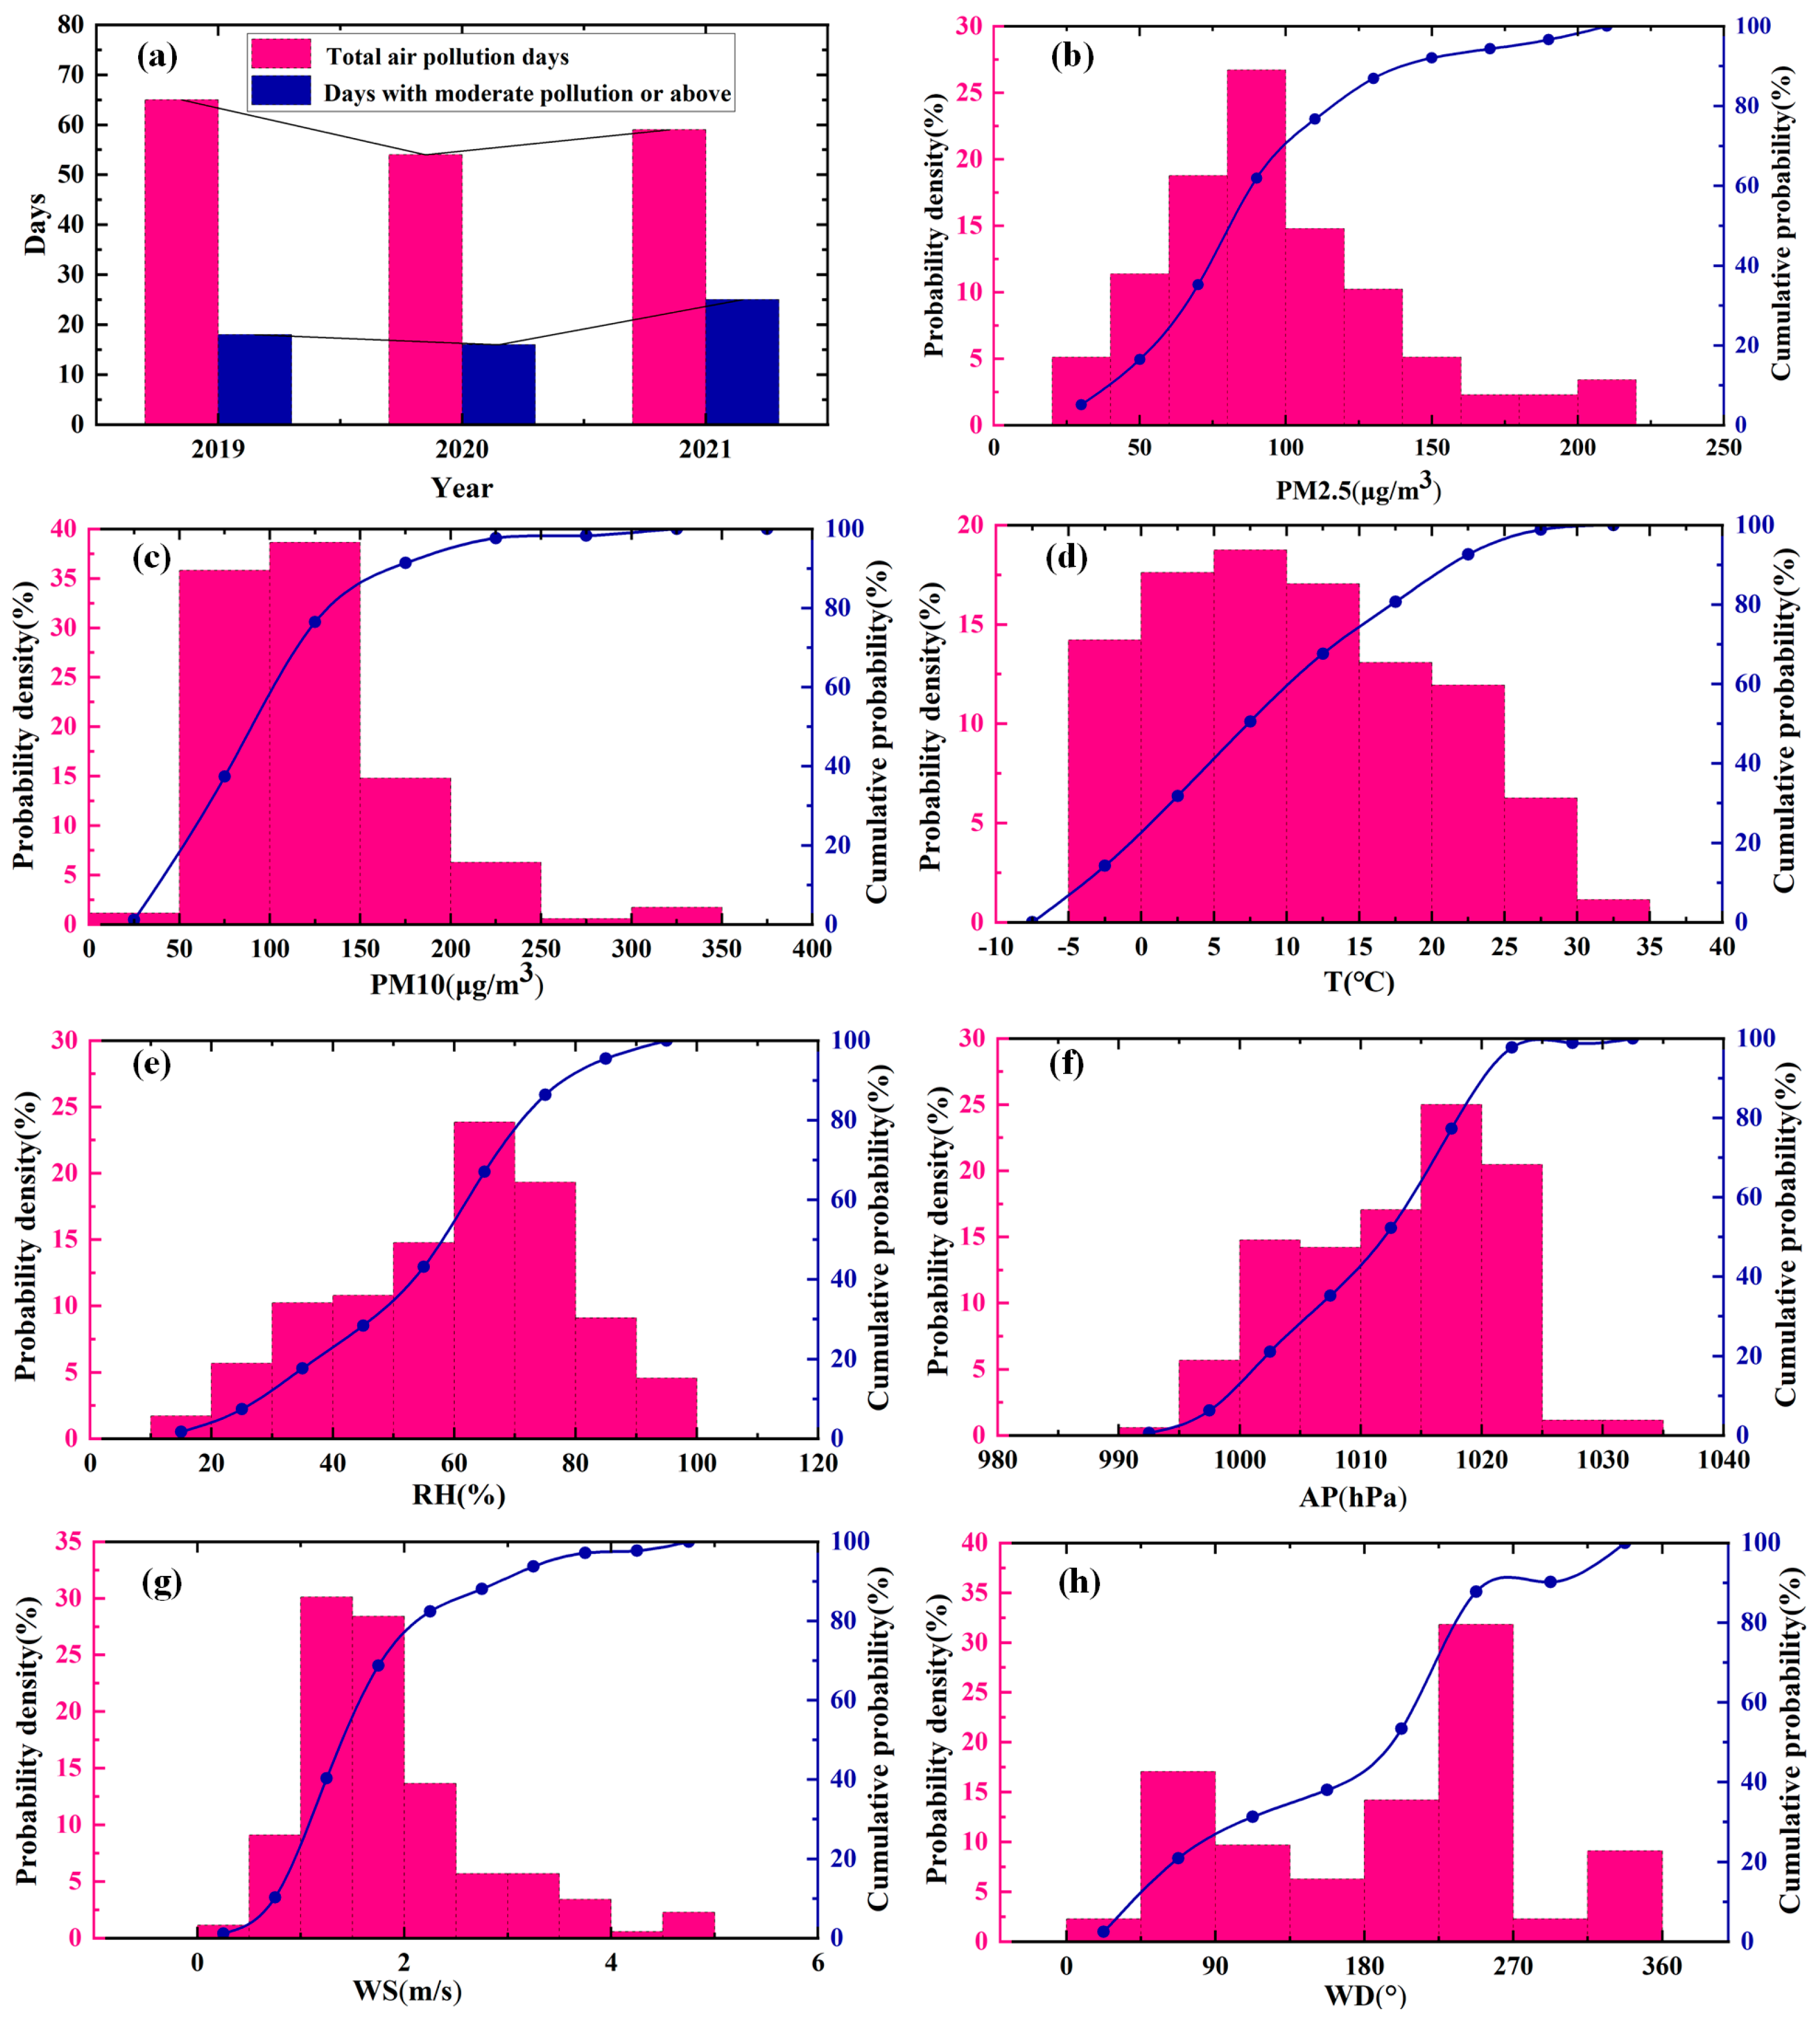
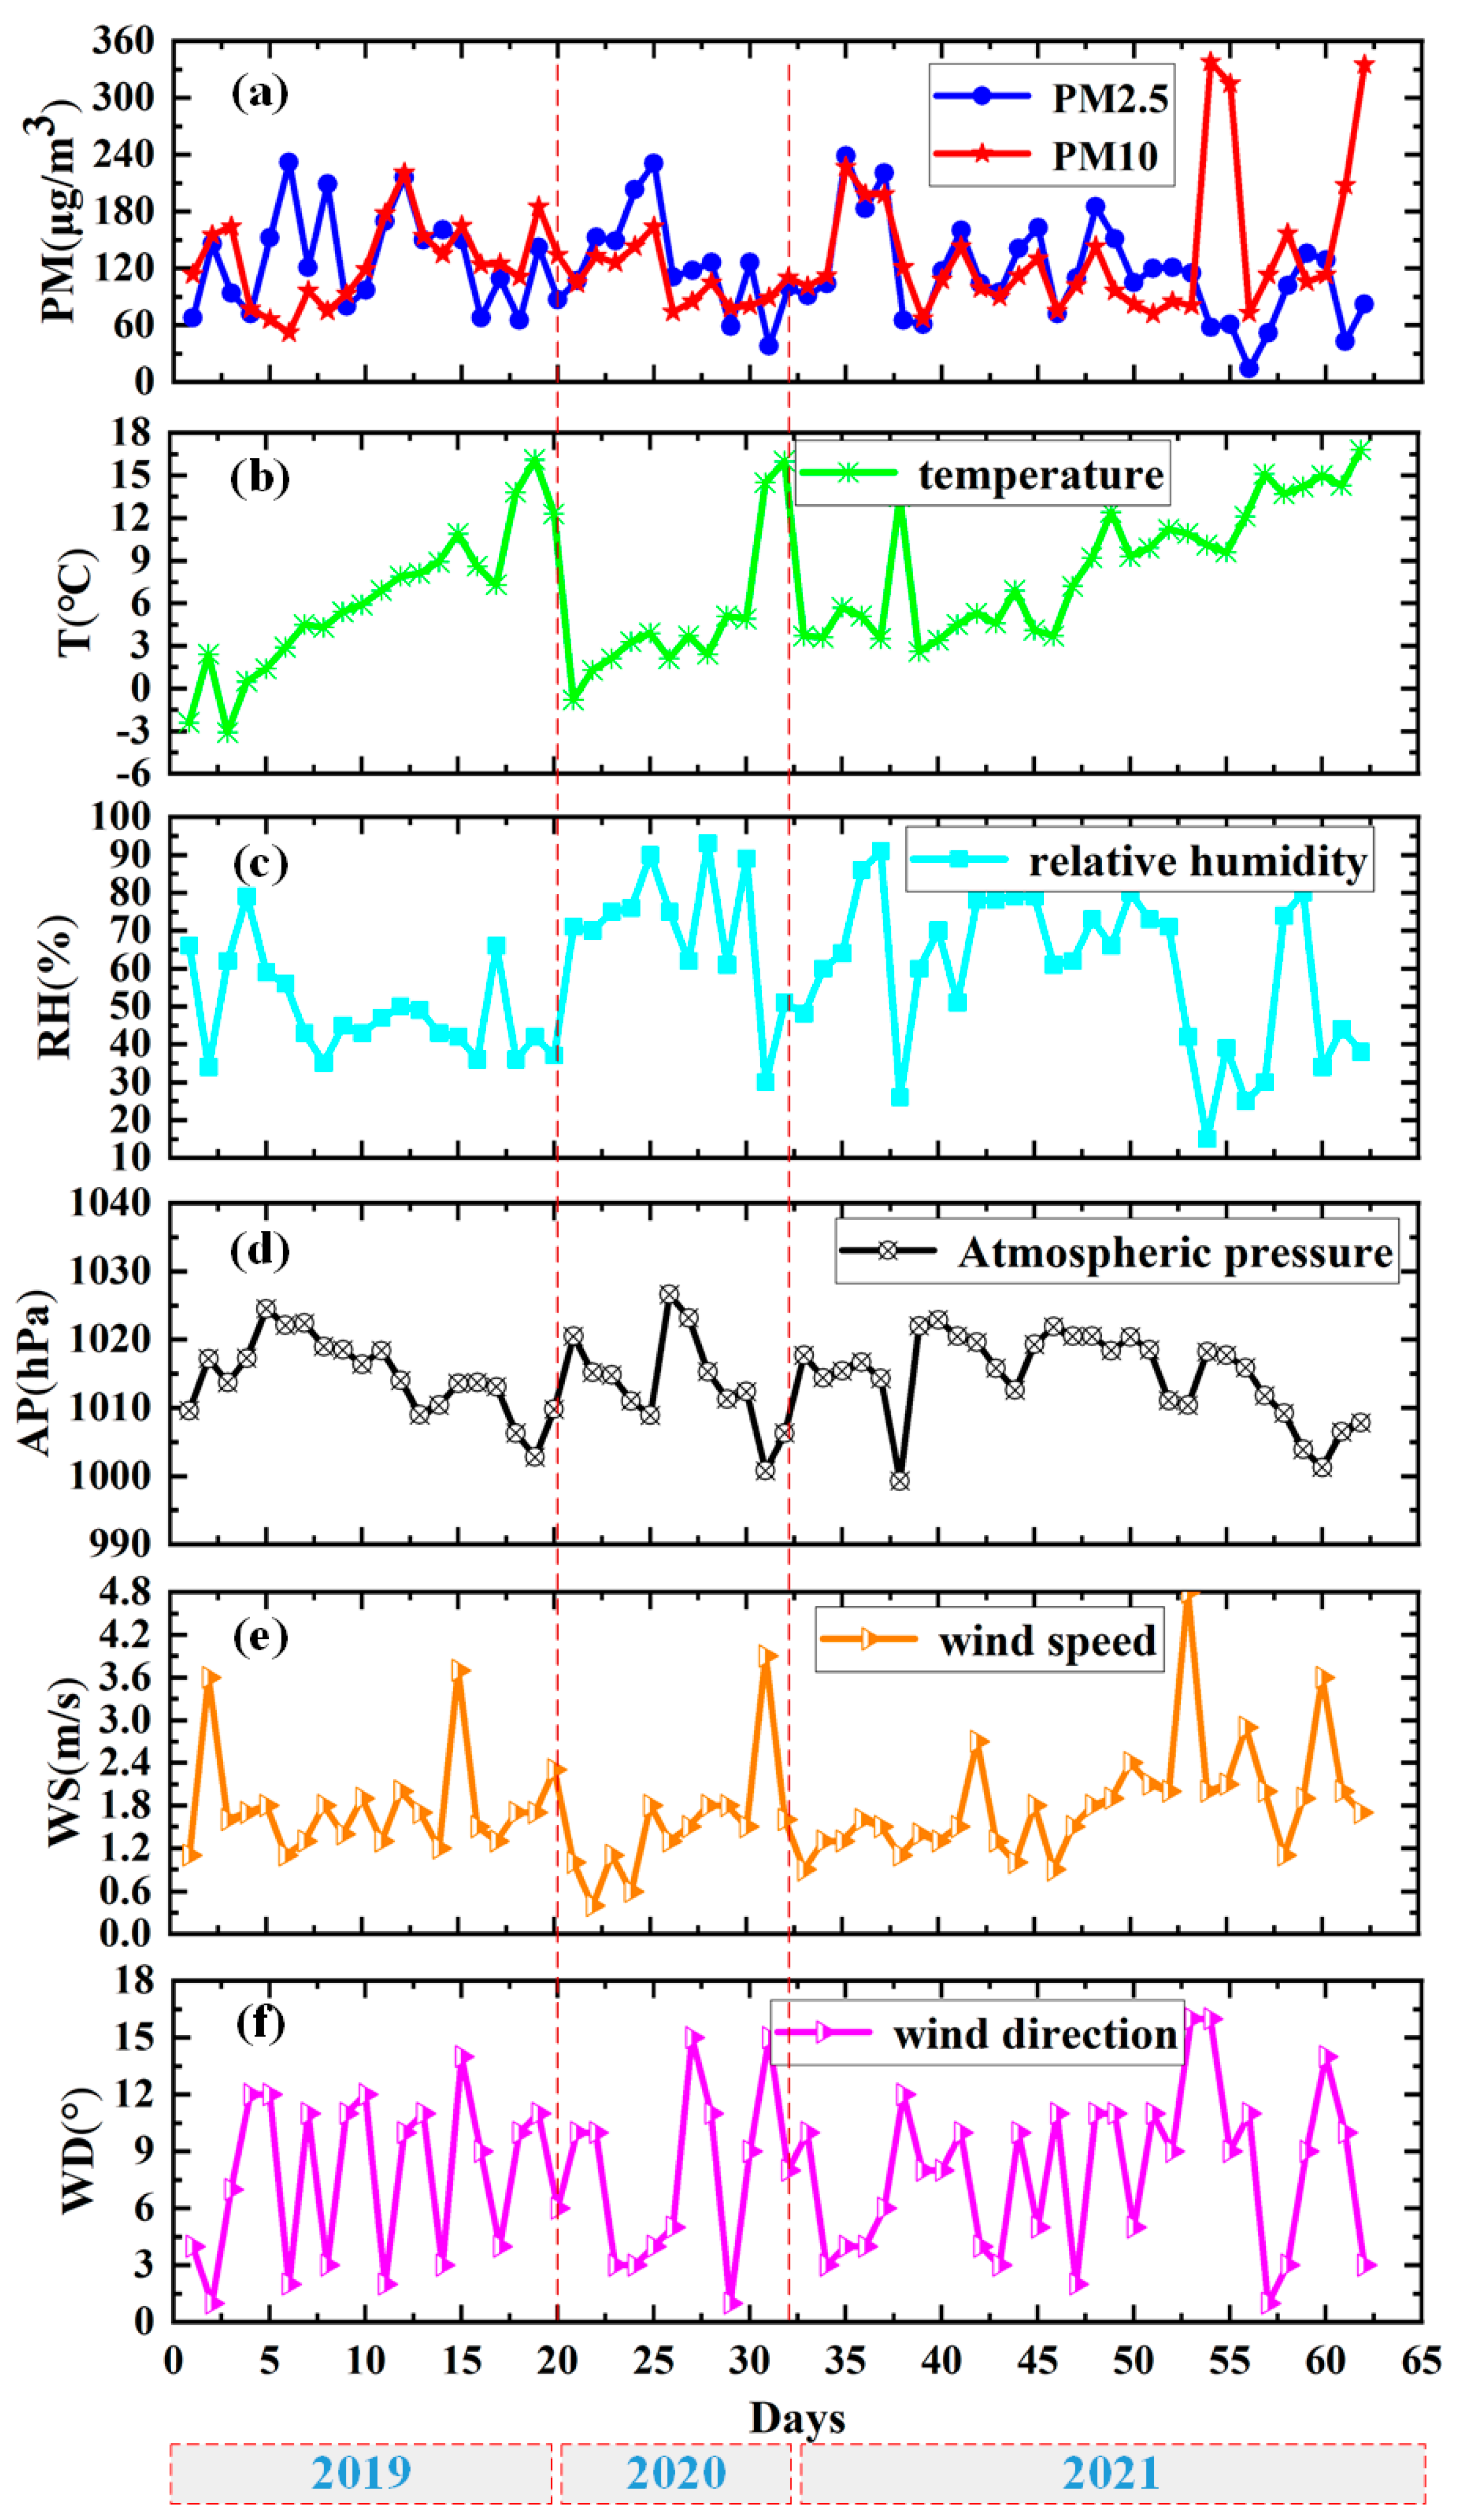
3.1. Overall Characteristics of PM2.5, PM10 and Meteorological Elements before and after the COVID-19 Pandemic

Figure 2 shows the statistical results in terms of air pollution weather data in Beijing before and post-lockdown (2019, 2020 and 2021). According to the latest air quality standard, the 24 h average concentration of PM2.5 above 75 μg/m3 represents the presence of air pollution [38]. The 24 h average PM2.5 concentrations at 75 μg/m3–115 μg/m3 indicate light pollution, 115 μg/m3–150 μg/m3 indicate moderate pollution, 150 μg/m3–250 μg/m3 indicate heavy pollution, and greater than 250 μg/m3 indicates the occurrence of severe pollution. The 178 hazy polluted weather events and 59 moderate pollution or above (PM2.5 concentration > 115 μg/m3) events pre- and post-lockdown for the three years of 2019–2021 were analyzed (Figure 2a). The results showed that in 2020, during the pandemic lockdown, the total number of pollution days decreased by 16.9% and 8.5%, respectively, compared to 2019 (pre-lockdown) and 2021 (post-lockdown). The number of days with moderate pollution or above decreased by 11% and 36%, respectively, compared to 2019 and 2021. This indicates that restricting human activities (pandemic lockdown) may have played a positive role in improving the atmospheric environment, but such interventions cannot be sustained continuously.
Figure 2b shows that when aerosol pollution occurs, PM2.5 concentrations are distributed at 25 μg/m3–225 μg/m3. The maximum probability of a mass concentration of PM2.5 occurs between 75 μg/m3 and100 μg/m3. In contrast, PM10 concentrations are distributed in the range of 50 μg/m3–250 μg/m3, and the maximum probability of PM10 mass concentration occurs in the range of 100 μg/m3–150 μg/m3 (Figure 2c). Among the meteorological elements, the probability distributions of temperature, relative humidity, pressure, and wind speed showed a tendency to exhibit an increase followed by a decrease (Figure 2d–g). When aerosol pollution occurs, the maximum probability of 5°–10° temperature distribution is about 18.7%, and the maximum probability of 60–70% relative humidity distribution is about 23.9%. These characteristics are consistent with the characteristics of a temperate and semi-humid continental climate system. The pressure of 1015–1020 hpa corresponds to a maximum probability of 25%, which is slightly larger than standard atmospheric pressure. These wind speed distributions between 1 m/s and 2 m/s occur with a probability of more than 58%, while the wind direction shows variable distribution characteristics, with northeast and southwest winds being the prevailing winds when aerosol pollution occurs, corresponding to a probability of 17% and 32%, respectively (Figure 2g,h). These data analyses indicate that aerosol pollution over the Beijing area is affected by the low wind speeds of the northeast and southwest winds.
Table 1 shows the corresponding monthly average statistical data of air quality concentration and meteorological elements in Beijing from 2019 to 2021. The synapse represents the standard deviation of each covariate, and the upper and lower edges of the box rectangle represent 25% and 75% of the quantiles, respectively. The results show that the peak of PM2.5 occurred in February (59.52 μg/m3) and the trough occurred in August (22.49 μg/m3). The peak of PM10 occurred in March (106.62 μg/m3) and the trough occurred in August (38.00 μg/m3). These data indicate that February and March during the winter and spring seasons are the peak periods of pollution, often accompanied by large-particulate pollutants.
Temperature and humidity both indicate a strong temperate semi-humid continental climate and seasonal characteristics. The temperature shows a clear mountain peak shape, with the highest average temperature in summer reaching 27.10 °C. The summer and autumn seasons have relatively abundant rainfall, which leads to the highest relative humidity, with an average of nearly 70%. At the same time, precipitation also makes it difficult for aerosol pollution to form during the summer and autumn seasons. During the spring and winter seasons, the Beijing area is cold and dry. Although the relative humidity is between 40 and 60%, under such humidity conditions, combined with low wind speeds below an average of 2.5 m/s, fine particulate matter easily absorbs into water vapor and condenses into pollutant particles, which are stable and not easily diffused. The average wind direction is southwest and has little variation. Due to the lack of mountain ranges on the terrain, it is easy for particulate matter from inland areas to be transported to the Beijing area, further exacerbating aerosol pollution during the spring and winter seasons.
From the above table, we can conclude that February and March are periods with a high occurrence of particulate matter (PM) pollution. Figure 3 further shows the relationship between PM and meteorological elements under polluted weather conditions from February to March before and after the epidemic (2019, 2020, and 2021) at the Beijing stations. The average concentration of PM from February to March before and after the epidemic (2019, 2020, and 2021) were 128.3 μg/m3, 117.2 μg/m3, and 127.6 μg/m3, respectively (Figure 3a). It can be seen that the number of days with PM pollution from February to March 2020 was 12, significantly less than the number in 2019 and 2021. This provides us with a research idea concerning the management of human activity and anthropogenic pollution emissions, which requires further quantitative research. It is worth mentioning that the PM pollution from February to March 2019, when compared to 2020 and 2021, was characterized by both small and large PM pollution and cross-secondary pollution. During the particulate matter pollution weather processes from February to March before and after the epidemic (2019, 2020, and 2021), the meteorological conditions were relatively similar (Figure 3f): the temperature gradually increased from February to March; the wind speed was relatively low, and the wind direction was basically southeast; and the pressure fluctuated around the standard atmosphere with little change. When the pressure is high, high concentrations of small particles are produced, which may be the result of a decrease in the planetary boundary layer height (PBLH). In addition, higher levels of small PM pollution were accompanied by higher relative humidity (above 60%), while large PM pollution exhibited lower relative humidity (below 50%). This may be beneficial for the moisture absorption growth of aerosol particles under high humidity conditions, while dust may occur under low humidity conditions.

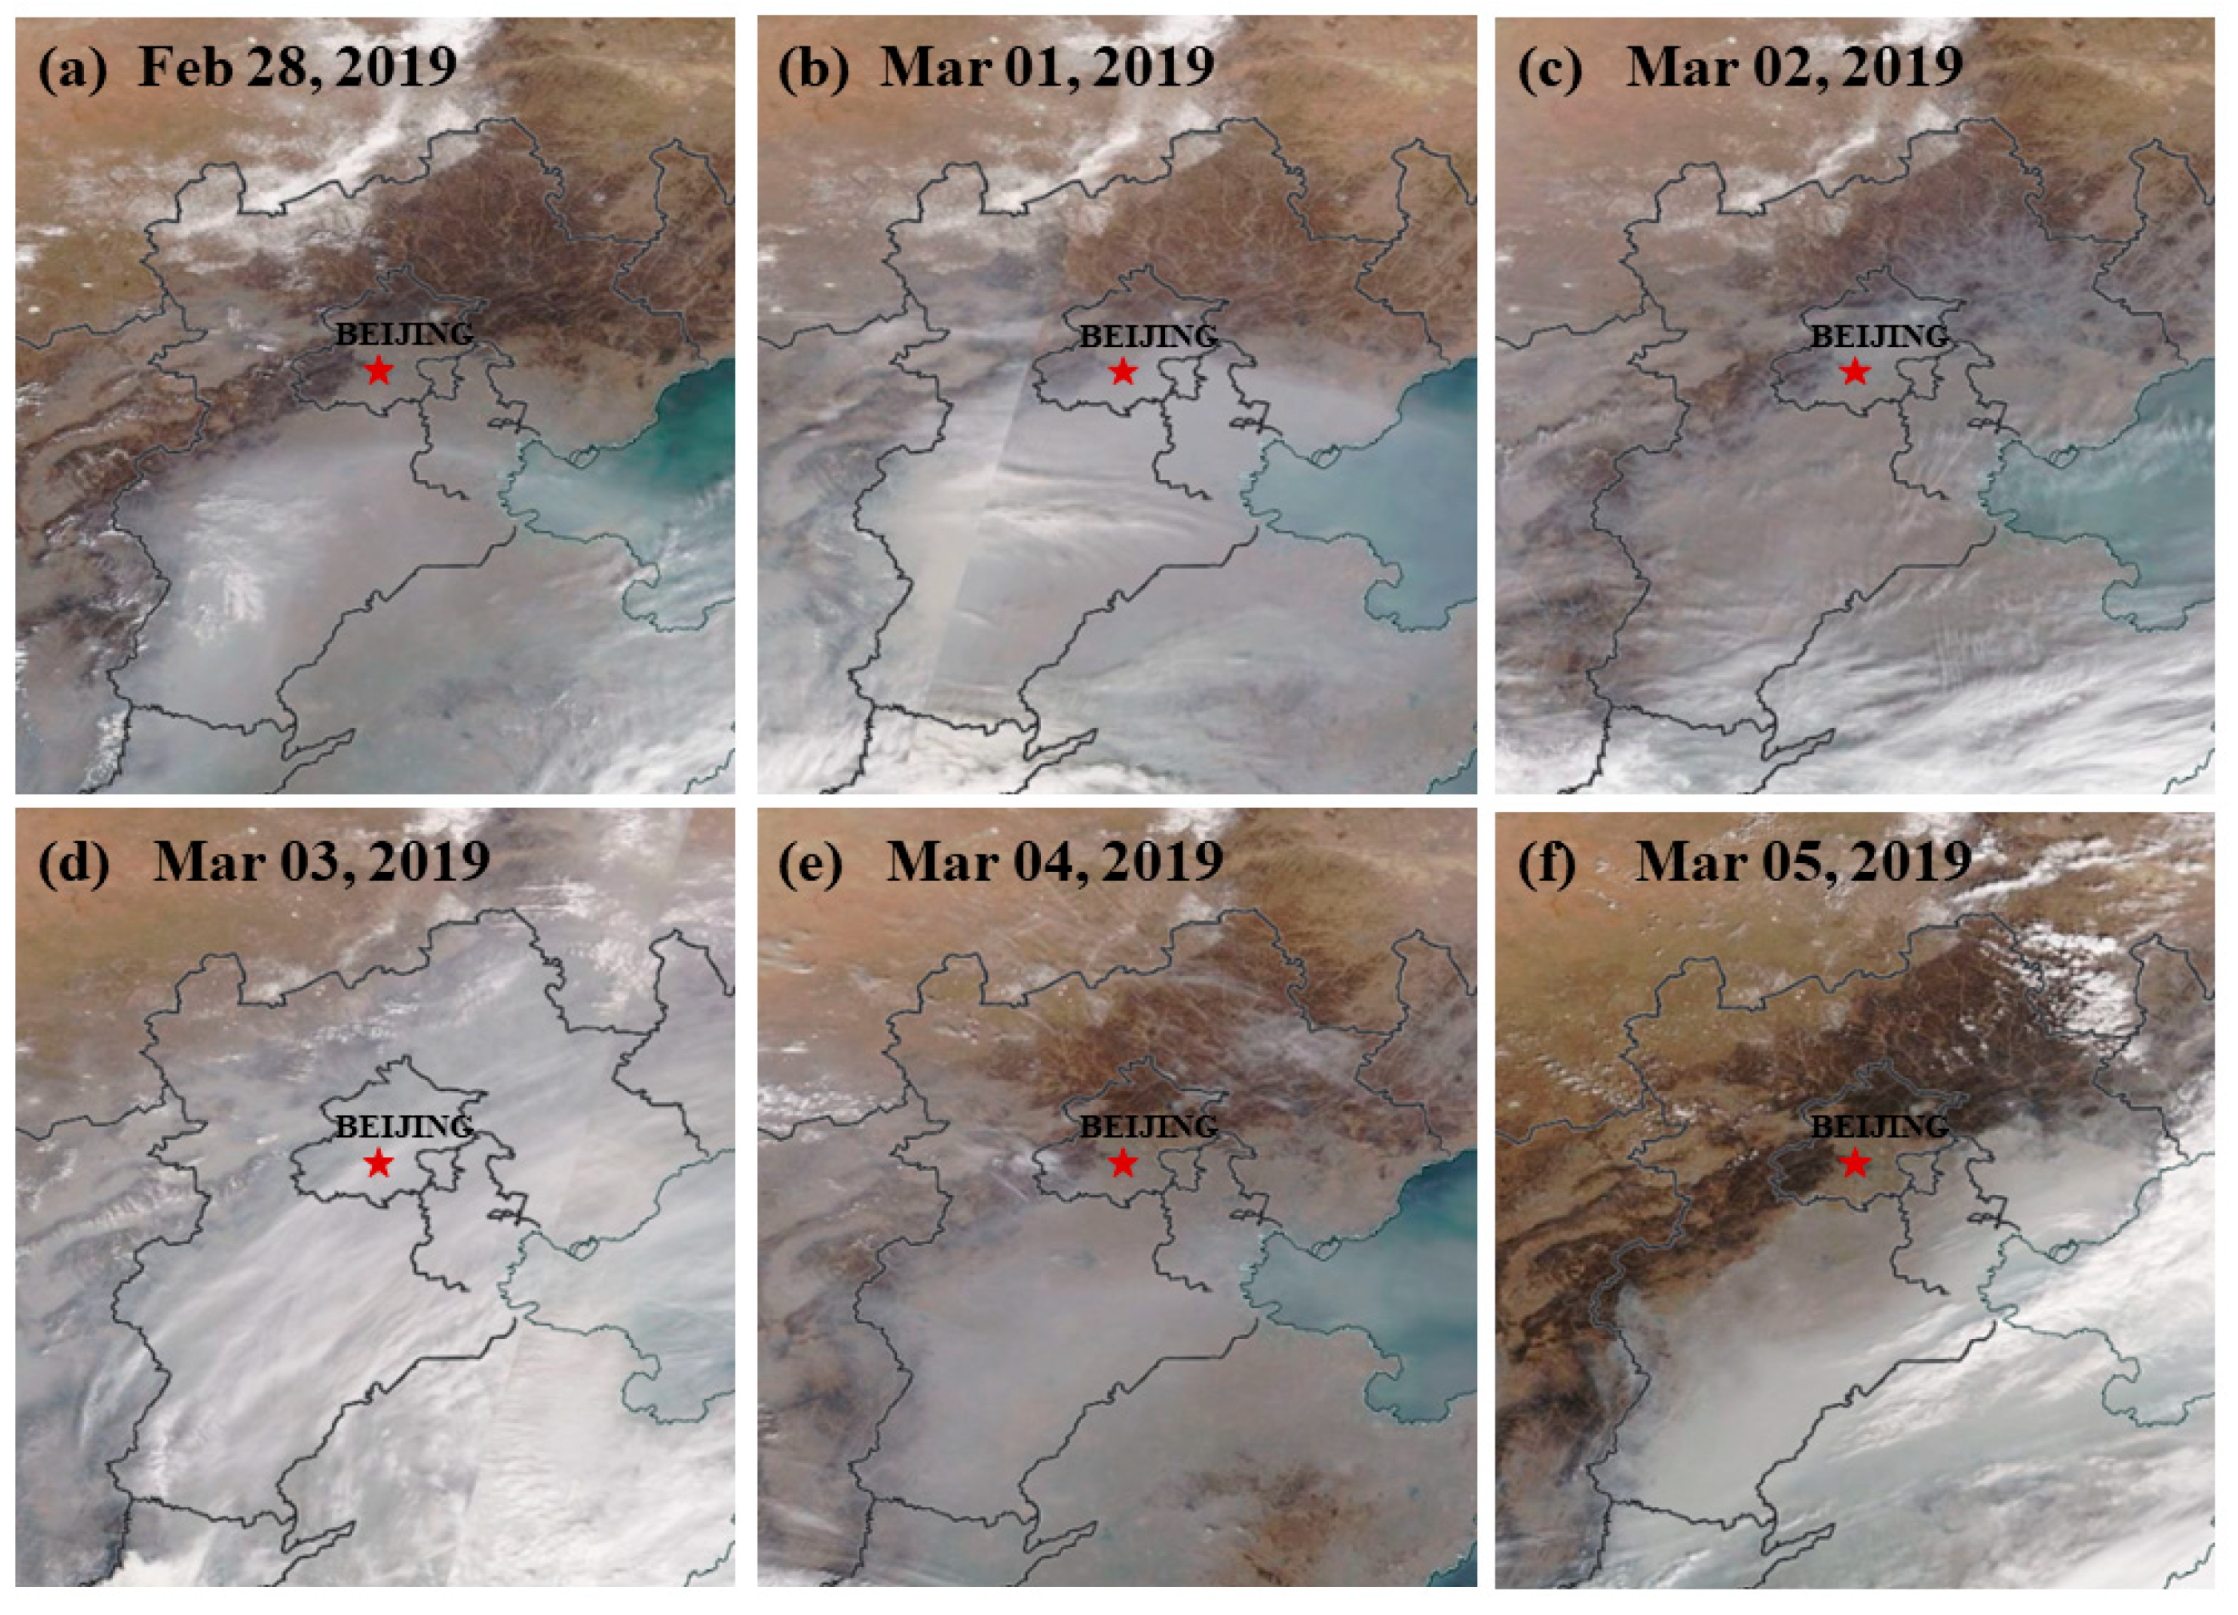
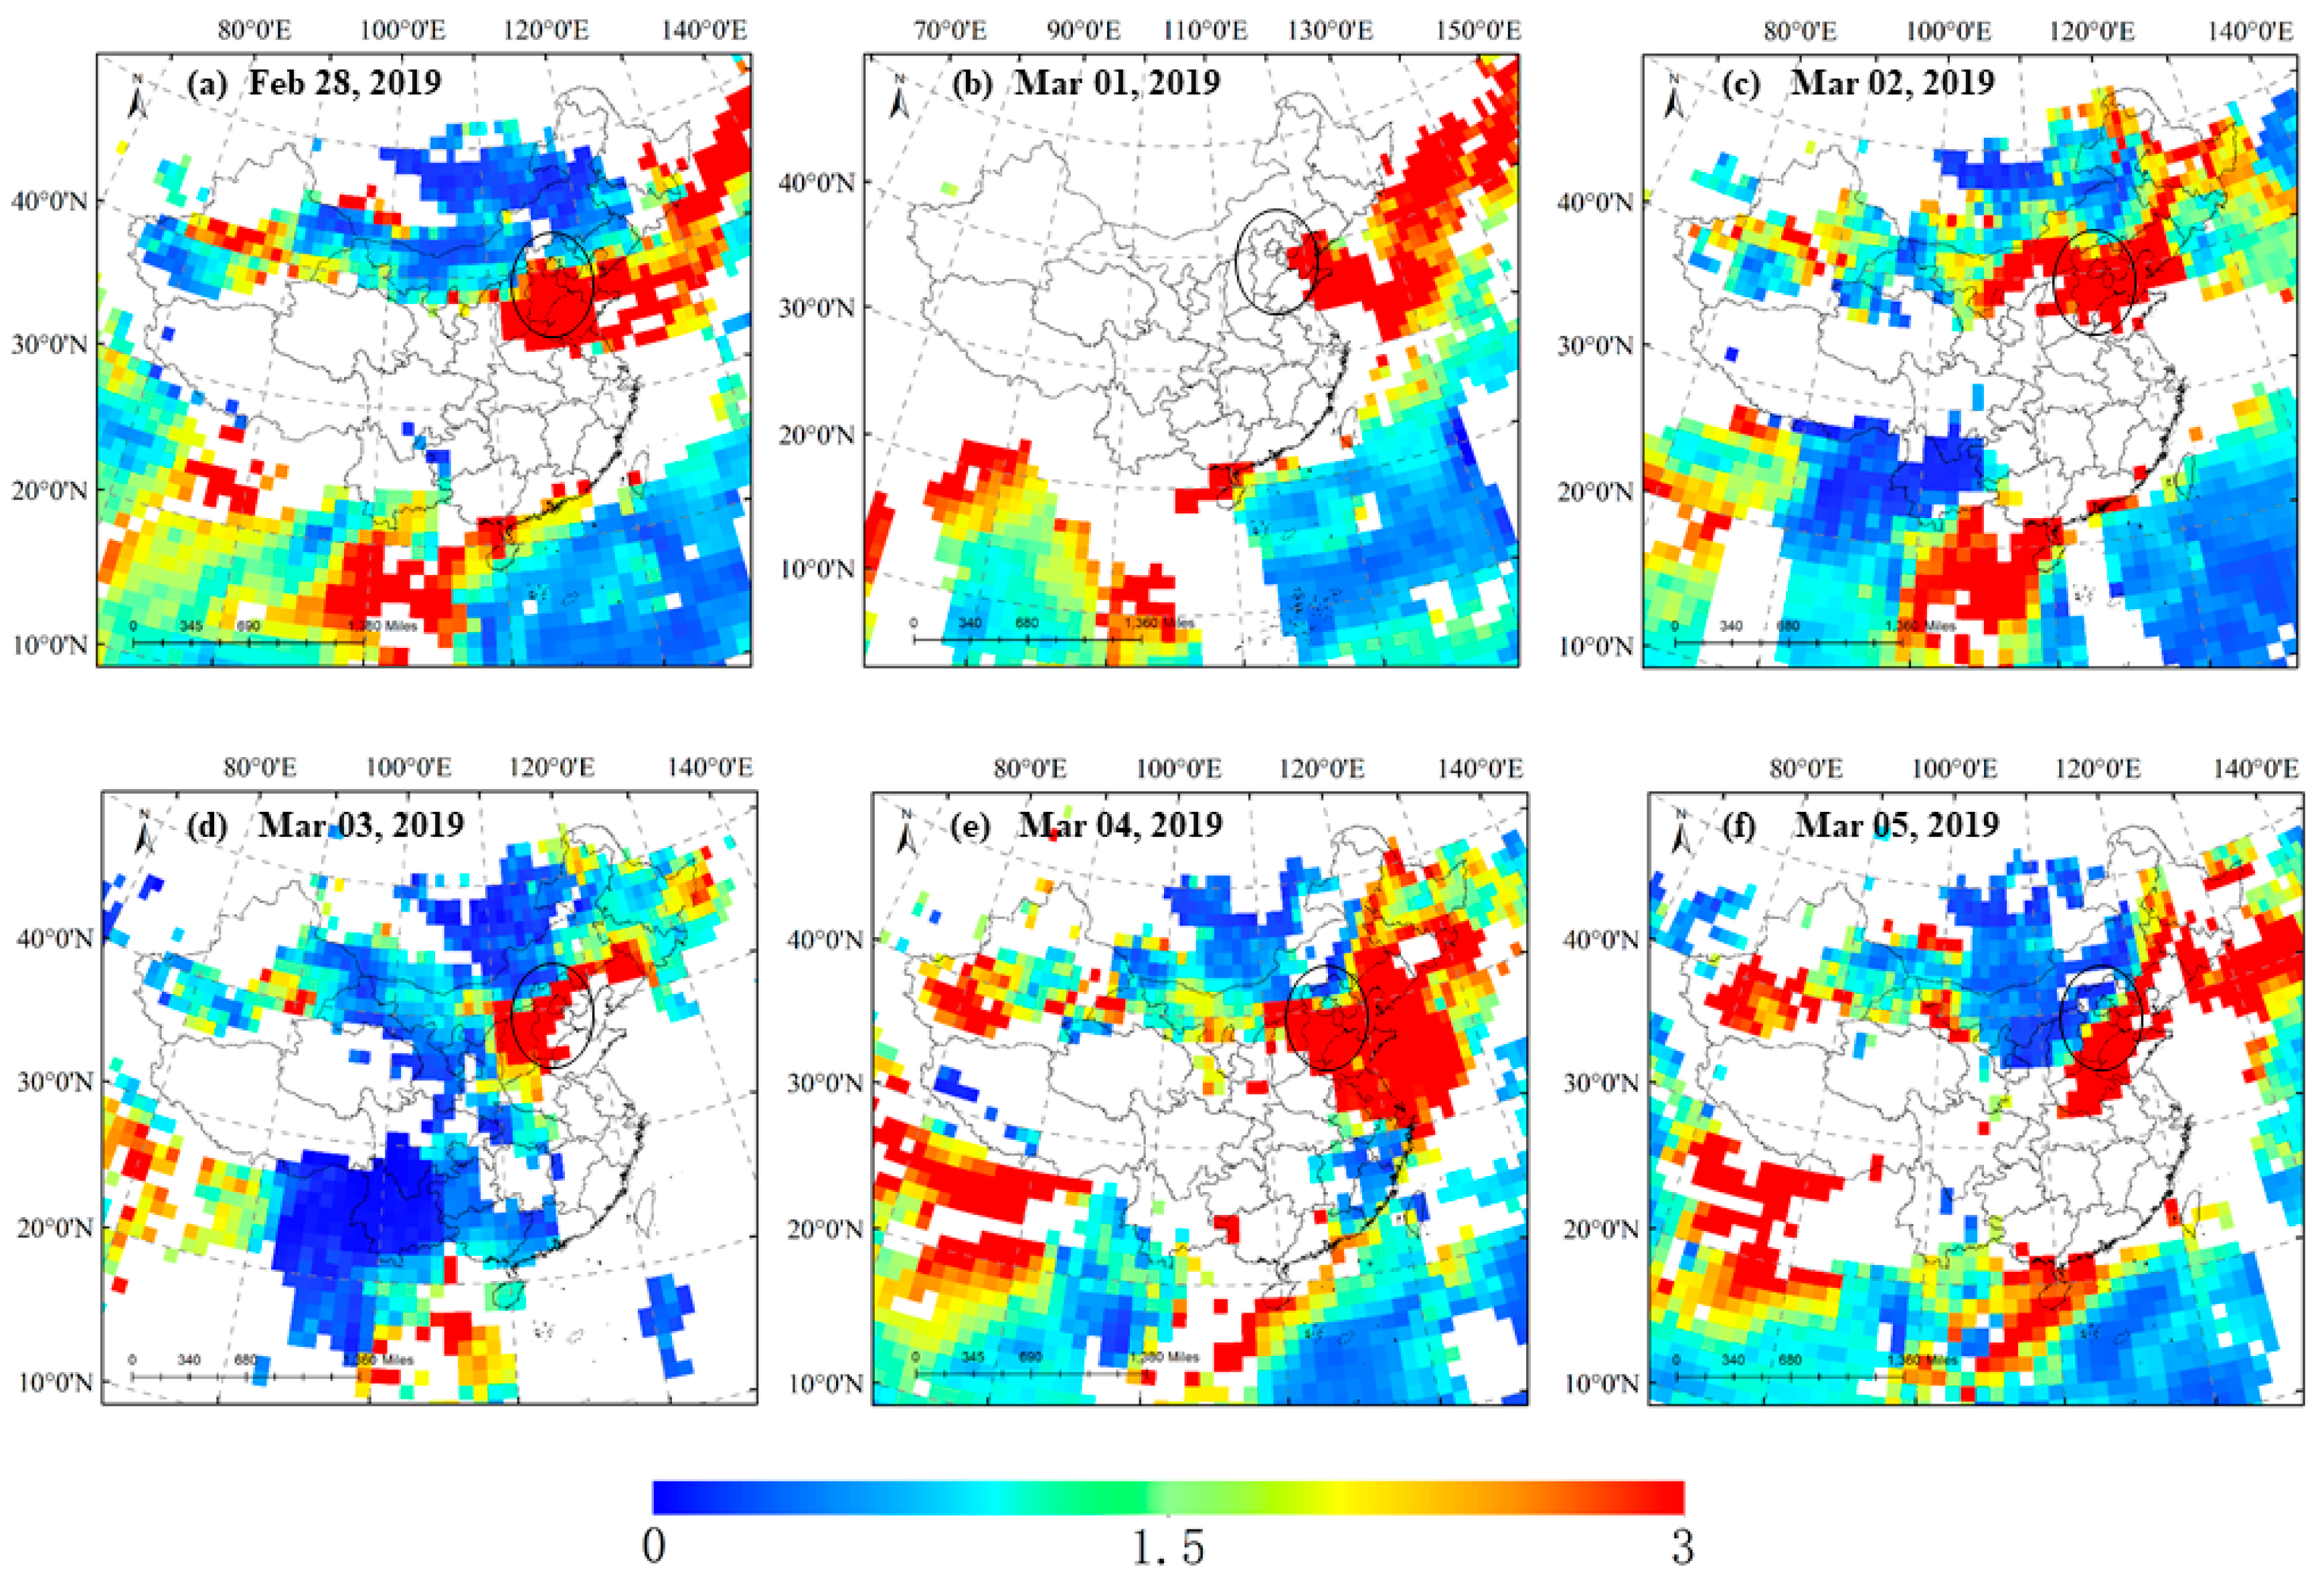
3.2. AOD Distribution and Aerosol Remote Sensing Observation Results

To further investigate the mechanisms of aerosol generation and transmission, a typical pre-lockdown heavy aerosol pollution event over Beijing was studied (28 February–5 March 2019). The distribution of PM2.5 (Figure 4(a1–f1)) and PM10 (Figure 4(a2–f2)) at monitoring stations in inland areas was retrieved. It can be seen that during this period of heavy aerosol pollution, the PM2.5 and PM10 values in Beijing were relatively high, with peaks both exceeding 200 μg/m3.
As shown in the MODIS true color image (Figure 5), the sky over the BTH area was covered with gray aerosols during the period of 28 February to 5 March 2019. Starting from 28 February, aerosols were generated southwest of the BTH area, gradually spreading to the entire BTH area. On 5 March, the northwest BTH area took the lead in removing aerosol pollution. By retrieving the deep blue AOD data observed by the VIIRS sensor (Figure 6), the trends of this process were also confirmed, and the maximum AOD value reached 3, indicating that the aerosol pollution was very serious.
The LIDAR data from the CALIPSO satellite can be used to characterize the distribution of aerosols in the BTH area, which helps to understand the pollution mechanisms of aerosol transport. Thanks to cloud and aerosol classification algorithms, types of aerosol pollutants can be distinguished. Figure 7 shows the vertical distribution of aerosols during satellite transit from 28 February to 5 March 2019. It can be seen that on 28 February (Figure 7a,b), at the beginning of the aerosol pollution process, dust and polluted dust were distributed in the atmosphere at an altitude of 1 km–5 km. At this time, external dust fell and mixed with local aerosols in the BTH area. On 2 March (Figure 7c,d), the dust and polluted dust were distributed at altitudes of 0–3 km. On 5 March (Figure 7e,f), dust and polluted dust were both distributed at altitudes of 0–3 km, and it is worth noting that some areas are no longer present at altitudes of 0–1 km. This indicates that some areas had begun to remove pollutants near the ground.

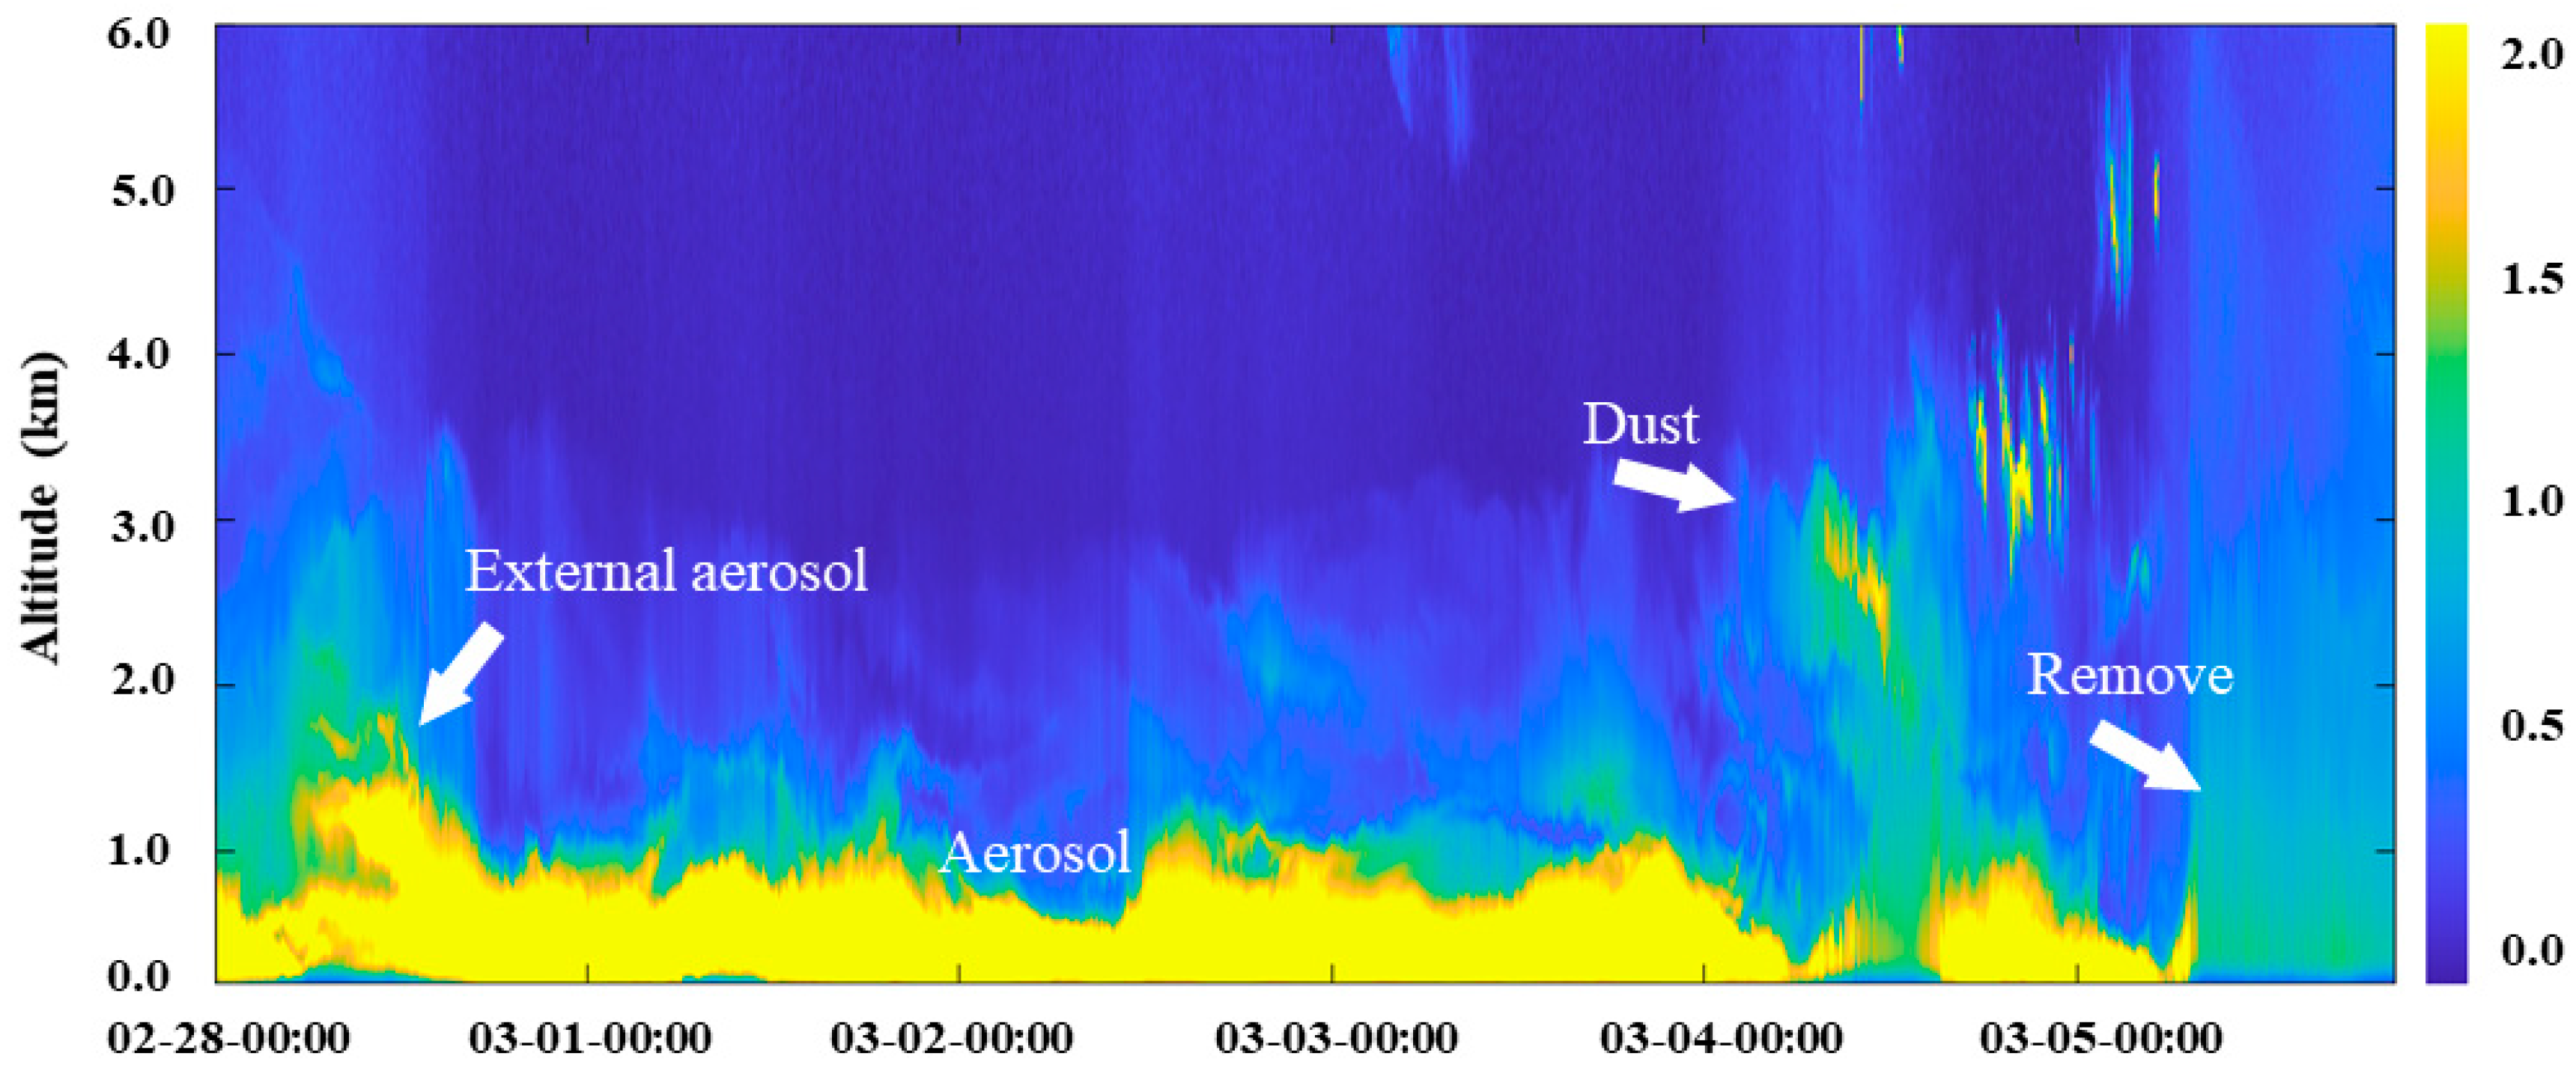
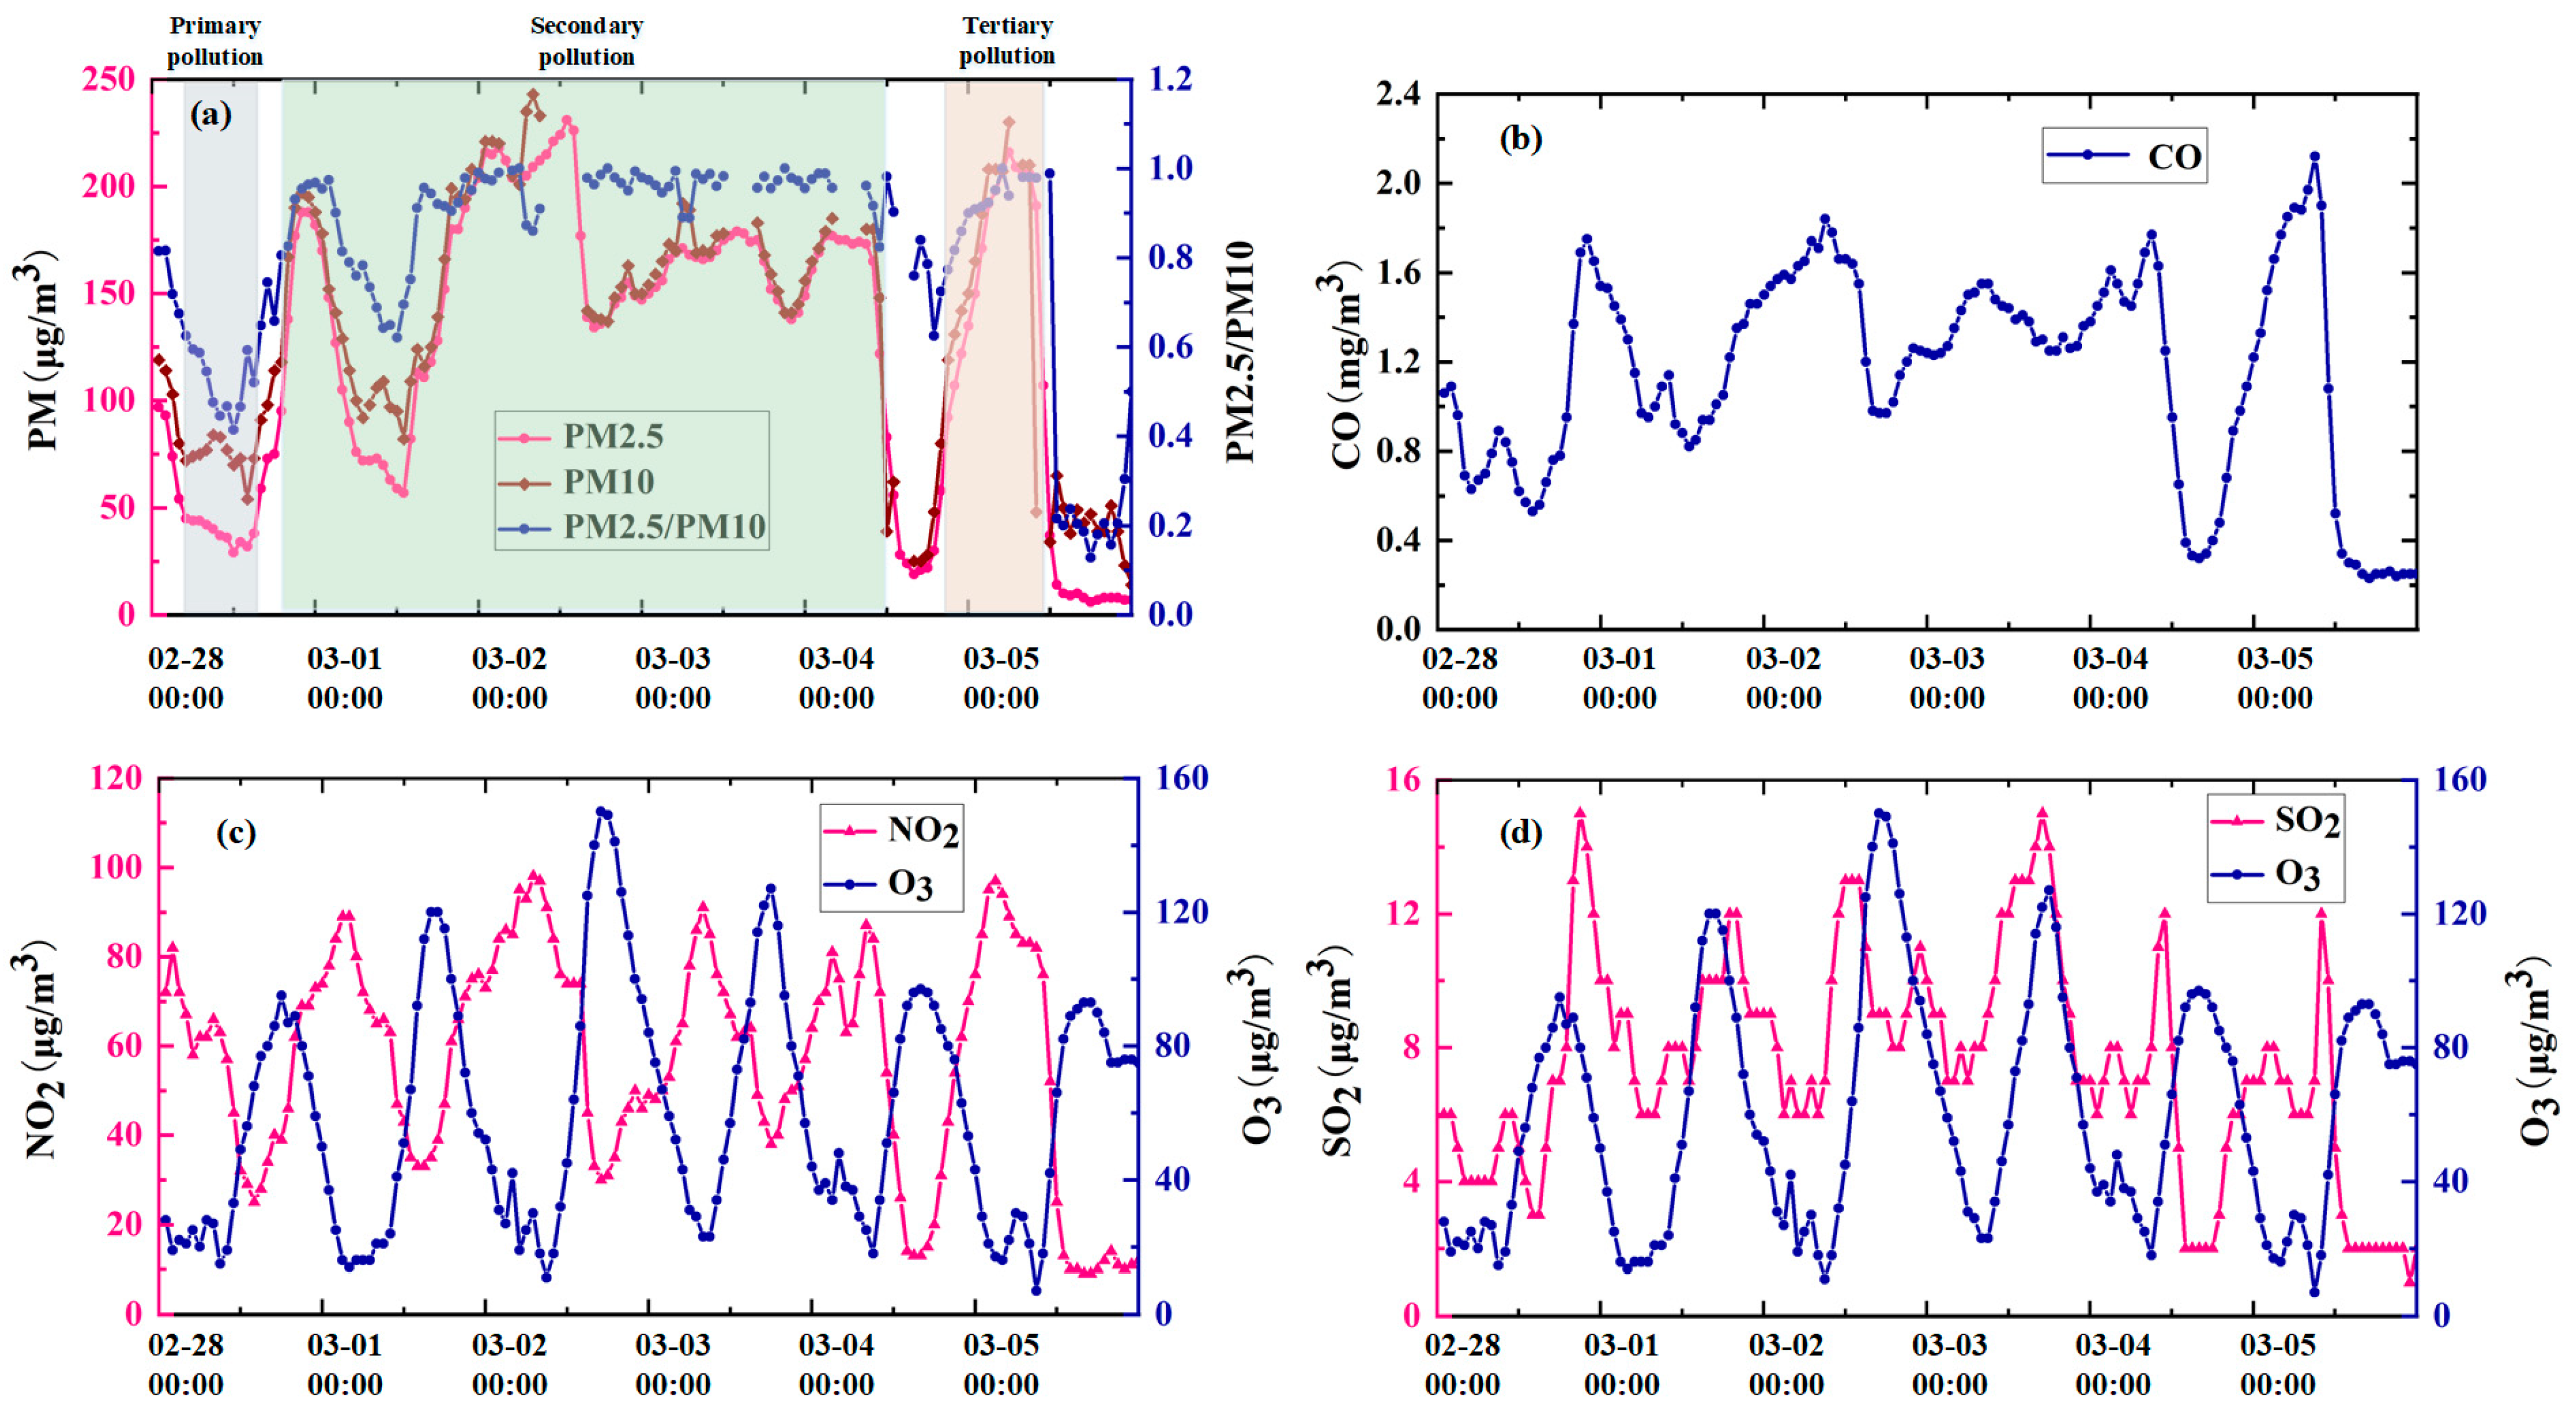
3.3. Analysis of Aerosol Pollution Process

To obtain the whole fine structure of aerosol transport, mixing, accumulation, and dispersion, continuous data detected using ground-based LiDAR near the Beijing monitoring station (Figure 8) were retrieved. Ground-based LiDAR provides higher-resolution data and allows for continuous attention to the entire pollution process. It can be seen that dust at an altitude of 5 km gradually fell and formed an external aerosol layer at 9:00 on 28 February. After that, the PBLH gradually stabilized at about 1 km. When the input dust mixed with aerosols, a relatively stable atmospheric stratification formed. As the particles broke through the stable planetary boundary layer, with the change in momentum, the particles gradually aged until they died. Before 12:00 on 2 March, the PBLH dropped to 0.6 km, when the pollution concentration reached its maximum, and then slowly rose until a new stable atmospheric stratification was formed. We noticed that from 12:00 to 20:00 on 4 March, aerosols near the ground were blown up to a height of 3 km, forming dust. The final removal of aerosol pollution over the Beijing site was seen after 12:00 on 5 March, when a complete dissipation of aerosols from the ground to high altitude could be seen.
Temperature profile data (Figure 9) and air quality data from monitoring stations (Figure 10) were analyzed in order to better investigate the mechanisms of aerosol generation. Figure 9a–f shows the daytime and nighttime temperature profiles during the aerosol pollution process. The height of the inversion layer is below 0.5 km. Previous studies have shown that sustained near-surface inversion could significantly increase PM2.5 concentrations in urban aerosol pollution in northern China. This indicates that the accumulation of pollutants is more favorable under continuous inversion conditions.
Figure 10 shows the air quality data (PM2.5, PM10, CO, NO2, SO2, and O3) taken from the Beijing monitoring stations. The PM2.5/PM10 ratio was below 0.5 at 9:00 on 28 February. The input of dust at this moment caused PM10 to reach a peak of 84 μg/m3, which was the main cause of primary pollution. After that, the dust mixed well with local aerosol particles, and PM2.5 exceeded 220 μg/m3 at 9:00 on 2 March, forming heavy pollution. During this period, the values of PM2.5 and PM10 were close and maintained the same trend of change, and the trend of CO remained the same as that of PM2.5 and PM10. With each peak of PM2.5, PM10, and NO2,I, the same phenomenon was exhibited. The daily variation in NO2 and O3 (low at night and high at noon) shows an opposite trend, indicating the occurrence of photochemical pollution under the oxidation of O3. These formed a secondary nitric acid-type pollution with PM2.5 particles as condensation nodules (Figure 10a,c). As observed using ground-based LiDAR, from 12:00 to 20:00 on 4 March, due to the rising airflow, the pollutant particles on the ground were blown high into the air, and the pollution was quickly relieved. Then, it regrouped, and the PM2.5 mass concentration rose back to 200 μg/m3, accompanied by abnormal increases in NO2 and SO2 (Figure 10d). This formed a combination of nitric acid and sulfuric acid-based photochemical pollution, which we refer to as “tertiary pollution”.
To further investigate the causes of secondary pollution and “tertiary pollution”, as well as the complete elimination of aerosol pollution. Wind speed and direction data, ERA5 reanalysis data, and backward trajectory models were retrieved. Figure 11 shows the wind speed and direction data taken from the Beijing monitoring stations. The change in the air quality concentration data is directly related to the change in wind speed and wind direction. For example, in secondary pollution (from 0:00 to 12:00 on 1 March and 12:00 on 4 March), the increase and decrease in PM2.5 concentrations are related to continuous changes in wind direction. In secondary pollution, the average wind speed during the rest of the period was low, with winds below 3 m/s and with wind directions mostly southwest and northwest. Such calm and stable conditions, combined with ground temperature inversion, are conducive to the accumulation of aerosols (Figure 11a,b and Figure 12b–d).
The ERA5 surface weather situation map (Figure 12a–f) shows that the Beijing area is influenced by a high-pressure ridge during all periods except for 1 March. During the process of high-altitude air flow towards low altitude, the temperature gradually increased, and the water vapor and cloud droplets in the air continued to evaporate. At the same time, it also prevented the water vapor and dust on the ground from rising and condensing, and the aerosol continued to persist. In addition, from 12:00 to 20:00 on 4 March, the presence of dust at a height of 3 km can be determined to be due to a combination of wind direction changes and upwelling caused by the heat island effect (Figure 12a–e). At 12:00 on 5 March, cold air from the northwest moved southeast, passing through the Yanshan–Taihang Mountains. The surface temperature on the leeward slope was about 15 °C higher than that on the windward slope, forming the “foehn effect” (Figure 12f), indicating that precipitation was not the factor that relieved the aerosol pollution [39]. Under the combined action of a cold high pressure of 1020 hpa, wind speeds greater than 4.4 m/s, and the “foehn effect”, the aerosol pollution was transmitted and diffused towards the southeast, gradually relieving the pollution (which is consistent with the AOD results shown in Figure 6f).
Figure 13 shows the simulation of the 72 h backward trajectory of particles at a height of 0.5 km based on ground-based LiDAR observations. Most of the dust in the typical aerosol pollution over Beijing comes from the transport of large particles from outer Mongolia in the northwest. Other pollutants come from the surrounding areas of the BTH area of China, where industry is developed, and industrial production and vehicles emit more gaseous precursors of aerosols. When these gaseous precursors of aerosols are transmitted to the BTH area, they can participate in the formation of nitric acid, sulfuric acid, and fine aerosols.

4. Conclusions

This article comprehensively considered the terrain characteristics of the BTH area, weather and climate change characteristics, pandemic lockdown policy, and the internal mechanisms of aerosols. Through various means, a comprehensive investigation was conducted on aerosol pollution in Beijing and surrounding areas pre- and post-lockdown in order to reveal the mechanism of aerosol pollution. The details are as follows:
According to the analysis of monitoring stations, compared with pre- and post-lockdown, the total number of polluted days and the number of days with moderate pollution or higher in the Beijing area in 2020 decreased by 8.5% and 11%, respectively, and the average concentration of particulate matter also decreased. This provides us with a research idea concerning the management of human activity and anthropogenic pollution emissions. According to the analysis of the terrain characteristics and weather and climate characteristics of the BTH area, the highest incidence of aerosol pollution over Beijing occurs in February and March, spring and winter. When aerosol pollution occurs, the maximum probability of PM2.5 and PM10 mass concentrations occur within 75–100 μg/m3 and 100–150 μg/m3, respectively. Northeast and southwest winds prevail in this area. The average wind speed of less than 2.5 m/s and the relative humidity between 40% and 60% are conducive to the accumulation of pollutants. In addition, the analysis results of heavy aerosol pollution over Beijing from 28 February to 5 March 2019 show that the peak concentration of PM2.5 is 220 μg/m3 and the AOD value is greater than 3. In particular, the initial stage of aerosol pollution was caused by dust input from outer Mongolia, which mixed with local small particles to form primary pollution. With the input of NO2 emission from the BTH and surrounding areas, the near-surface temperature inversion and the average wind speed below 3 m/s caused secondary pollution with small particles as condensation nodules. Furthermore, aerosol pollution is temporarily relieved by updrafts. Then, the input of fine particles and the recurrence of photochemical pollution in the surrounding areas made the mass concentration of PM2.5 rise to 200 μg/m3, forming “tertiary pollution”. Under the combined action of a cold high pressure of 1020 hpa, a wind speed greater than 4.4 m/s, and the “foehn effect”, the aerosol pollution would be transmitted and diffused to the southeast, and the pollution would be gradually eliminated.
In this paper, the formation process and generation mechanisms of heavy aerosol pollution over Beijing in winter were explored using a variety of observation methods. For the input of external pollutants, the surrounding areas need to cooperate closely to reduce emissions. At the same time, for the local environmental governance in Beijing, we need to focus on the problem of pollutant emission control in winter. For the formation of similar pollution events, the public can be warned in advance.

Author Contributions

Supervision, Z.F.; Designed the study, H.Y.; Methodology, H.Y., Y.H., F.M., and D.Q.; Software, H.Y., X.Z. and C.T.; Writing—Original Draft, H.Y.; Writing—Review and Editing, Z.F. and H.Y. All authors have read and agreed to the published version of the manuscript.

Funding

This work was jointly funded by the National Science Foundation of China (Grant No. 12205073), University Natural Sciences Research Project of Anhui Province (Project Numbers: 2023AH052201 and 2023AH052184) and 2023 Talent Research Fund Project of Hefei University (No. 23RC01).

Institutional Review Board Statement

Not applicable.

Informed Consent Statement

Not applicable.

Data Availability Statement

The data used in this work are available at https://doi.org/10.5281/zenodo.10056691 (accessed on 31 October 2023).

Conflicts of Interest

The authors declare no conflicts of interest.

References

  1. WHO. WHO Director-General’s Opening Remarks at the Media Briefing on COVID-19. 2020. Available online: https://www.who.int/director-general/speeches/detail/who-director-general-s-opening-remarks-at-the-media-briefing-on-covid-19 (accessed on 11 March 2020).
  2. WHO. COVID-19 Weekly Epidemiological Update. 2023. Available online: https://covid19.who.int (accessed on 9 June 2023).
  3. Kok, J.F.; Storelvmo, T.; Karydis, V.A.; Adebiyi, A.A.; Mahowald, N.M.; Evan, A.T.; He, C.; Leung, D.M. Mineral dust aerosol impacts on global climate and climate change. Nat. Rev. Earth Environ. 2023, 4, 71–86. [Google Scholar] [CrossRef]
  4. Yang, H.; Fang, Z.; Xie, C.; Cohen, J.; Yang, Y.; Wang, B.; Xing, K.; Cao, Y. Two trans-boundary aerosol transport episodes in the western Yangtze River Delta, China: A perspective from ground-based LiDAR observation. Atmos. Pollut. Res. 2021, 12, 370–380. [Google Scholar] [CrossRef]
  5. Belkina, S.K.; Zalmanzon, Y.E.; Kuznetsov, Y.V.; Rizin, A.I.; Fertman, D.E. Special aerosol sources for certification and test of aerosol radiometers. J. Aerosol Sci. 1991, 22, S801–S804. [Google Scholar] [CrossRef]
  6. Colbeck, I.; Lazaridis, M. Aerosols and environmental pollution. Naturwissenschaften 2010, 97, 117–131. [Google Scholar] [CrossRef]
  7. Liu, Y.; Ning, Z.; Chen, Y.; Guo, M.; Liu, Y.; Gali, N.K.; Sun, L.; Duan, Y.; Cai, J.; Westerdahl, D.; et al. Aerodynamic analysis of SARS-CoV-2 in two Wuhan hospitals. Nature 2020, 582, 557–560. [Google Scholar] [CrossRef]
  8. Liang, Y.; Gui, K.; Che, H.; Li, L.; Zheng, Y.; Zhang, X.; Zhang, X.; Zhang, P.; Zhang, X. Changes in aerosol loading before, during and after the COVID-19 pandemic outbreak in China: Effects of anthropogenic and natural aerosol. Sci. Total Environ. 2023, 857, 159435. [Google Scholar] [CrossRef]
  9. Feng, Z.; Wang, X.; Yuan, J.; Zhang, Y.; Yu, M. Changes in air pollution, land surface temperature, and urban heat islands during the COVID-19 lockdown in three Chinese urban agglomerations. Sci. Total Environ. 2023, 892, 164496. [Google Scholar] [CrossRef] [PubMed]
  10. Jin, Q.; Luo, Y.; Meng, X.; Feng, M.; Huang, C. Short- and long-term impacts of the COVID-19 epidemic on urban PM(2.5) variations: Evidence from a megacity, Chengdu. Atmos. Environ. 2023, 294, 119479. [Google Scholar] [CrossRef]
  11. Ciotti, M.; Ciccozzi, M.; Terrinoni, A.; Jiang, W.C.; Wang, C.B.; Bernardini, S. The COVID-19 pandemic. Crit. Rev. Clin. Lab. Sci. 2020, 57, 365–388. [Google Scholar] [CrossRef]
  12. Rawal, V.; Kumar, M.; Verma, A.; Pais, J. COVID-19 Lockdown. Soc. Sci. 2020, 48, 67–82. [Google Scholar]
  13. Lolli, S.; Chen, Y.-C.; Wang, S.-H.; Vivone, G. Impact of meteorological conditions and air pollution on COVID-19 pandemic transmission in Italy. Sci. Rep. 2020, 10, 16213. [Google Scholar] [CrossRef]
  14. Watson, O.J.; Barnsley, G.; Toor, J.; Hogan, A.B.; Winskill, P.; Ghani, A.C. Global impact of the first year of COVID-19 vaccination: A mathematical modelling study. Lancet Infect. Dis. 2022, 22, 1293–1302. [Google Scholar] [CrossRef]
  15. Mousazadeh, M.; Paital, B.; Naghdali, Z.; Mortezania, Z.; Hashemi, M.; Niaragh, E.K.; Aghababaei, M.; Ghorbankhani, M.; Lichtfouse, E.; Sillanpää, M. Positive environmental effects of the coronavirus 2020 episode: A review. Environ. Dev. Sustain. 2021, 23, 12738–12760. [Google Scholar] [CrossRef] [PubMed]
  16. Kim, G.; Lee, J.; Lee, M.-I.; Kim, D. Impacts of urbanization on atmospheric circulation and aerosol transport in a coastal environment simulated by the WRF-Chem coupled with urban canopy model. Atmos. Environ. 2021, 249, 118253. [Google Scholar] [CrossRef]
  17. Yang, Y.; Zheng, Z.; Yim, S.Y.; Roth, M.; Ren, G.; Gao, Z.; Wang, T.; Li, Q.; Shi, C.; Ning, G. PM2.5 pollution modulates wintertime urban heat island intensity in the Beijing-Tianjin-Hebei Megalopolis, China. Geophys. Res. Lett. 2020, 47, e2019GL084288. [Google Scholar] [CrossRef]
  18. Guo, J.; Liu, H.; Li, Z.; Rosenfeld, D.; Jiang, M.; Xu, W.; Jiang, J.H.; He, J.; Chen, D.; Min, M.; et al. Aerosol-induced changes in the vertical structure of precipitation: A perspective of TRMM precipitation radar. Atmos. Chem. Phys. 2018, 18, 13329–13343. [Google Scholar] [CrossRef]
  19. Liu, L.; Guo, J.; Miao, Y.; Li, J.; Chen, D.; He, J.; Cui, C. Elucidating the relationship between aerosol concentration and summertime boundary layer structure in central China. Environ. Pollut. 2018, 241, 646–653. [Google Scholar] [CrossRef] [PubMed]
  20. Ranjan, A.K.; Patra, A.K.; Gorai, A. A review on estimation of particulate matter from satellite-based aerosol optical depth: Data, methods, and challenges. Asia-Pac. J. Atmos. Sci. 2021, 57, 679–699. [Google Scholar] [CrossRef]
  21. Acharya, P.; Barik, G.; Gayen, B.K.; Bar, S.; Maiti, A.; Sarkar, A.; Ghosh, S.; De, S.K.; Sreekesh, S. Revisiting the levels of Aerosol Optical Depth in south-southeast Asia, Europe and USA amid the COVID-19 pandemic using satellite observations. Environ. Res. 2021, 193, 110514. [Google Scholar] [CrossRef]
  22. Yang, F.; Wang, Y.; Tao, J.; Wang, Z.; Fan, M.; De Leeuw, G.; Chen, L. Preliminary Investigation of a New AHI Aerosol Optical Depth (AOD) Retrieval Algorithm and Evaluation with Multiple Source AOD Measurements in China. Remote Sens. 2018, 10, 748. [Google Scholar] [CrossRef]
  23. Lanzaco, B.L.; Olcese, L.E.; Palancar, G.G.; Toselli, B.M. A Method to Improve MODIS AOD Values: Application to South America. Aerosol Air Qual. Res. 2016, 16, 1509–1522. [Google Scholar] [CrossRef]
  24. Wang, Y.; Li, Z.; Wang, Q.; Jin, X.; Yan, P.; Cribb, M.; Li, Y.; Yuan, C.; Wu, H.; Wu, T. Enhancement of secondary aerosol formation by reduced anthropogenic emissions during Spring Festival 2019 and enlightenment for regional PM 2.5 control in Beijing. Atmos. Chem. Phys. 2021, 21, 915–926. [Google Scholar] [CrossRef]
  25. Glassmeier, F.; Hoffmann, F.; Johnson, J.S.; Yamaguchi, T.; Carslaw, K.S.; Feingold, G. Aerosol-cloud-climate cooling overestimated by ship-track data. Science 2021, 371, 485–489. [Google Scholar] [CrossRef]
  26. Guo, J.; Su, T.; Li, Z.; Miao, Y.; Li, J.; Liu, H.; Xu, H.; Cribb, M.; Zhai, P. Declining frequency of summertime local-scale precipitation over eastern China from 1970 to 2010 and its potential link to aerosols. Geophys. Res. Lett. 2017, 44, 5700–5708. [Google Scholar] [CrossRef]
  27. Guo, J.; Su, T.; Chen, D.; Wang, J.; Li, Z.; Lv, Y.; Guo, X.; Liu, H.; Cribb, M.; Zhai, P. Declining summertime local-scale precipitation frequency over China and the United States, 1981–2012: The disparate roles of aerosols. Geophys. Res. Lett. 2019, 46, 13281–13289. [Google Scholar] [CrossRef]
  28. Rosenfeld, D.; Zhu, Y.; Wang, M.; Zheng, Y.; Goren, T.; Yu, S. Aerosol-driven droplet concentrations dominate coverage and water of oceanic low-level clouds. Science 2019, 363, eaav0566. [Google Scholar] [CrossRef] [PubMed]
  29. Zhang, Y.; Easter, R.C.; Ghan, S.J.; Abdul-Razzak, H. Impact of aerosol size representation on modeling aerosol-cloud interactions. J. Geophys. Res.-Atmos. 2002, 107, AAC 4-1–AAC 4-17. [Google Scholar] [CrossRef]
  30. Shang, D.; Peng, J.; Guo, S.; Wu, Z.; Hu, M. Secondary aerosol formation in winter haze over the Beijing-Tianjin-Hebei Region, China. Front. Environ. Sci. Eng. 2021, 15, 1–13. [Google Scholar] [CrossRef]
  31. Han, L.; Yang, X.; Zhang, P.; Xiao, Q.; Cheng, S.; Wang, H.; Guo, J.; Zheng, A. Temporal variations of urban re-suspended road dust characteristics and its vital contributions to airborne PM2. 5/PM10 during a long period in Beijing. Environ. Pollut. 2023, 330, 121727. [Google Scholar] [CrossRef] [PubMed]
  32. Ren, Y.; Wei, J.; Wu, Z.; Ji, Y.; Bi, F.; Gao, R.; Wang, X.; Wang, G.; Li, H. Chemical components and source identification of PM2. 5 in non-heating season in Beijing: The influences of biomass burning and dust. Atmos. Res. 2021, 251, 105412. [Google Scholar] [CrossRef]
  33. China National Bureau of Statistics. Seventh National Population Census Bulletin. 2021. Available online: https://www.gov.cn/guoqing/2021-05/13/content_5606149.htm (accessed on 10 June 2023).
  34. Xinhua News Agency Beijing Has Adjusted Its Level-I Response Tolevel-II Response for Public Health Emergencies. 2020. Available online: https://www.gov.cn/xinwen/2020-04/29/content_5507505.htm (accessed on 10 June 2023).
  35. Han, Y.; Wang, T.; Tang, J.; Wang, C.; Jian, B.; Huang, Z.; Huang, J. New insights into the Asian dust cycle derived from CALIPSO LiDAR measurements. Remote Sens. Environ. 2022, 272, 112906. [Google Scholar] [CrossRef]
  36. He, L.; Wang, L.; Li, Z.; Jiang, D.; Sun, L.; Liu, D.; Liu, L.; Yao, R.; Zhou, Z.; Wei, J. VIIRS Environmental Data Record and Deep Blue aerosol products: Validation, comparison, and spatiotemporal variations from 2013 to 2018 in China. Atmos. Environ. 2021, 250, 118265. [Google Scholar] [CrossRef]
  37. Ma, Q.; Zhu, L.; Wang, J.; Ju, J.; Wang, Y. Variations in Spring Atmospheric Circulation on the Southwestern Tibetan Plateau During Holocene Linked to High-and Low-Latitude Forcing. Geophys. Res. Lett. 2023, 50, e2023GL103163. [Google Scholar] [CrossRef]
  38. Ambient Air Quality Standards. 2016. Available online: https://www.mee.gov.cn/ywgz/fgbz/bz/bzwb/dqhjbh/dqhjzlbz/201203/t20120302_224165.shtml (accessed on 9 June 2023).
  39. Datta, R.T.; Tedesco, M.; Fettweis, X.; Agosta, C.; Lhermitte, S.; Lenaerts, J.T.; Wever, N. The Effect of Foehn-Induced Surface Melt on Firn Evolution Over the Northeast Antarctic Peninsula. Geophys. Res. Lett. 2019, 46, 3822–3831. [Google Scholar] [CrossRef]
Figure 1. Study area: geographical location (a,b); terrain elevation distribution (c); population distribution (d).
Atmosphere 15 00240 g001
Figure 2. Statistical results of aerosol pollution weather pre- and post-lockdown (2019, 2020, and 2021) at Beijing monitoring station: total air pollution days and days with moderate pollution or above (a); distribution of PM2.5 and PM10 concentrations (b,c); probability density distribution of the meteorological parameters (dh). (The blue dotted line represents the cumulative probability).
Atmosphere 15 00240 g002
Figure 3. The relationship between particulate matter and meteorological elements during instances of polluted weather from February to March before and after the epidemic (2019, 2020, and 2021) at the Beijing stations: (a) particulate matter (PM); (b) temperature (T); (c) relative humidity (RH); (d) atmospheric pressure (AP); (e) wind speed (WS); (f) wind direction (WD).
Atmosphere 15 00240 g003
Figure 4. Distribution of PM2.5 and PM10 at inland stations in China. (The red circle represents the Beijing-Tianjin-Hebei region).
Atmosphere 15 00240 g004
Figure 5. MODIS true color images from 28 February to 5 March 2019.
Atmosphere 15 00240 g005
Figure 6. Aerosol optical depth (AOD) based on 550 nm VIIRS observations. (The black circle represents the Beijing-Tianjin-Hebei region).
Atmosphere 15 00240 g006
Figure 7. Aerosol distribution and types depicted when using CALIPSO satellite LiDAR: (a,c,e) aerosol distribution; (b,d,f) aerosol types. (Arrows represent the direction of satellite transit).
Atmosphere 15 00240 g007
Figure 8. Vertical distribution of aerosols from ground-based LiDAR range-corrected signal inversion.
Atmosphere 15 00240 g008
Figure 9. Temperature profile of the sounding data.
Atmosphere 15 00240 g009
Figure 10. Air quality data taken from the Beijing monitoring stations during pollution period: (a) PM2.5, PM10 and PM2.5/PM10 data; (b) CO data; (c) NO2 and O3 data; (d) SO2 and O3 data.
Atmosphere 15 00240 g010
Figure 11. Wind speed, wind direction and wind rose taken from Beijing monitoring stations: (a) wind speed and wind direction; (b) wind rose. (Blue and pink symbols represent wind speed and wind direction respectively).
Atmosphere 15 00240 g011
Figure 12. ERA5 surface weather situation map during the aerosol pollution period.
Atmosphere 15 00240 g012
Figure 13. Simulation analysis based on particle backward trajectory.
Atmosphere 15 00240 g013
Table 1. Statistics of monthly average of air quality and meteorological elements at Beijing monitoring station for 2019–2021.
MonthT (°C)RH (%)WS (m/s)WD (°)PM2.5 (μg/m3)PM10 (μg/m3)
MeanStdMeanStdMeanStdMeanStdMeanStdMeanStd
Jan.−2.242.8442.2519.071.850.99194.2122.450.4543.350.4543.02
Feb.1.023.8947.4820.471.960.97196.0102.659.5250.568.7146.70
Mar.9.403.8242.1920.052.370.91196.2109.656.8949.37106.62177.86
Apr.15.233.2738.3116.502.510.73202.586.637.8028.8280.8352.40
May.21.412.9944.7417.452.480.72206.194.133.2823.2272.7250.61
Jun.26.292.4851.6215.642.100.56188.688.430.0216.8657.2828.68
Jul.27.102.3269.1312.661.810.37178.982.831.4719.8843.0618.21
Aug.26.081.8667.5113.411.810.50184.190.522.4914.2738.0016.36
Sep.22.272.3366.3314.861.580.45176.092.525.7417.6042.7021.54
Oct.13.193.1457.1316.591.590.67203.6108.935.7530.7759.4237.58
Nov.6.104.0553.5620.521.841.03191.2119.942.1734.2669.1239.26
Dec.−0.953.1845.2817.532.001.09229.5114.533.5329.7856.3930.62
Disclaimer/Publisher’s Note: The statements, opinions and data contained in all publications are solely those of the individual author(s) and contributor(s) and not of MDPI and/or the editor(s). MDPI and/or the editor(s) disclaim responsibility for any injury to people or property resulting from any ideas, methods, instructions or products referred to in the content.

