
Trends of the Global Burden of Disease Linked to Ground-Level Ozone Pollution: A 30-Year Analysis for the Greater Athens Area, Greece
 , , and
Abstract
:1. Introduction
2. Research in Context
Evidence before This Study
3. Materials and Methods
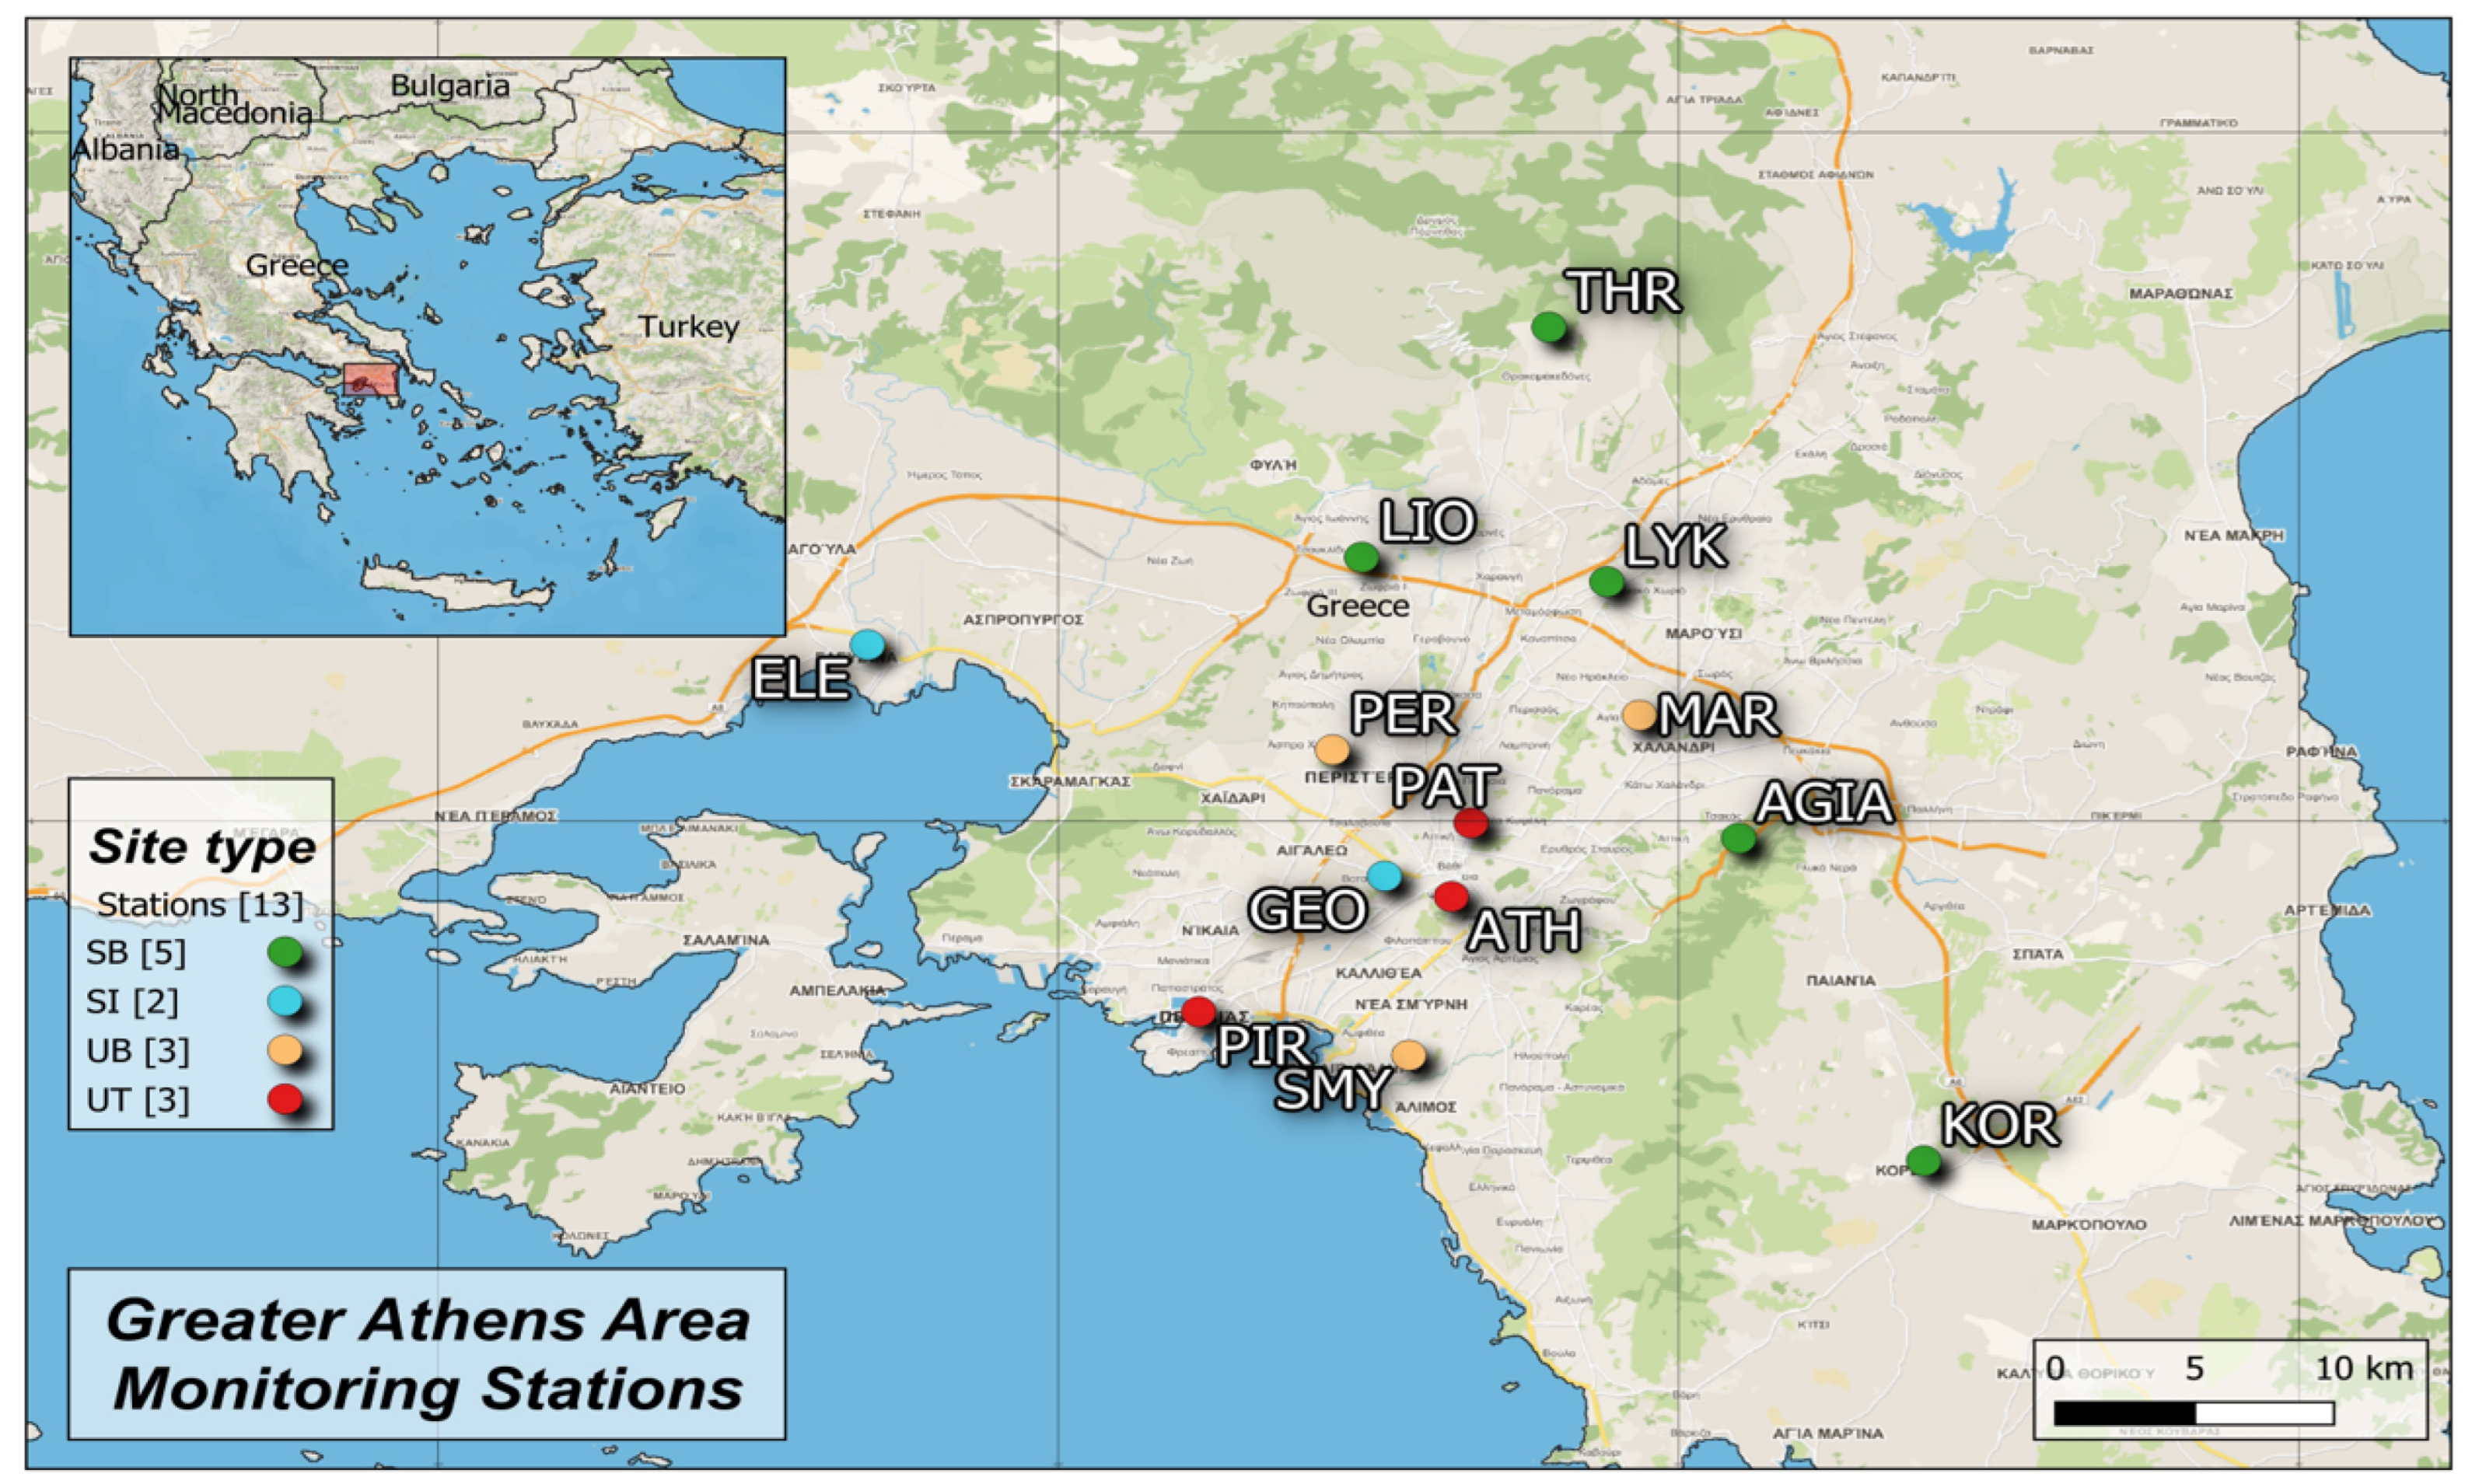
3.1. Area of Interest
3.2. Air Pollution Data and Social Economic Population Status
3.3. Global Burden of Diseases 2019 Study
4. Results
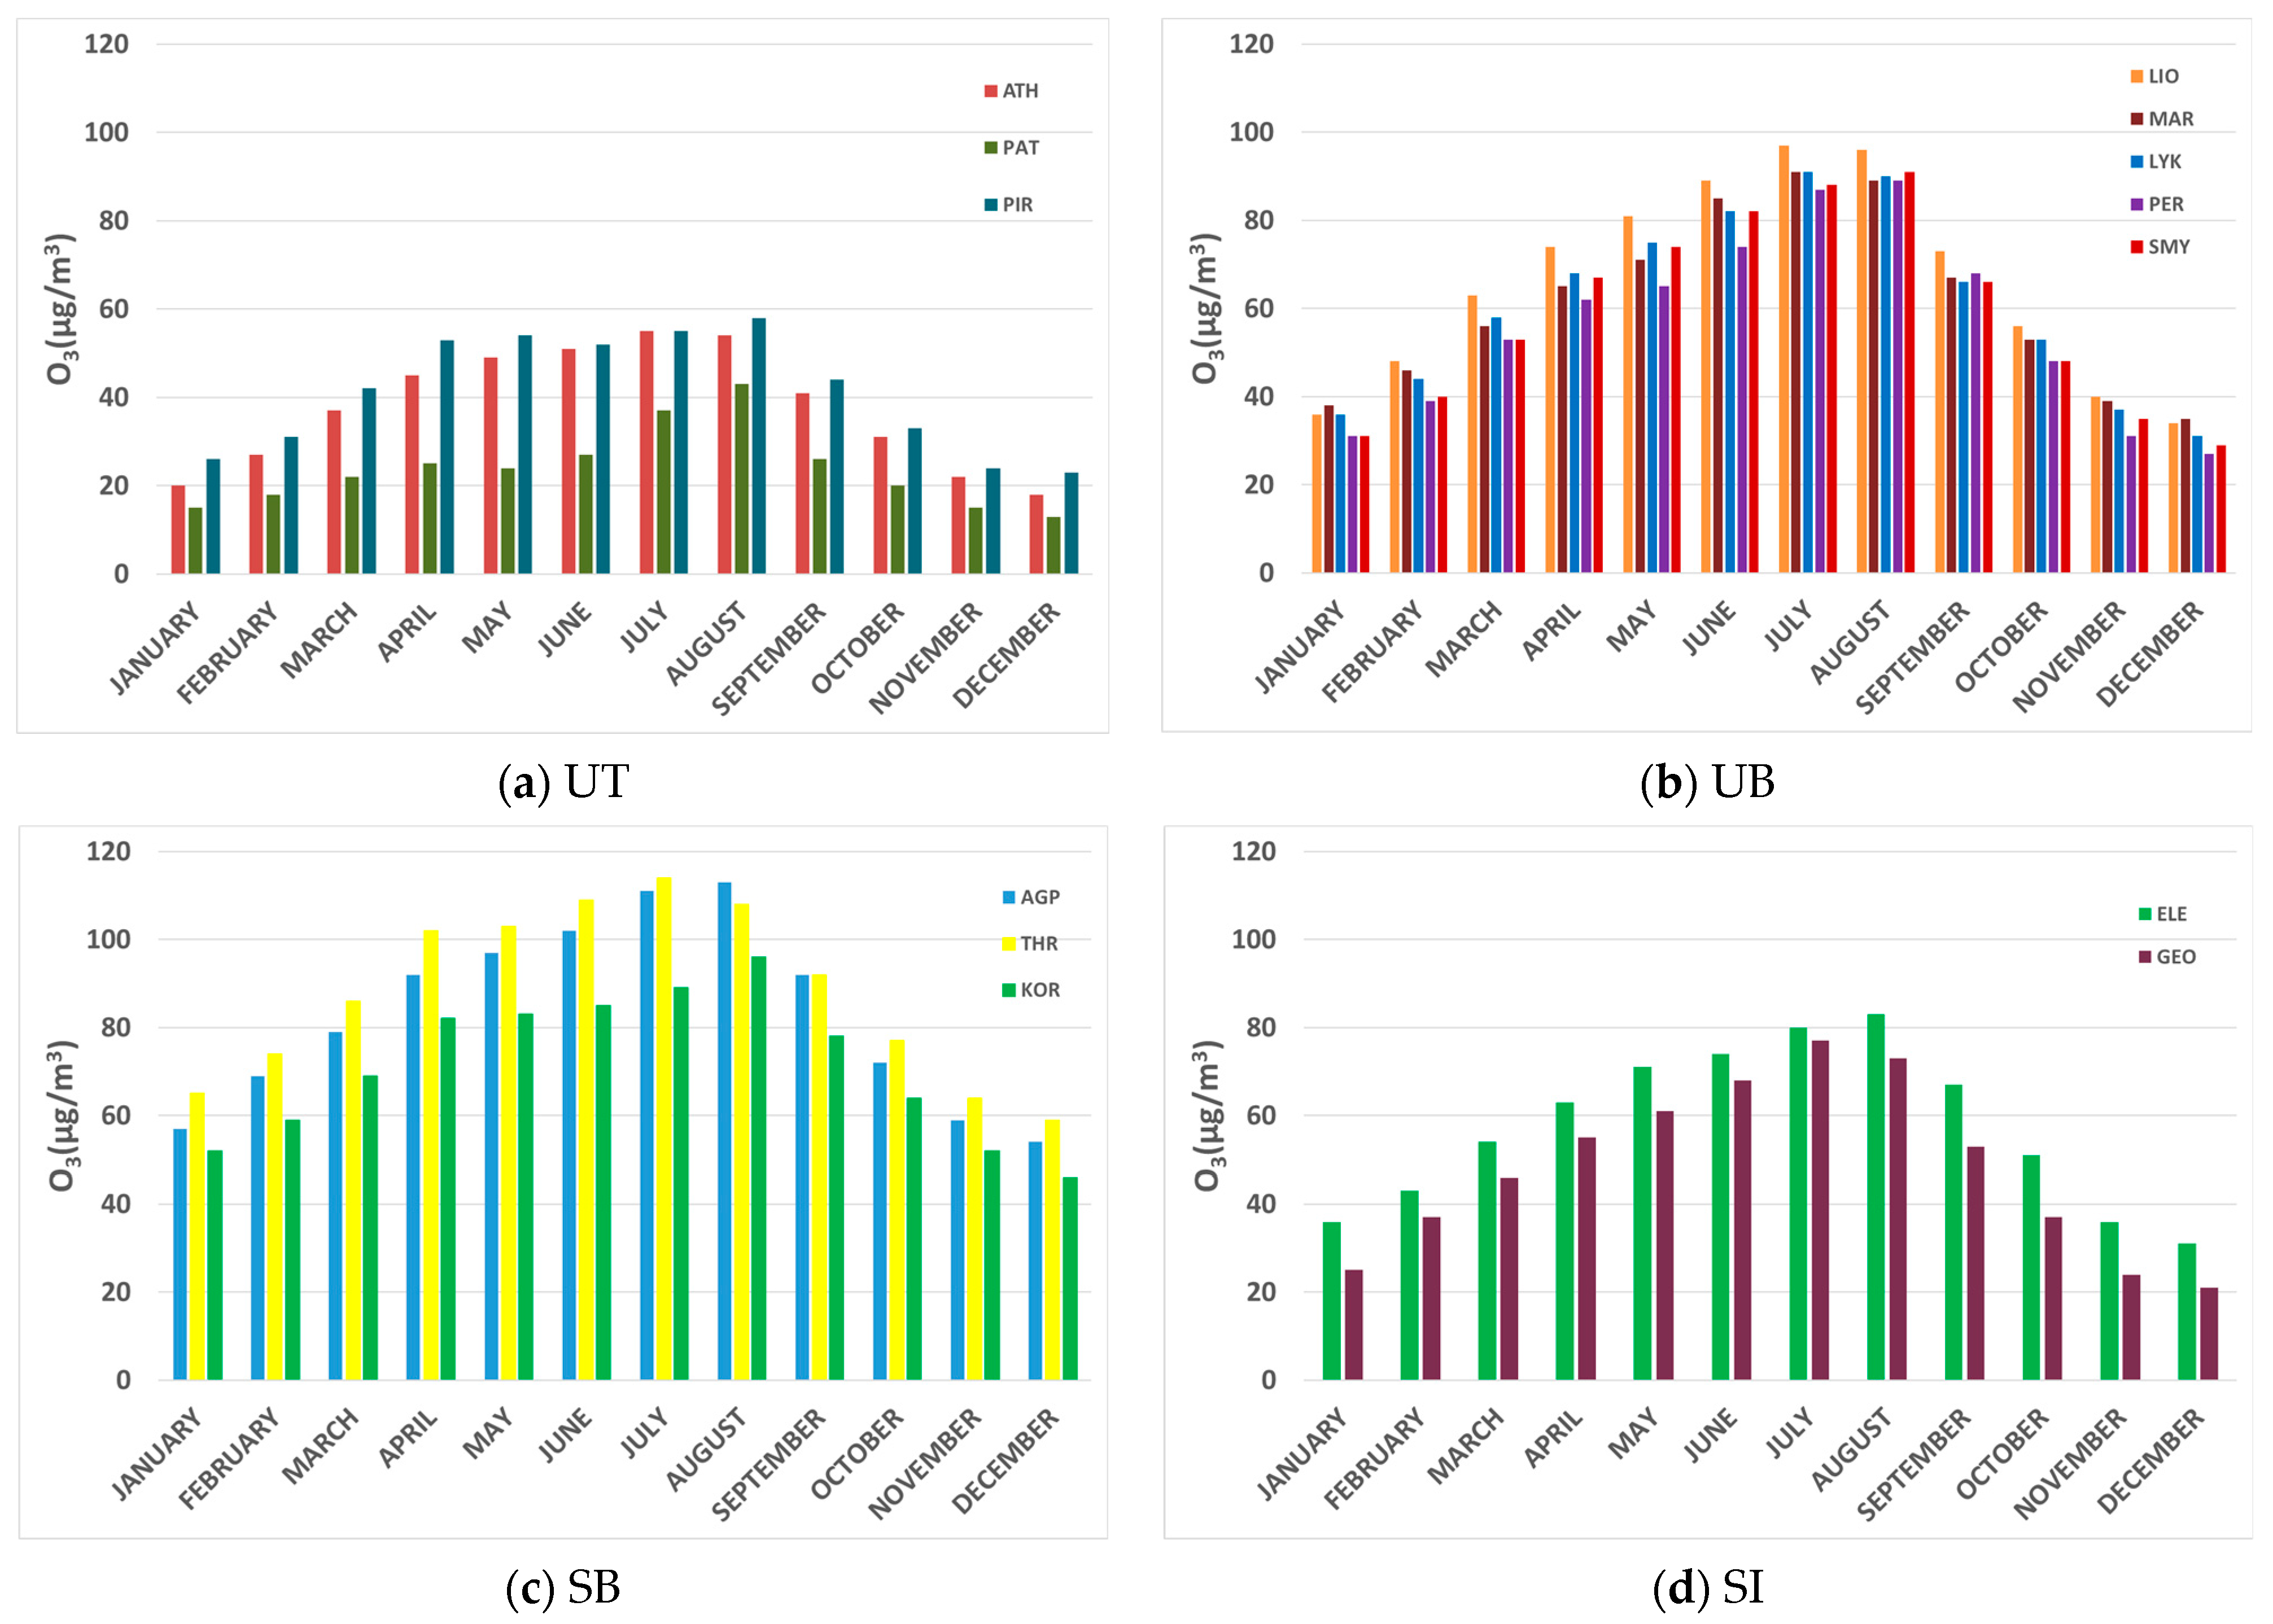
4.1. Variation of Monthly and 24 h Ozone Concentrations
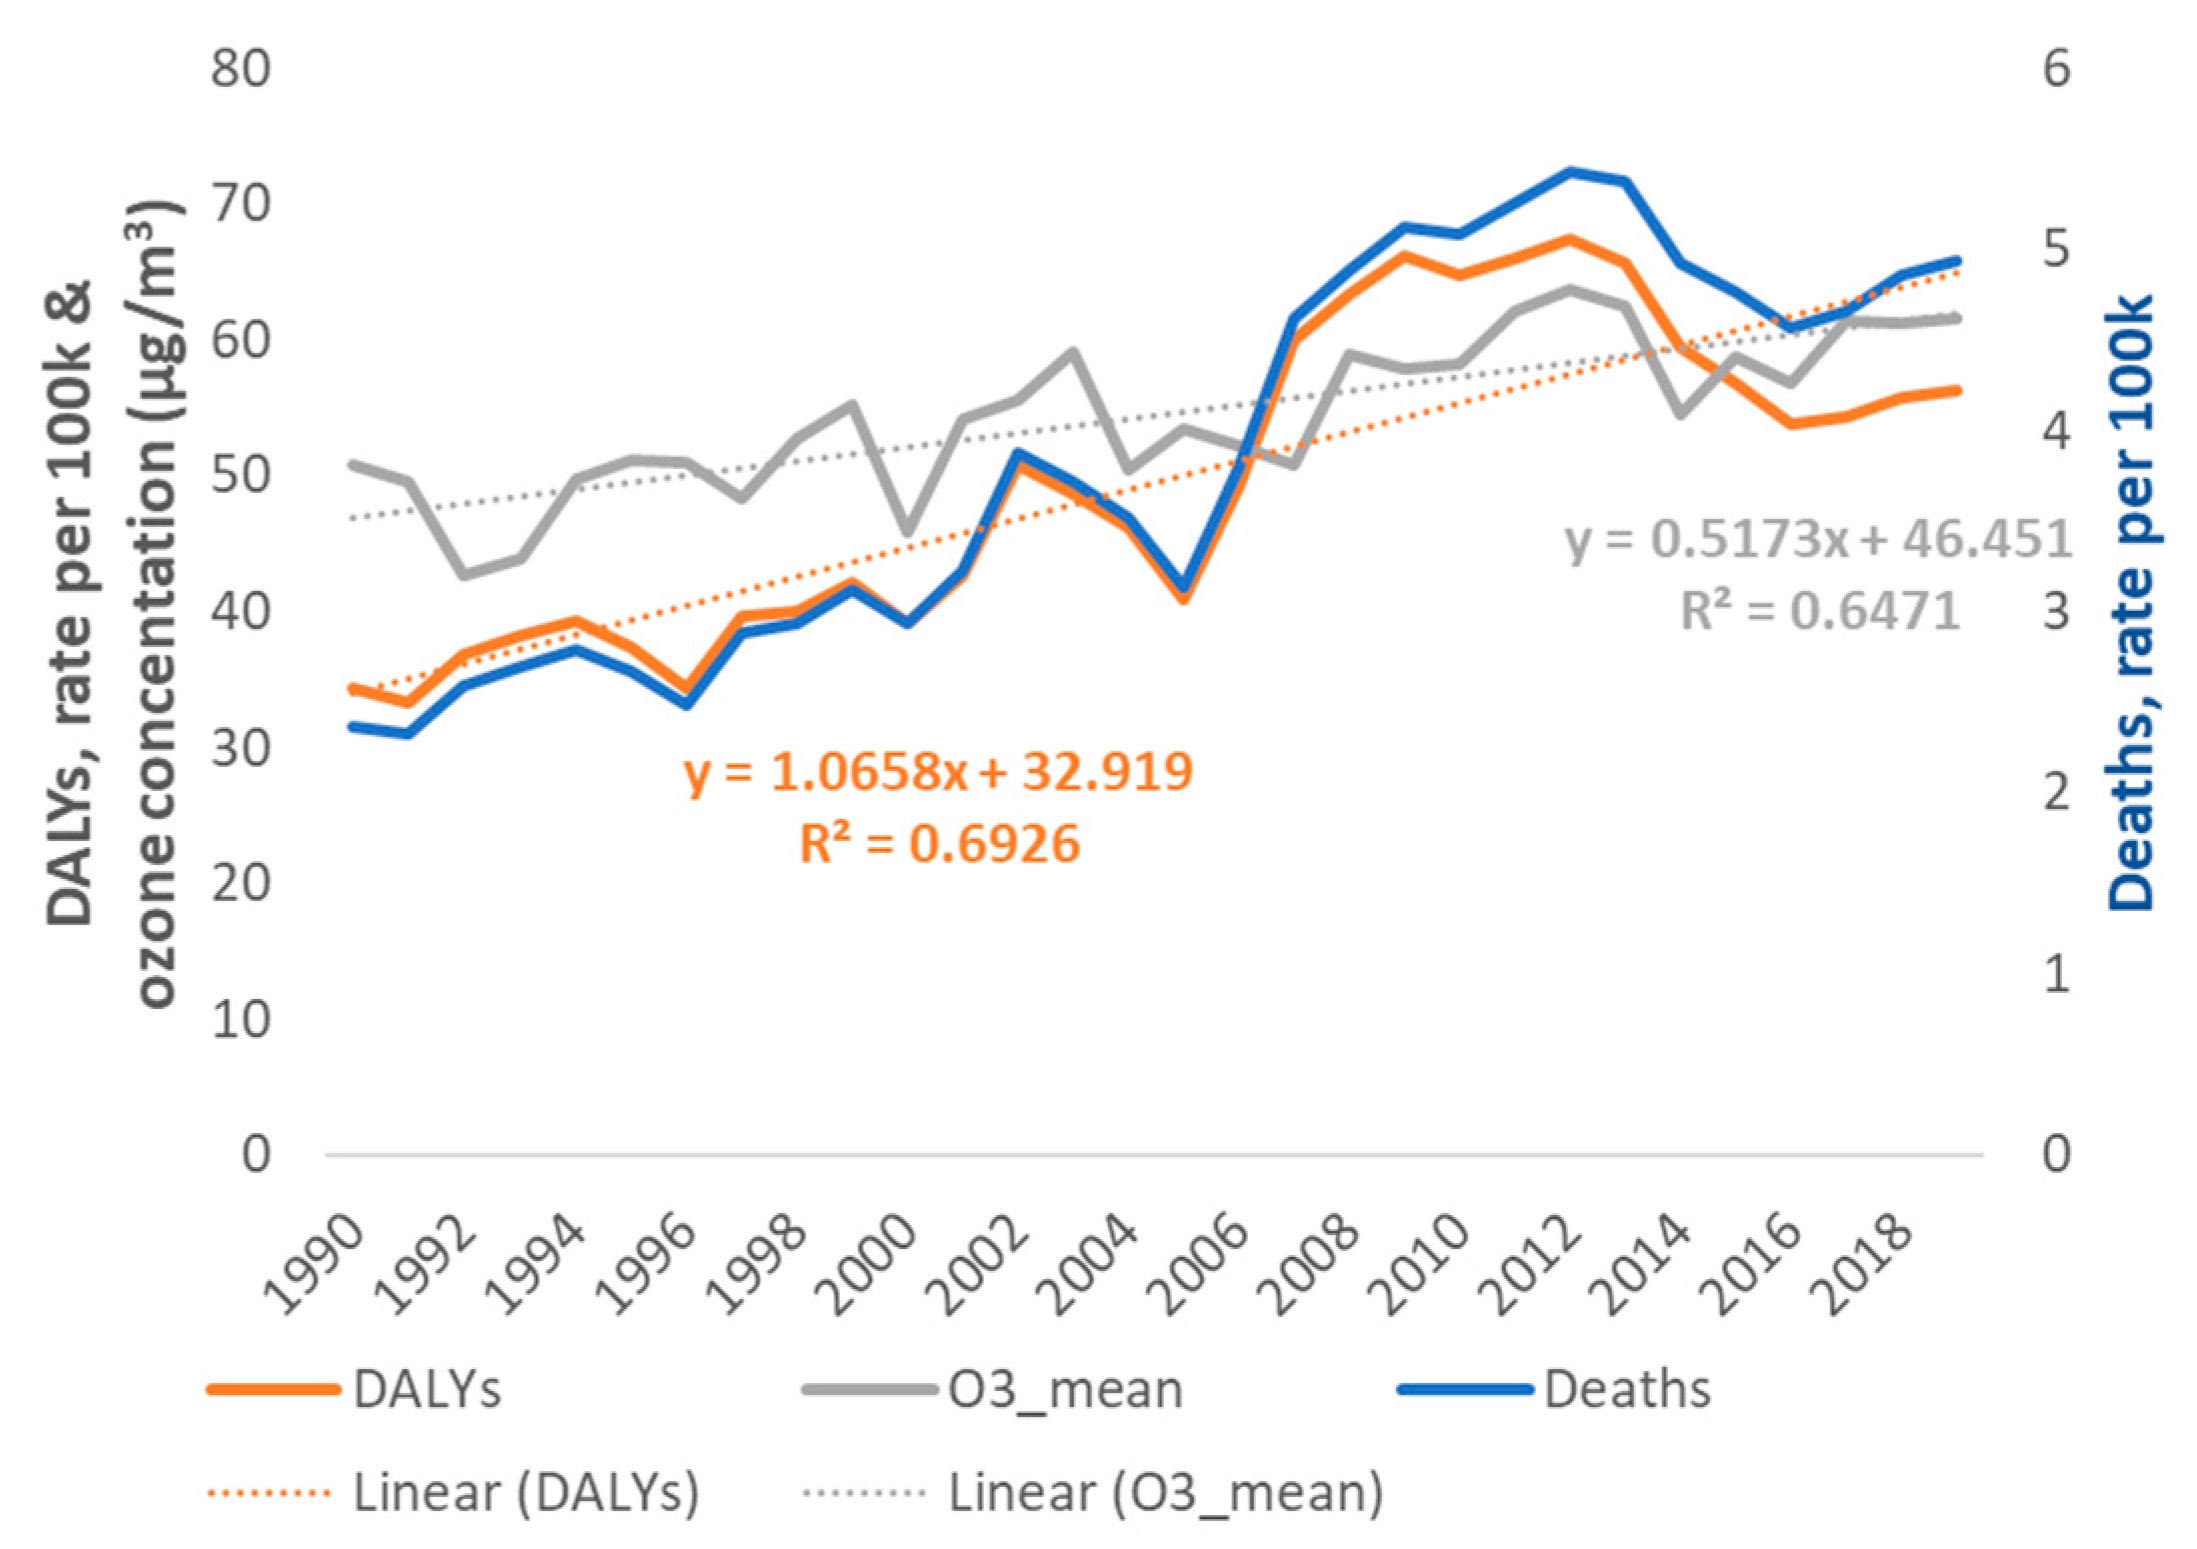
4.2. Mortality and DALYs Due to O3: An Analysis from the Global Burden of Disease Study 2019
4.3. Socioeconomic Conditions in Greece during the Period 1990–2019
5. Conclusions
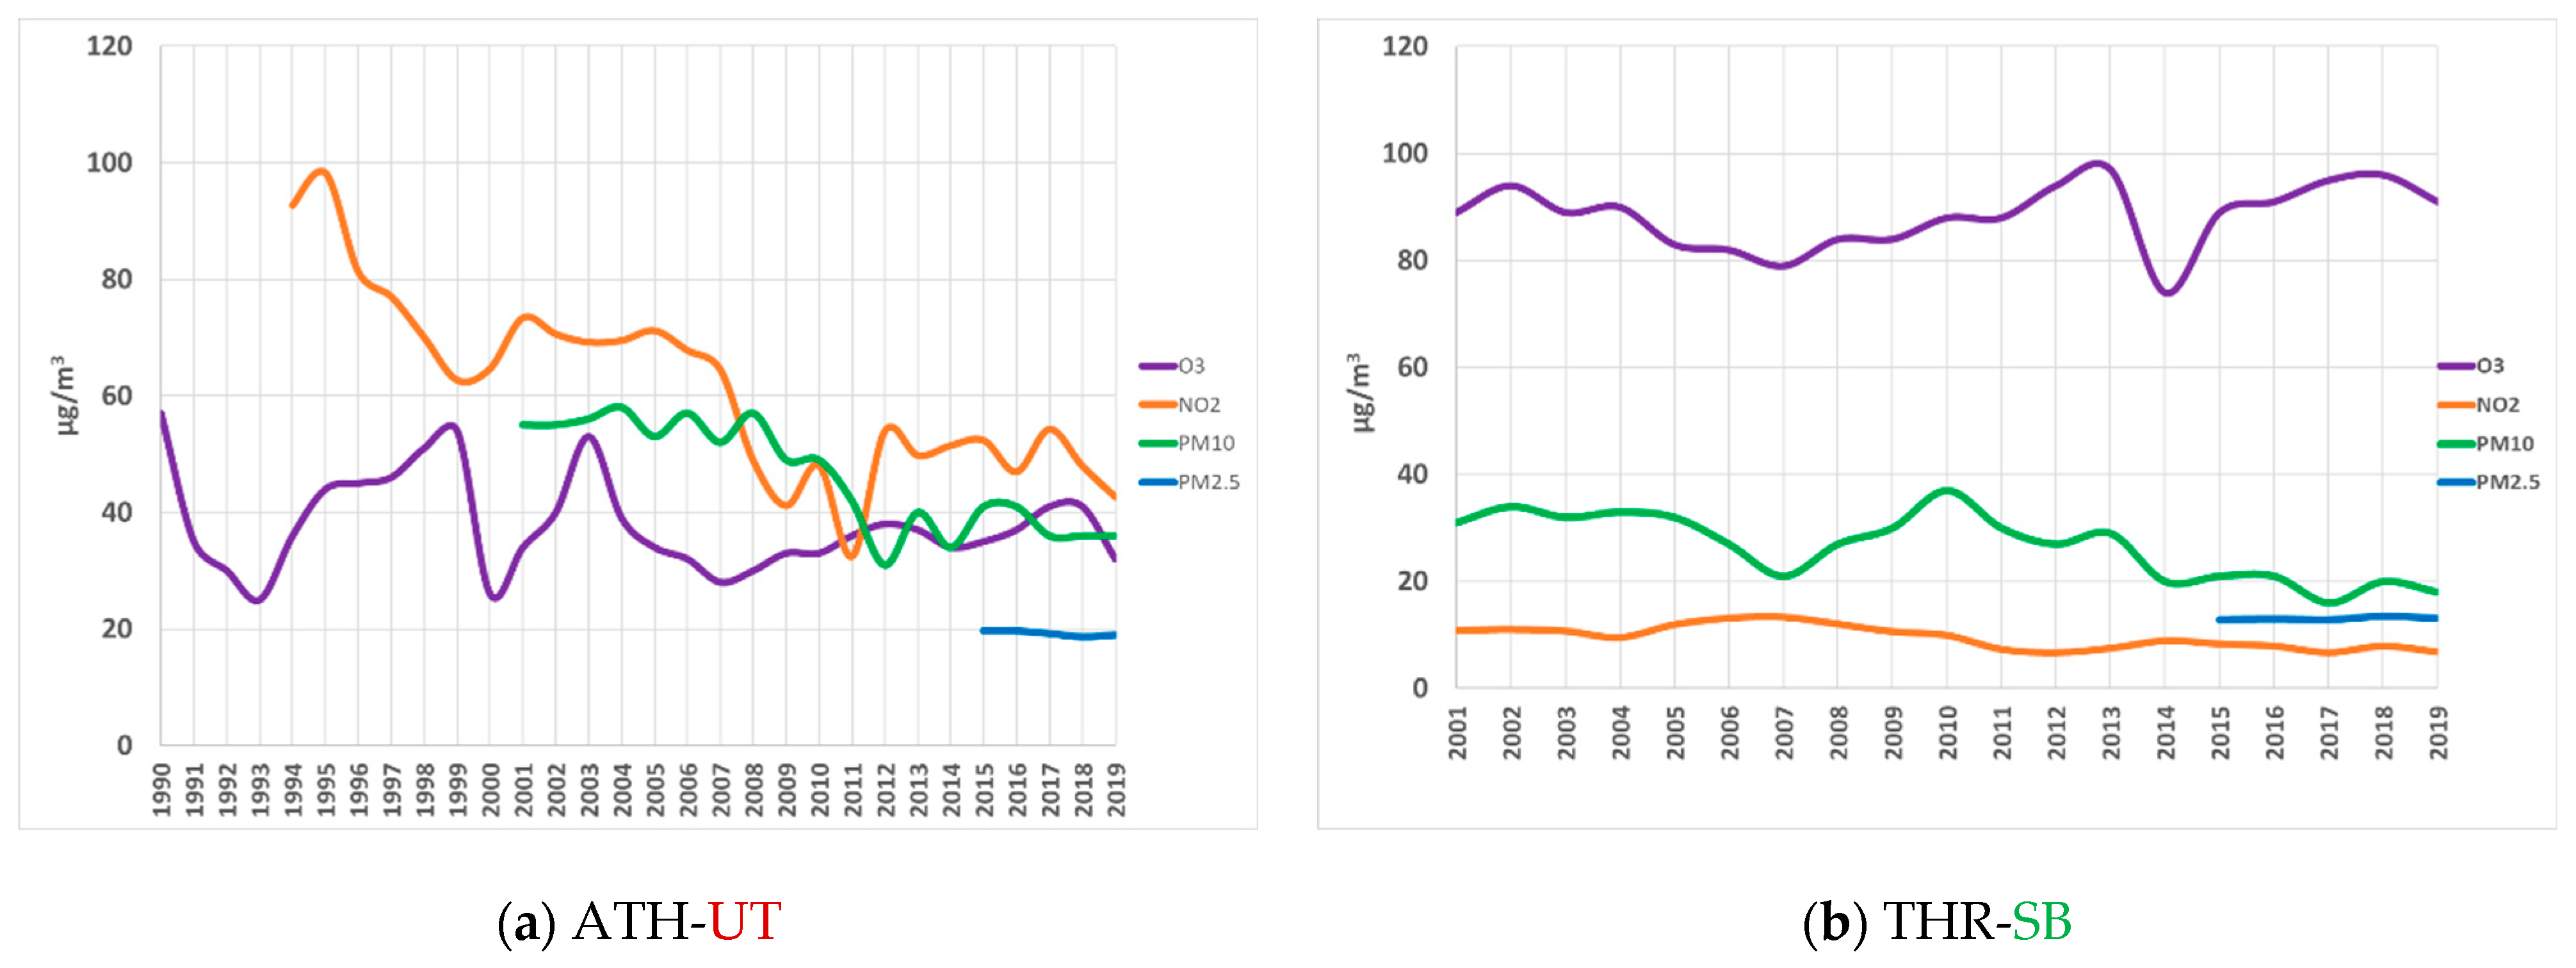
- O3 monthly concentrations exhibit seasonality at all stations with highest values to be recorded during summer when photochemical cloud episodes are frequent.
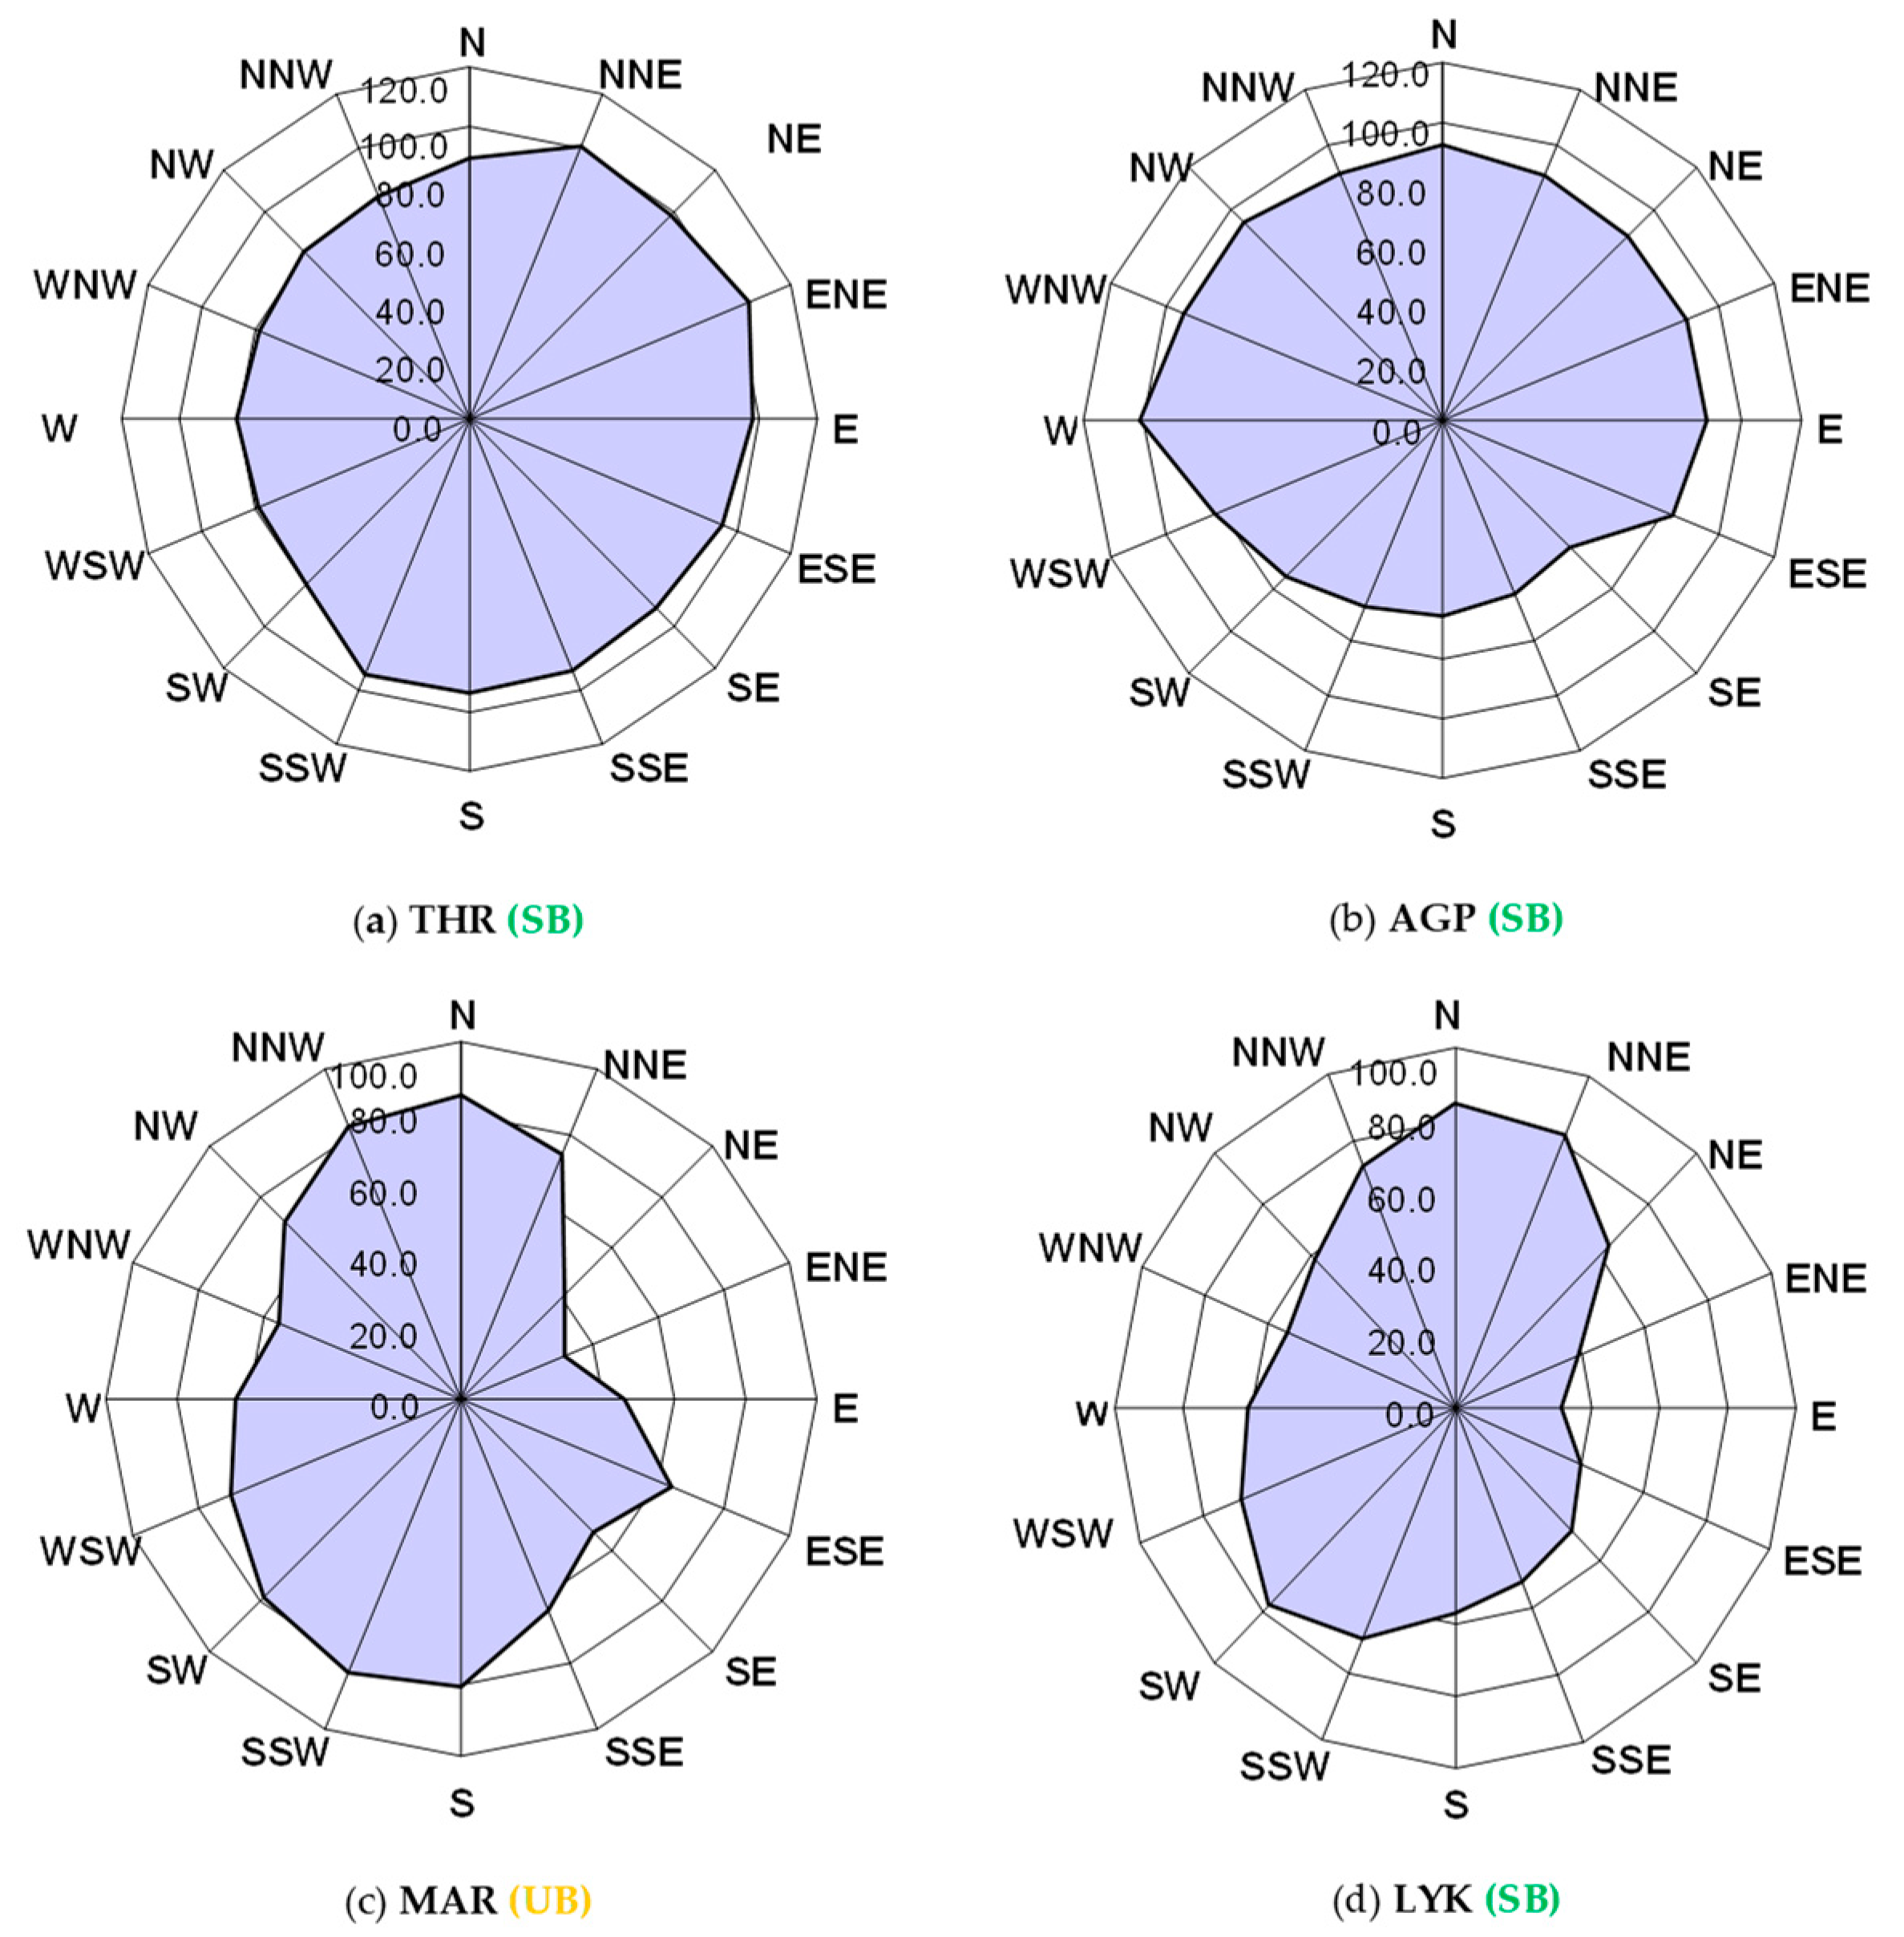
- The area’s topography and meteorological conditions, such as wind direction, speed, and intensity of sunshine, significantly affect the formation and dispersion of O3. So Higher monthly concentrations are shown at the suburban background concentrations (especially at Thrakomakedones).
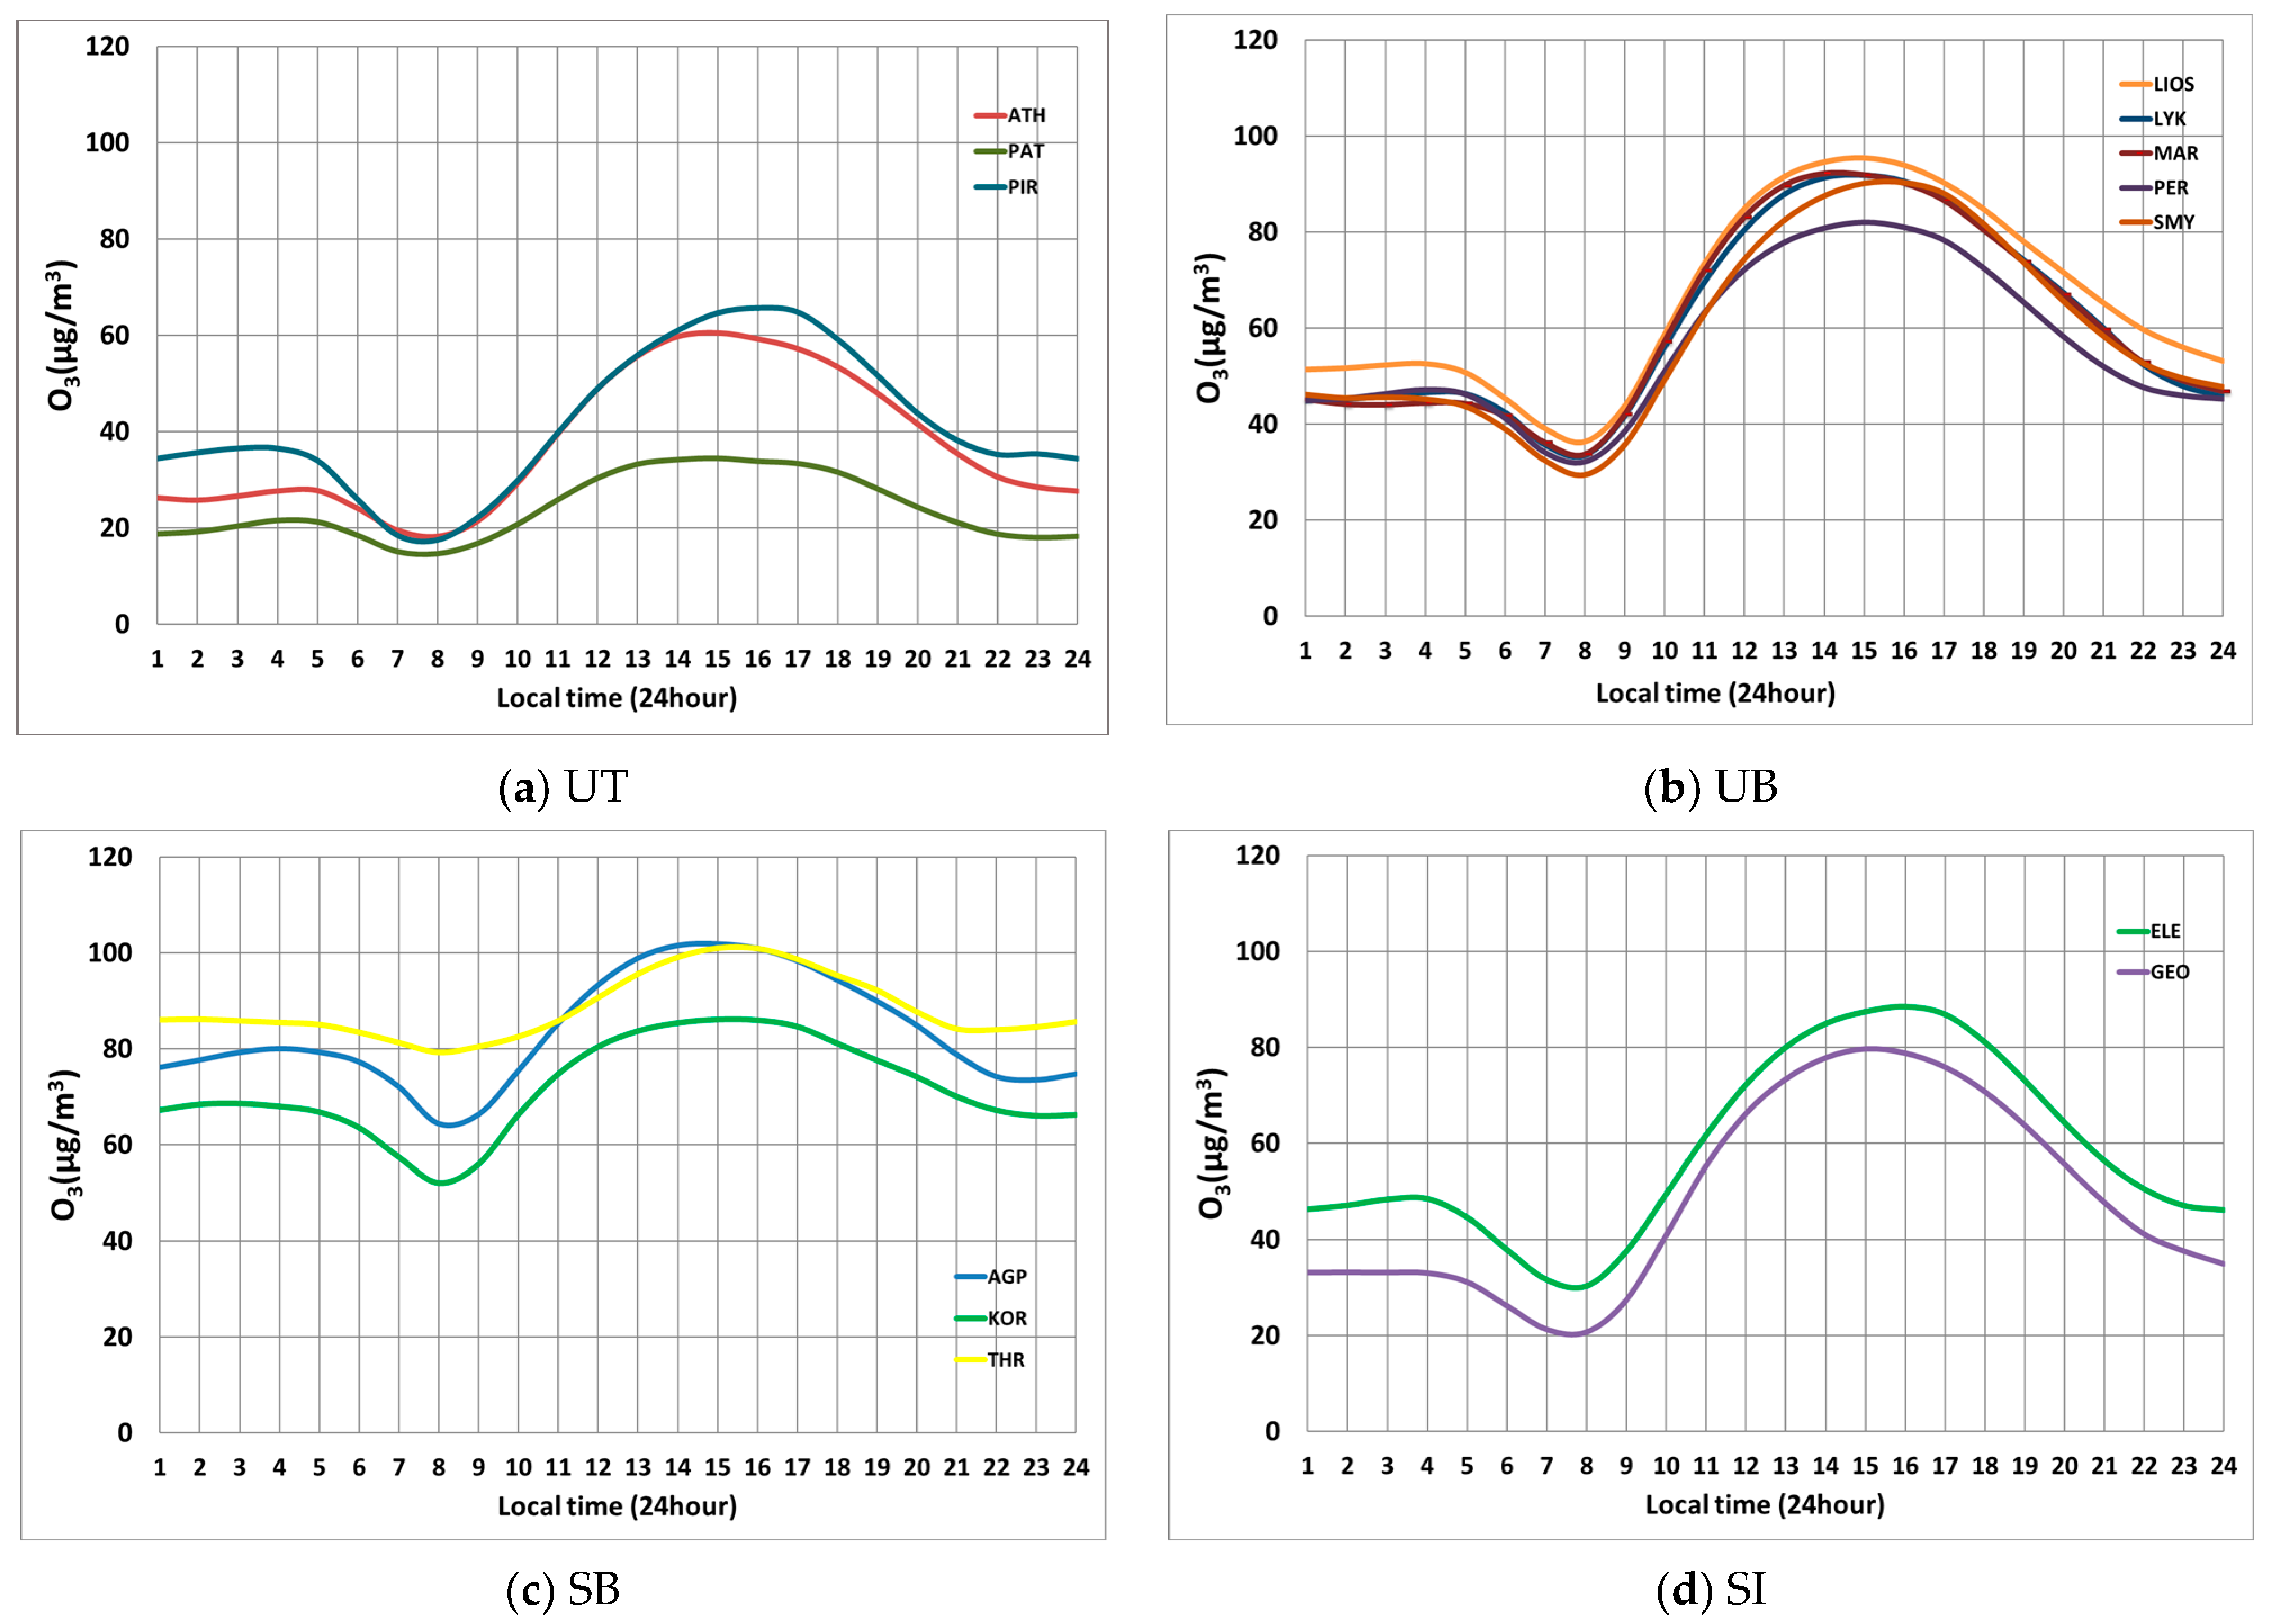
- A typical daily pattern appears with the lowest values early in the morning (at 08:00 LT). Since ground-level ozone is a secondary pollutant, its formation is highly related to sunlight and complex, anthropogenically influenced processes. Emissions of nitrogen oxides (NOx) and volatile organic compounds (VOCs) from human activities lead to the production of ozone, having a peak from 14:00 LT to 16:00 LT. The duration as well as the extent of the peaked concentrations differ from station to station. At the suburban background stations concentrations remain increased for a longer period, ranging from 60 μg/m3 to 100 μg/m3 for about 20 h while at the urban background stations the curve of peak values (above 60 μg/m3) lasts for about 10 h.
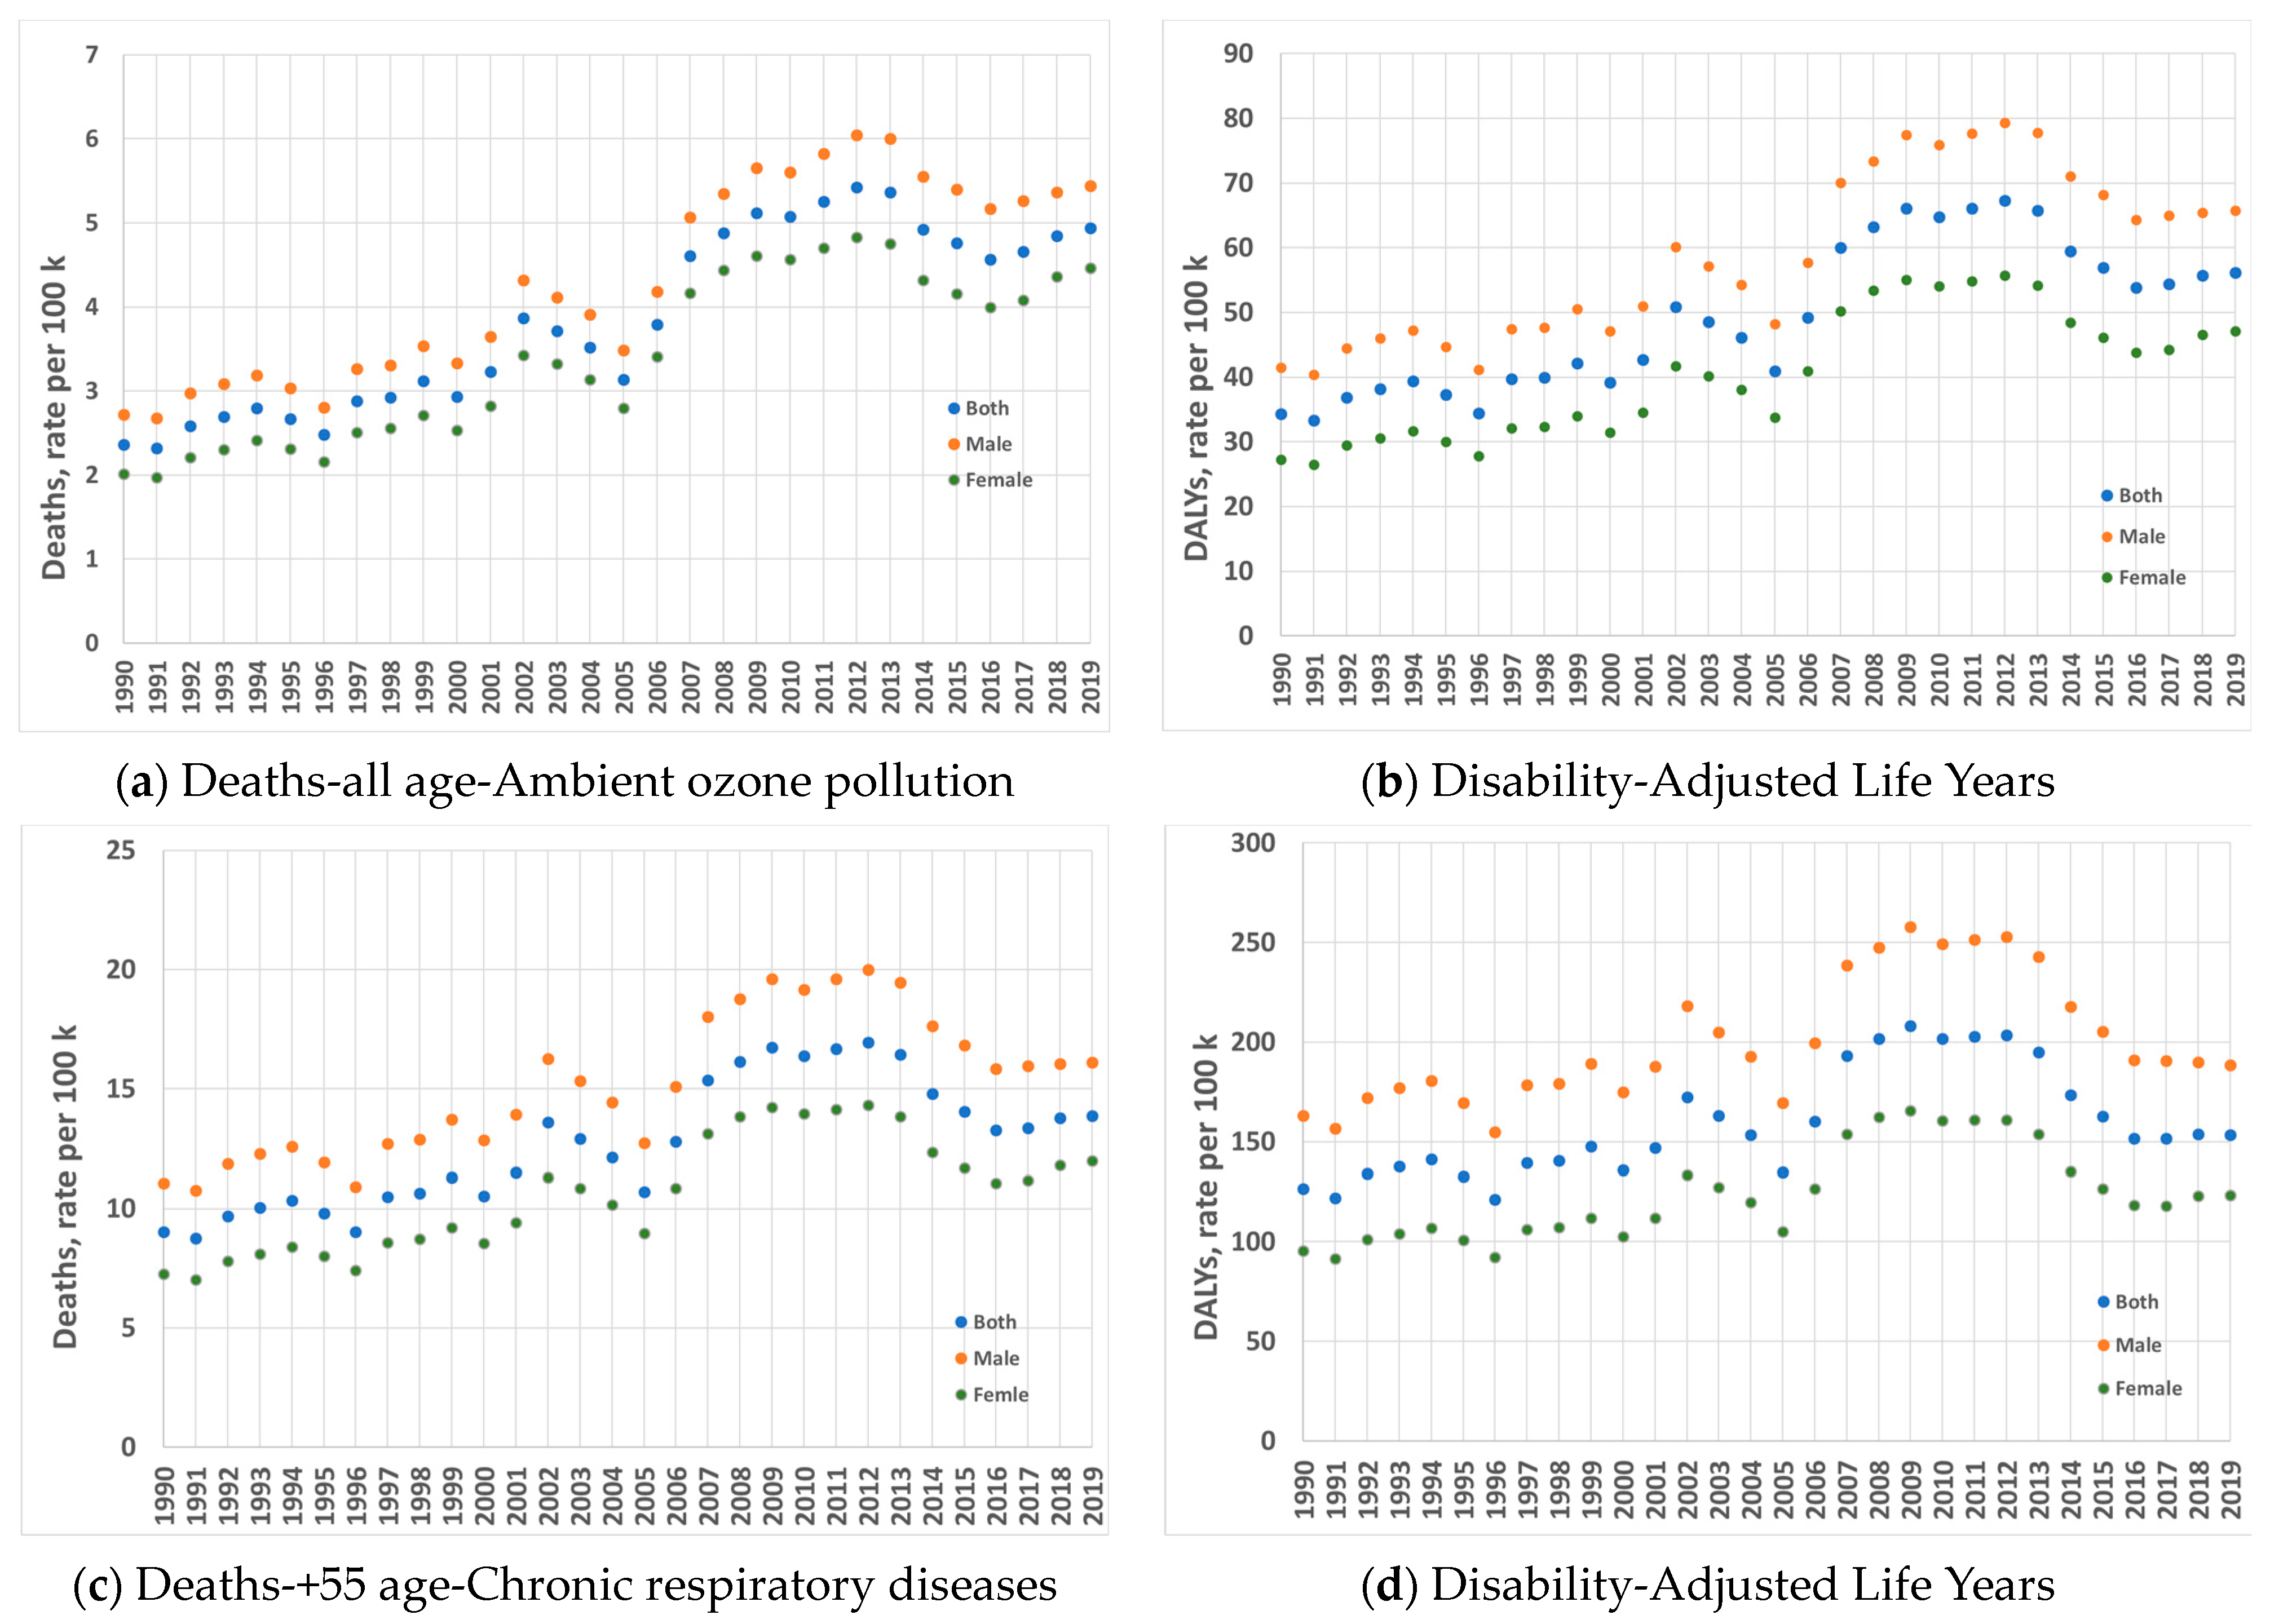
- Τhe impact of ozone on the lives of residents is significant, as it limits their daily activities and causes respiratory symptoms and coughing. People over 55 years old are mostly affected by poor air quality due to ozone exceedances. Concerning all age groups, the maximum number of DALYs is 80 per 100,000, while for the over-55 ages, the maximum number of DALYs is 251 per 100,000, which is much higher.
- The link between the economic crisis and the quality of health care is illustrated by studying the relation between deaths and DALYs, as well as the unemployment rates and GDP annual variation.
Supplementary Materials
Author Contributions
Funding
Data Availability Statement
Conflicts of Interest
References
- Murray, C.J.L. The Global Burden of Disease Study at 30 Years. Nat. Med. 2022, 28, 2019–2026. [Google Scholar] [CrossRef]
- Murray, C.J.L.; Aravkin, A.Y.; Zheng, P.; Abbafati, C.; Abbas, K.M.; Abbasi-Kangevari, M.; Abd-Allah, F.; Abdelalim, A.; Abdollahi, M.; Abdollahpour, I.; et al. Global Burden of 87 Risk Factors in 204 Countries and Territories, 1990–2019: A Systematic Analysis for the Global Burden of Disease Study 2019. Lancet 2020, 396, 1223–1249. [Google Scholar] [CrossRef]
- Conti, S.; Fornari, C.; Ferrara, P.; Antonazzo, I.C.; Madotto, F.; Traini, E.; Levi, M.; Cernigliaro, A.; Armocida, B.; Bragazzi, N.L.; et al. Time-Trends in Air Pollution Impact on Health in Italy, 1990–2019: An Analysis From the Global Burden of Disease Study 2019. Int. J. Public Health 2023, 68, 1605959. [Google Scholar] [CrossRef]
- World Health Organization, Regional Office for Europe. Review of Evidence on Health Aspects of Air Pollution; World Health Organization: Geneva, Switzerland, 2013. [Google Scholar]
- Amann, M. Health Risks of Ozone from Long-Range Transboundary Air Pollution; World Health Organization, Regional Office for Europe: Copenhagen, Denmark, 2008; ISBN 978-92-890-4290-1. [Google Scholar]
- World Health Organization. WHO Global Air Quality Guidelines: Particulate Matter (PM2.5 and PM10), Ozone, Nitrogen Dioxide, Sulfur Dioxide and Carbon Monoxide; World Health Organization: Geneva, Switzerland, 2021; ISBN 978-92-4-003422-8. [Google Scholar]
- Filippidou, E.C.; Koukouliata, A. Ozone Effects on the Respiratory System. Prog. Health Sci. 2011, 1, 144–155. [Google Scholar]
- Garcia, Y.; Randolph, L.M. Ozone & Health; CARB: Sacramento, CA, USA, 2022.
- Zhang, J.; Wei, Y.; Fang, Z. Ozone Pollution: A Major Health Hazard Worldwide. Front. Immunol. 2019, 10, 2518. [Google Scholar] [CrossRef]
- Institute for Health Metrics and Evaluation (IHME). GBD Results Tool: GBD 2019 Codebook and Data Guide. 2022. Available online: https://www.healthdata.org/research-analysis/gbd (accessed on 20 June 2023).
- Motairek, I.; Ajluni, S.; Khraishah, H.; AlAhmad, B.; Al-Dulaimi, S.; Abi Khalil, C.; Rajagopalan, S.; Al-Kindi, S. Burden of Cardiovascular Disease Attributable to Particulate Matter Pollution in the Eastern Mediterranean Region: Analysis of the 1990–2019 Global Burden of Disease. Eur. J. Prev. Cardiol. 2023, 30, 256–263. [Google Scholar] [CrossRef] [PubMed]
- Fallahzadeh, A.; Sharifnejad Tehrani, Y.; Sheikhy, A.; Ghamari, S.-H.; Mohammadi, E.; Saeedi Moghaddam, S.; Esfahani, Z.; Nasserinejad, M.; Shobeiri, P.; Rashidi, M.-M.; et al. The Burden of Chronic Respiratory Disease and Attributable Risk Factors in North Africa and Middle East: Findings from Global Burden of Disease Study (GBD) 2019. Respir. Res. 2022, 23, 268. [Google Scholar] [CrossRef] [PubMed]
- Kang, L.; Jing, W.; Liu, Q.; Liu, J.; Liu, M. The Trends of Mortality, Aetiologies and Risk Factors of Lower Respiratory Infections in China from 1990 to 2019: Findings from the Global Burden of Disease Study 2019. J. Infect. Public Health 2022, 15, 870–876. [Google Scholar] [CrossRef] [PubMed]
- Tyrovolas, S.; Kassebaum, N.J.; Stergachis, A.; Abraha, H.N.; Alla, F.; Androudi, S.; Car, M.; Chrepa, V.; Fullman, N.; Fürst, T.; et al. The Burden of Disease in Greece, Health Loss, Risk Factors, and Health Financing, 2000–2016: An Analysis of the Global Burden of Disease Study 2016. Lancet Public Health 2018, 3, e395–e406. [Google Scholar] [CrossRef]
- Hafeez, A.; Dangel, W.J.; Ostroff, S.M.; Kiani, A.G.; Glenn, S.D.; Abbas, J.; Afzal, M.S.; Afzal, S.; Ahmad, S.; Ahmed, A.; et al. The State of Health in Pakistan and Its Provinces and Territories, 1990–2019: A Systematic Analysis for the Global Burden of Disease Study 2019. Lancet Glob. Health 2023, 11, e229–e243. [Google Scholar] [CrossRef] [PubMed]
- Soriano, J.B.; Rojas-Rueda, D.; Alonso, J.; Antó, J.M.; Cardona, P.-J.; Fernández, E.; Garcia-Basteiro, A.L.; Benavides, F.G.; Glenn, S.D.; Krish, V.; et al. The Burden of Disease in Spain: Results from the Global Burden of Disease 2016. Med. Clín. (Engl. Ed.) 2018, 151, 171–190. [Google Scholar] [CrossRef]
- Tyrovolas, S.; El Bcheraoui, C.; Alghnam, S.A.; Alhabib, K.F.; Almadi, M.A.H.; Al-Raddadi, R.M.; Bedi, N.; El Tantawi, M.; Krish, V.S.; Memish, Z.A.; et al. The Burden of Disease in Saudi Arabia 1990–2017: Results from the Global Burden of Disease Study 2017. Lancet Planet. Health 2020, 4, e195–e208. [Google Scholar] [CrossRef]
- Schuster-Bruce, J.; Jani, C.; Goodall, R.; Kim, D.; Hughes, W.; Salciccioli, J.D.; Marshall, D.; Shalhoub, J. A Comparison of the Burden of Thyroid Cancer Among the European Union 15+ Countries, 1990–2019: Estimates From the Global Burden of Disease Study. JAMA Otolaryngol. Head Neck Surg. 2022, 148, 350. [Google Scholar] [CrossRef] [PubMed]
- Ziomas, I.C.; Tzoumaka, P.; Balis, D.; Melas, D.; Zerefos, C.S.; Klemm, O. Ozone Episodes in Athens, Greece. A Modelling Approach Using Data from the Medcaphot-Trace. Atmos. Environ. 1998, 32, 2313–2321. [Google Scholar] [CrossRef]
- Dimitriou, K.; Kassomenos, P. Three Year Study of Tropospheric Ozone with Back Trajectories at a Metropolitan and a Medium Scale Urban Area in Greece. Sci. Total Environ. 2015, 502, 493–501. [Google Scholar] [CrossRef]
- Kassomenos, P.; Papaloukas, C.; Petrakis, M.; Karakitsios, S. Assessment and Prediction of Short Term Hospital Admissions: The Case of Athens, Greece. Atmos. Environ. 2008, 42, 7078–7086. [Google Scholar] [CrossRef]
- Moustris, K.P.; Nastos, P.T.; Larissi, I.K.; Paliatsos, A.G. Application of Multiple Linear Regression Models and Artificial Neural Networks on the Surface Ozone Forecast in the Greater Athens Area, Greece. Adv. Meteorol. 2012, 2012, 894714. [Google Scholar] [CrossRef]
- Viras, L.G. Comparison of Ozone Levels between Working Days and Weekends in Athens, Greece. Environ. Monit. Assess. 2002, 80, 301–314. [Google Scholar] [CrossRef]
- Dimakopoulou, K.; Samoli, E.; Katsouyanni, K. Spatio-Temporal Land Use Regression Modelling of Ozone Levels in Athens, Greece. Glob. NEST J. 2020, 22, 85–94. [Google Scholar] [CrossRef]
- Mavrakis, A.; Flocas, H.A.; Mavromatidis, E.; Kallos, G.; Theoharatos, G.; Christides, A. A Case of Nighttime High Ozone Concentration over the Greater Athens Area. Meteorol. Z. 2010, 19, 35–45. [Google Scholar] [CrossRef]
- Paschalidou, A.K.; Kassomenos, P.A.; Bartzokas, A. A Comparative Study on Various Statistical Techniques Predicting Ozone Concentrations: Implications to Environmental Management. Environ. Monit. Assess. 2009, 148, 277–289. [Google Scholar] [CrossRef]
- Saitanis, C.; Karandinos, M.G.; Riga-Karandinos, A.N.; Lorenzini, G.; Vlassi, A. Photochemical Air Pollutant Levels and Ozonephytotoxicity in the Region of Mesogia—Attica, Greece. Int. J. Environ. Pollut. 2003, 19, 197. [Google Scholar] [CrossRef]
- Paschalidou, A.K.; Kassomenos, P.A. On the Evaluation of Box Model Results: The Case of BOXURB Model. Environ. Monit. Assess. 2009, 155, 103–118. [Google Scholar] [CrossRef] [PubMed]
- Poupkou, A.; Melas, D.; Ziomas, I.; Symeonidis, P.; Lisaridis, I.; Gerasopoulos, E.; Zerefos, C. Simulated Summertime Regional Ground-Level Ozone Concentrations over Greece. Water Air Soil Pollut. 2009, 196, 169–181. [Google Scholar] [CrossRef]
- Kassomenos, P.; Petrakis, M.; Sarigiannis, D.; Gotti, A.; Karakitsios, S. Identifying the Contribution of Physical and Chemical Stressors to the Daily Number of Hospital Admissions Implementing an Artificial Neural Network Model. Air Qual. Atmos. Health 2011, 4, 263–272. [Google Scholar] [CrossRef]
- Dimitriou, K.; Liakakou, E.; Lianou, M.; Psiloglou, B.; Kassomenos, P.; Mihalopoulos, N.; Gerasopoulos, E. Implementation of an Aggregate Index to Elucidate the Influence of Atmospheric Synoptic Conditions on Air Quality in Athens, Greece. Air Qual. Atmos. Health 2020, 13, 447–458. [Google Scholar] [CrossRef]
- Mavroidis, I.; Ilia, M. Trends of NOx, NO2 and O3 Concentrations at Three Different Types of Air Quality Monitoring Stations in Athens, Greece. Atmos. Environ. 2012, 63, 135–147. [Google Scholar] [CrossRef]
- Stergiopoulou, A.; Katavoutas, G.; Samoli, E.; Dimakopoulou, K.; Papageorgiou, I.; Karagianni, P.; Flocas, H.; Katsouyanni, K. Assessing the Associations of Daily Respiratory Symptoms and Lung Function in Schoolchildren Using an Air Quality Index for Ozone: Results from the RESPOZE Panel Study in Athens, Greece. Sci. Total Environ. 2018, 633, 492–499. [Google Scholar] [CrossRef] [PubMed]
- Butković, V.; Cvitaš, T.; Klasinc, L. Photochemical Ozone in the Mediterranean. Sci. Total Environ. 1990, 99, 145–151. [Google Scholar] [CrossRef]
- Varotsos, C.; Ya Kondratyev, K.; Efstathiou, M. On the Seasonal Variation of the Surface Ozone in Athens, Greece. Atmos. Environ. 2001, 35, 315–320. [Google Scholar] [CrossRef]
- Melas, D.; Kioustioukis, I.; Lazaridis, M. The Impact of Sea Breeze on Air Quality in Athens Area. In Advances in Air Pollution Modeling for Environmental Security; Faragó, I., Georgiev, K., Havasi, Á., Eds.; NATO Science Series; Springer: Berlin/Heidelberg, Germany, 2005; Volume 54, pp. 285–295. ISBN 978-1-4020-3349-0. [Google Scholar]
- HMEE Hellenic Ministry of Environment and Energy. Available online: https://ypen.gov.gr/ (accessed on 30 April 2021).
- Ntourou, K.; Fameli, K.-M.; Moustris, K.; Augoustinos, A.; Tsitsis, C. The Influence of Ozone Concentrations on Public Health over the Greater Athens Area, Greece. Environ. Sci. Proc. 2023, 26, 107. [Google Scholar]
- Lionello, P. (Ed.) The Climate of the Mediterranean Region: From the Past to the Future, 1st ed.; Elsevier Insights; Elsevier: London, UK; Waltham, MA, USA, 2012; ISBN 978-0-12-416042-2. [Google Scholar]
- Trianti, S.-M.; Samoli, E.; Rodopoulou, S.; Katsouyanni, K.; Papiris, S.A.; Karakatsani, A. Desert Dust Outbreaks and Respiratory Morbidity in Athens, Greece. Environ. Health 2017, 16, 72. [Google Scholar] [CrossRef] [PubMed]
- Samoli, E.; Nastos, P.T.; Paliatsos, A.G.; Katsouyanni, K.; Priftis, K.N. Acute Effects of Air Pollution on Pediatric Asthma Exacerbation: Evidence of Association and Effect Modification. Environ. Res. 2011, 111, 418–424. [Google Scholar] [CrossRef] [PubMed]
- Vinci, S.; Vardopoulos, I.; Salvati, L. A Tale of a Shrinking City? Exploring the Complex Interplay of Socio-Demographic Dynamics in the Recent Development of Attica, Greece. Cities 2023, 132, 104089. [Google Scholar] [CrossRef]
- HSA Hellenic Statistical Authority. Available online: https://www.statistics.gr/en/home/ (accessed on 20 June 2021).
- Ntourou, K.; Moustris, K.; Spyropoulos, G.; Fameli, K.-M.; Manousakis, N. Adverse Health Effects (Bronchitis Cases) Due to Particulate Matter Exposure: A Twenty-Year Scenario Analysis for the Greater Athens Area (Greece) Using the AirQ+ Model. Atmosphere 2023, 14, 389. [Google Scholar] [CrossRef]
- Chorianopoulos, I.; Pagonis, T.; Koukoulas, S.; Drymoniti, S. Planning, Competitiveness and Sprawl in the Mediterranean City: The Case of Athens. Cities 2010, 27, 249–259. [Google Scholar] [CrossRef]
- EUR-Lex. Directive 2008/50/EC of the European Parliament and of the Council of 21 May 2008 on Ambient Air Quality and Cleaner Air for Europe. Available online: https://eur-lex.europa.eu/eli/dir/2008/50/oj (accessed on 20 June 2023).
- Wilkinson, S.; Mills, G.; Illidge, R.; Davies, W.J. How Is Ozone Pollution Reducing Our Food Supply? J. Exp. Bot. 2012, 63, 527–536. [Google Scholar] [CrossRef]
- Panopoulou, A.; Liakakou, E.; Gros, V.; Sauvage, S.; Locoge, N.; Bonsang, B.; Psiloglou, B.E.; Gerasopoulos, E.; Mihalopoulos, N. Non-Methane Hydrocarbon Variability in Athens during Wintertime: The Role of Traffic and Heating. Atmos. Chem. Phys. 2018, 18, 16139–16154. [Google Scholar] [CrossRef]
- Paraskevopoulou, D.; Liakakou, E.; Gerasopoulos, E.; Mihalopoulos, N. Sources of Atmospheric Aerosol from Long-Term Measurements (5 Years) of Chemical Composition in Athens, Greece. Sci. Total Environ. 2015, 527–528, 165–178. [Google Scholar] [CrossRef] [PubMed]
- Kaltsonoudis, C.; Kostenidou, E.; Florou, K.; Psichoudaki, M.; Pandis, S.N. Temporal Variability and Sources of VOCs in Urban Areas of the Eastern Mediterranean. Atmos. Chem. Phys. 2016, 16, 14825–14842. [Google Scholar] [CrossRef]
- Dandou, A.; Tombrou, M.; Soulakellis, N. The Influence of the City of Athens on the Evolution of the Sea-Breeze Front. Bound.-Layer Meteorol. 2009, 131, 35–51. [Google Scholar] [CrossRef]
- Meteo Weather Forecast for Greece. Available online: http://www.meteo.gr/ (accessed on 21 September 2022).
- Benmarhnia, T.; Zunzunegui, M.-V.; Llácer, A.; Béland, F. Impact of the Economic Crisis on the Health of Older Persons in Spain: Research Clues Based on an Analysis of Mortality. SESPAS Report 2014. Gac. Sanit. 2014, 28, 137–141. [Google Scholar] [CrossRef]
- Laliotis, I.; Ioannidis, J.P.A.; Stavropoulou, C. Total and Cause-Specific Mortality before and after the Onset of the Greek Economic Crisis: An Interrupted Time-Series Analysis. Lancet Public Health 2016, 1, e56–e65. [Google Scholar] [CrossRef] [PubMed]
- The Lancet Public Health Greece—The Cost of Recovery. Lancet Public Health 2018, 3, e351. [CrossRef] [PubMed]
- Greece—Air Pollution Country Fact Sheet—European Environment Agency. Available online: https://www.eea.europa.eu/themes/air/country-fact-sheets/2021-country-fact-sheets/greece (accessed on 23 September 2022).


| Paper-References | Data Source | O3 * (μg/m3) | Time Period of Study | |
|---|---|---|---|---|
| 1. | Butkovi et al. (1990) [34] | D-B | 58–120 | 1984 |
| 2. | Ziomas et al. (1998) [19] | M-T | 100 | 1994 |
| 3. | Varotsos et al. (2001) [35] | NAO | 55–94 | 1901–1940/ 1987–1998 |
| 4. | Viras (2002) [23] | HMEEC | 55–79 | 1995–1999 |
| 5. | Saitanis et al. (2003) [27] | AIA, HMEEC | 147 | 2000 |
| 6. | Kassomenos et al. (2008) [21] | HMEEC | 103 | 1992–2000 |
| 7. | Paschalidou et al. (2008) [26] | HMEEC | 40–100 | 2001–2004 |
| 8. | Mavrakis et al. (2009) [25] | HMEE, GERPPE | 90–100 | 2003 |
| 9. | Paschalidou et al. (2009) [28] | NOA, HMEEC | 100 | 1994–2004 |
| 10. | Poupkou et al. (2009) [29] | UAM-V, HMEEC | 120 | 2000 |
| 11. | Kassomenos et al. (2011) [30] | HMEEC | 103 | 1992–2000 |
| 12. | Moustis et al. (2012) [22] | HMEEC | 89–105 | 2001–2005 |
| 13. | Mavroidis et al. (2012) [32] | HMEEC | 78–100 | 1984–2009 |
| 14. | Dimitriou et al. (2015) [20] | EEA, NAO | 87 | 2009–2011 |
| 15. | Stergiopoulou et al. (2018) [33] | HMEEC | 57–83 | 2013–2014 |
| 15. | Dimakopoulou et al. (2020) [24] | HMEEC | 83–94 | 2001–2014 |
| 16. | Dimitriou et al. (2020) [31] | NOA, HMEEC | 63–65 | 2014–2018 |
| Name | Abbr. | Site Type | Longitude | Latitude | Altitude (m) | Population | |
|---|---|---|---|---|---|---|---|
| 1 | ATHINAS | ATH | UT | 23.726845 | 37.978204 | 75 | 664,000 |
| 2 | GEOPONIKI | GEO | SI | 23.705153 | 37.984100 | 40 | 664,000 |
| 3 | LYKOVRISI | LYK | SB | 23.788986 | 38.067793 | 234 | 10,000 |
| 4 | MAROUSI | MAR | UB | 23.787372 | 38.030837 | 170 | 73,000 |
| 5 | NEA SMYRNI | SMY | UB | 23.713020 | 37.931998 | 50 | 72,853 |
| 6 | PATISSION | PAT | UT | 23.733053 | 37.999587 | 105 | 664,000 |
| 7 | PIREAS | PIR | UT | 23.645230 | 37.944656 | 4 | 163,688 |
| 8 | PERISTERI | PER | UB | 23.688361 | 38.020811 | 80 | 133,630 |
| 9 | AGIA PARASKEYI | AGP | SB | 23.819421 | 37.995110 | 290 | 62,147 |
| 10 | LIOSIA | LIOS | SB | 23.697781 | 38.076741 | 165 | 33,565 |
| 11 | THRAKOMAKEDONES | THR | SB | 23.758195 | 38.143521 | 550 | 6200 |
| 12 | ELEYSINA | ELE | SI | 23.538432 | 38.051322 | 20 | 24,910 |
| 13 | KOROPI | KOR | SB | 23.879026 | 37.901308 | 140 | 19,164 |
Disclaimer/Publisher’s Note: The statements, opinions and data contained in all publications are solely those of the individual author(s) and contributor(s) and not of MDPI and/or the editor(s). MDPI and/or the editor(s) disclaim responsibility for any injury to people or property resulting from any ideas, methods, instructions or products referred to in the content. |
© 2024 by the authors. Licensee MDPI, Basel, Switzerland. This article is an open access article distributed under the terms and conditions of the Creative Commons Attribution (CC BY) license (https://creativecommons.org/licenses/by/4.0/).
Share and Cite
Ntourou, K.; Fameli, K.-M.; Moustris, K.; Manousakis, N.; Tsitsis, C. Trends of the Global Burden of Disease Linked to Ground-Level Ozone Pollution: A 30-Year Analysis for the Greater Athens Area, Greece. Atmosphere 2024, 15, 380. https://doi.org/10.3390/atmos15030380
Ntourou K, Fameli K-M, Moustris K, Manousakis N, Tsitsis C. Trends of the Global Burden of Disease Linked to Ground-Level Ozone Pollution: A 30-Year Analysis for the Greater Athens Area, Greece. Atmosphere. 2024; 15(3):380. https://doi.org/10.3390/atmos15030380
Chicago/Turabian StyleNtourou, Kleopatra, Kyriaki-Maria Fameli, Konstantinos Moustris, Nikolaos Manousakis, and Christos Tsitsis. 2024. "Trends of the Global Burden of Disease Linked to Ground-Level Ozone Pollution: A 30-Year Analysis for the Greater Athens Area, Greece" Atmosphere 15, no. 3: 380. https://doi.org/10.3390/atmos15030380