
Impacts of Climate Change on Runoff in the Heihe River Basin, China
by
Qin Liu
1,2,
Peng Cheng
2,
Meixia Lyu
2,
Xinyang Yan
2,*,
Qingping Xiao
3,
Xiaoqin Li
2,
Lei Wang
4 and
Lili Bao
2 1
College of Earth and Environmental Sciences, Lanzhou University, Lanzhou 730000, China
2
Meteorological Service Center of Gansu Province, Lanzhou 730020, China
3
Gongnongqu Electric Pumping Station, Lanzhou 730020, China
4
CMA Earth System Modeling and Prediction Centre, Beijing 100081, China
*
Author to whom correspondence should be addressed.
Atmosphere 2024, 15(5), 516; https://doi.org/10.3390/atmos15050516
Submission received: 11 March 2024
/
Revised: 28 March 2024
/
Accepted: 19 April 2024
/
Published: 23 April 2024
(This article belongs to the Section Climatology)
Abstract
:Located in the central part of the arid regions of Northwest China, the Heihe River Basin (HRB) plays an important role in wind prevention, sand fixation, and soil and water conservation as the second largest inland river basin. In the context of the warming and wetting climate observed in Northwest China, the situation of the ecological environment in the HRB is of significant concern. Using the data from meteorological observation stations, grid fusion and hydrological monitoring, this study analyzes the multi-scale climate changes in the HRB and their impacts on runoff. In addition, predictive models for runoff in the upper and middle reaches were developed using machine learning methods. The results indicate that the climate in the HRB has experienced an overall warming and wetting trend over the past 60 years. At the same time, there are clear regional variabilities in the climate changes. Precipitation shows decreasing trends in the northwestern part of the HRB, while it shows increases at rates higher than the regional average in the southeastern part. Moreover, the temperature increases are generally smaller in the upper reaches than those in the middle and lower reaches. Over the past 60 years, there has been a remarkable increase in runoff at the Yingluo Gorge (YL) hydrological station, which exhibits a distinct “single-peak” pattern in the variation of monthly runoff. The annual runoff volume at the YL (ZY) hydrological station is significantly correlated with the precipitation in the upper (middle) reaches, indicating the precipitation is the primary influencing factor determining the annual runoff. Temperature has a significant impact only on the runoff in the upper reaches, while its impact is not significant in the middle reaches. The models trained by the support vector machines and random forest models perform best in predicting the annual runoff and monthly runoff, respectively. This study can provide a scientific basis for environmental protection and sustainable development in the HRB.
1. Introduction
In recent years, the climate has experienced a warming and wetting trend in the arid regions of Northwest China, which has now become a focus of widespread concern [1,2,3,4]. Research has indicated that the precipitation increase in the arid regions of Northwest China has become significant, exceeding the threshold of 30 mm [5], and its impacts on watersheds and ecosystems are also becoming apparent [6]. Despite these changes, the fragile ecological environment of this region continues to face substantial challenges [7]. fWith rising temperatures, intensified evaporation, and an uneven distribution of increased precipitation, numerous inland river basins in the arid regions of Northwest China have become vital lifelines for improving the local ecological environment. The protection and optimal utilization of these water resources have become critical issues for the local governments.
However, in recent decades, numerous inland river basins in the arid regions of Northwest China have been confronted with a common challenge. The rapid increases in population and economic development in the upper reaches of these basins have led to a sharp rise in water consumption and thus to a substantial reduction in water resources [8]. Therefore, in the arid regions of Northwest China, where the ecological environment is extremely fragile and highly sensitive to climate change, studying the characteristics of climate change within the river basins and implementing integrated water resources management is crucial for the sustainable development of the regional socio-economy.
Located in the central part of the arid regions of Northwest China, the Heihe River Basin (HRB) plays an important role in water conservation, wind prevention, sand fixation, and soil and water conservation, as it is China’s second-largest inland river basin [9,10]. However, over the past few decades, influenced by climate change and intensified human activities, the basin has faced critical issues such as the desiccation of terminal lakes, decline in groundwater levels, and extensive land desertification, leading to profound impacts on local socio-economic development [11]. Therefore, in the context of the warming and wetting climate in the arid regions of Northwest China, it is undoubtedly of great scientific importance and practical relevance to further investigate climate change in the HRB and its impact on runoff.
Scholars from around the world have conducted research on runoff variations in the HRB and associated climatic impact factors and have made a variety of important findings [12]. However, previous studies have either focused on exploring the changes of basin water resources from a hydrological perspective [13], without considering the influence of climatic conditions, or assessed only the ecological, hydrological, or climatic conditions in the upper or middle reaches of the basin [14,15], lacking in-depth exploration of the combined climatic and hydrological aspects of the whole basin. Moreover, these studies are outdated and fail to utilize up-to-date data. On the other hand, some scholars have also developed runoff forecasting models using traditional statistical methods [16], but these models have limited precision and do not incorporate artificial intelligence methods.
Based on the meteorological observation-station data, gridded fusion data, and hydrological-monitoring data, this study analyzes the trends in variation in climatic factors such as temperature, precipitation, potential evapotranspiration (PET), and runoff in the HRB since 1960 and investigates the characteristics of climate change in the HRB and their impacts on runoff. Furthermore, we develop a forecasting model for runoff in the upper reaches using machine learning algorithms, aiming to provide a scientific basis for ecological environmental protection and regional sustainable development in the HRB.
2. Materials and Methods
2.1. Study Region
The HRB is mostly located in the provinces of Qinghai, Gansu, and Inner Mongolia, with a small part extending into Mongolia. The methods of boundary delimitation of this region are not unified. Among the five methods offered by National Cryosphere Desert Data Center of China (NCDDC), the fifth, which is also the latest one, is used in this study. The boundaries of the HRB were determined based on a high-precision digital elevation model and the hydrological analysis methods in the Geographic Information System and then validated using remote-sensing data and field surveys. The current status of water-resource utilization is also taken into account in the process of determining basin boundaries and sub-basin delimitation [17]. In a difference from with the traditional HRB, the region determined by the new method also includes the Badain Jaran Desert, Guaizi Lake, the northern Mazong Mountain, and the southern foothills of the Gobi Altai Mountains in Outer Mongolia (Figure 1).
The surface catchment area of the HRB covers roughly 255,000 km², with a main stream extending over approximately 821 km [18], and is segmented into the upper runoff-producing area, middle water-consumption area, and lower disappearing area of terminal rivers and lakes. The upper runoff-producing area extends from the Qilian Mountain to the Yingluo Gorge (YL) and is characterized by mountainous terrains and a sparse population. Most of the runoff in the Heihe River and its tributaries comes from rainfall, snowmelt, and thawing permafrost in this area. The middle water-consumption area is located between the YL and the Zhengyi Gorge (ZY) and is predominantly composed of oases with frequent human activity. This area serves as the major commodity grain base in the Hexi Corridor of China and is an important area of consumption of water resources. The lower disappearing area of terminal rivers and lakes consists of an extensive desert area where significant reduction or disappearance of runoff occurs due to high evaporation rates and river leakage.
2.2. Data
For this study, 16 representative meteorological observation stations in the HRB (Figure 1) were selected, including Tule, Yeniu Gully, Jiuquan, Zhangye, etc. (Table 1), with geographic information provided by NCDDC (http://www.ncdc.ac.cn, accessed on 23 January 2024). The monthly temperature and precipitation records from the 63 years from 1960–2022 from the 16 meteorological stations were obtained from the National Climate Center of China Meteorological Administration and have undergone rigorous quality-control procedures. The YL and ZY hydrological stations serve as delimitation points for the upper, middle and lower reaches of the main stream of the Heihe River. The data from the two stations have strong representativeness for the runoff in the upper runoff-producing area and the middle water-consumption area, respectively. The runoff data series from the YL hydrological station spans from 1960 to 2019, and that from the ZY hydrological station spans from 1960 to 2020.
The grid data used in this paper are from the high-resolution monthly gridded datasets developed by the CRU of the University of East Anglia from January 1901 to December 2022, CRU TS v4.07, with a horizontal resolution of 0.5 × 0.5 [19]. They are widely used in climate-change research because of their high resolution, long time scale, and high quality control [20,21].
2.3. Methods
The ensemble empirical mode decomposition (EEMD) method, a new noise-assisted data-analysis technique proposed to overcome the shortcomings of empirical mode decomposition, can effectively extract multi-scale temporal variations from the original time series. It has been widely utilized in the field of climatology [22,23,24]. In this study, the signal-to-noise ratio between the added white noise and original signal in the decomposition process using the EEMD method was set to 0.2, and 500 trials were conducted to achieve the ensemble average. Finally, four intrinsic mode functions (IMFs) with different time scales and fluctuation amplitudes were obtained, along with a trend component reflecting the overall trend. The IMF components capture the variations in the original sequence from high frequency to low frequency, representing the local characteristics of the original sequence.
The Pearson correlation coefficient (PCC) is used to quantify the extent to which two variables are related, and it was obtained using Student’s t-test with N − 2 degrees of freedom at the 95% and 99% confidence levels [25]. The Mann-Kendall (M-K) method is utilized to detect trends in time series. It was first proposed by Mann in 1945 and is commonly used to analyze the trends in variables such as precipitation and temperature. The M-K method does not require samples to follow a specific distribution, and it is not affected by other outliers, making it easy to compute. Therefore, as a non-parametric statistical test, it is suitable for analyzing non-normally distributed variables in meteorology, hydrology, and related fields [26,27].
The runoff-forecasting model in this study was established based on three machine learning methods, namely support vector machine (SVM), radial basis function neural network (RBF), and random forest (RF). SVM is a machine learning method based on statistical learning theory [28]. It is proficient in addressing highly non-linear classification and regression tasks. RBF is a feed-forward neural network model with the capability of universal approximation [29]. RF is an algorithm constructed by using different decision trees with a random approach, and the decision trees are independent of each other [30]. This method performs exceptionally well in classification and regression tasks. By averaging the results from multiple decision trees, it enhances prediction accuracy, mitigates overfitting, and thus outperforms many other regression algorithms. These three machine learning methods are currently widely applied for establishing prediction models in the fields of hydrology and meteorology [31,32]. Additionally, this study uses root mean square error (RMSE), mean absolute error (MAE), R-squared (R2) [33], and Nash−Sutcliffe efficiency (NSE) [16] to evaluate the concordance between model forecasts and actual measurements. We defined the number of decision trees of RF as 100 and the input variable value of each tree as 1. The spread of RBF was defined as 100. The penalty factor and kernel parameter of SVM were defined as 4 and 0.8, respectively.
3. Results
3.1. Temporal Variations of Climatic Factors in the HRB
The interannual and interdecadal variations in temperature, precipitation, and PET in the HRB from 1960 to 2022 are shown in Figure 2. Annual variations show that the three factors in the HRB region have all shown clear upward trends over the last 60 years. Precipitation, temperature, and PET have increased at rates of 5.09 mm per decade, 0.37 °C per decade, and 20.28 mm per decade, respectively. These trends effectively reflect the general warming and wetting trends in the Northwest China.
An analysis of interdecadal variation shows that precipitation follows a slow increasing trend before 2000 (Figure 2b) and that the growth rate has increased to 6.85 mm per decade since the 21st century. Similarly, temperature shows a continuously increasing trend (Figure 2a), but the rate of increase has slowed to 0.31 °C per decade since 2000, consistent with the recent “global warming hiatus” phenomenon. Nevertheless, as a crucial indicator of regional water circulation, the concurrent increase in PET exceeds the 60-year average (Figure 2c) and shows a continuous increasing trend. The growth rate of PET far exceeds that of precipitation, reflecting the concerns regarding the ecological environment in the HRB.
Using the EEMD method, we conducted a multi-timescale decomposition of regional annual mean temperature and annual precipitation. The interannual time scale dominates the variation in precipitation, contributing to 75.25% of the total variance, which includes a quasi-3-year cycle (IMF1, variance contribution of 62.02%) and a quasi-6-year cycle (IMF2, variance contribution of 13.21%). The quasi-3-year cycle is a widespread and crucial signal in the interannual variations of atmospheric circulation and climate, influencing various meteorological factors within the troposphere. The variance contribution of the long-term trend is 13.15%, while the interdecadal and multi-decadal time scales exhibit less pronounced contribution ratios of 4.96% and 6.66%, respectively, as indicated in Table 2.
Unlike variations in precipitation, the variations in temperature are primarily driven by the long-term trend, which accounts for 72.52% of the total variance. This trend reflects the continuous global warming that is occurring to excessive emissions of greenhouse gas. Additionally, the interannual variation with quasi-3-year cycle is also significant, with a variance contribution of 19.51% (IMF1), while the contributions of the interdecadal and multi-decadal variations are not significant (Table 2).
The long-term trend in precipitation shows a relatively stable rate of increase before 2000 (Figure 3), which can be attributed to the small amplitudes of the IMF2 (quasi-6-year cycle) before the 1980s and the IMF1 (quasi-3-year cycle) between the 1980s and 2000. Correspondingly, limited variations are also observed in the multi-decadal time scales before 2000. After 2000, precipitation shows a more pronounced increasing trend (Figure 2b), which is related to the peaks of the IMF4 and the trend component during this period.
Since the beginning of the 21st century, both the multi-decadal IMF4 with a quasi-32-year cycle and the IMF3 with a quasi-16-year cycle have been in a trough (Figure 3b). Their combined effect has alleviated the ongoing long-term warming trend, slowing down the continuous strong warming that had been observed since the 1970s in the HRB. Due to the response of temperature to precipitation, the contribution of the interannual scale to the temperature variations has become more significant, while the multi-decadal scale characteristics of both temperature and precipitation are not significant.
3.2. Spatial Distributions of Climate Changes in the HRB
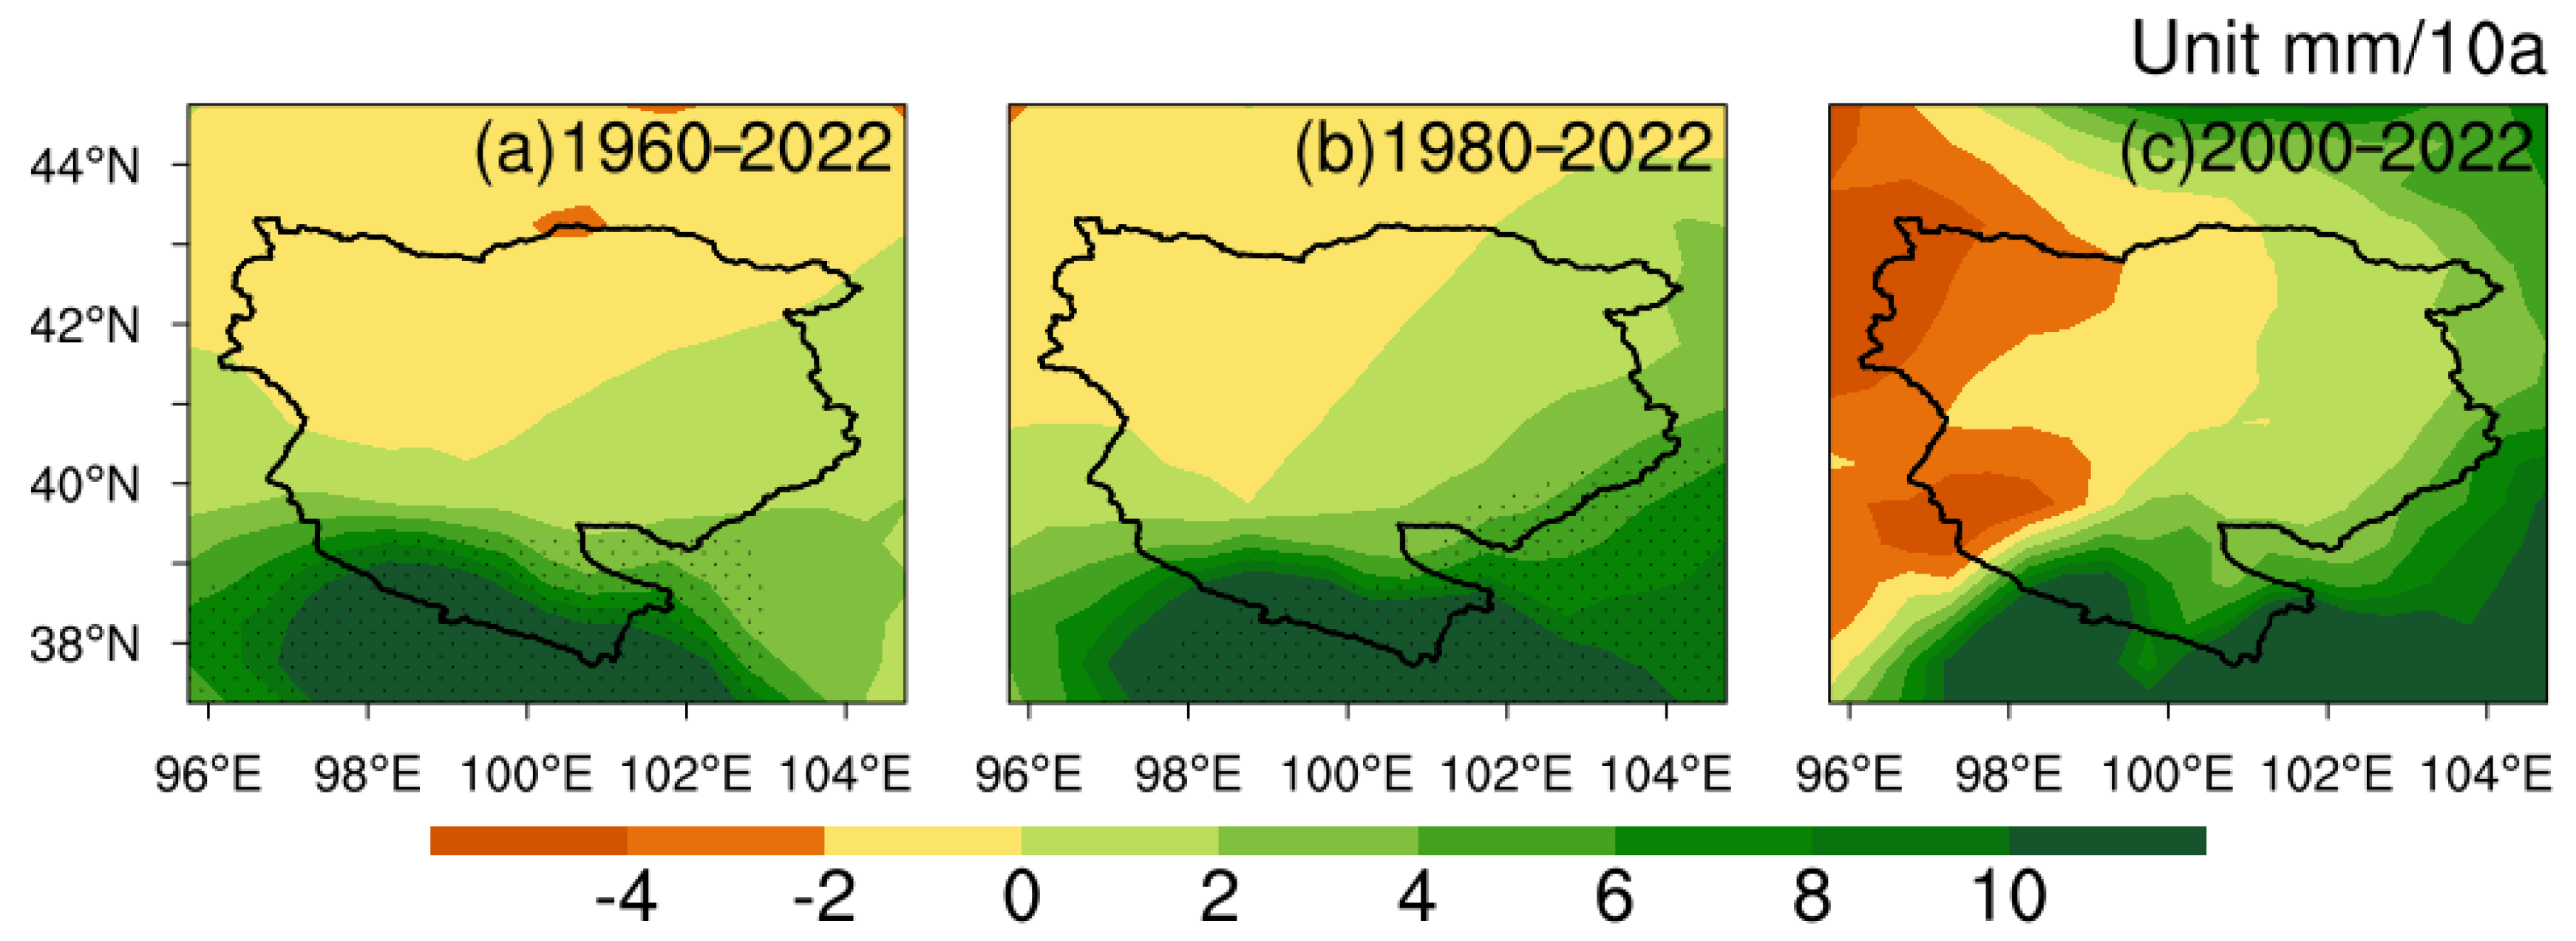
The analysis presented above demonstrates that the climate in the HRB is displaying a warming and wetting trend, consistent with the overall characteristics of climate change observed in Northwest China. The universality of the increasing trends in temperature and precipitation in space is another crucial aspect of understanding regional climate changes. Therefore, we analyzed the spatial distributions of the rates of change in precipitation, temperature and PET during three specific periods, namely 1960–2022, 1980–2022, and 2000–2022.
Over the past 60 years, decreasing trends in precipitation have been observed in the northwestern part of the HRB (Figure 4a), and these trends have become more prominent since 2000 (Figure 4c). However, increasing trends have been observed in the southeastern part, especially in the upper runoff-producing area of the Heihe River in the Qilian Mountains, where the rate of increase exceeds 8 mm per decade and the peak value reaches 15.49 mm per decade, far exceeding the regional average of 5.09 mm per decade. The notable rise in precipitation in the upper runoff-producing area has undoubtedly provided more water to the basin, contributing significantly to increased runoff.
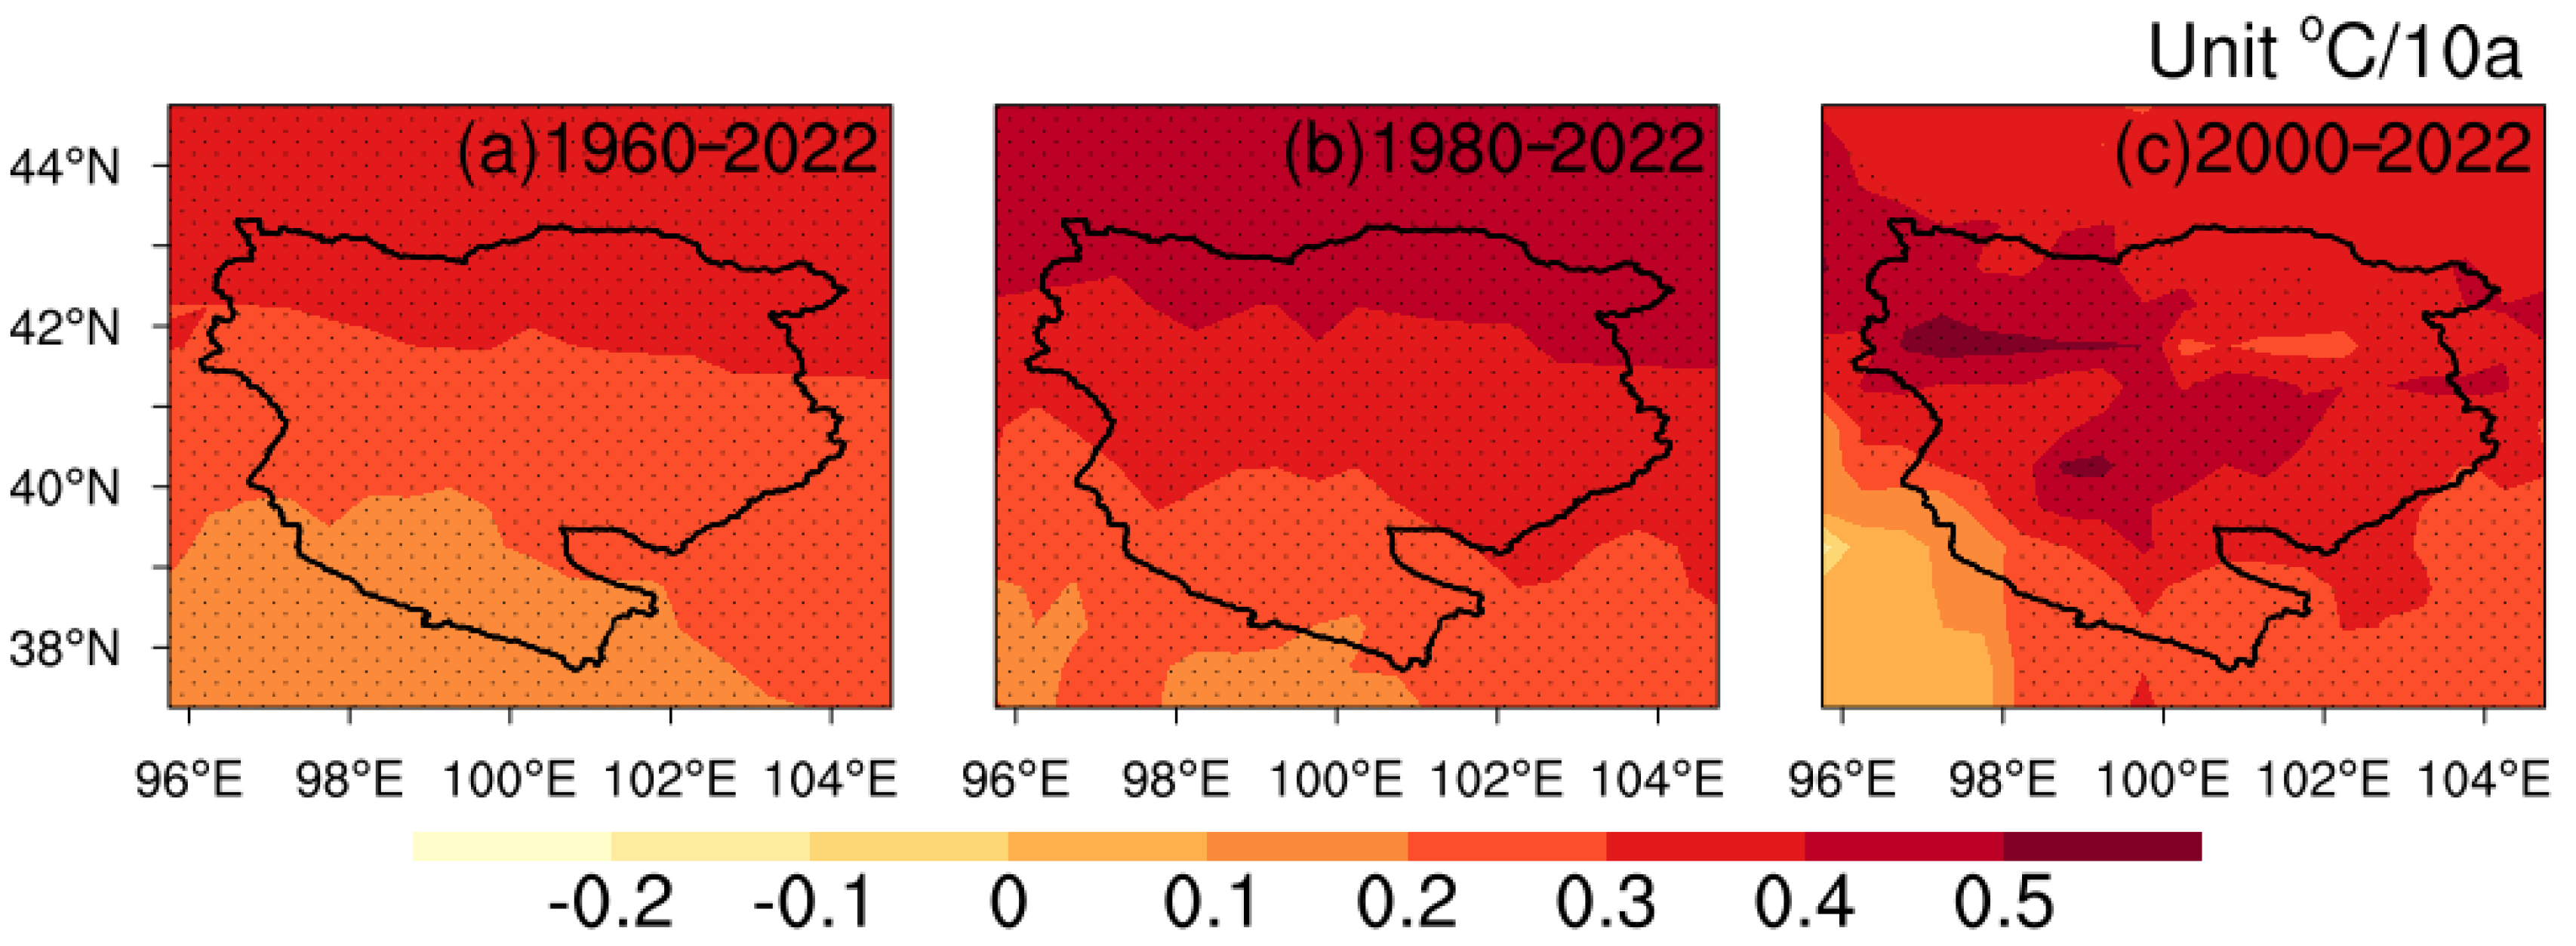
Figure 5 illustrates the spatial distributions of trends in variation in temperature in the HRB. During the periods of 1960–2022 and 1980–2022, there are distinct stepped distributions, with trends of variation in temperature gradually decreasing from north to south and a more pronounced warming trend in the northern part from 1980 to 2022. After 2000, the region experiencing the greatest warming trend has shifted to the northwestern part (Figure 5c), with the maximum rate of increase reaching 0.54 °C per decade, while the minimum rate is observed in the upper runoff-producing area, being only 0.12 °C per decade. Overall, the temperature increase in the upper reaches of the HRB is generally lower than that in the middle water-consumption area, as well as that in the lower disappearing area of terminal rivers and lakes. For the period from 2000 to 2022, the maximum (minimum) amplitude of temperature increase in the HRB is greater (smaller) than those in the previous two periods, indicating the complexity of regional climate changes.
The spatial distributions of the variations in PET are consistent with those of variations in temperature (Figure 6). In the three periods, the PET increase in the upper runoff-producing area of the HRB is generally lower than those in the middle water-consumption area and in the lower disappearing area of terminal rivers and lakes. For the period from 2000 to 2022, the PET values in the upper, middle, and lower reaches of the HRB show more pronounced increasing trends than do those in the previous two periods. The trend in the upper reaches may be related to the larger regional temperature increase (Figure 5c), while in the middle and lower reaches, it may be related to the rising groundwater levels and increased surface water irrigation due to the expansion of agricultural land [34].
The spatial distributions of the variations in precipitation and temperature in the HRB also show a warming and wetting trend, consistent with the regional climate changes. However, there are distinct regional differences. Especially since 2000, a substantial increase in precipitation has been observed in the upper runoff-producing area. With global warming accelerating, there has been an obvious increase in atmospheric water-vapor content, leading to greater unevenness in precipitation and a rise in extreme precipitation events. This phenomenon also reflects the inconsistent responses of regional precipitation to global warming. Overall, the increases in precipitation in the middle and lower reaches of the HRB are not obvious, while there are more pronounced increases in temperature and PET. This finding may indicate that the ecological environment in the middle and lower reaches of the HRB will face greater challenges in the future.
3.3. Characteristics of Variation in Runoff in the HRB
Figure 7 illustrates the monthly and interannual variations in the runoff at the YL hydrological station in the upper runoff-producing area of the HRB. The monthly variation shows a clear “single-peak” pattern, with the peak observed in July. The runoff volume from June to September accounts for more than half of the annual volume (67.29%). An analysis of interannual variation shows that the runoff at the YL station experienced a gradual increase (0.05 × 10⁸ m3 per decade) from 1960s to 1970s, followed by up-down fluctuations from 1980s to late 1990s and a rapid increase after 2000. Overall, the runoff at the YL station has increased at a rate of 1.04 × 10⁸ m3 per decade over the past 60 years. By the 2010s, the annual runoff at the YL hydrological station had increased by 35% and 16% compared with runoff in the 1960s and 2000s, respectively.
Figure 8 displays the variation in the annual runoff from 1960 to 2020 at the ZY hydrological station, which represents the middle water-consumption area. The data show that the average annual runoff at the ZY station (10.50 × 10⁸ m3) is less than that at the YL station (16.79 × 10⁸ m3), which may be due to the supply of meltwater from glaciers and permafrost, as well as to the more pronounced increase in precipitation at the YL hydrological station (Figure 4a). Around 2005, there was a major shift in runoff variation at the ZY hydrological station, which is significant according to the M-K test. From 1960 to 2004, the runoff decreased significantly at a rate of 0.81 × 10⁸ m3 per decade. The average annual runoff from the early 1990s to 2004 decreased by 30% compared with that before 1990s. After 2005, the runoff at the ZY station increased at a rate of 2.55 × 10⁸ m3 per decade. By the 2010s, the runoff had increased by 40% compared with that before 2004.
3.4. Impact of Climate Changes on Runoff in the HRB
In the upper reaches of the HRB, where there are overlapping mountain ranges and glaciers, climate change is the main factor influencing the variations in runoff. Table 3 presents the correlation coefficients between the runoff and climatic factors at the YL and ZY hydrological stations. There is a notable positive correlation between the annual runoff and precipitation at the YL hydrological station. The contribution of precipitation in the upper reaches to runoff is the most prominent, with a correlation coefficient of 0.9. The annual runoff at the ZY hydrological station, which represents the outflow in the middle reaches, is closely related to the precipitation in the middle reaches (Table 3). This finding highlights that the precipitation in the middle reaches is one of major contributors to the regional water resources, although its coefficient of correlation with the annual runoff at the ZY station is about half of that between the annual runoff at the YL hydrological station and the precipitation in upper reaches. The coefficient of correlation between the temperature in upper reaches and the runoff at the YL station is 0.53, making it statistically significant. However, there is no significant correlation between the runoff at the ZY hydrological station and either the regional overall temperature or the temperature in the upper reaches.
To summarize, precipitation is the main factor influencing the annual runoff. Temperature significantly affects the runoff only in the upper runoff-producing area, while its impact on the runoff in the middle water-consumption area is nonsignificant. Water consumption by urban industry and agricultural irrigation are more important than precipitation as factors influencing the runoff in the middle water-consumption area.
To improve the accuracy of future runoff predictions in the upper reaches of the HRB, the prediction models for annual and monthly runoff were established using three machine learning methods, namely RBF, RF and SVM. A comparison between the predicted values with the observations (Figure 9) shows that all three methods can be used to accurately predict the annual runoff. Further evaluation shows that the NSE of the SVM-trained model (0.86) is greater than those of the models trained by RBF (0.84) and RF (0.82). In addition, the RMSE and MAE of the SVM-trained model are smaller than those of the other two models (Figure 10a). This finding demonstrates that the SVM-trained model has superior performance for annual runoff prediction, while the RF-trained model has the largest errors. The evaluation of monthly runoff prediction shows the opposite result. The RF-trained model has the best performance (Figure 10b), with larger NSE value and smaller RMSE and MAE than the other two models.
4. Discussion
Climatic factors are crucial indicators for explaining variations in runoff. With the intensification of the overall warming-wetting climate in Northwest China, the runoff in the HRB is gradually increasing. Precipitation, as the primary water input to a watershed, plays a decisive role in determining runoff volume, which is particularly evident in the upper reaches, where there is less human activity.
On the monthly time scale, summer precipitation in the upper reaches accounts for 61.2% of the annual total [16]. Additionally, the runoff contribution from glacier and permafrost melt induced by rising temperatures is also highly concentrated in summer [35]. The synchronicity of these factors exacerbates the unevenness of the monthly variations of runoff in the upper reaches (Figure 7). A previous study has shown that the glacier retreated by around 50% between 1980 and 2018 [36]. Overall, the influences of temperature and precipitation on runoff are mainly observed in the upper reaches, while the impacts are relatively nonsignificant in the middle reaches. This difference may indicate that the influences of climatic factors on runoff are decreasing in the middle reaches, while land-surface conditions, human activities, and other factors are gradually becoming more important.
The runoff at the YL and ZY hydrological stations, respectively, represents the outflows from the upper runoff-producing area and the middle water consumption area. Consequently, the difference in runoff between the two stations approximates the volume of total water consumption in the middle reaches. The analysis reveals three distinct stages in the evolution of the difference in runoff between the two stations (Figure 11): a stable decrease stage (1960–1974), a significant increase stage (1975–2000), and a gradual decrease stage (2001–2019). During the significant increase stage, the area of land under cultivation and used for urbanization was expanding with the growing population and the accelerated socio-economic development in the middle reaches of the Heihe River [37]. This change led to a substantial increase in water consumption, resulting in a sharp decrease in water outflow at the ZY hydrological station (Figure 8) and an increase in the runoff difference, contributing to the continuous deterioration of the ecological environment in the downstream area. West Juyan Lake and East Juyan Lake, the terminal lakes of the main stream of the Heihe River, dried up completely in 1961 and 1992, respectively [38].
To prevent the deterioration of the ecological system in the middle and lower reaches of the Heihe River, the Chinese government has invested a total of 2.3 billion yuan into the construction of the Ecological Water Diversion Project (EWDP) in the HRB since 2000. This project has imposed regulations on the minimum outflow in the middle reaches, resulting in a stable increase in the runoff at the ZY hydrological station after 2005 (Figure 8). This is also the main reason for the gradual decrease in the runoff difference between the YL and ZY hydrological stations after 2001. The gradual recovery of vegetation and lakes in the lower reaches of the HRB indicates that the EWDP has had some success [39,40]. However, this progress remains insufficient. From a climate perspective, the lower reaches are experiencing a scarcity of precipitation (Figure 4), a significant increase in temperature (Figure 5), and consistently high PET (Figure 6). In the Ejina Oasis, located at the terminus of the Heihe River main stream, PET increased by 52% from 2000 to 2014 [34], exacerbating water loss.
The machine learning methods RBF, RF and SVM all perform well in predicting the runoff in the upper reaches of the HRB. Among them, SVM and RF stand out as the optimal methods for annual and monthly runoff forecasting, respectively. The SVM- and RF-trained models achieve NSE values of 0.80 and 0.79, respectively, exceeding the performance of predictive models trained by traditional methods [16]. Therefore, the machine learning methods should be used for most future forecasts of runoff in the upper reaches of the HRB.
In general, the steady increase in precipitation has ensured stable runoff in the HRB, despite the severe glacial retreat in the upper reaches. The middle reaches, which are experiencing population growth and cropland expansion, are the primary water-consuming region. In the lower reaches, the PET far exceeds precipitation, although the ecological environment is gradually improving. The uneven distribution of water resources in the HRB is a critical issue at present. The optimal allocation of water resources and the sustainable development of the ecological environment remain the most challenging issues.
5. Conclusions
Over the past 60 years, precipitation, temperature and PET in the HRB have increased at rates of 5.09 mm per decade, 0.37 °C per decade, and 20.28 mm per decade, respectively. Before 2000, precipitation in the HRB increased slowly, and the rate of increase has accelerated to 6.85 mm per decade since the 21st century. The rate of increase in temperature has declined since 2000, while the concurrent increase in PET far exceeds the 60-year average, which still shows a sustained upward trend. Patterns of precipitation are mainly dominated by interannual variations, including the quasi-3-year and quasi-6-year cycles. The variations in temperature are mainly shaped by long-term trends, although the quasi-3-year cycle is also notably significant.
Precipitation has shown decreasing trends in the northwestern part of the HRB over the past 60 years. Meanwhile, predominantly increasing trends at rates much higher than the regional average are found in the southeastern part. The temperature increases in the upper runoff-producing area tend to be lower than those in the middle water-consumption area and the lower disappearing area of terminal rivers and lakes. Furthermore, during the period from 2000 to 2022, the maximum (minimum) temperature increases in the HRB exhibited are greater (smaller) in magnitude than those in the other two stages (1960–2022 and 1980–2022). The distribution characteristics of the variation in PET are consistent with those in temperature. Overall, the increases in precipitation in the middle and lower reaches are not particularly significant, whereas there are more pronounced increases in temperature and PET.
The monthly variation in the runoff at the YL hydrological station shows a distinct “single-peak” pattern, with the runoff from June to September accounting for over half of the annual total (67.29%). The runoff at the YL hydrological station has shown a steady increase at a rate of 1.04 × 10⁸ m3 per decade over the past 60 years. The average annual runoff at the ZY hydrological station is 10.50 × 10⁸ m3, which is lower than the value of 16.79 × 10⁸ m3 at the YL hydrological station. Around 2005, there is a turning point in the runoff variation at the ZY hydrological station, where the trend transitions from a substantial decreasing trend to an increasing trend at a rate of 2.55 × 10⁸ m3 per decade. By the 2010s, the runoff had increased by nearly 40% compared to that before 2004.
The annual runoff at the YL (ZY) hydrological station is significantly correlated with precipitation in the upper (middle) reaches, indicating that precipitation is the primary factor determining the annual runoff. The impact of temperature on runoff is particularly significant in the upper runoff-producing area, while it is nonsignificant in the middle reaches. This finding indicates that, apart from precipitation, human activities appear to be the most important factor influencing the runoff in the middle reaches. The SVM-trained model demonstrates superior predictive performance for the annual runoff, while the RF-trained model performs best in predicting the monthly runoff.
In this paper, the main drivers of runoff changes in HRB are described from the perspective of climate; however, the impact of human activity on runoff cannot be ignored. Integrated management and sustainable utilization of water resources for the HRB require systematic consideration of climate, human activity and social-economic development, which will be further explored in a future study.
Author Contributions
Conceptualization, P.C., X.Y. and Q.X.; data curation, X.Y. and Q.X.; formal analysis, X.Y. and M.L.; funding acquisition, P.C. and L.W.; investigation, Q.X., L.B. and X.Y.; methodology, X.Y., P.C. and M.L.; software, Q.L., M.L. and X.L.; writing—original draft preparation, X.Y.; writing—review and editing, X.Y. and Q.X.; All authors have read and agreed to the published version of the manuscript.
Funding
This research was funded by The Key Research and Development Program of Gansu Province (23YFGA0016), Association of Science and Technology Innovation Drive Promotion Project of Gansu Province (GXH20230817-7), the National Natural Science Foundation of China (42005038), and The Youth Science and Technology Fund project of Gansu Province (23JRRA1326).
Institutional Review Board Statement
Not applicable.
Informed Consent Statement
Not applicable.
Data Availability Statement
The data that support the findings of this study are available from the corresponding author upon reasonable request. The data are not publicly available due to privacy.
Acknowledgments
The authors sincerely thank the anonymous reviewers for their valuable comments and suggestions for improving the quality of this paper. The authors also gratefully acknowledge the help of Qiang Zhang for his theoretical guidance of the first draft, who works for Lanzhou Institute of Drought Meteorology, China Meteorological Bureau.
Conflicts of Interest
The authors declare no conflict of interest.
References
- Zhang, Q.; Zhu, B.; Yang, J.H.; Ma, P.L.; Liu, X.Y.; Lu, G.Y.; Wang, Y.H.; Yu, H.P.; Liu, W.P.; Wang, D.W. New characteristics about the climate humidification trend in Northwest China. Chin. Sci. Bull. 2021, 66, 3757–3771. (In Chinese) [Google Scholar] [CrossRef]
- Yan, X.Y.; Zhang, Q.; Yan, X.M.; Wang, S.; Ren, X.Y.; Zhao, F.N. An overview of distribution characteristics and formation mechanisms in global arid areas. Adv. Earth Sci. 2019, 34, 826–841. (In Chinese) [Google Scholar]
- Zhang, Q.; Lin, J.J.; Liu, W.C.; Han, L.Y. Precipitation seesaw phenomenon and its formation mechanism in the eastern and western parts of Northwest China during flood season. Sci. China Earth Sci. 2019, 62, 2083–2098. (In Chinese) [Google Scholar] [CrossRef]
- Yan, X.Y.; Zhang, Q.; Ren, X.Y.; Wang, X.Y.; Yan, X.M.; Li, X.Q.; Wang, L. Climatic change characteristics towards the “warming-wetting” trend in the Pan-Central-Asia arid region. Atmosphere 2022, 13, 467. [Google Scholar] [CrossRef]
- Yan, X.Y.; Cheng, P.; Zhang, Q.; Li, X.Q.; He, J.M.; Yan, X.M.; Zhao, W.J.; Wang, L. Comparisons of climate change characteristics in typical arid regions of the Northern Hemisphere. Front. Environ. Sci. 2022, 10, 1033326. [Google Scholar] [CrossRef]
- Lin, J.J.; Zhang, Q. Influence of climate state change to weather extreme monitoring in Northwest China. J. Desert Res. 2016, 36, 1559–1665. (In Chinese) [Google Scholar]
- Yan, X.Y.; Zhang, Q.; Zhang, W.B.; Ren, X.Y.; Wang, S.; Zhao, F.N. Analysis of climate characteristics in the Pan-Central-Asia arid region. Arid. Zone Res. 2021, 38, 1–11. (In Chinese) [Google Scholar]
- Cheng, G.D.; Li, X.; Zhao, W.Z.; Xu, Z.M.; Feng, Q.; Xiao, S.C.; Xiao, H.L. Integrated study of the water–ecosystem–economy in the Heihe River Basin. Nat. Sci. Rev. 2014, 1, 413–428. [Google Scholar] [CrossRef]
- Wang, Y.; Feng, Q.; Chen, L.; Yu, T. Significance and effect of ecological rehabilitation project in inland river basins in Northwest China. Environ. Manag. 2013, 52, 209–220. [Google Scholar] [CrossRef] [PubMed]
- Min, L.; Yu, J.; Liu, C.; Zhu, J.; Wang, P. The spatial variability of streambed vertical hydraulic conductivity in an intermittent river, northwestern China. Environ. Earth Sci. 2013, 69, 873–883. [Google Scholar] [CrossRef]
- Hu, G.C.; Jia, L. Monitoring of evapotranspiration in a semi-arid inland river basin by combining microwave and optical remote sensing observations. Remote Sens. 2015, 7, 3056–3087. [Google Scholar] [CrossRef]
- Zang, C.; Liu, J.; Jiang, L.; Gerten, D. Impacts of human activities and climate variability on green and blue water flows in the Heihe river basin in Northwest China. Hydrol. Earth Syst. Sci. 2013, 10, 9505–9577. [Google Scholar]
- Wu, B.; Zheng, Y.; Tian, Y.; Wu, X.; Yao, Y.; Han, F.; Liu, J.; Zheng, C. Systematic assessment of the uncertainty in integrated surface water–groundwater modeling based on the probabilistic collocation method. Water Resour. Res. 2014, 50, 5848–5865. [Google Scholar] [CrossRef]
- Qin, J.; Ding, Y.J.; Wu, J.K.; Gao, M.J.; Yi, S.H.; Zhao, C.C.; Ye, B.S.; Li, M.; Wang, S.X. Understanding the impact of mountain landscapes on water balance in the upper Heihe River watershed in northwestern China. J. Arid Land 2013, 5, 366–383. (In Chinese) [Google Scholar] [CrossRef]
- Li, Z.L.; Xu, Z.X. Detection of change points in temperature and precipitation time series in the Heihe River Basin over the Past 50 Years. Resour. Sci. 2011, 33, 1877–1882. [Google Scholar]
- Chen, P.; Kong, X.W.; Luo, H.; Li, B.Z.; Wang, Y.F. Climate change and its runoff response in the middle section of the Qilian Mountains in the past 60 years. Arid Land Geogr. 2020, 43, 1192–1201. (In Chinese) [Google Scholar]
- Li, X.; Nan, Z.T.; Cheng, G.D.; Ding, Y.J.; Wu, L.Z.; Wang, L.X.; Wang, J.; Ran, Y.H.; Li, H.X.; Pan, X.D.; et al. Toward an improved data stewardship and service for environmental and ecological science data in west China. Int. J. Digit. Earth 2011, 4, 347–359. [Google Scholar] [CrossRef]
- Zhang, A.J.; Zheng, C.M.; Wang, S.; Yao, Y.Y. Analysis of streamflow variations in the Heihe River Basin, Northwest China: Trends, abrupt changes, driving factors and ecological influences. J. Hydrol. Reg. Stud. 2015, 3, 106–124. [Google Scholar] [CrossRef]
- Harris, I.; Osborn, T.J.; Jones, P.; Lister, D. Version 4 of the CRU TS monthly high-resolution gridded multivariate climate dataset. Sci. Data 2020, 7, 109. [Google Scholar] [CrossRef]
- Zhang, H.L.; Zhang, Q.; Liu, Q.; Chai, Y.C.; Yan, X.Y. The temporal and spatial distribution characteristics of dryness index and its main factors in China. J. Lanzhou Univ. Nat. Sci. Ed. 2016, 52, 484–491. (In Chinese) [Google Scholar]
- Chen, F.H.; Huang, W.; Jin, L.Y.; Chen, J.H.; Wang, J.S. Spatiotemporal precipitation variations in the arid Central Asia in the context of global warming. Sci. China Earth Sci. 2011, 41, 1647–1657. (In Chinese) [Google Scholar] [CrossRef]
- Wu, Z.H.; Norden, H. Ensemble empirical mode decomposition: A noise-assisted data analysis method. Adv. Adapt. Data Anal. 2009, 1, 1–41. [Google Scholar] [CrossRef]
- Bi, S.B.; Li, S.; Xinyu, L.; Changchun, C.; Yin, L. Characteristics of drought and flood disasters in the middle and lower reaches of the Yellow River from 1470 to 1911 based on EEMD method. J. Nat. Disast. 2018, 27, 137–147. [Google Scholar]
- Xu, B.L.; Yang, Q.; Ma, Z.G. Decadal characteristics of global land annual precipitation variation on multiple spatial scales. Chin. J. Atmos. Sci. 2017, 41, 593–602. [Google Scholar]
- Hu, Z.Y.; Zhou, Q.M.; Chen, X.; Qian, C.; Wang, S.S.; Li, J.F. Variations and changes of annual precipitation in Central Asia over the last century. Int. J. Climatol. 2017, 37, 157–170. [Google Scholar] [CrossRef]
- Ma, Z.G.; Fu, C.B.; Dan, L. Decadal variations of arid and semi-arid boundary in China. Chin. J. Geophys. 2005, 48, 574–581. [Google Scholar] [CrossRef]
- Zhang, Q.; Xu, C.Y.; Zhang, Z.; Chen, Y.D.; Liu, C.L. Spatial and temporal variability of precipitation over China, 1951–2005. Theor. Appl. Climatol. 2009, 95, 53–68. [Google Scholar] [CrossRef]
- Salcedo-Sanz, S.; Deo, R.C.; Carro-Calvo, L.; Saavedra-Moreno, B. Monthly prediction of air temperature in Australia and New Zealand with machine learning algorithms. Theor. Appl. Climatol. 2016, 125, 13–25. [Google Scholar] [CrossRef]
- Song, G.Y.; Zhou, G.B.; Fu, S.J. Analysis of drought characteristics and construction of prediction model in Chongqing based on SPEI index. Eng. J. Wuhan Univ. 2023, 56, 1458–1471. (In Chinese) [Google Scholar]
- Breiman, L. Random Forests. Mach. Learn. 2001, 45, 5–32. [Google Scholar] [CrossRef]
- Fan, J.L.; Yue, W.J.; Wu, L.F.; Zhang, F.C.; Cai, H.J.; Wang, X.K.; Lu, X.H.; Xiang, Y.W. Evaluation of SVM, ELM and four tree-based ensemble models for predicting daily reference evapotranspiration using limited meteorological data in different climates of China. Agric. For. Meteorol. 2018, 263, 225–241. [Google Scholar] [CrossRef]
- Song, H.J.; Chen, Y.D.; Ou-Yang, L.; Chen, H.Q.; Gao, Z.F.; Sun, T. Short-range forecast of precipitation over the middle-lower reaches of the Yangtze River based on the Catboost and Stacking model. J. Meteor. Sci. 2022, 42, 569–580. [Google Scholar]
- Ya-Sheng, D.; Wang, T.Y.; Cheng, J.C.; Li, X.; Lei, Y.H.; Wang, X.Y.; Xie, X.S.; Sun, C.X.; Wang, J.Y. A prediction of Nanjing City ρ(O3) from 2016 to 2020 based on machine learning. J. Lanzhou Univ. Nat. Sci. Ed. 2023, 59, 371–379. (In Chinese) [Google Scholar]
- Zhou, Y.Z.; Li, X.; Yang, K.; Zhou, J. Assessing the impacts of an ecological water diversion project on water consumption through high-resolution estimations of actual evapotranspiration in the downstream regions of the Heihe River Basin, China. Agric. For. Meteorol. 2018, 249, 210–227. [Google Scholar] [CrossRef]
- Zhang, Y.S.; Liu, S.Y.; Shang-Guan, D.H.; Li, J.; Zhao, J.D. Thinning and shrinkage of Laohugou No. 12 glacier in the Western Qilian Mountains, China, from 1957 to 2007. J. Mt. Sci.-Engl. 2012, 9, 350–353. [Google Scholar] [CrossRef]
- Liang, P.F.; Xin, H.J.; Li, Z.X.; Zhang, B.J.; Gui, J.; Duan, R.; Nan, F.S.; Ding, Z.Y.P.; Yang, S.M. Runoff variation characteristics and influencing factors in the Heihe River Basin in the Qilian Mountains. Arid Land Geogr. 2022, 45, 1460–1471. (In Chinese) [Google Scholar]
- Hu, G.L.; Tao, H.; Jiao, J.; Bai, Y.R.; Chen, H.Z.; Ma, J. Runoff trend and attribution analysis of the Zhengyi Gorge in the middle reaches of the Heihe River. Arid Zone Res. 2023, 40, 1414–1424. (In Chinese) [Google Scholar]
- Xiao, S.C.; Peng, X.M.; Tian, Q.Y. Climatic and human drivers of recent lake-level change in East Juyan Lake, China. Reg. Environ. Chang. 2016, 16, 1063–1073. [Google Scholar] [CrossRef]
- Zhang, Y.C.; Yu, J.J.; Wang, P.; Fu, G.B. Vegetation responses to integrated water management in the Ejina basin, northwest China. Hydrol. Process. 2011, 25, 3558–3561. [Google Scholar] [CrossRef]
- Hu, X.L.; Lu, L.; Li, X.; Wang, J.H.; Lu, X.G. Ejin Oasis land use and vegetation change between 2000 and 2011: The role of the ecological water diversion project. Energies 2015, 8, 7040–7057. [Google Scholar] [CrossRef]
Figure 1.
Location of the Heihe River Basin.

Figure 2.
Interannual variations in temperature (a), precipitation (b), and PET (c) from 1960 to 2020.
Figure 2.
Interannual variations in temperature (a), precipitation (b), and PET (c) from 1960 to 2020.

Figure 3.
Trends in variation in precipitation (a) and temperature (b) after EEMD.

Figure 4.
Variation (unit: mm/10a) in precipitation in the HRB during 1960–2022 (a), 1980–2022 (b) and 2000–2022 (c). The shaded region indicates where the variability is statistically significant at a 0.05 significance level; the same applies below.
Figure 4.
Variation (unit: mm/10a) in precipitation in the HRB during 1960–2022 (a), 1980–2022 (b) and 2000–2022 (c). The shaded region indicates where the variability is statistically significant at a 0.05 significance level; the same applies below.

Figure 5.
Same as Figure 4, but for variation (unit: °C/10a) in temperature (a–c).
Figure 5.
Same as Figure 4, but for variation (unit: °C/10a) in temperature (a–c).

Figure 6.
Same as Figure 4, but for variation (unit: mm/10a) in PET (a–c).
Figure 6.
Same as Figure 4, but for variation (unit: mm/10a) in PET (a–c).

Figure 7.
Monthly and annual variation in runoff at the YL.

Figure 8.
Annual variation in runoff at the ZY.

Figure 9.
Comparison between the measured values of annual runoff in YL and the predicted values based on the (a) RBF, (b) RF, and (c) SVM models. The left side of the blue dotted line represents the training set, and the right side represents the testing set.
Figure 9.
Comparison between the measured values of annual runoff in YL and the predicted values based on the (a) RBF, (b) RF, and (c) SVM models. The left side of the blue dotted line represents the training set, and the right side represents the testing set.

Figure 10.
The effectiveness of annual (a) and monthly (b) prediction models established by three machine learning methods.
Figure 10.
The effectiveness of annual (a) and monthly (b) prediction models established by three machine learning methods.

Figure 11.
Variations in the runoff difference between YL and ZY. The blue dotted lines represent the divisions between the three distinct stages in the evolution of the runoff difference between the two stations.
Figure 11.
Variations in the runoff difference between YL and ZY. The blue dotted lines represent the divisions between the three distinct stages in the evolution of the runoff difference between the two stations.


Table 1.
Information on meteorological and hydrological stations.
| Site | Latitude | Longitude | Altitude (m) | Site | Latitude | Longitude | Altitude (m) |
|---|---|---|---|---|---|---|---|
| Mazong Mountain (MZ) | 41°48′ N | 97°01′ E | 1773.7 | Yumeng (YM) | 40°16′ N | 97°01′ E | 1527.2 |
| Ejina (EJ) | 41°57′ N | 101°03′ E | 939.0 | Dingxin (DX) | 40°18′ N | 99°31′ E | 1176.3 |
| Guaizi Lake (GZ) | 41°21′ N | 102°21′ E | 954.6 | Jinta (JT) | 39°59 ′N | 98°53′ E | 3360.3 |
| Yeniu Gully (YN) | 38°37′ N | 90°21′ E | 3180.0 | Jiuquan (JQ) | 39°46′ N | 98°29′ E | 1477.2 |
| Zhangye (ZY) | 39°04′ N | 100°16′ E | 1461.1 | Gaotai (GT) | 39°22′ N | 99°49′ E | 1332.2 |
| Minle (ML) | 38°27′ N | 100°49′ E | 2271.5 | Linze (LZ) | 39°08′ N | 100°11′ E | 1402.0 |
| Qilian (QL) | 38°11′ N | 100°15′ E | 2787.4 | Tuole (TL) | 38°48′ N | 98°25′ E | 3360.3 |
| Shandan (SD) | 38°47′ N | 100°05′ E | 1765.5 | Sunan (SN) | 38°50′ N | 99°37′ E | 2311.3 |
| Yingluo Gorge (YL) | 38°82′ N | 100°19′ E | 1703.0 | Zhenyi Gorge (ZY) | 39°79′ N | 99°42′ E | 1246.0 |
Table 2.
Variance contribution rates and periods of precipitation and temperature components after EEMD.
Table 2.
Variance contribution rates and periods of precipitation and temperature components after EEMD.
| Precipitation | Temperature | |||
|---|---|---|---|---|
| Period (Year) | Contribution (%) | Period (Year) | Contribution (%) | |
| IMF1 | 2.74 | 62.02 | 2.93 | 19.51 |
| IMF2 | 5.73 | 13.21 | 8.4 | 4.47 |
| IMF3 | 11.45 | 4.96 | 15.75 | 1.61 |
| IMF4 | 31.5 | 6.66 | 31.5 | 1.89 |
| Trend | / | 13.15 | / | 72.52 |
Table 3.
PPC between annual runoff and precipitation and temperature at YL and ZY.
| Site | HRB | The Upper Reaches | The Middle Reaches | |||
|---|---|---|---|---|---|---|
| P | T | P | T | P | T | |
| YL | 0.66 ** | 0.49 ** | 0.90 ** | 0.53 ** | / | / |
| ZY | 0.59 ** | 0.14 | / | / | 0.42 ** | 0.18 |
Note: ** passing the 99% confidence level.
Disclaimer/Publisher’s Note: The statements, opinions and data contained in all publications are solely those of the individual author(s) and contributor(s) and not of MDPI and/or the editor(s). MDPI and/or the editor(s) disclaim responsibility for any injury to people or property resulting from any ideas, methods, instructions or products referred to in the content. |
© 2024 by the authors. Licensee MDPI, Basel, Switzerland. This article is an open access article distributed under the terms and conditions of the Creative Commons Attribution (CC BY) license (https://creativecommons.org/licenses/by/4.0/).
Share and Cite
MDPI and ACS Style
Liu, Q.; Cheng, P.; Lyu, M.; Yan, X.; Xiao, Q.; Li, X.; Wang, L.; Bao, L. Impacts of Climate Change on Runoff in the Heihe River Basin, China. Atmosphere 2024, 15, 516. https://doi.org/10.3390/atmos15050516
AMA Style
Liu Q, Cheng P, Lyu M, Yan X, Xiao Q, Li X, Wang L, Bao L. Impacts of Climate Change on Runoff in the Heihe River Basin, China. Atmosphere. 2024; 15(5):516. https://doi.org/10.3390/atmos15050516
Chicago/Turabian StyleLiu, Qin, Peng Cheng, Meixia Lyu, Xinyang Yan, Qingping Xiao, Xiaoqin Li, Lei Wang, and Lili Bao. 2024. "Impacts of Climate Change on Runoff in the Heihe River Basin, China" Atmosphere 15, no. 5: 516. https://doi.org/10.3390/atmos15050516
Note that from the first issue of 2016, this journal uses article numbers instead of page numbers. See further details here.