Article

Dust Transport from North Africa to the Middle East: Synoptic Patterns and Numerical Forecast

by
Sara Karami
1,*,
Dimitris G. Kaskaoutis
2,
Ioannis Pytharoulis
3,*,
Rafaella-Eleni P. Sotiropoulou
4 and
Efthimios Tagaris
2
1
Research Institute of Meteorology and Atmospheric Science (RIMAS), Tehran 14977-16385, Iran
2
Department of Chemical Engineering, University of Western Macedonia, 50100 Kozani, Greece
3
Department of Meteorology and Climatology, School of Geology, Aristotle University of Thessaloniki, 54124 Thessaloniki, Greece
4
Department of Mechanical Engineering, University of Western Macedonia, 50100 Kozani, Greece
*
Authors to whom correspondence should be addressed.
Atmosphere 2024, 15(5), 531; https://doi.org/10.3390/atmos15050531
Submission received: 28 February 2024 / Revised: 10 April 2024 / Accepted: 23 April 2024 / Published: 26 April 2024
(This article belongs to the Special Issue Numerical Weather Prediction Models and Ensemble Prediction Systems)

Abstract

:
Every year, large quantities of dust are transported from North Africa to the Americas, Europe, and West Asia. The purpose of this study is to analyze four intense and pervasive dust storms that entered the Middle East from Northern Africa. Satellite products, ground-based remote sensing measurements, reanalysis data, and the outputs of the Aire Limitée Adaptation dynamique Développement InterNational-Dust (ALADIN-Dust) and the ICOsahedral Nonhydrostatic weather and climate model with Aerosols and Reactive Trace gases (ICON-ART) forecasting models were synergized. The dust storms originated from different source regions located in the north, northeastern, and central parts of the Sahara Desert. The transport height of the main dust plumes was about 3–5 km, triggered by the westerly zonal winds. The presence of a closed low over the Eastern Mediterranean and the penetration of a deep trough into North Africa at 500 hPa were the main synoptic circulation patterns favoring long-range dust transport during the four dust events. A comparison of aerosol optical depth (AOD) outputs from the two models with satellite data revealed that although both models forecasted dust transport from Africa to the Middle East, they considerably underestimated the AOD values, especially near the dust sources. The ICON-ART model performed slightly better than ALADIN in forecasting these dust storms, and for longer forecasting leading time, although the performance of both models decreased, the superiority of the ICON-ART model became more apparent.

1. Introduction

Dust storms, as natural hazards, have many economic and social effects on the countries lying across the global dust belt [1,2,3,4], as they harm human health through several respiratory and heart diseases and cause significant damage to infrastructure and economic loss [5,6,7]. Furthermore, intense dust storms reduce visibility, causing road accidents [8] and flight cancellations [9,10]. Apart from the local effects, dust particles may travel long distances and are even transported between continents [11,12,13]. Particles that come from distant dust sources can cause the transmission of many diseases by carrying microbes and viruses from different areas along their path [14,15,16,17,18]. In addition, due to their smaller size, they can easily enter the human body and lead to more cardiovascular diseases [19]. Therefore, long-range transported dust has attracted large scientific attention due to multiple effects on atmospheric dynamics, direct and indirect radiative effects, regional climate, cloud properties, air quality, loess deposits, and human health [20,21,22,23,24,25].
Every year, several billion tons of dust are emitted into the atmosphere, of which 1 billion originates from Africa, while many studies have been involved in investigating the dust transport from Africa to the Americas [26,27,28,29,30,31,32]. These results revealed that in winter and spring, African dust is mainly transported to South America at levels below 800 hPa, while in summer and autumn, the preferred routes are toward the Caribbean Sea and in atmospheric layers up to 500 hPa.
The transport of dust from Africa to the European continent has also been analyzed by many researchers (e.g., [33,34,35,36,37]). A recent study indicated that atmospheric rivers (ARs) in Northwest Africa showed an increasing trend during the past four decades, and 78% of AR events were associated with abnormal dust in Europe [38]. Several other studies examined the effects of dust on weather conditions, climate forcing, agriculture, transportation, energy, society (including school closures and cancellation of social events), and emergency response systems in Southern Europe [39,40,41,42,43]. The severe dust storm on 22 March 2018 over the Eastern Mediterranean and Greece [44] led to a 3-fold increase in daily emergency responses compared to previous days and a 3.5-fold increase in hospital admissions for respiratory illnesses in Crete Island. Reduced visibility caused disruption to air traffic, eleven cancellations, and seven flight delays, while the estimated direct and indirect financial cost of this dust event was estimated between EUR 3.4 and 3.8 million for Crete, Greece [43].
Under certain synoptic conditions, African dust plumes may also affect India, modifying the aerosol physical properties and chemical composition [45]. Dust particles from the African continent sometimes may enter East Asia by traveling very long distances [46,47]. Therefore, the vast deserts of the Middle East and North and East Africa cannot be ignored when assessing background dust in East Asia and the Pacific region. Tanaka et al. [48] conducted a numerical simulation with a three-dimensional global aerosol transport model. The simulations showed that the dust particles over East Asia were produced during dust storms in North Africa and the Middle East and were in satisfactory agreement with the measured data. In another study, the long-range transport of Saharan dust to East Asia was systematically investigated from 2007 to 2020 [49]. The results showed that a quarter (24.3 ± 6.2%) of the dust events in East Asia from 2007 to 2020 originated from the Sahara. In addition, Saharan dust over East Asia is usually detected in the upper troposphere, while the average total Saharan dust over East Asia between 2010 and 2015 was estimated to be 9.78 ± 33.05 tons per year [49]. Consequently, global and regional climate models have been extensively utilized for simulations of dust emissions, transport, and accumulation over the Middle East–North Africa (MENA) region (e.g., [50,51,52,53,54,55]).
Sometimes, under favorable meteorological conditions, large quantities of dust enter the Middle East from the African continent (e.g., [7,56,57]). In addition to this transported dust, the activity of many dust sources in the Middle East causes frequent and severe dust storms in this region [58,59,60,61]. Awad and Mashat [62] analyzed the synoptic meteorology patterns associated with the transition processes of dust from North Africa to the Middle East, while Mashat et al. [63] showed that dust from Northeast Africa exhibited a significant contribution to dust events over the Southwestern Arabian Peninsula. Furthermore, dust from the Nubian Desert in southern Egypt and Sudan may highly affect the aerosol loading over the southern Red Sea, Gulf of Oman, and the Arabian Sea [64,65,66], while Somalian dust is a major source for dust particles over the Arabian Sea [67,68]. Although it is especially important for synoptic meteorology, atmospheric dynamics, economic cost, and health effects [69,70], the transport of dust from Africa to the Middle East has received less attention, likely due to several regional and local dust sources over the arid Middle East that contribute to a significant dusty background. Recent studies showed that the presence of dust emitted from Africa causes an increase in damage and the transmission of various diseases in the Middle East [71,72].
The goal of this study is to investigate the meteorological dynamics (atmospheric circulation patterns) affecting intense and pervasive dust transport that entered the Middle East from dust sources in Africa, as well as the associated dust-plume characteristics. So, the main scope is to shed light on synoptic meteorological systems associated with this type of dust transport, which are not well documented in the past. In this respect, four severe dust-storm events during recent years were selected and analyzed using remote sensing observations, reanalysis data, and numerical model outputs. Since dust forecasting plays a fundamental role in atmospheric dynamics, and its accurate and timely forecast is especially important for reducing and mitigating impacts and damages [73], the outputs of ALADIN-Dust and ICON-ART operational dust models, with one to three days forecast leading time, were validated against satellite observations. The study explores the capability of each model to simulate the aerosol loading during dust transport from North Africa to the Middle East. Transported dust plumes over the MENA region are associated and controlled by specific pressure gradients and wind regimes that should be accurately represented in numerical models for satisfactory prediction and forecasting of dust transport. In this respect, the atmospheric circulation patterns and the main dynamic forces that favor the transport of African dust over the Middle East are examined.

2. Materials and Methods

In this study, the seasonal averages of aerosol optical depth (AOD550) from Terra-MODIS satellite sensor (C006.1; combined Deep Blue and Dark Target algorithms) with 1° × 1° spatial resolution (Level 3) over a period of 23 years (2000 to 2022) were analyzed over North Africa and the Middle East. This dataset, which was downloaded from https://giovanni.gsfc.nasa.gov (accessed on 10 January 2024), revealed the approximate locations of dust sources in the northern part of the African continent and coincided with the highest AOD550 values. To determine the possible transport routes of the dust particles, the seasonal averages of the wind vector at 500 hPa were superimposed on the AOD550 spatial distribution maps. The wind field in the mid-troposphere was taken from the National Centers for Environmental Prediction/National Center for Atmospheric Research (NCEP/NCAR) reanalysis [74,75] dataset with 2.5° horizontal resolution during the same period (https://psl.noaa.gov/data/gridded/data.ncep.reanalysis.html; accessed on 10 January 2024).
Moreover, four intense dust-storm events, during which dust particles emitted from North, Northeast, East, and Central Africa entered the Middle East, were investigated from atmospheric and meteorological points of view. The dates of the examined dust events are 24–27 March 2021, 10–12 March 2022, 21–23 May 2022, and 28–29 May 2023, all in the spring season, which is especially active for dust outbreaks over Northeast Sahara and in the Eastern Mediterranean–Middle East (EMME) region [44,76,77,78,79].
The National Oceanic and Atmospheric Administration/Visible Infrared Imaging Radiometer Suite (NOAA-20/VIIRS) true-color imagery from https://worldview.earthdata.nasa.gov/ (accessed on 10 January 2024) was used to detect the transport of the dust plumes over the study area during the four examined cases. The AOD500 values derived from the AERONET CIMEL sun photometer [80] at KAUST_Campus, Saudi Arabia, located on the east coast of the Red Sea (Figure 1), were also analyzed as time series for all dust cases. The AERONET AOD500 data correspond to version 3 and layer 1.5. Furthermore, the vertical profiles of the total attenuated backscatter coefficient at 532 nm and aerosol subtypes were obtained from the CALIPSO (Cloud-Aerosol Lidar and Infrared Pathfinder Satellite Observations; [81]) satellite (www-calipso.larc.nasa.gov/; accessed on 10 January 2024) over the region during the dust-storm events [82,83].
For the synoptic meteorological analysis during the four dust-storm events, geopotential height, and wind vector maps at 500 hPa level, superimposed on Dust RGB (red-green-blue) images, downloaded from the Eumetrain ePort (http://212.232.25.232/ng-maps) (accessed on 11 January 2024) were used. In addition, mean sea-level pressure (MSLP) and 500 hPa streamline maps are presented, aiming to provide a concurrent analysis of surface and mid-atmospheric patterns. Dust RGB images are products of the Meteosat Second Generation (MSG) satellite, while the meteorological data were taken from the ERA-5 reanalysis produced by the European Centre for Medium-Range Weather Forecasts (ECMWF) at 0.25° × 0.25° (https://cds.climate.copernicus.eu/; accessed on 11 January 2024). More details are presented elsewhere [84].
Since the main objective of this study is to examine the long-range transport of dust particles, which usually takes place in the mid and upper troposphere over the EMME region [85], the outputs of the HYSPLIT model (Hybrid Single-Particle Lagrangian Integrated Trajectory; [86]) at 5000 m altitude were analyzed during the four dust-storm events. This model was run for 48 h in a matrix form and for backward air masses using the Global Data Assimilation System (GDAS) atmospheric data with 0.5° horizontal resolution (https://www.ready.noaa.gov/HYSPLIT_traj.php; accessed on 11 January 2024).
The AOD550 outputs of two models, namely ALADIN-Dust and ICON-ART, with 1-, 2-, and 3-day forecast leading times are qualitatively and quantitatively compared with Terra-MODIS AODs. For the quantitative comparison, the statistical indicators Pearson correlation coefficient (R), root mean square error (RMSE), and bias were calculated via the following formulas:
RMSE = 1 N i = 1 N ( F i O i ) 2 ,
Bias = F i O i ,
R = ( F i F ¯ ) ( O i O ¯ ) ( F i F ¯ ) 2 ( O i O ¯ ) 2
In all equations, Fi is the AOD550 output of the model at each grid point, O i is the satellite AOD550 value at the same grid point, N is the total number of grid points in the spatial domain, and the bar symbol indicates the spatial average over all points. It should be noted that the model outputs were rescaled to the MODIS pixels, following a previous study [87]. The bilinear method was used for the interpolation process, which may slightly affect the AOD distribution values. However, since MODIS retrievals also include uncertainties and errors due to algorithms used and the remote sensing process, the comparisons between model forecasts and satellite data should be considered rather qualitatively.

Dust Models

The general specifications of the ALADIN-Dust and ICON-ART models, whose outputs were downloaded from https://sds-was.aemet.es/forecast-products/ (accessed on 11 January 2024) and evaluated in this study, are shown in Table 1. For both models, a brief description is given in the following.
(i)
ALADIN-Dust model
ALADIN (Aire Limitée Adaptation dynamique Développement InterNational) is a spectral hydrostatic model, developed under an international collaboration led by Météo France and is used operationally for weather forecasting. ALADIN is a fully 3D baroclinic system of primitive equations. The main goal of the model is to perform a dynamic adaptation with high resolution on ARPEGE global NWP (numerical weather prediction) model forecasts [89].
In the ALADIN-Dust model, the dust flux is calculated using a modified formulation of the Dust Entrainment And Deposition (DEAD) model [90] tailored to optimize the computational efficiency and compatibility with the other components of the ALADIN model, while maintaining the core functionalities of the DEAD module. The physical parameters in the DEAD scheme are based on the Marticorena and Bergametti [91] scheme, where dust is calculated as a function of saltation and sandblasting. DEAD is imported into the Interaction Soil Biosphere Atmosphere (ISBA) scheme [92] and implemented in SURFEX. Recently, the dust emission parameterization has been improved aiming to better calculate the soil grains distribution [93]. Critical parameters defining dust emissions are:
  • Horizontal dust flux
The horizontal dust flux represents the mass of particles that pass through a vertical surface with infinite height and unit width per unit time. It basically consists of particles that move in the form of saltation. To consider the soil grains distribution in the horizontal flux (G), the relationship of Marticorena and Bergametti [91] is used. Equation (4) assumes that the contribution of each size class to the total flux is directly related to the relative surface area occupied by each class in the soil. Then, the horizontal flux is considered the total relative contribution of different size classes in the particle domain.
G = a · E · c · ρ g · u * 3 D p ( 1 + u * t u * ) ( 1 u * t 2 u * 2 ) dS rel ( D p ) dD p ,
where E is the erodibility fraction of the surface, dS rel ( D p ) is the relative surface, and a = 0.04 is the global mass flux adjustment factor determined by the experimental model. D p , ρ ,   u * , and u * t are the particle diameter, density, frictional velocity, and threshold frictional velocity for the initiation of wind erosion, respectively. The parameter g is the gravitational acceleration.
  • Vertical flux
The vertical flux represents the mass of fine particles that pass through a unit of horizontal surface per unit of time. Many parameterizations have been proposed for the vertical-to-horizontal flux ratio α. Marticorena and Bergametti [91] proposed a relationship according to the amount of fine particles in the soil. Therefore, they calculated this ratio according to the amount of clay for soils with a clay fraction below 20%. Shao et al. [94] proposed a semi-empirical relationship with respect to the potential energies required to break the adhesion forces that maintain fine particles in suspension. These energies are represented by erosion threshold values. Shao et al.’s (1993) [94] parameterization is used in this model, as:
α = F G = 2 3 × ρ p ρ × β γ g [ u * t ( D d ) ] 2 ,
γ = 2.5
β = [ 0.125 × 10 4 ln ( D s ) + 0.328 × 10 4 ] exp ( 140.7 · D d + 0.37 )
where D d and D s are in mm and β > 0.
  • D s : average diameter of particles with saltation (~75 μm).
  • D d : average diameter of suspended particles (~6.7 μm).
(ii)
ICON-ART model
The ICOsahedral Nonhydrostatic weather and climate model with Aerosols and Reactive Trace gases (ICON-ART) uses a modal aerosol microphysics model [95]. The size distribution of mineral dust is shown in the emission scheme with three log-normal modes (Table 1). The mean particle diameters are 1.5, 6.7, and 14.2 μm with standard deviations of 1.7, 1.6, and 1.5 for modes A, B, and C, respectively. The dust emission scheme is based on Vogel et al. [96], adapted by Rieger et al. [97] to consider global soil data (size distribution and soil residual moisture), the state of soil dispersion, and a tile approach used to calculate soil type heterogeneity in coarse resolutions.
In this model, the saltation flux is calculated according to White [98]:
F h ( d p ) = C white · ρ g u * 3 · ( 1 + u * t ( d p ) u * ) · ( 1 u * t 2 ( d p ) u * 2 ) ,
where C white = 0.7 is a linear scaling parameter to match the calculated and measured dust emission flux. u * and u * t are the friction velocity and the threshold friction velocity, respectively. d p and ρ are the particle diameter and density. The parameter g is gravitational acceleration.
The following equation relates the saltation flux to dust emission flux in the aerosol model [99]:
F v , l ( d p ) = π 6 · ρ p · d 3 , l 3 · P l ( d p ) · β kin · F h ( d p ) e l ,
where β kin = 163   ms 2 . The quantity β kin · F h ( d p ) is the kinetic energy of the particles with saltation and e l is the adhesion energy of model particles. P l is the percentage of kinetic energy expended to free the particles of mode l and is calculated based on adhesion energies, as summarized in Alfaro and Gomez [99]. These percentages of kinetic energy are chosen so that when the friction velocity exceeds the threshold friction velocity, the particles in the largest mode are emitted first. As the friction speed increases, the share of smaller particles that are emitted is increased as well. The weighted integral of equation (Equation (10)) in all diameters of saltated particles based on their cross-sectional area gives the total dust emission flux ( F tv , l ) of the model:
F tv , l = fr e · s = 1 4 F v , l ( d p ) · π 4 · d p 2 · n s ( d p ) π 4 · d p 2 · n s ( d p ) d   lnd p d   lnd p ,
With the term n s ( d p ) , the soil dispersion state is considered. Detailed information about the dust cycle and other parameterizations in the ICON-ART model can be seen elsewhere [96,97,100].

3. Results and Discussion

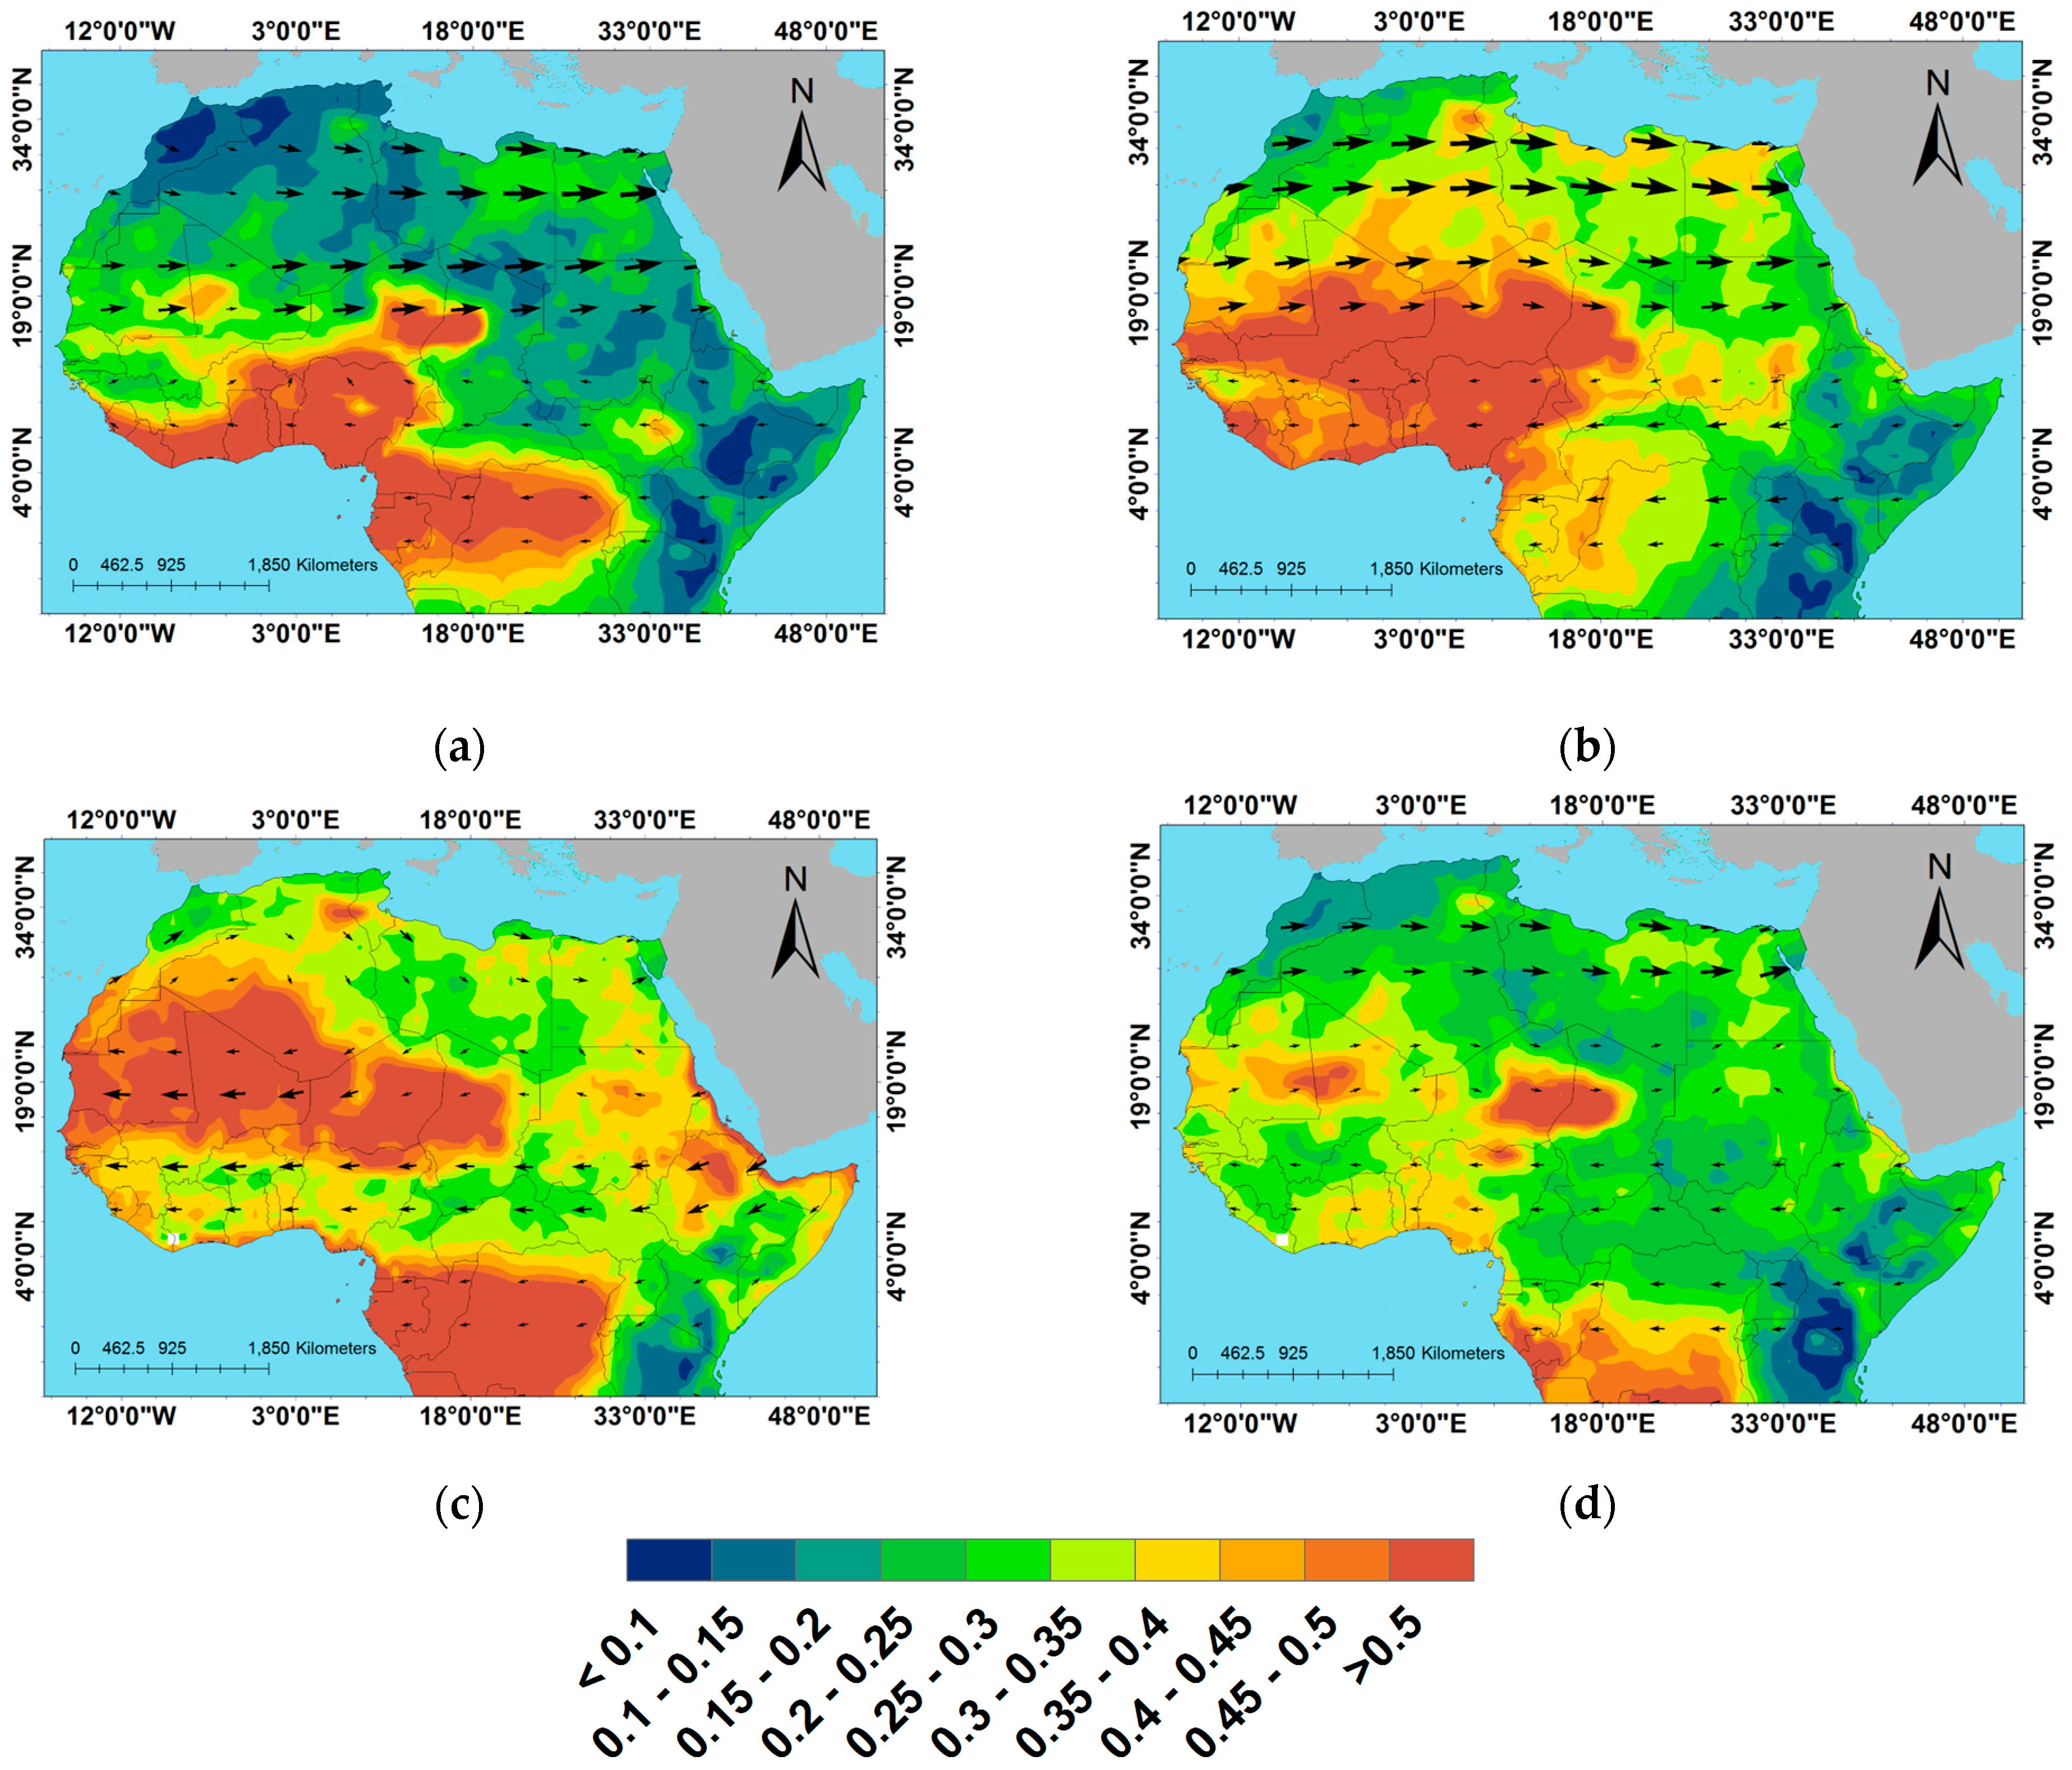
3.1. Dust Sources in the Northern Part of the African Continent

Figure 2 shows the spatial distribution of the seasonal mean AOD, superimposed with the 500 hPa wind vector, for a period of 23 years (2000 to 2022) over central and North Africa. As expected, due to dust presence over the Sahara Desert, the highest AOD values in this region occur in the summer and spring seasons. In general, the AOD value is higher in the west of the African continent than in the east, due to the larger and more active deserts in that part that emit dust toward the Atlantic Ocean and the Americas [29,31,101].
In winter (Figure 2a), despite the strong westerly winds over the North African deserts in the mid-troposphere, the generally low AOD values suggest limited dust presence, since some strong dust events occur rarely and under certain meteorological conditions, associated with strong cyclones that transport dust toward the central Mediterranean, Balkans, and the Levantine Basin [39,77,102,103]. Spring season (Figure 2b) is active for dust transport from the Sahara Desert toward the Eastern Mediterranean Basin, since due to the passage of the Sharav cyclones across the North African coast [41,76,79,104], the deserts in Libya and Egypt are especially active, presenting higher AODs compared to the rest of the year. The wind speed in spring is significantly higher and its zonal westerly flow over North Africa facilitates significant amounts of dust to be transported over the Middle East countries [62]. The wind regime is much weaker in summer and is also shifted in direction, creating the Harmattan winds blowing toward the west/southwest (Figure 2c). This wind pattern facilitates dust transport mostly toward the Atlantic Ocean and the American continent. Several studies have examined the meteorological dynamics during dust transport from the west coast of North Africa to the Atlantic through the African easterly waves (AEW) in summer (e.g., [105,106,107,108]). Over Africa, the AEWs propagate in two paths on either side of the African easterly jet (on the southern flank of the Sahara and in the rainy zone) [109,110,111] before they emerge over the ocean. The high AODs over Central Africa (Kongo tropical forest and surroundings) in summer are due to seasonal forest fires over the region, as also observed in winter and autumn but to a lesser degree. On the other hand, high AOD values are shown over the Nubian Desert and Ethiopia, Somalia, and along the African coast of the Red Sea. The summer meteorological conditions over this region facilitate the transport of dust from these areas toward the southern Red Sea, Arabian Peninsula, and Gulf of Aden, through the dominant westerlies (Tokar Gap jet) and the southwest monsoon flow off the coast of Somalia [65,67]. The AOD values in autumn (Figure 2d) decreased significantly compared to summer all over North Africa, while only the Bodélé depression in Chad [112] remains active, which, however, does not seem to significantly affect Eastern Africa and the Middle East. The northeast African deserts in Egypt and Sudan exhibit moderate dust AODs. The wind speed also shows a relative decrease in most parts of the Sahara Desert, while along the North African coast, it shifts again to westerly directions, enabling it to transport dust over the Middle East under certain circumstances.
Gherboudj et al. [113] identified new dust sources such as the Nogal Valley in the Horn of Africa, the Aljafra plain and the Nafusa mountain slopes at the Tunisia-Libyan borders, the northwestern slopes of the Tibesti mountains at the Libya-Chad border, the Sebkhet te -n-Dghâmcha region in Mauritania/the western Sahara border, the Wadi Howar in Central Sudan, and the West Algeria region. Furthermore, similar to previous studies (e.g., [6,114,115,116]), the highest amount of dust emissions originated from areas with abundant river and alluvial deposits such as the Bodélé depression in Chad, the Qattarah depression in Egypt, the Chott el-Jerïd in southern Tunisia, the Chott Melghir in Northeastern Algeria, and the Nubian Desert in Sudan. In addition, the current results referring to the AOD and wind vector (500 hPa) climatology over North and Central Africa show that the dominant wind regime in the mid-troposphere is a westerly zonal flow from the North African deserts toward the Middle East. However, this prevailing wind flow does not guarantee dust transport, which is favored under specific conditions of enhanced emissions—associated with high AODs—due to dynamic mechanisms within the lower boundary layer and close to the desert surface [56,117,118].

3.2. Case Studies

This section examines the transport of intense dust plumes from North Africa to the Middle East, mostly from the meteorological and atmospheric points of view. Four case studies (spring dust events) are analyzed here, since in this season the dust activity maximizes over North Africa, thus affecting the Middle East.

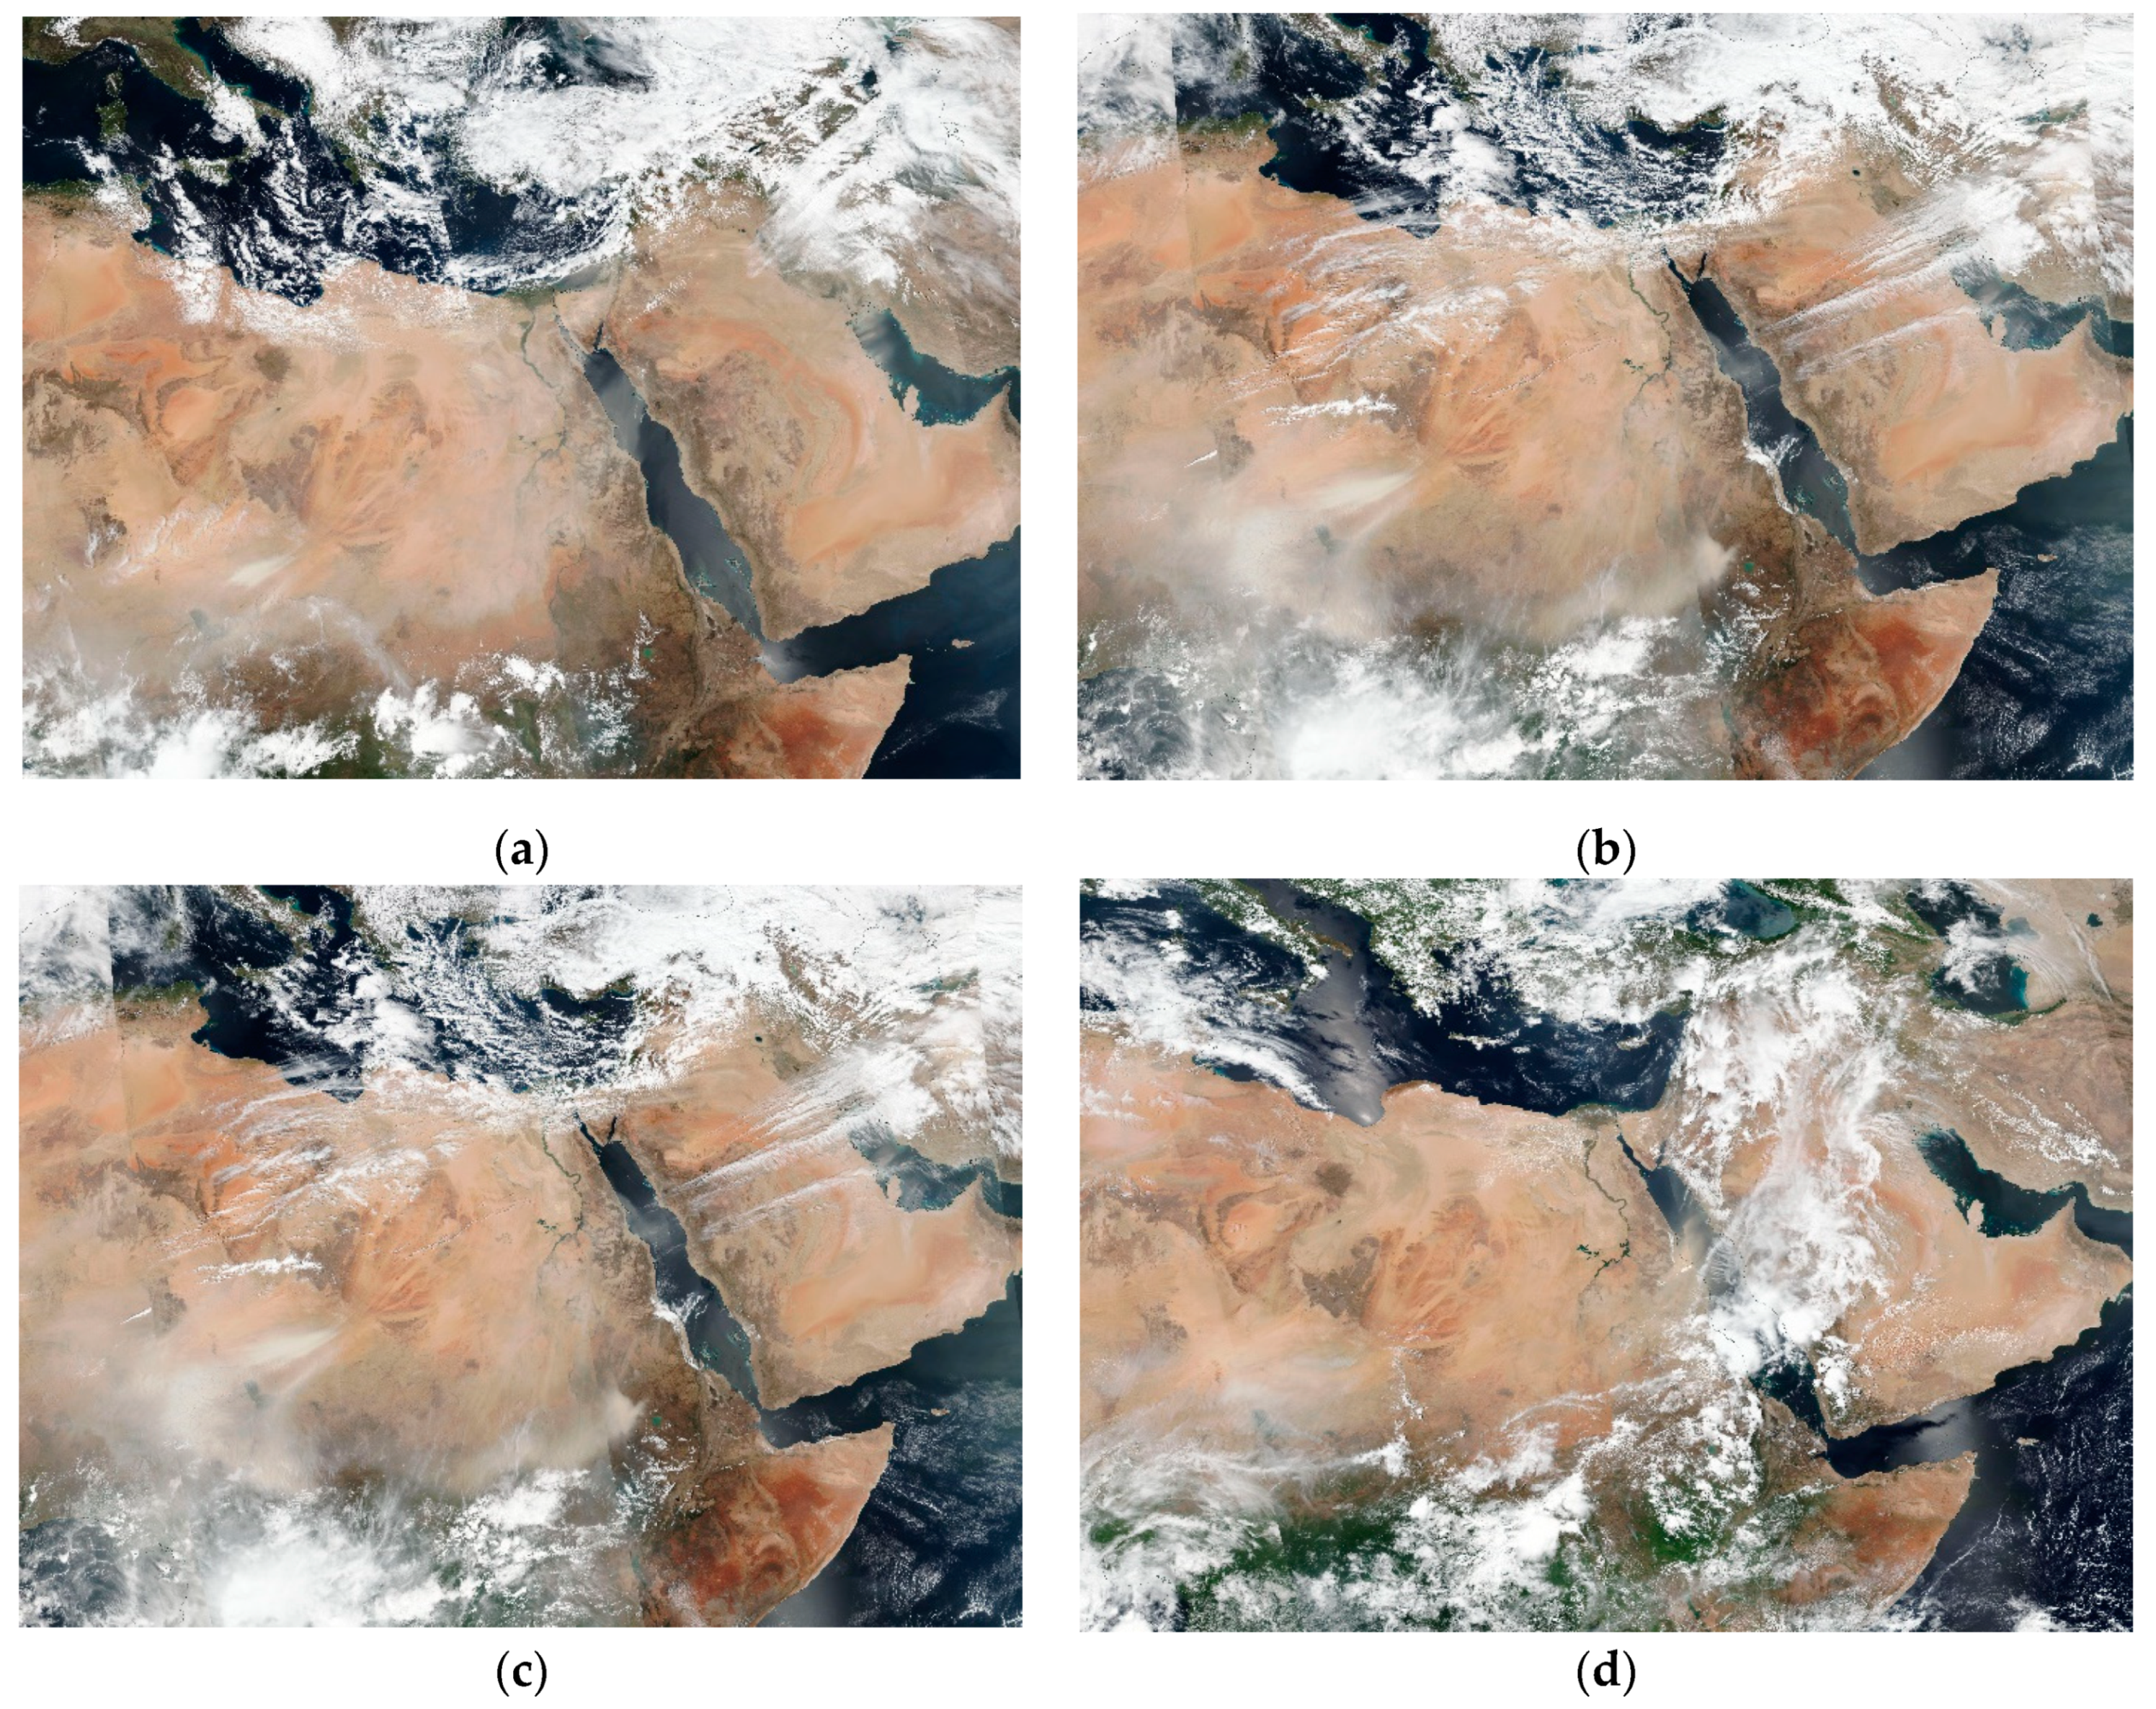
3.2.1. Satellite Images

The true-color images of the NOAA-20/VIIRS satellite sensor during the four examined case studies are shown in Figure 3. On 24 March 2021 (D1), a dust mass moved from the central and northeastern regions of Africa to the southern shores of the Mediterranean Sea and the northern half of the Red Sea, affecting Northwest Saudi Arabia. In the following days, dust rising from Africa entered the Mesopotamian plains, Southwest Iran, and the Persian Gulf, indicating an eastern propagation of the dust plume. On 11 March 2022 (D2), an intense dust mass was loaded in the central and eastern regions of Africa and was transferred to the central parts of the Red Sea and Saudi Arabia and then to other parts of the Middle East, in the form of atmospheric rivers along specific dust corridors, as detected in previous studies [38,119]. On 21 May 2022 (D3), dust was emitted from East Africa, the western shores of the Red Sea, and an area located in the Horn of Africa, and entered the southern part of the Red Sea, also affecting southwestern parts of the Arabian Peninsula and beyond. On 29 May 2023 (D4), three dust masses were observed in North, Northeast, and Central Africa, which were transported toward the Middle East through westerly and southwesterly currents. The main dust plume was traveling over the Middle East along with a distinct cloud presence that suggests propagation of a frontal dust storm over the region, as shown in previous studies [87,120,121].

3.2.2. AERONET Data

Figure 4 shows the AOD values at 500 nm measured at the AERONET station located in KAUST_Campus, in Western Saudi Arabia during the four examined dust events. In D1 (Figure 4), the AOD values gradually increased up to ~0.58 from the first hours of 24 March 2021, while they exhibited a sharp decrease from the noontime of 25 March. As shown in Figure 4, during D2, the AOD presented a sharp increase from around 5:00 UTC on 11 March 2022, reaching values above 0.6, signaling the arrival of a dust plume, while its values gradually decreased afterward to background levels of about 0.3 for springtime AOD over the arid Middle East [122,123,124,125]. In the D3 event (Figure 4), the AOD values increased suddenly from the end of 19 May 2022 and reached more than 1 at 6:00 UTC on 20 May, highlighting the intensity of this dust event and its proximity to the measuring station, as also seen in the satellite imagery (Figure 3c). The high AODs remained until the morning hours of 23 May, suggesting a long-lasting dust transport from Northern Africa toward the Arabian Peninsula and the Middle East. The westerly and southwesterly winds prevailing over Northeastern Africa support the transport of dust to the measuring point. During the fourth examined dust event (D4), the background atmosphere on 28 May 2023 (AOD = 0.2) was highly burdened by an intense dust storm that affected the site and increased the AOD up to 1.2. After the peak of the dust plume passage over the site, the AOD gradually decreased and increased again (0.7–0.8) after 2–3 days, indicating long-lasting dust influence over the Western Arabian Peninsula (Figure 4).
In all the examined cases, the AODs increased on the dusty days, even compared to a high dust-AOD background, indicating transported dust over the western Arabian Peninsula. In all cases, just before the arrival of the dust plume (signaling the AOD increase), a relative decrease in AOD values is observed, which may be related to enhanced winds from the Red Sea marine sector [66,126]. Note also that the background AOD over the study region in March (D1 and D2 episodes) is significantly lower than that in May (D3 and D4 episodes) when the dust activity maximizes over the Arabian Peninsula [44,63,70]. The North African dust transported over the Arabian Peninsula and the Middle East may also accumulate over the Arabian Sea [67,85], thus contributing to atmospheric heating and to a series of thermodynamic processes that affect the regional climate, monsoon flow, and rainfall in Central Asia and the Indian subcontinent [127,128,129]. However, a possible contribution of the African dust to these atmospheric dynamic processes has not been examined yet and such research constitutes a real challenge due to the different mineralogical composition and absorbing characteristics between the North African and the Arabian dust [118,121].

3.2.3. CALIPSO Profiles

CALIPSO observations of the aerosol profiles in the atmosphere are especially helpful for monitoring the vertical distribution of dust, which travels at elevated layers in the atmosphere [83,130,131]. Furthermore, the CALIPSO product of the aerosol subtypes in the vertical helps in understanding the type of aerosol and dust presence [132]. In this respect, Figure 5a,b show the vertical profiles of the backscatter coefficient and the identified aerosol types over the study region during the D1 dust event (25 March 2021). At the northern latitudes (~23°–26° N) over North Sudan/Egypt, apart from the dust layer near the surface, an elevated dust plume with significant intensity is also shown traveling at 3–4 km, carrying dust from North Africa to the Middle East. Aerosols were identified as mixing of dust (yellow) and polluted dust (brown). During this event, an elevated dust plume is notable at about 22° N, signaling significant dust transport over the Red Sea and the Arabian Peninsula at elevated heights. On the other hand, the backscatter coefficient values near the surface were also high due to increased dust activity over North Africa during the spring season.
On 12 March 2022 (D2; Figure 5c), the dust aerosol plume was mostly within the boundary layer (<2.5 km) over North Africa, also characterized by significant backscatter coefficient values (5–7 × 10⁻³ Mm−1 sr−1). At around 19–20° N, an elevated dust plume is also shown, thus favoring the transport over longer distances, although its intensity is much weaker than the previous case. It is seen that dust can be transported even at lower altitudes and affect Saudi Arabia after crossing the Red Sea, but its potential to reach long distances is rather limited. Nearly the whole area was under the influence of pure and polluted dust, based on aerosol-type data (Figure 5d).
During D3 (23 May 2022), daytime CALIPSO observations showed an extensive dust plume from the surface up to 5 km along the central and southern parts of the Red Sea (latitudes 12°–22° N), with a high potential to be expanded in the mid-troposphere (Figure 5e). This indicates the existence of significant upward movements capable of the vertical uplift of the dust plume and its higher potential to be transported at distances farther from the source. At northern latitudes, i.e., over the northern part of the Red Sea, the dust layer was observed at lower altitudes, implying that the elevated dust plumes at the southern regions were under the influence of the Tokar Gap jet, which controls the African dust transport over the southern Red Sea and South Arabia [65]. Note also the higher backscatter values within the elevated rather than the surface dust plumes in this case. Of course, high values near the surface show that dust was still emitted from these areas. As the satellite track approached the Mediterranean Sea, sea salt aerosols (blue) mixed with dust were also observed over the lowest marine boundary layer.
As shown in Figure 5g, in the last case (D4) on 28 May 2023, due to the presence of thick clouds at high altitudes in the atmosphere, the aerosol layers cannot be defined. However, around the latitudes of 20° to 25° N, cloudless CALIPSO observations indicate the presence of dust plumes up to 5 km in height, which are crossing the Red Sea toward the Arabian Peninsula.

3.2.4. Synoptic Analysis

This section examines the meteorological conditions and the atmospheric circulation patterns that prevailed during the four dust events. The left column of Figure 6 shows Dust RGB (red-green-blue) images superimposed with geopotential height and wind vectors at 500 hPa, while the right column shows the MSLP conditions along with the streamlines at 500 hPa for each case.
In case D1 (24–26 March 2021), a closed low geopotential height system was located over Turkey, western Black Sea, Ukraine, and Southern Russia at 500 hPa at 00 UTC on 26 March 2021 (Figure 6a). The axis of the trough extended to North Africa and was tilted in the northeast–southwest direction. A small area of Northeastern Africa and a large part of the Middle East were located in front of the trough axis, where upward air motions are facilitated by the synoptic conditions. On the other hand, the sub-tropical high was located in Southern Saudi Arabia and East Africa. Therefore, a strong geopotential height gradient was observed between Northeast Africa and the western parts of the Middle East, which caused strong winds (~45 m/s) in the middle troposphere over these areas. The mid-level streamlines clearly show the westerly–southwesterly flow over North and Northeast Africa, which favored the long-range transport of dust from Africa to the Middle East. The Dust RGB image shows dust presence over Northeastern Africa and a large part of the Middle East. In the MSLP map (Figure 6b), an anticyclone was located over the central Mediterranean, whose ridge reached Northeast Africa. In addition, thermal low-pressure centers prevailed over East Africa, the southern part of the Red Sea, and the Arabian Peninsula. Their combination with the higher pressures to the northwest induced a strong pressure gradient, which caused strong surface winds and dust emissions from these areas. The pressure gradient between the western Azores High and the low pressure over the Arabian Peninsula was introduced as an important factor for dust transport from Africa to Asia [62].
In the case D2, a deep closed low was located over southeastern Europe and Turkey at 500 hPa at 00 UTC on 11 March 2022 (Figure 6c). This low was the eastern branch of a mid-level omega blocking over Europe and was associated with a strong geopotential height gradient over the Eastern Mediterranean Sea and Northeastern Africa. The strong westerly winds over the latter region (Figure 6c,d) transported dust particles to the Middle East (as shown in the satellite imagery). Also, relatively strong southwesterly winds over East Africa and the western shores of the Red Sea caused the dust transport from this region to the southern part of the Red Sea and Saudi Arabia, in line with the Dust RGB image (Figure 6c). Increased dust concentrations over the southern part of the Red Sea, originating from the northeast African deserts due to westerlies (Tokar Gap jet), is a common meteorological scenario during the summer season [65].
In case D3, a cut-off low at 500 hPa was located over the Eastern Mediterranean Sea at 00 UTC on 21 May 2022 and its trough extended over Northeastern Africa (Figure 6e). The dust observed in the satellite image over the southern shores of the Mediterranean Basin was transported to the Middle East by the westerly–southwesterly winds. Moreover, a dust mass was located on the western shores of the Red Sea and was transported to the Red Sea and then to Saudi Arabia by the southerly and southwesterly winds in that region. The MSLP pattern (Figure 6f) showed a thermal low-pressure system to prevail on the western shores of the Red Sea. The rising motions in its center caused dust emissions from these areas, while the mid-level streamlines (Figure 6f) indicate the wind flow that transported dust from Africa to the Middle East.
At 12 UTC on 28 May 2023 (case D4), a low-pressure center was located over the Eastern Mediterranean at 500 hPa (Figure 6g), and its trough penetrated to Northeastern Africa. A ridge that reached the Caspian Sea can be seen over a large part of the Middle East. In the Dust RGB image (Figure 6g), a very dense dust mass is apparent on the western coast of the Red Sea, located on the eastern flank of a surface thermal low (Figure 6h). The strong southwesterly upper-level winds (Figure 6h) that resulted from the combination of the ridge with the Eastern Mediterranean low facilitated the transport of dust toward the Middle East.
In general, the Mediterranean cyclonic systems, which are caused by the temperature contrast between the coastal areas of North Africa and the Mediterranean Sea, have been recognized as one of the main causes of dust transport over North Africa, with a direction to Southern Europe, especially in spring [79,102]. Furthermore, Washington and Todd [112] stated that one of the controlling factors for dust emissions from the Bodélé depression in Chad is the anticyclones that form from the Mediterranean Sea and Libya on a multi-day scale. The current analysis reveals that the presence of a low-pressure center over the Eastern Mediterranean, associated with a trough penetrating over Northern Africa, are the major dynamic factors that facilitate the transport of dust from the North African deserts toward the Middle East through westerlies in the mid-troposphere. These results agree with Mashat et al. [133], who focused on the dust storms that affected northern Saudi Arabia in spring.

3.2.5. HYSPLIT Back Trajectories

The HYSPLIT model was executed in matrix form, using the GDAS analyses with 0.5° × 0.5° (latitude–longitude) horizontal grid-spacing for all cases, in order to produce 48 h backward trajectories for each dust case. The matrix was selected over an area with notable dust accumulation based on satellite imagery. Figure 7 illustrates the trajectories that reached the area of interest in each case at an altitude of 5000 m agl, superimposed on the Terra-MODIS true-color images on the same day. The model output showed that on 26 March 2021 (Figure 7a), the origin of the dust plumes that reached Western Saudi Arabia was from the central regions of the Sahara Desert and East Africa. The satellite imagery on 24 March 2021 (Figure 3a and Figure 6a) suggested that the dust rising from the northern regions of Africa also reached the Middle East. In addition, the output of the HYSPLIT model on 12 March 2022 (Figure 7b) showed that the main source of dust transported to the east of the Red Sea was the Sahara Desert. In the third case (Figure 7c), the origin of dust was in the southern regions of the Sahara and East Africa. Furthermore, in this case, a part of the dust entered the Red Sea from the Southern Arabian Peninsula in a clockwise direction. On 29 May 2023 (Figure 7d), dust entered the Middle East from North Africa, the central regions of the Sahara, and the western shores of the Red Sea. In all the cases, the HYSPLIT back trajectories were in good agreement with the satellite imagery regarding the transported dust plumes from North Africa to the Middle East.

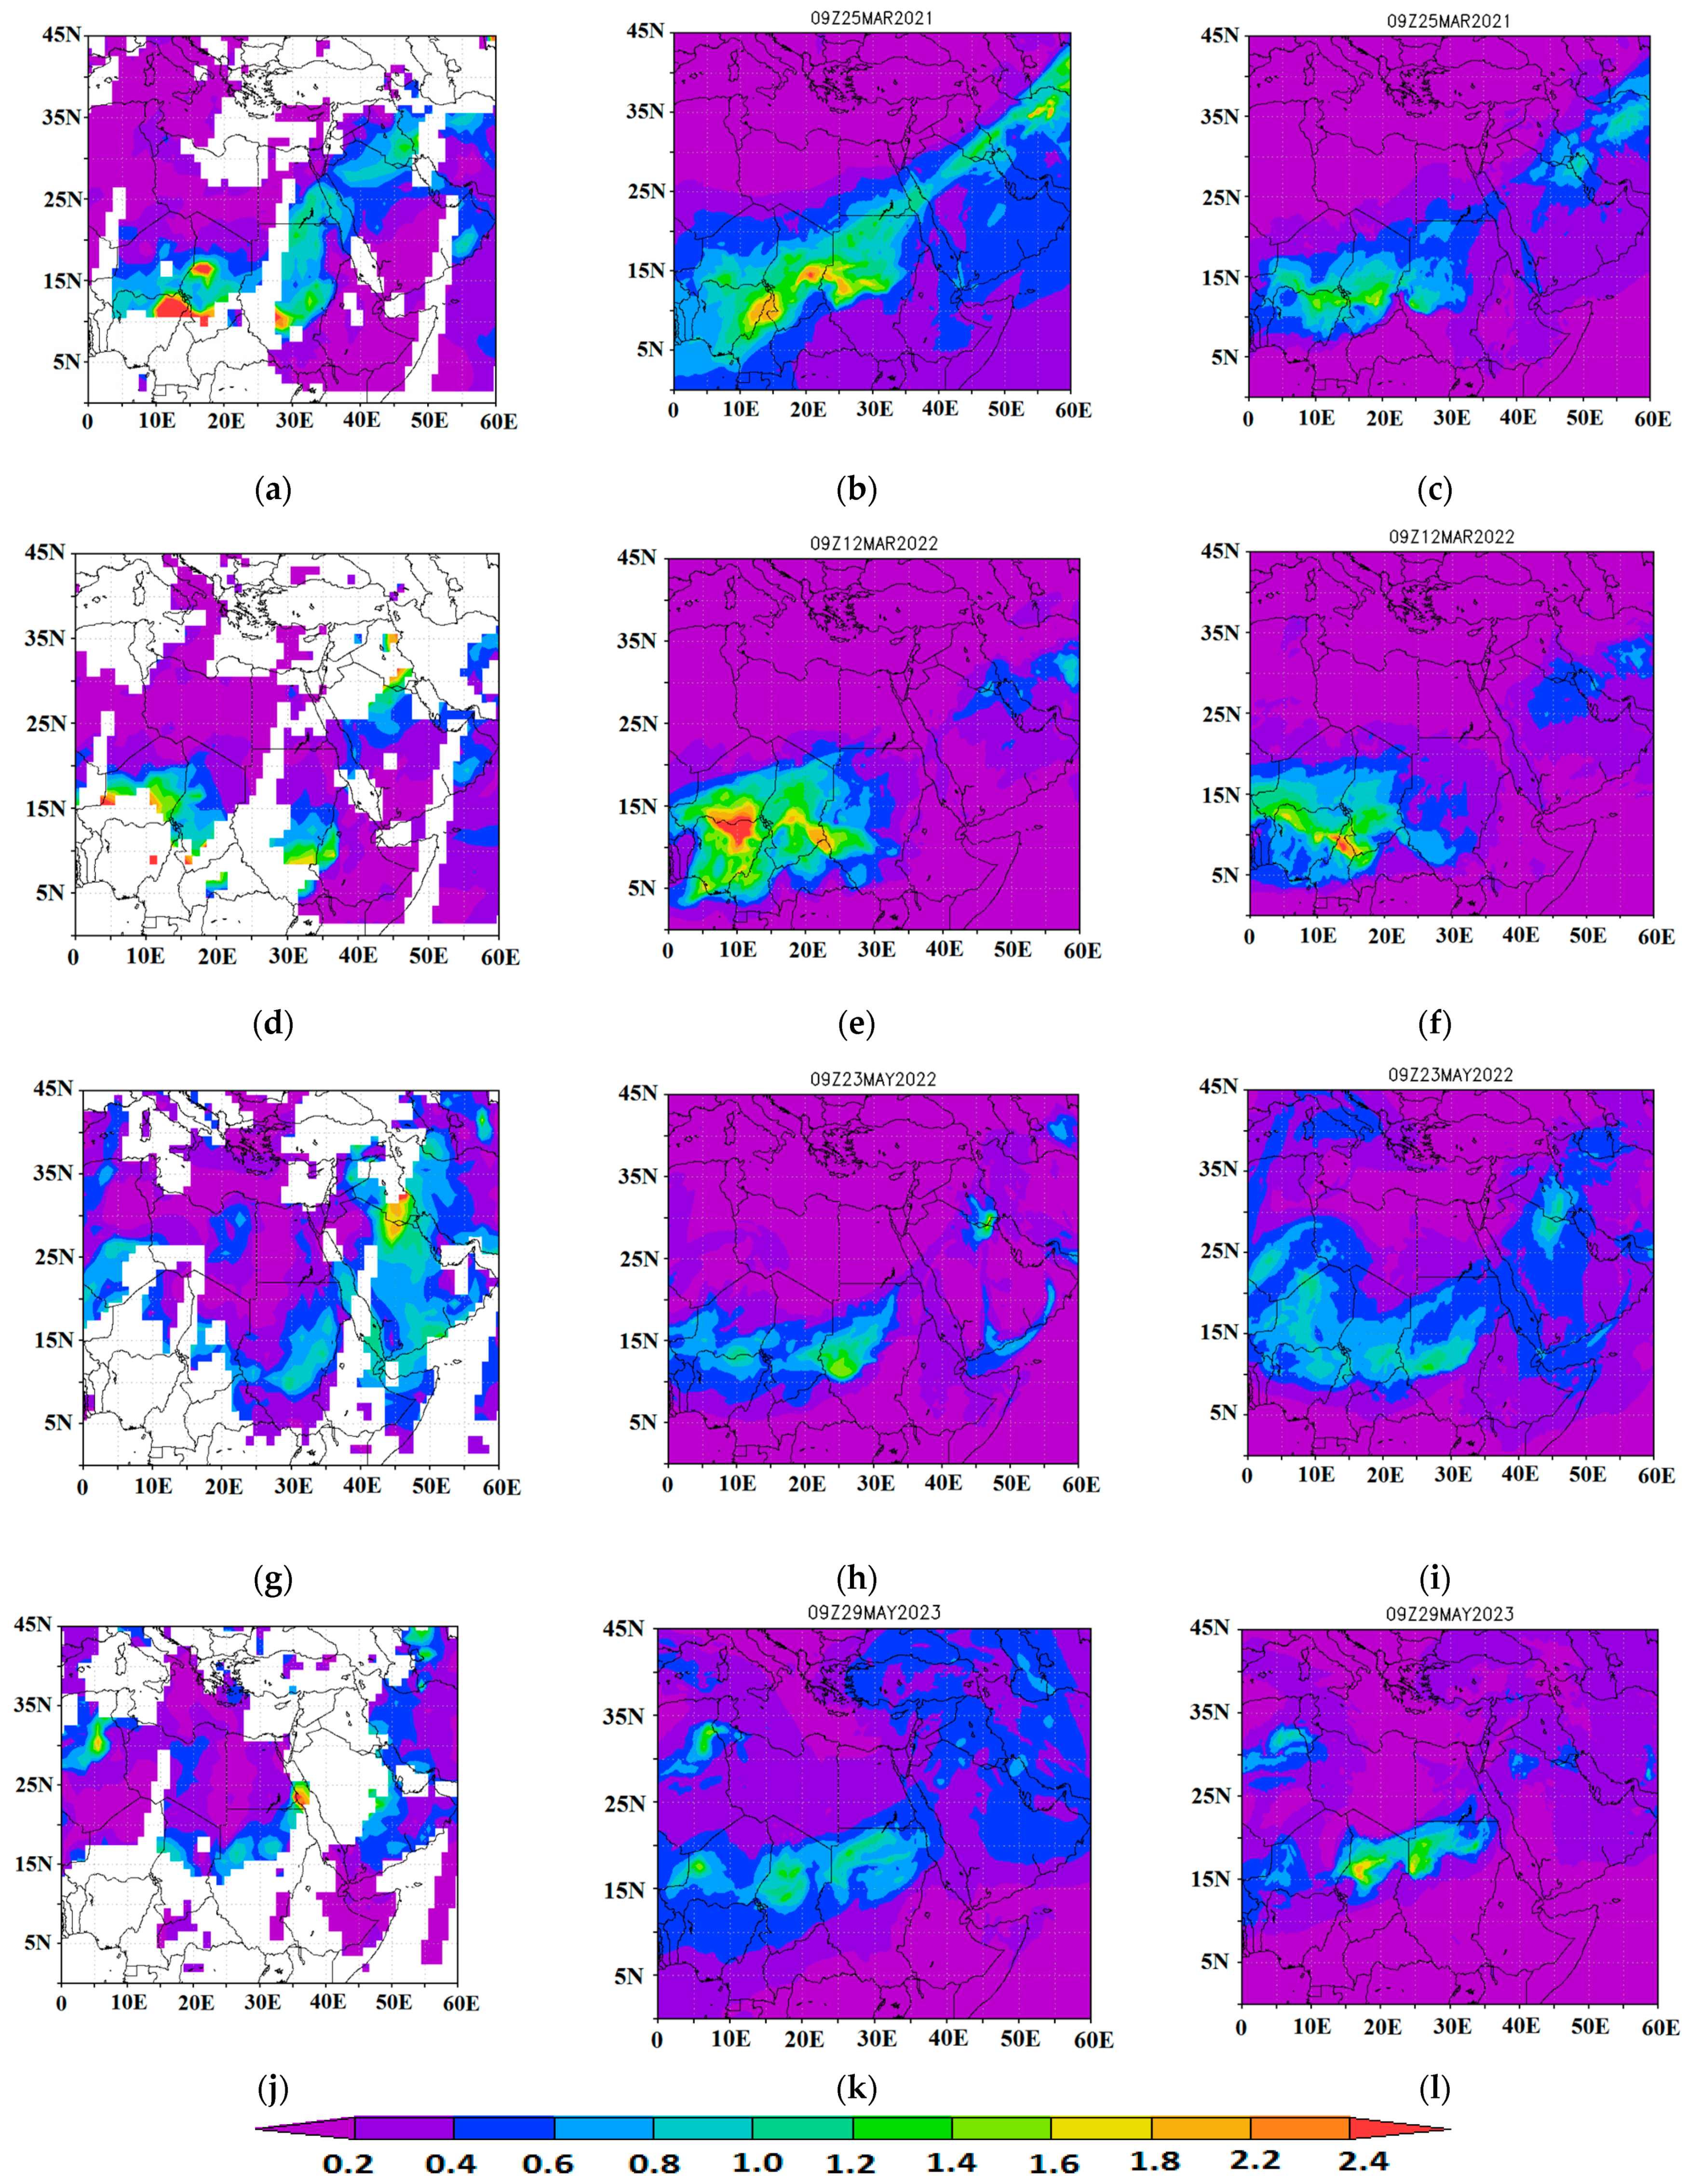
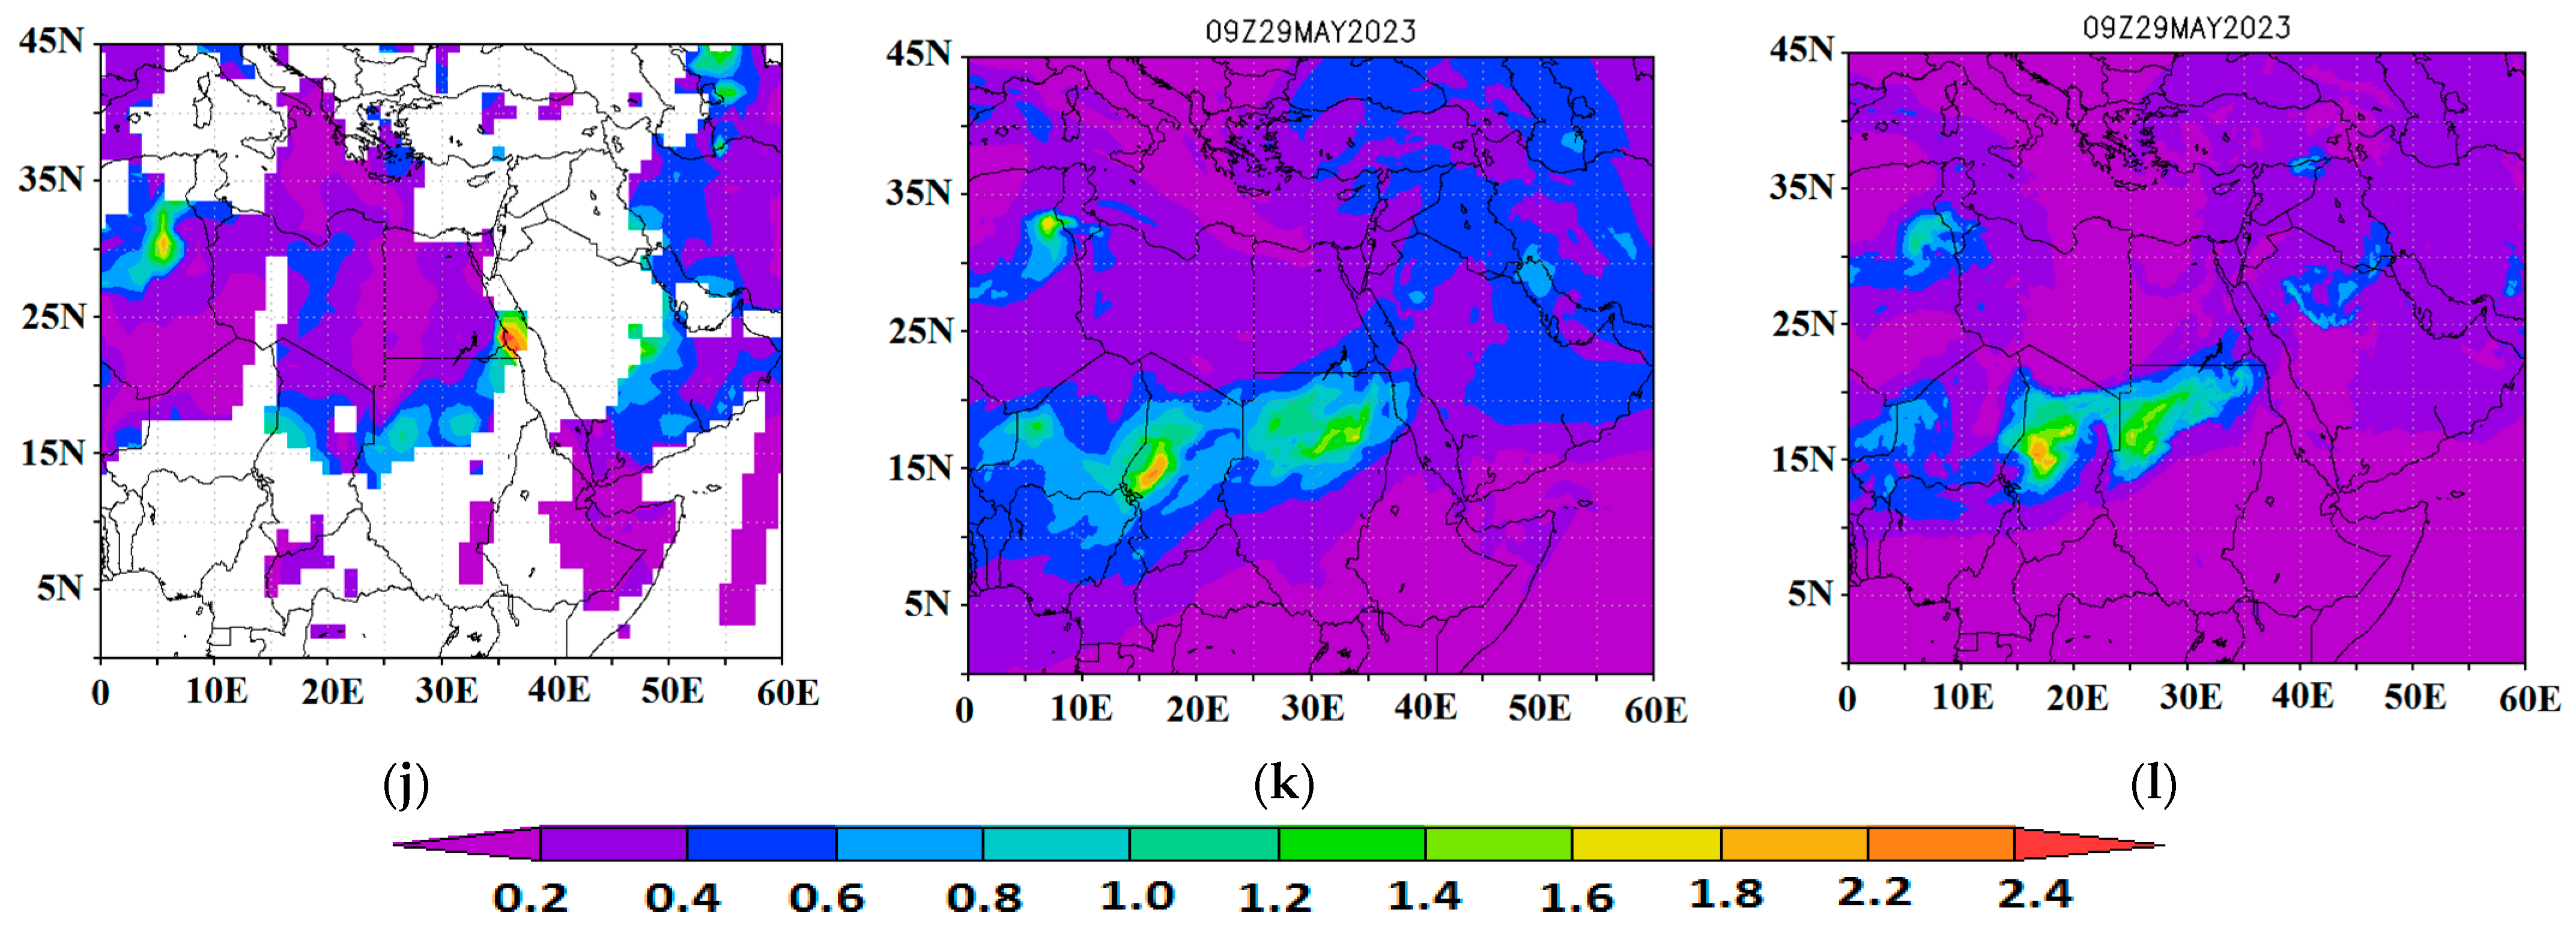
3.2.6. Analysis of Dust Forecasting Model Outputs

Satellite data and products have been widely used to evaluate the dust forecasting model outputs (e.g., [121,127,134,135,136]). In this section, the AOD outputs from the ALADIN and ICON models with 33 and 57 h leading time each were compared with the Terra-MODIS satellite AOD retrievals. Since the approximate overpass time of Terra over the study region is around 09:00 UTC, the outputs of the two models were considered and evaluated at this hour. Due to the presence of clouds over the study area, satellite AOD values are not available in some parts of the study domain. It should be noted that the valid times in Figure 8 and Figure 9 are 09:00 UTC on 25 March 2021, 12 March 2022, 23 May 2022, and 29 May 2023 for D1, D2, D3, and D4, respectively. Therefore, the initial times of the models for 33 h leading time are 00:00 UTC on the previous day, and for 57 h forecasts are 00:00 UTC two days before, respectively.
In case D1 (Figure 8a–c), the ICON model underestimated the AODs over Saudi Arabia and revealed discrepancies regarding the simulations of dust intensity over this region, although it represented the dust-plume distribution and the main dust sources over the central Sahara region fairly well. On the other hand, the ALADIN model seems to provide more accurate AOD simulations compared to MODIS. In the 33 h forecast, there was a relatively large difference between the two model outputs. In D2, the AOD patterns in the two models’ outputs were mostly similar, but the simulated values from the ALADIN model in the central regions of Africa were a little higher. In the Middle East region, both models simulated enhanced dust AODs over the lower Iraqi Plains and in Kuwait, similarly to MODIS observations, although the enhanced cloudiness over the northern parts of the Middle East obscured AOD retrievals from the satellite. In D3, the ICON model forecasted higher AOD values over the region, especially over Saudi Arabia and southern Iraq, along the An-Nafud Desert, while the simulations were close to the satellite products. The ALADIN model showed an enhanced presence of dust over a small region in southern Iraq and Kuwait and along the southern edges of the Rub-Al-Khali Desert. In D4, although the maximum AOD over the central-eastern Sahara was higher according to ICON forecasts, a wider part of this region presented higher AODs in the ALADIN model outputs.
In general, the AOD patterns for the 57 h leading forecast time (Figure 9) were very similar to those presented for 33 hrs leading time. In D1, the AOD values over Africa increased in ALADIN outputs but decreased slightly in ICON outputs compared to the second forecasting day. Regarding D2, the AOD outputs of the two models were very similar, but ALADIN forecasted higher AODs over the main dust sources in the Chad depression, also being slightly higher compared to the previous day. Decreased amounts of dust were simulated by both models over the central Middle East region, indicating a dissipation of the dust storm coming from Africa after a 3-day period. In case D3, both models slightly underestimated the AOD over Africa, and the difference between their outputs and satellite observations increased. Furthermore, ICON better represents the satellite image compared to ALADIN, especially over the Arabian Peninsula (Figure 9g–i). In case D4, the performance of the ALADIN model was better in East Africa and it predicted slightly higher AODs. Overall, the dust forecasting for a 57 hr leading time was similar to that for a 33 hr leading time, while notable differences were observed between ALADIN and ICON models over Central Saudi Arabia and the Middle East.
Based on the literature of dust simulations over the Middle East and in other desert regions, accurate identification of the dust sources, correct representation of the meteorological synoptic patterns and variables such as wind speed, soil moisture, topography, atmospheric stability, and dust particle size are among the most important factors that control the accuracy of dust forecasting [36,56,90,137,138,139,140]. Uncertainties in simulations of dust AODs during intense dust-storm events are attributed to biases in surface characteristics, soil moisture, vegetation cover, dust mineralogy, clay/silt/sand fractions, the source functions used in each model, and the initial and boundary meteorological conditions, thus resulting in differences between dust simulations and forecasting from various models [55,134,141,142,143,144]. Uncertainties in the prediction of wind patterns from local to synoptic spatial scales result in large biases in predictions of dust emissions and transport pathways of the dust plumes [87,145,146,147].
Figure 10 shows the scatter plots of the AOD values from the ALADIN-Dust and ICON-ART model outputs compared with the respective AODs from Terra-MODIS observations on the first, second, and third forecast day for all grid points in the study domain during the four dust events. Based on the results, the ICON model exhibited larger error and increased bias in forecasting the higher AOD values, since it underestimated them. Karami et al. [136] reported that the underestimated AODs near the dust-source regions generally indicate an incapability of the models for accurate representations of several factors such as soil properties, land susceptibility to wind erosion, threshold friction velocity, and meteorological factors controlling dust emissions in the desert terrains, while Mostamandi et al. [140], highlighted the role of underestimation of the coarse particles to light attenuation. Similar results of model AODs underestimation were revealed and discussed for six dust storms in the Middle East, simulated via the CAMS (Copernicus Atmosphere Monitoring Service), WRF-Chem (Weather Research and Forecasting model coupled with Chemistry), and RegCM4 (Regional Climate Model) models [121]. Regarding the lower AOD values, the performance of the ICON model was slightly better than ALADIN and the points are less scattered. In general, ICON presents a slightly better dust simulation, with larger linear correlation coefficient (R) values (0.64–0.67) compared to ALADIN (0.58–0.63), as also shown for the RMSE and bias values. This may be attributed to better forecasts of atmospheric variables such as wind speed, synoptic meteorological patterns, or the amount of surface dust emissions. It is plausible that both models lack certain mechanisms, which could likely introduce biases in dust modeling and forecasting [148,149]. Since many factors are involved in the dust forecast, identifying the exact factor of error is a challenging task that requires extensive research beyond the scope of this article [56,73].
The model results of the first and second forecast days did not show notable differences but on the third day, the distribution of the data points, especially from the ALADIN outputs, slightly increased, thus causing larger errors in dust simulations with decreased r and increased RMSE values (Figure 10). Further analysis revealed that the 3-day forecast of ALADIN presented a higher standard deviation compared to the other cases. Therefore, the comparison of forecasts with different leading times revealed that with the increase in the forecasting time interval, the uncertainties in both models slightly increased.
Previous evaluation of the performance of nine operational dust models against Terra-MODIS and AERONET AODs in forecasting various dust storms with different synoptic characteristics over the Middle East showed similar results of model underestimation, especially close to the dust-source areas [87]. Furthermore, Karami et al. [136] utilized three models (WRF-Chem, Dust REgional Atmospheric Model—DREAM-NMME-MACC, and CAMS) for simulations of dust storms originating from dried lakebeds in the Aral Sea and in Sistan, Iran. The models presented significant underestimations of the highest Terra-MODIS AODs, near the dust-source regions. In addition, significant biases were also observed for dust simulations over Iraq through the WRF-Chem, DREAM, and MACC models [143], while large deviations in AOD values were observed through simulations with the NMMB/BSC-Dust model—compared to AERONET AODs—at stations in the Middle East during a dust storm on 17–20 March 2012 [142]. On the other hand, satisfactory dust simulations during several dust storms were observed from the WRF-CHIMERE model over the Arabian Peninsula [150]. Numerical models using MODIS data assimilation schemes such as NASA_GEOS (National Aeronautics and Space Administration _ Goddard Earth Observing System) and DREAM8_MACC were found to lead to better performance in dust forecasting in the Middle East [87].
It should be noted here that AOD calculation in the dust forecasting models is a difficult task as it relates uncertainties of the absorbing and scattering properties of dust, the particle size distribution, the fine-mode fraction, and the complex refractive index, which contribute to the AOD values [87,140]. Furthermore, the MODIS AOD data are also associated with uncertainties in their retrievals, especially over arid/desert terrains with high surface albedo, so the model’s validation should be treated with caution, and the statistical indicators were obtained against a value also associated with biases [136], despite several studies reporting satisfactory agreement (errors within ± 20%) between MODIS and AERONET AODs over the Middle East [143,151,152,153]. On the other hand, AOD values can be influenced by various aerosol types, except dust, despite the predominance of dust over the arid/desert MENA region in spring [154,155], which may further contribute to the inconsistency between model forecasts and MODIS AOD.

4. Conclusions

In this study, the meteorological dynamics associated with or even favoring dust transport from North Africa to the Middle East were examined based on four intense and widespread dust cases. According to satellite imagery, during the examined cases, dust was emitted from different regions located in the north, northeast, center, and east of the Sahara Desert. Dust plumes, after crossing the Red Sea, entered Saudi Arabia and affected large parts of the Middle East region, the Iraqi Plains, the Persian Gulf, and Southwest Iran. Based on the AERONET AODs at the KAUST campus, during all the examined cases, a relative decrease and then a sudden increase in AOD (due to the arrival of the dust plume) were observed, with AOD500 values approaching or even overcoming 1.0. According to CALIPSO profiles, in all cases, there was a dense dust mass over the Middle East–North Africa (MENA) region, in the middle troposphere, at heights of 4–5 km. In some cases, two separate dust masses were observed, near the surface and at higher altitudes. Clouds were also observed in the middle and upper troposphere, indicating that in areas with increased water vapor, convection led to cloud formation associated with the transport of dust.
In all the examined cases, an upper-air low was located over the Eastern Mediterranean, but in different latitudes. In the D1 and D2 events, this low was located on the northeast of the Mediterranean Basin, in D3 in the southeast, and in D4 it covered the eastern Levantine Basin. An expanded high-pressure system was also observed in all cases over the western-central Mediterranean, leading to pressure gradient and strong westerly zonal winds over North Africa. Furthermore, low-pressure centers were observed in Northeastern Africa and over Saudi Arabia, which led to convection and dust emissions from these areas. In all cases, the existence of a trough over North Africa facilitated dust emissions from the north and northeast regions of the Sahara, which were mostly located in front of the trough axis and penetrated to higher altitudes in the troposphere. The HYSPLIT model outputs verified the transport of dust originating from different regions in North, Northeast, and East Africa toward the Middle East.
The comparison of the AOD simulations from two models (ALADIN, ICON) with the Terra-MODIS AODs revealed that both models satisfactorily forecasted the transport of dust from North Africa to the Middle East for two and three days ahead. However, both models underestimated the high AODs over the source regions, as well as over the Red Sea and the western part of the Arabian Peninsula. Quantitative comparison of the models’ outputs with satellite data showed that the performance of the ICON model was slightly better than that of the ALADIN model during these dust storms. Although the differences between the models were very small for 1-day forecast, with the extension of the forecast leading time, they presented notable biases, with the accuracy of the ICON model being higher than that of ALADIN. Therefore, although the models were able to simulate and forecast the transport of dust from North Africa to the Middle East, they still need improvements for reliable forecasts on timescales longer than two to three days.

Author Contributions

Conceptualization, S.K. and D.G.K.; methodology, S.K., D.G.K. and I.P.; formal analysis, S.K., D.G.K. and I.P.; data curation, S.K. and D.G.K.; writing—original draft preparation, S.K. and D.G.K.; writing—review and editing, S.K., D.G.K., I.P., R.-E.P.S. and E.T.; supervision, D.G.K. All authors have read and agreed to the published version of the manuscript.

Funding

This research received no external funding.

Institutional Review Board Statement

Not applicable.

Informed Consent Statement

Not applicable.

Data Availability Statement

The MODIS data were downloaded from https://giovanni.gsfc.nasa.gov (accessed on 10 January 2024), while CALIPSO Observations from https://www-calipso.larc.nasa.gov/ (accessed on 10 January 2024), and NOAA-20/VIIRS true-color imagery from https://worldview.earthdata.nasa.gov/ (accessed on 10 January 2024). Meteorological data from NCEP/NCAR reanalysis was downloaded from https://psl.noaa.gov/data/gridded/data.ncep.reanalysis.html (accessed on 10 January 2024). The ERA-5 data are available at the Copernicus Climate Data Store at https://cds.climate.copernicus.eu/ (accessed on 11 January 2024). Dust RGB images were downloaded from the Eumetrain ePort (http://212.232.25.232/ng-maps; accessed on 11 January 2024). The HYSPLIT trajectory model (internet-based) is available at https://www.ready.noaa.gov/HYSPLIT_traj.php (accessed on 11 January 2024). The outputs from ALADIN-Dust and ICON-ART models were obtained from https://sds-was.aemet.es/forecast-products/ (accessed on 11 January 2024).

Acknowledgments

The Eumetrain ePort is gratefully acknowledged for providing the Dust RGB and meteorological maps. We are thankful for MODIS AOD retrievals via Giovanni (https://giovanni.gsfc.nasa.gov/giovanni/; accessed on 10 January 2024)) and for ERA-5 data via the ECMWF. The authors gratefully acknowledge the NOAA Air Resources Laboratory (ARL) for providing the HYSPLIT transport and dispersion model and the READY website (http://www.ready.noaa.gov; accessed on 11 January 2024) used in this publication. All model outputs were taken from the Sand and Dust Storm Warning Advisory and Assessment System (SDS-WAS; https://sds-was.aemet.es; accessed on 11 January 2024).

Conflicts of Interest

The authors declare no conflicts of interest.

References

  1. Goudie, A.S. Daesert dust and human health disorders. Environ. Intern. 2014, 63, 101–113. [Google Scholar] [CrossRef] [PubMed]
  2. Schepanski, K. Transport of mineral dust and its impact on climate. Geosciences 2018, 8, 151. [Google Scholar] [CrossRef]
  3. Zhao, H.; Zhang, F.; Yu, Z.; Li, J. Spatiotemporal variation in soil degradation and economic damage caused by wind erosion in Northwest China. J. Environ. Manag. 2022, 314, 115121. [Google Scholar] [CrossRef]
  4. Kurosaki, Y.; Kinugasa, T.; Nyamtseren, M.; Liu, S.; Otani, S. Impacts of aeolian desertification and dust storms on eco-systems, economic development, and human health. In Combating Aeolian Desertification in Northeast Asia; Springer Nature Singapore: Singapore, 2022; pp. 129–158. [Google Scholar]
  5. Dominguez-Rodriguez, A.; Rodríguez, S.; Baez-Ferrer, N.; Abreu-Gonzalez, P.; Abreu-Gonzalez, J.; Avanzas, P.; Carnero, M.; Moris, C.; López-Darias, J.; Hernández-Vaquero, D. Impact of Saharan dust exposure on airway inflammation in patients with ischemic heart disease. Transl. Res. 2020, 224, 16–25. [Google Scholar] [CrossRef] [PubMed]
  6. Kok, J.F.; Adebiyi, A.A.; Albani, S.; Balkanski, Y.; Checa-Garcia, R.; Chin, M.; Colarco, P.R.; Hamilton, D.S.; Huang, Y.; Ito, A.; et al. Improved representation of the global dust cycle using observational constraints on dust properties and abundance. Atmos. Chem. Phys. 2021, 21, 8127–8167. [Google Scholar] [CrossRef] [PubMed]
  7. Awadh, S.M. Impact of North African sand and dust storms on the Middle East using Iraq as an example: Causes, sources, and mitigation. Atmosphere 2023, 14, 180. [Google Scholar] [CrossRef]
  8. Mohebbi, A.; Green, G.T.; Akbariyeh, S.; Yu, F.; Russo, B.J.; Smaglik, E.J. Development of dust storm modeling for use in freeway safety and operations management: An arizona case study. Transp. Res. Rec. 2019, 2673, 175–187. [Google Scholar] [CrossRef]
  9. Middleton, N.; Kashani, S.S.; Attarchi, S.; Rahnama, M.; Mosalman, S.T. Synoptic causes and socio-economic consequences of a severe dust storm in the middle east. Atmosphere 2021, 12, 1435. [Google Scholar] [CrossRef]
  10. Olabode, A.D. Statistical Analysis of Weather Parameters for Sustainable Flight Operation in Nigeria. J. Environ. Geogr. 2021, 14, 47–53. [Google Scholar] [CrossRef]
  11. Struve, T.; Longman, J.; Zander, M.; Lamy, F.; Winckler, G.; Pahnke, K. Systematic changes in circumpolar dust transport to the Subantarctic Pacific Ocean over the last two glacial cycles. Proc. Natl. Acad. Sci. USA 2022, 119, e2206085119. [Google Scholar] [CrossRef]
  12. Ke, Z.; Liu, X.; Wu, M.; Shan, Y.; Shi, Y. Improved dust representation and impacts on dust transport and radiative effect in CAM5. J. Adv. Model. Earth Syst. 2022, 14, e2021MS002845. [Google Scholar] [CrossRef]
  13. Li, Y.; Song, Y.; Li, X.; Kaskaoutis, D.G.; Gholami, H.; Li, Y. Disentangling variations of dust concentration in Greenland ice cores over the last glaciation: An overview of current knowledge and new initiative. Earth-Sci. Rev. 2023, 242, 104451. [Google Scholar] [CrossRef]
  14. Martiny, N.; Chiapello, I. Assessments for the impact of mineral dust on the meningitis incidence in West Africa. Atmos. Environ. 2013, 70, 245–253. [Google Scholar] [CrossRef]
  15. Maki, T.; Lee, K.C.; Kawai, K.; Onishi, K.; Hong, C.S.; Kurosaki, Y.; Shinoda, M.; Kai, K.; Iwasaka, Y.; Archer, S.D.J.; et al. Aeolian dispersal of bacteria associated with desert dust and anthropogenic particles over continental and oceanic surfaces. J. Geophys. Res. Atmos. 2019, 124, 5579–5588. [Google Scholar] [CrossRef]
  16. Aalismail, N.A.; Ngugi, D.K.; Díaz-Rúa, R.; Alam, I.; Cusack, M.; Duarte, C.M. Functional metagenomic analysis of dust-associated microbiomes above the Red Sea. Sci. Rep. 2019, 9, 13741. [Google Scholar] [CrossRef]
  17. González-Toril, E.; Osuna, S.; Viúdez-Moreiras, D.; Navarro-Cid, I.; del Toro, S.D.; Sor, S.; Bardera, R.; Puente-Sánchez, F.; de Diego-Castilla, G.; Aguilera, Á. Impacts of saharan dust intrusions on bacterial communities of the low troposphere. Sci. Rep. 2020, 10, 6837. [Google Scholar] [CrossRef]
  18. Tong, D.Q.; Gill, T.E.; Sprigg, W.A.; Van Pelt, R.S.; Baklanov, A.A.; Barker, B.M.; Bell, J.E.; Castillo, J.; Gassó, S.; Gaston, C.J.; et al. Health and safety effects of airborne soil dust in the americas and beyond. Rev. Geophys. 2023, 61, e2021RG000763. [Google Scholar] [CrossRef]
  19. Mahilang, M.; Deb, M.K. Seasonal variation and health implications of long-range transported and provincial size dis-tributed aerosols at eastern central India. J. Indian Chem. Soc. 2020, 97, 85–100. [Google Scholar]
  20. Conte, M.; Merico, E.; Cesari, D.; Dinoi, A.; Grasso, F.M.; Donateo, A.; Guascito, M.R.; Contini, D. Long-term characterisation of African dust advection in South-Eastern Italy: Influence on fine and coarse particle concentrations, size distributions, and carbon content. Atmos. Res. 2020, 233, 104690. [Google Scholar] [CrossRef]
  21. Filonchyk, M.; Peterson, M.; Hurynovich, V. Air pollution in the gobi desert region: Analysis of dust-storm events. Q. J. R. Meteorol. Soc. 2021, 147, 1097–1111. [Google Scholar] [CrossRef]
  22. Gavrouzou, M.; Hatzianastassiou, N.; Gkikas, A.; Lolis, C.J.; Mihalopoulos, N. A Climatological Assessment of Intense Desert Dust Episodes over the Broader Mediterranean Basin Based on Satellite Data. Remote Sens. 2021, 13, 2895. [Google Scholar] [CrossRef]
  23. Li, L.; Sokolik, I. The Dust Direct Radiative Impact and Its Sensitivity to the Land Surface State and Key Minerals in the WRF-Chem-DuMo Model: A Case Study of Dust Storms in Central Asia. J. Geophys. Res. Atmos. 2018, 123, 4564–4582. [Google Scholar] [CrossRef]
  24. Tositti, L.; Brattich, E.; Cassardo, C.; Morozzi, P.; Bracci, A.; Marinoni, A.; Di Sabatino, S.; Porcù, F.; Zappi, A. Development and evolution of an anomalous Asian dust event across Europe in March 2020. Atmos. Chem. Phys. 2022, 22, 4047–4073. [Google Scholar] [CrossRef]
  25. Li, L.; Mahowald, N.M.; Miller, R.L.; García-Pando, C.P.; Klose, M.; Hamilton, D.S.; Ageitos, M.G.; Ginoux, P.; Balkanski, Y.; Green, R.O.; et al. Quantifying the range of the dust direct radiative effect due to source mineralogy uncertainty. Atmos. Chem. Phys. 2021, 21, 3973–4005. [Google Scholar] [CrossRef]
  26. Liu, D.; Wang, Y.; Wang, Z.; Zhou, J. The Three-Dimensional Structure of Transatlantic African Dust Transport: A New Perspective from CALIPSO LIDAR Measurements. Adv. Meteorol. 2012, 2012, 850704. [Google Scholar] [CrossRef]
  27. Prospero, J.M.; Mayol-Bracero, O.L. Understanding the Transport and Impact of African Dust on the Caribbean Basin. Bull. Am. Meteorol. Soc. 2013, 94, 1329–1337. [Google Scholar] [CrossRef]
  28. Gläser, G.; Wernli, H.; Kerkweg, A.; Teubler, F. The transatlantic dust transport from North Africa to the Americas—Its characteristics and source regions. J. Geophys. Res. Atmos. 2015, 120, 11231–11252. [Google Scholar] [CrossRef]
  29. Francis, D.; Reddy, N.N.; Fonseca, R.; Weston, M.; Flamant, C.; Cherif, C. The dust load and radiative impact associated with the June 2020 historical Saharan dust storm. Atmos. Environ. 2021, 268, 118808. [Google Scholar] [CrossRef]
  30. Guinoiseau, D.; Singh, S.P.; Galer, S.J.G.; Abouchami, W.; Bhattacharyya, R.; Kandler, K.; Bristow, C.; Andreae, M. Characterization of Saharan and Sahelian dust sources based on geochemical and radiogenic isotope signatures. Quat. Sci. Rev. 2022, 293, 107729. [Google Scholar] [CrossRef]
  31. Das, S.; Miller, B.V.; Prospero, J.M.; Gaston, C.J.; Royer, H.M.; Blades, E.; Sealy, P.; Chellam, S. Coupling Sr–Nd–Hf isotope ratios and elemental analysis to accurately quantify North African dust contributions to PM2.5 in a complex urban atmosphere by reducing mineral dust collinearity. Environ. Sci. Technol. 2022, 56, 7729–7740. [Google Scholar] [CrossRef]
  32. Prospero, J.M.; Barkley, A.E.; Gaston, C.J.; Gatineau, A.; Campos-y-Sansano, A.; Panechou, K. Characterizing and quan-tifying African dust transport and deposition to South America: Implications for the phosphorus budget in the Amazon Basin. Glob. Biogeochem. Cycles 2020, 34, e2020GB006536. [Google Scholar] [CrossRef]
  33. Varga, G. Changing nature of Saharan dust deposition in the Carpathian Basin (Central Europe): 40 years of identified North African dust events (1979–2018). Environ. Int. 2020, 139, 105712. [Google Scholar] [CrossRef]
  34. Dai, Y.; Hitchcock, P.; Mahowald, N.M.; Domeisen, D.I.; Hamilton, D.S.; Li, L.; Marticorena, B.; Kanakidou, M.; Mihalopoulos, N.; Aboagye-Okyere, A. Stratospheric impacts on dust transport and air pollution in West Africa and the Eastern Mediter-ranean. Nat. Commun. 2022, 13, 7744. [Google Scholar] [CrossRef]
  35. Merdji, A.B.; Lu, C.; Xu, X.; Mhawish, A. Long-term three-dimensional distribution and transport of Saharan dust: Observation from CALIPSO, MODIS, and reanalysis data. Atmos. Res. 2023, 286, 106658. [Google Scholar] [CrossRef]
  36. Mona, L.; Amiridis, V.; Cuevas, E.; Gkikas, A.; Trippetta, S.; Vandenbussche, S.; Benedetti, A.; Dagsson-Waldhauserova, P.; Formenti, P.; Haefele, A.; et al. Observing mineral dust in Northern Africa, the Middle East, and Europe: Current capabilities and challenged ahead for the development of dust services. Bull. Am. Meteorol. Soc. 2023, 104, E2223–E2264. [Google Scholar] [CrossRef]
  37. Szczepanik, D.M.; Poczta, P.; Talianu, C.; Böckmann, C.; Ritter, C.; Stefanie, H.; Toanca, F.; Chojnicki, B.H.; Schüttemeyer, D.; Stachlewska, I.S. Spatio-temporal evolution of long-range transported mineral desert dust properties over rural and urban sites in Central Europe. Sci. Total Environ. 2023, 903, 166173. [Google Scholar] [CrossRef]
  38. Francis, D.; Fonseca, R.; Nelli, N.; Bozkurt, D.; Picard, G.; Guan, B. Atmospheric rivers drive exceptional Saharan dust transport towards Europe. Atmos. Res. 2022, 266, 105959. [Google Scholar] [CrossRef]
  39. Kosmopoulos, P.G.; Kazadzis, S.; Taylor, M.; Athanasopoulou, E.; Speyer, O.; Raptis, P.I.; Marinou, E.; Proestakis, E.; Solomos, S.; Gerasopoulos, E.; et al. Dust impact on surface solar irradiance assessed with model simulations, satellite observations and ground-based measurements. Atmos. Meas. Technol. 2017, 10, 2435–2453. [Google Scholar] [CrossRef]
  40. Solomos, S.; Kalivitis, N.; Mihalopoulos, N.; Amiridis, V.; Kouvarakis, G.; Gkikas, A.; Binietoglou, I.; Tsekeri, A.; Kazadzis, S.; Kottas, M.; et al. From tropospheric folding to khamsin and foehn winds: How atmospheric dynamics advanced a record-breaking dust episode in crete. Atmosphere 2018, 9, 240. [Google Scholar] [CrossRef]
  41. Kaskaoutis, D.; Rashki, A.; Dumka, U.; Mofidi, A.; Kambezidis, H.; Psiloglou, B.; Karagiannis, D.; Petrinoli, K.; Gavriil, A. Atmospheric dynamics associated with exceptionally dusty conditions over the Eastern Mediterranean and Greece in March 2018. Atmos. Res. 2019, 218, 269–284. [Google Scholar] [CrossRef]
  42. Kotsyfakis, M.; Zarogiannis, S.G.; Patelarou, E. The health impact of Saharan dust exposure. Intern. J. Occup. Med. Environ. Health 2019, 32, 749–760. [Google Scholar] [CrossRef] [PubMed]
  43. Monteiro, A.; Basart, S.; Kazadzis, S.; Votsis, A.; Gkikas, A.; Vandenbussche, S.; Tobias, A.; Gama, C.; García-Pando, C.P.; Terradellas, E.; et al. Multi-sectoral impact assessment of an extreme African dust episode in the Eastern Mediterranean in March 2018. Sci. Total Environ. 2022, 843, 156861. [Google Scholar] [CrossRef]
  44. Kaskaoutis, D.; Dumka, U.; Rashki, A.; Psiloglou, B.; Gavriil, A.; Mofidi, A.; Petrinoli, K.; Karagiannis, D.; Kambezidis, H. Analysis of intense dust storms over the Eastern Mediterranean in March 2018: Impact on radiative forcing and Athens air quality. Atmos. Environ. 2019, 209, 23–39. [Google Scholar] [CrossRef]
  45. Prasad, A.K.; Singh, R.P. Changes in aerosol parameters during major dust storm events (2001–2005) over the Indo-Gangetic Plains using AERONET and MODIS data. J. Geophys. Res. Atmos. 2007, 112, D09208. [Google Scholar] [CrossRef]
  46. Sugimoto, N.; Jin, Y.; Shimizu, A.; Nishizawa, T.; Yumimoto, K. Transport of mineral dust from Africa and Middle East to East Asia observed with the lidar network (AD-Net). Sola 2019, 15, 257–261. [Google Scholar] [CrossRef]
  47. Zhou, T.; Zhou, X.; Yang, Z.; Córdoba-Jabonero, C.; Wang, Y.; Huang, Z.; Da, P.; Luo, Q.; Zhang, Z.; Shi, J.; et al. Transboundary transport of Non-East and East Asian dust observed at Dunhuang, Northwest China. Atmos. Environ. 2024, 318, 120197. [Google Scholar] [CrossRef]
  48. Tanaka, T.Y.; Kurosaki, Y.; Chiba, M.; Matsumura, T.; Nagai, T.; Yamazaki, A.; Uchiyama, A.; Tsunematsu, N.; Kai, K. Possible transcontinental dust transport from North Africa and the Middle East to East Asia. Atmos. Environ. 2005, 39, 3901–3909. [Google Scholar] [CrossRef]
  49. Liu, Q.; Huang, Z.; Hu, Z.; Dong, Q.; Li, S. Long-range transport and evolution of saharan dust over East Asia from 2007 to 2020. J. Geophys. Res. Atmos. 2022, 127, 022JD036974. [Google Scholar] [CrossRef]
  50. Heinold, B.; Tegen, I.; Esselborn, M.; Kandler, K.; Knippertz, P.; Müller, D.; Schladitz, A.; Tesche, M.; Weinzierl, B.; Ansmann, A.; et al. Regional Saharan dust modelling during the SAMUM 2006 campaign. Tellus B 2009, 61, 307–324. [Google Scholar] [CrossRef]
  51. Kalenderski, S.; Stenchikov, G.; Zhao, C. Modeling a typical winter-time dust event over the Arabian Peninsula and the Red Sea. Atmos. Chem. Phys. 2013, 13, 1999–2014. [Google Scholar] [CrossRef]
  52. Tegen, I.; Schepanski, K.; Heinold, B. Comparing two years of Saharan dust source activation obtained by regional modelling and satellite observations. Atmos. Chem. Phys. 2013, 13, 2381–2390. [Google Scholar] [CrossRef]
  53. Tsikerdekis, A.; Zanis, P.; Steiner, A.L.; Solmon, F.; Amiridis, V.; Marinou, E.; Katragkou, E.; Karacostas, T.; Foret, G. Impact of dust size parameterizations on aerosol burden and radiative forcing in RegCM4. Atmos. Chem. Phys. 2017, 17, 769–791. [Google Scholar] [CrossRef]
  54. Francis, D.; Alshamsi, N.; Cuesta, J.; Isik, A.G.; Dundar, C. Cyclogenesis and density currents in the middle east and the associated dust activity in september 2015. Geosciences 2019, 9, 376. [Google Scholar] [CrossRef]
  55. Solomos, S.; Abuelgasim, A.; Spyrou, C.; Binietoglou, I.; Nickovic, S. Development of a dynamic dust source map for NMME-DREAM v1.0 model based on MODIS Normalized Difference Vegetation Index (NDVI) over the Arabian Peninsula. Geosci. Model Dev. 2019, 12, 979–988. [Google Scholar] [CrossRef]
  56. Basart, S.; Pérez, C.; Nickovic, S.; Cuevas, E.; Baldasano, J.M. Development and evaluation of the BSC-DREAM8b dust regional model over Northern Africa, the Mediterranean and the Middle East. Tellus B Chem. Phys. Meteorol. 2012, 64, 18539. [Google Scholar] [CrossRef]
  57. Rezazadeh, M.; Irannejad, P.; Shao, Y. Climatology of the Middle East dust events. Aeolian Res. 2013, 10, 103–109. [Google Scholar] [CrossRef]
  58. Gholami, H.; Mohammadifar, A. Novel deep learning hybrid models (CNN-GRU and DLDL-RF) for the susceptibility classification of dust sources in the Middle East: A global source. Sci. Rep. 2022, 12, 19342. [Google Scholar] [CrossRef] [PubMed]
  59. Masoumi, A.; Laleh, E.; Bayat, A. Optical and physical properties, time-period, and severity of dust activities as a function of source for the main dust sources of the Middle East. J. Atmos. Solar-Terr. Phys. 2019, 185, 68–79. [Google Scholar] [CrossRef]
  60. Papi, R.; Attarchi, S.; Boloorani, A.D.; Samany, N.N. Knowledge discovery of Middle East dust sources using Apriori spatial data mining algorithm. Ecol. Inform. 2022, 72, 101867. [Google Scholar] [CrossRef]
  61. Alam, K.; Trautmann, T.; Blaschke, T.; Subhan, F. Changes in aerosol optical properties due to dust storms in the Middle East and Southwest Asia. Remote Sens. Environ. 2014, 143, 216–227. [Google Scholar] [CrossRef]
  62. Awad, A.M.; Mashat, A.S. Synoptic features associated with dust transition processes from North Africa to Asia. Arab. J. Geosci. 2014, 7, 2451–2467. [Google Scholar] [CrossRef]
  63. Mashat, A.S.; Alamoudi, A.O.; Awad, A.M.; Assiri, M.E. Seasonal variability and synoptic characteristics of dust cases over southwestern Saudi Arabia. Int. J. Clim. 2017, 38, 105–124. [Google Scholar] [CrossRef]
  64. Gandham, H.; Dasari, H.P.; Saquib Saharwardi, S.; Karumuri, A.; Hoteit, I. Dust sources over the Arabian Peninsula. Environ. Res. Lett. 2023, 18, 094053. [Google Scholar] [CrossRef]
  65. Kaskaoutis, D.; Pikridas, M.; Barmpounis, K.; Kassell, G.; Logan, D.; Rigler, M.; Ivančič, M.; Mohammadpour, K.; Mihalopoulos, N.; Lelieveld, J.; et al. Aerosol characteristics and types in the marine environments surrounding the East Mediterranean—Middle East (EMME) region during the AQABA campaign. Atmos. Environ. 2023, 298, 119633. [Google Scholar] [CrossRef]
  66. Parajuli, S.P.; Stenchikov, G.L.; Ukhov, A.; Morrison, H.; Shevchenko, I.; Mostamandi, S. Simulation of a dust-and-rain event across the red sea using WRF-chem. J. Geophys. Res. Atmos. 2023, 128, e2022JD038384. [Google Scholar] [CrossRef]
  67. Rashki, A.; Kaskaoutis, D.G.; Mofidi, A.; Minvielle, F.; Chiapello, I.; Legrand, M.; Dumka, U.C.; Francois, P. Effects of Monsoon, Shamal and Levar winds on dust accumulation over the Arabian Sea during summer—The July 2016 case. Aeol. Res. 2019, 36, 27–44. [Google Scholar] [CrossRef]
  68. Aswini, M.; Tiwari, S.; Singh, U.; Kurian, S.; Patel, A.; Gunthe, S.S.; Kumar, A. Aeolian dust and sea salt in marine aerosols over the Arabian Sea during the southwest monsoon: Sources and spatial variability. ACS Earth Space Chem. 2022, 6, 1044–1058. [Google Scholar] [CrossRef]
  69. Al-Hemoud, A.; Al-Dousari, A.; Misak, R.; Al-Sudairawi, M.; Naseeb, A.; Al-Dashti, H.; Al-Dousari, N. Economic impact and risk assessment of sand and dust storms (SDS) on the oil and gas industry in kuwait. Sustainability 2019, 11, 200. [Google Scholar] [CrossRef]
  70. Gandham, H.; Dasari, H.P.; Karumuri, A.; Ravuri, P.M.K.; Hoteit, I. Three-dimensional structure and transport pathways of dust aerosols over West Asia. NPJ Clim. Atmos. Sci. 2022, 5, 45. [Google Scholar] [CrossRef]
  71. Goudie, A.S. Dust storms and human health. In Extreme Weather Events and Human Health: International Case Studies; Springer International Publishing: Cham, Switzerland, 2019; pp. 13–24. [Google Scholar]
  72. Soleimani, Z.; Teymouri, P.; Boloorani, A.D.; Mesdaghinia, A.; Middleton, N.; Griffin, D.W. An overview of bioaerosol load and health impacts associated with dust storms: A focus on the Middle East. Atmos. Environ. 2020, 223, 117187. [Google Scholar] [CrossRef]
  73. Terradellas, E.; Nickovic, S.; Zhang, X.Y. Airborne dust: A hazard to human health, environment and society. WMO Bull. 2015, 64, 42–46. Available online: https://sds-was.aemet.es/materials/hazard.pdf (accessed on 10 January 2024).
  74. Kalnay, E.; Kanamitsu, M.; Kistler, R.; Collins, W.; Deaven, D.; Gandin, L.; Iridell, S.S.; White, G.; Woollen, J.; Zhu, Y.; et al. The NCEP/NCAR 40-year reanalysis project. Bull. Am. Meteorol. Soc. 1996, 77, 437–471. [Google Scholar] [CrossRef]
  75. Kistler, R.; Collins, W.; Saha, S.; White, G.; Woollen, J.; Kalnay, E.; Chelliah, M.; Ebisuzaki, W.; Kanamitsu, M.; Kousky, V.; et al. The NCEP/NCAR 50-year reanalyses: Monthly CD-ROM and documentation. Bull. Am. Meteorol. Soc. 2001, 82, 247–267. [Google Scholar] [CrossRef]
  76. Dayan, U.; Ziv, B.; Shoob, T.; Enzel, Y. Suspended dust over southeastern Mediterranean and its relation to atmospheric circulations. Int. J. Clim. 2008, 28, 915–924. [Google Scholar] [CrossRef]
  77. Israelevich, P.; Ganor, E.; Alpert, P.; Kishcha, P.; Stupp, A. Predominant transport paths of Saharan dust over the Mediterranean Sea to Europe. J. Geophys. Res. Atmos. 2012, 117, D02205. [Google Scholar] [CrossRef]
  78. Kaskaoutis, D.G.; Nastos, P.T.; Kosmopoulos, P.G.; Kambezidis, H.D. Characterizing the long-range transport mecha-nisms of different aerosol types over Athens, Greece during 2000–2005. Int. J. Climatol. 2012, 32, 1249–1270. [Google Scholar] [CrossRef]
  79. Flaounas, E.; Kotroni, V.; Lagouvardos, K.; Kazadzis, S.; Gkikas, A.; Hatzianastassiou, N. Cyclone contribution to dust transport over the Mediterranean region. Atmos. Sci. Lett. 2015, 16, 473–478. [Google Scholar] [CrossRef]
  80. Holben, B.N.; Eck, T.F.; Slutsker, I.; Tanré, D.; Buis, J.P.; Setzer, A.; Vermote, E.; Reagan, J.A.; Kaufman, Y.A. AERONET-a federated instrument network and data achieve for aerosol characterization. Remote Sens. Environ. 1998, 66, 1–16. [Google Scholar] [CrossRef]
  81. Winker, D.M.; Tackett, J.L.; Getzewich, B.J.; Liu, Z.; Vaughan, M.A.; Rogers, R.R. The global 3-D distribution of tropospheric aerosols as characterized by CALIOP. Atmos. Chem. Phys. 2013, 13, 3345–3361. [Google Scholar] [CrossRef]
  82. Brakhasi, F.; Hajeb, M.; Mielonen, T.; Matkan, A.; Verbesselt, J. Investigating aerosol vertical distribution using CALIPSO time series over the Middle East and North Africa (MENA), Europe, and India: A BFAST-based gradual and abrupt change detection. Remote Sens. Environ. 2021, 264, 112619. [Google Scholar] [CrossRef]
  83. Zhang, Z.; Su, B.; Chen, Y.; Lan, J.; Bilal, M.; Pan, M.; Ilyas, S.; Khedher, K.M. Study on Vertically Distributed Aerosol Optical Characteristics over Saudi Arabia Using CALIPSO Satellite Data. Appl. Sci. 2022, 12, 603. [Google Scholar] [CrossRef]
  84. Hersbach, H.; Bell, B.; Berrisford, P.; Hirahara, S.; Horányi, A.; Muñoz-Sabater, J.; Nicolas, J.; Peubey1 Raluca Radu, C.; Schepers, D.; Simmons, A.; et al. The ERA5 global reanalysis. Q. J. R. Meteorol. Soc. 2020, 146, 1999–2049. [Google Scholar] [CrossRef]
  85. Jin, Q.; Wei, J.; Pu, B.; Yang, Z.; Parajuli, S.P. High summertime aerosol loadings over the arabian sea and their transport pathways. J. Geophys. Res. Atmos. 2018, 123, 10568–10590. [Google Scholar] [CrossRef]
  86. Stein, A.F.; Draxler, R.R.; Rolph, G.D.; Stunder, B.J.B.; Cohen, M.D.; Ngan, F. NOAA’s HYSPLIT Atmospheric Transport and Dispersion Modeling System. Bull. Am. Meteorol. Soc. 2015, 96, 2059–2077. [Google Scholar] [CrossRef]
  87. Karami, S.; Kaskaoutis, D.G.; Kashani, S.S.; Rahnama, M.; Rashki, A. Evaluation of nine operational models in fore-casting different types of synoptic dust events in the Middle East. Geosciences 2021, 11, 458. [Google Scholar] [CrossRef]
  88. Leuenberger, C.; Wegmann, D. Bayesian computation and model selection without likelihoods. Genetics 2010, 184, 243–252. [Google Scholar] [CrossRef]
  89. Huth, R.; Mládek, R.; Metelka, L.; Sedlák, P.; Huthová, Z.; Kliegrová, S.; Kyselý, J.; Pokorná, L.; Halenka, T.; Janoušek, M. On the integrability of limited-area numerical weather prediction model ALADIN over extended time periods. Stud. Geophys. Et Geod. 2003, 47, 863–873. [Google Scholar] [CrossRef]
  90. Zender, C.S.; Bian, H.; Newman, D. Mineral Dust Entrainment and Deposition (DEAD) model: Description and 1990s dust climatology. J. Geophys. Res. Atmos. 2003, 108, 4416. [Google Scholar] [CrossRef]
  91. Marticorena, B.; Bergametti, G. Modeling the atmospheric dust cycle: 1. Design of a soil-derived dust emission scheme. J. Geophys. Res. Atmos. 1995, 100, 16415–16430. [Google Scholar] [CrossRef]
  92. Noilhan, J.; Planton, S. A simple parameterization of land surface processes for meteorological models. Mon. Weather Rev. 1989, 117, 536–549. [Google Scholar] [CrossRef]
  93. Mokhtari, M. Modeling the Mineral Dust Aerosol Cycle in ALADIN Simulation of the March 7–13 West Africa Dust Storm. Technical Report. Available online: https://www.umr-cnrm.fr/aladin/ (accessed on 10 January 2024).
  94. Shao, Y.; Raupach, M.R.; Findlater, P.A. Effect of saltation bombardment on the entrainment of dust by wind. J. Geophys. Res. Atmos. 1993, 98, 12719–12726. [Google Scholar] [CrossRef]
  95. Rieger, L.A.; Bourassa, A.E.; Degenstein, D.A. Merging the OSIRIS and SAGE II stratospheric aerosol records. J. Geophys. Res. Atmos. 2015, 120, 8890–8904. [Google Scholar] [CrossRef]
  96. Vogel, B.; Hoose, C.; Vogel, H.; Kottmeier, C. A model of dust transport applied to the Dead Sea Area. Meteorol. Z. 2006, 15, 611–624. [Google Scholar] [CrossRef] [PubMed]
  97. Rieger, D.; Steiner, A.; Bachmann, V.; Gasch, P.; Förstner, J.; Deetz, K.; Vogel, B.; Vogel, H. Impact of the 4 April 2014 Saharan dust outbreak on the photovoltaic power generation in Germany. Atmos. Chem. Phys. 2017, 17, 13391–13415. [Google Scholar] [CrossRef]
  98. White, B.R. Soil transport by winds on Mars. J. Geophys. Res. Solid Earth 1979, 84, 4643–4651. [Google Scholar] [CrossRef]
  99. Alfaro, S.C.; Gomes, L. Modeling mineral aerosol production by wind erosion: Emission intensities and aerosol size distributions in source areas. J. Geophys. Res. Atmos. 2001, 106, 18075–18084. [Google Scholar] [CrossRef]
  100. Gasch, P.; Rieger, D.; Walter, C.; Khain, P.; Levi, Y.; Knippertz, P.; Vogel, B. Revealing the meteorological drivers of the September 2015 severe dust event in the Eastern Mediterranean. Atmos. Chem. Phys. 2017, 17, 13573–13604. [Google Scholar] [CrossRef]
  101. Rodriguez, S.; Cuevas, E.; Prospero, J.M.; Alastuey, A.; Querol, X.; López-Solano, J.; García, M.I.; Alonso-Pérez, S. Modulation of Saharan dust export by the North African dipole. Atmos. Chem. Phys. 2015, 15, 7471–7486. [Google Scholar] [CrossRef]
  102. Karam, D.B.; Flamant, C.; Cuesta, J.; Pelon, J.; Williams, E. Dust emission and transport associated with a Saharan depression: February 2007 case. J. Geophys. Res. Atmos. 2010, 115, D00H27. [Google Scholar] [CrossRef]
  103. Baltaci, H. Spatial and Temporal Variation of the Extreme Saharan Dust Event over Turkey in March 2016. Atmosphere 2017, 8, 41. [Google Scholar] [CrossRef]
  104. Knippertz, P.; Trentmann, J.; Seifert, A. High resolution simulations of convective cold pools over the northwestern Sahara. J. Geophys. Res. 2009, 114, D21109. [Google Scholar] [CrossRef]
  105. Prospero, J.M.; Nees, R.T. Impact of the North African drought and El Niño on mineral dust in the Barbados trade winds. Nature 1986, 320, 735–738. [Google Scholar] [CrossRef]
  106. Karayampudi, V.M.; Carlson, T.N. Analysis and Numerical Simulations of the Saharan Air Layer and Its Effect on Easterly Wave Disturbances. J. Atmos. Sci. 1988, 45, 3102–3136. [Google Scholar] [CrossRef]
  107. Jones, C.; Mahowald, N.; Luo, C. The role of easterly waves on african desert dust transport. J. Clim. 2003, 16, 3617–3628. [Google Scholar] [CrossRef]
  108. Jones, C.; Mahowald, N.; Luo, C. Observational evidence of African desert dust intensification of easterly waves. Geophys. Res. Lett. 2004, 31, L17208. [Google Scholar] [CrossRef]
  109. Reed, R.J.; Hollingsworth, A.; Heckley, W.A.; Delsol, F. An evaluation of the performance of the ecmwf operational system in analyzing and forecasting easterly wave disturbances over africa and the tropical atlantic. Mon. Weather Rev. 1988, 116, 824–865. [Google Scholar] [CrossRef]
  110. Pytharoulis, I.; Thorncroft, C. The Low-Level Structure of African Easterly Waves in 1995. Mon. Weather Rev. 1999, 127, 2266–2280. [Google Scholar] [CrossRef]
  111. Bercos-Hickey, E.; Nathan, T.R.; Chen, S. Saharan dust and the African easterly jet–African easterly wave system: Structure, location and energetics. Q. J. R. Meteorol. Soc. 2017, 143, 2797–2808. [Google Scholar] [CrossRef]
  112. Washington, R.; Todd, M.C. Atmospheric controls on mineral dust emission from the Bodélé Depression, Chad: The role of the low-level jet. Geophys. Res. Lett. 2005, 32, L17701. [Google Scholar] [CrossRef]
  113. Gherboudj, I.; Beegum, S.N.; Ghedira, H. Identifying natural dust source regions over the Middle-East and North-Africa: Estimation of dust emission potential. Earth-Sci. Rev. 2017, 165, 342–355. [Google Scholar] [CrossRef]
  114. Prospero, J.M.; Ginoux, P.; Torres, O.; Nicholson, S.E.; Gill, T.E. Environmental characterization of global sources of at-mospheric soil dust identified with the Nimbus 7 Total Ozone Mapping Spectrometer (TOMS) absorbing aerosol product. ReViews Geophys. 2002, 40, 1002. [Google Scholar] [CrossRef]
  115. Washington, R.; Todd, M.; Middleton, N.J.; Goudie, A.S. Dust-storm source areas determined by the total ozone moni-toring spectrometer and surface observations. Ann. Assoc. Am. Geogr. 2003, 93, 297–313. [Google Scholar] [CrossRef]
  116. Yu, Y.; Kalashnikova, O.V.; Garay, M.J.; Lee, H.; Notaro, M. Identification and characterization of dust source regions across North Africa and the Middle East using MISR satellite observations. Geophys. Res. Lett. 2018, 45, 6690–6701. [Google Scholar] [CrossRef]
  117. Parajuli, S.P.; Zobeck, T.M.; Kocurek, G.; Yang, Z.; Stenchikov, G.L. New insights into the wind-dust relationship in sandblasting and direct aerodynamic entrainment from wind tunnel experiments. J. Geophys. Res. Atmos. 2016, 121, 1776–1792. [Google Scholar] [CrossRef]
  118. Kontos, S.; Liora, N.; Giannaros, C.; Kakosimos, K.; Poupkou, A.; Melas, D. Modeling natural dust emissions in the central Middle East: Parameterizations and sensitivity. Atmos. Environ. 2018, 190, 294–307. [Google Scholar] [CrossRef]
  119. Rezaei, M.; Mielonen, T.; Farajzadeh, M. Climatology of atmospheric dust corridors in the Middle East based on satellite data. Atmos. Res. 2022, 280, 106454. [Google Scholar] [CrossRef]
  120. Hermida, L.; Merino, A.; Sánchez, J.; Fernández-González, S.; García-Ortega, E.; López, L. Characterization of synoptic patterns causing dust outbreaks that affect the Arabian Peninsula. Atmos. Res. 2018, 199, 29–39. [Google Scholar] [CrossRef]
  121. Hamzeh, N.H.; Karami, S.; Kaskaoutis, D.G.; Tegen, I.; Moradi, M.; Opp, C. Atmospheric Dynamics and Numerical Simulations of Six Frontal Dust Storms in the Middle East Region. Atmosphere 2021, 12, 125. [Google Scholar] [CrossRef]
  122. Ali, A.; Nichol, J.E.; Bilal, M.; Qiu, Z.; Mazhar, U.; Wahiduzzaman; Almazroui, M.; Islam, M.N. Classification of aerosols over Saudi Arabia from 2004–2016. Atmos. Environ. 2020, 241, 117785. [Google Scholar] [CrossRef]
  123. Logothetis, S.-A.; Salamalikis, V.; Kazantzidis, A. Aerosol classification in Europe, Middle East, North Africa and Arabian Peninsula based on AERONET Version 3. Atmos. Res. 2020, 239, 104893. [Google Scholar] [CrossRef]
  124. Xu, X.; Xie, L.; Yang, X.; Wu, H.; Cai, L.; Qi, P. Aerosol optical properties at seven AERONET sites over Middle East and Eastern Mediterranean Sea. Atmos. Environ. 2020, 243, 117884. [Google Scholar] [CrossRef]
  125. Sabetghadam, S.; Alizadeh, O.; Khoshsima, M.; Pierleoni, A. Aerosol properties, trends and classification of key types over the middle-east using satellite-derived atmospheric optical datasets. Atmos. Environ. 2021, 246, 118100. [Google Scholar] [CrossRef]
  126. Osipov, S.; Stenchikov, G.; Brindley, H.; Banks, J. Diurnal cycle of the dust instantaneous direct radiative forcing over the arabian peninsula. Atmos. Chem. Phys. 2015, 15, 9537–9553. [Google Scholar] [CrossRef]
  127. Lu, S.; Zhu, G.; Meng, G.; Lin, X.; Liu, Y.; Qiu, D.; Xu, Y.; Wang, Q.; Chen, L.; Li, R.; et al. Influence of atmospheric circulation on the stable isotope of precipitation in the monsoon margin region. Atmos. Res. 2024, 298, 107131. [Google Scholar] [CrossRef]
  128. Kaskaoutis, D.; Houssos, E.; Solmon, F.; Legrand, M.; Rashki, A.; Dumka, U.; Francois, P.; Gautam, R.; Singh, R. Impact of atmospheric circulation types on southwest Asian dust and Indian summer monsoon rainfall. Atmos. Res. 2018, 201, 189–205. [Google Scholar] [CrossRef]
  129. Wang, M.; Lau, W.K.M.; Wang, J. Impact of middle east dust on subseasonal-to-seasonal variability of the Asian summer monsoon. Clim. Dyn. 2021, 57, 37–54. [Google Scholar] [CrossRef]
  130. Bayat, F.; Khalesifard, H.R. Characterization of released dust over open waters in the south of the Iran Plateau based on satellite and ground-based measurements. Atmos. Pollut. Res. 2021, 12, 101208. [Google Scholar] [CrossRef]
  131. Masoumi, A.; Moradhaseli, R. Spatio-temporal classification of dust source activities affecting the Khuzestan region, based on CALIPSO-CALIOP data and atmospheric models. Atmos. Res. 2023, 287, 106702. [Google Scholar] [CrossRef]
  132. Lin, Y.; Tian, P.; Tang, C.; Pang, S.; Zhang, L. Combining CALIPSO and AERONET data to classify aerosols globally. IEEE Trans. Geosci. Remote Sens. 2022, 60, 1–12. [Google Scholar] [CrossRef]
  133. Mashat, A.-W.S.; Awad, A.M.; Assiri, M.E.; Labban, A.H. Dynamic and synoptic study of spring dust storms over northern Saudi Arabia. Theor. Appl. Clim. 2020, 140, 619–634. [Google Scholar] [CrossRef]
  134. Hamidi, M.; Kavianpour, M.R.; Shao, Y. Numerical simulation of dust events in the Middle East. Aeolian Res. 2014, 13, 59–70. [Google Scholar] [CrossRef]
  135. Beegum, S.N.; Gherboudj, I.; Chaouch, N.; Couvidat, F.; Menut, L.; Ghedira, H. Simulating aerosols over Arabian Peninsula with CHIMERE: Sensitivity to soil, surface parameters and anthropogenic emission inventories. Atmos. Environ. 2016, 128, 185–197. [Google Scholar] [CrossRef]
  136. Karami, S.; Hamzeh, N.H.; Kaskaoutis, D.G.; Rashki, A.; Alam, K.; Ranjbar, A. Numerical simulations of dust storms originated from dried lakes in central and southwest Asia: The case of Aral Sea and Sistan Basin. Aeolian Res. 2021, 50, 100679. [Google Scholar] [CrossRef]
  137. Ginoux, P.; Chin, M.; Tegen, I.; Prospero, J.M.; Holben, B.; Dubovik, O.; Lin, S.-J. Sources and distributions of dust aerosols simulated with the GOCART model. J. Geophys. Res. Atmos. 2001, 106, 20255–20273. [Google Scholar] [CrossRef]
  138. Tegen, I.; Harrison, S.P.; Kohfeld, K.; Prentice, I.C.; Coe, M.; Heimann, M. Impact of vegetation and preferential source areas on global dust aerosol: Results from a model study. J. Geophys. Res. Atmos. 2002, 107, AAC-14. [Google Scholar] [CrossRef]
  139. Parajuli, S.P.; Stenchikov, G.L.; Ukhov, A.; Kim, H. Dust emission modeling using a new high-resolution dust source function in WRF-chem with implications for air quality. J. Geophys. Res. Atmos. 2019, 124, 10109–10133. [Google Scholar] [CrossRef]
  140. Mostamandi, S.; Ukhov, A.; Engelbrecht, J.; Shevchenko, I.; Osipov, S.; Stenchikov, G. Fine and Coarse Dust Effects on Radiative Forcing, Mass Deposition, and Solar Devices Over the Middle East. J. Geophys. Res. Atmos. 2023, 128, e2023JD039479. [Google Scholar] [CrossRef]
  141. Kok, J.F.; Albani, S.; Mahowald, N.M.; Ward, D.S. An improved dust emission model—Part 2: Evaluation in the Community Earth System Model, with implications for the use of dust source functions. Atmos. Chem. Phys. 2014, 14, 13043–13061. [Google Scholar] [CrossRef]
  142. Basart, S.; Vendrell, L.; Baldasano, J. High-resolution dust modelling over complex terrains in West Asia. Aeolian Res. 2016, 23, 37–50. [Google Scholar] [CrossRef]
  143. Nabavi, S.O.; Haimberger, L.; Samimi, C. Sensitivity of WRF-chem predictions to dust source function specification in West Asia. Aeolian Res. 2017, 24, 115–131. [Google Scholar] [CrossRef]
  144. Li, L.; Mahowald, N.M.; Kok, J.F.; Liu, X.; Wu, M.; Leung, D.M.; Hamilton, D.S.; Emmons, L.K.; Huang, Y.; Sexton, N.; et al. Importance of different parameterization changes for the updated dust cycle modeling in the Community Atmosphere Model (version 6.1). Geosci. Model Dev. 2022, 15, 8181–8219. [Google Scholar] [CrossRef]
  145. Prakash, P.J.; Stenchikov, G.; Kalenderski, S.; Osipov, S.; Bangalath, H. The impact of dust storms on the Arabian Peninsula and the Red Sea. Atmos. Chem. Phys. 2015, 15, 199–222. [Google Scholar] [CrossRef]
  146. Cowie, S.M.; Marsham, J.H.; Knippertz, P. The importance of rare, high-wind events for dust uplift in northern Africa. Geophys. Res. Lett. 2015, 42, 8208–8215. [Google Scholar] [CrossRef] [PubMed]
  147. Yu, Y.; Notaro, M.; Liu, Z.; Wang, F.; Alkolibi, F.; Fadda, E.; Bakhrjy, F. Climatic controls on the interannual to decadal variability in Saudi Arabian dust activity: Toward the development of a seasonal dust prediction model. J. Geophys. Res. Atmos. 2015, 120, 1739–1758. [Google Scholar] [CrossRef]
  148. Leung, D.M.; Kok, J.F.; Li, L.; Okin, G.S.; Prigent, C.; Klose, M.; Pérez García-Pando, C.; Menut, L.; Mahowald, N.M.; Lawrence, D.M.; et al. A new process-based and scale-aware desert dust emission scheme for global climate models—Part I: Description and evaluation against inverse modeling emissions. Atmos. Chem. Phys. 2023, 23, 6487–6523. [Google Scholar] [CrossRef]
  149. Leung, D.M.; Kok, J.F.; Li, L.; Mahowald, N.M.; Lawrence, D.M.; Tilmes, S.; Kluzek, E.; Klose, M.; Pérez García-Pando, C. A new process-based and scale-aware desert dust emission scheme for global climate models—Part II: Evaluation in the Community Earth System Model version 2 (CESM2). Atmos. Chem. Phys. 2024, 24, 2287–2318. [Google Scholar] [CrossRef]
  150. Beegum, S.N.; Gherboudj, I.; Chaouch, N.; Temimi, M.; Ghedira, H. Simulation and analysis of synoptic scale dust storms over the Arabian Peninsula. Atmos. Res. 2018, 199, 62–81. [Google Scholar] [CrossRef]
  151. de Meij, A.; Lelieveld, J. Evaluating aerosol optical properties observed by ground-based and satellite remote sensing over the Mediterranean and the Middle East in 2006. Atmos. Res. 2011, 99, 415–433. [Google Scholar] [CrossRef]
  152. Yu, Y.; Notaro, M.; Liu, Z.; Kalashnikova, O.; Alkolibi, F.; Fadda, E.; Bakhrjy, F. Assessing temporal and spatial variations in atmospheric dust over Saudi Arabia through satellite, radiometric, and station data. J. Geophys. Res. Atmos. 2013, 118, 13253–13264. [Google Scholar] [CrossRef]
  153. Shaheen, A.; Wu, R.; Aldabash, M. Long-term AOD trend assessment over the Eastern Mediterranean region: A comparative study including a new merged aerosol product. Atmos. Environ. 2020, 238, 117736. [Google Scholar] [CrossRef]
  154. Shaheen, A.; Wu, R.; Yousefi, R.; Wang, F.; Ge, Q.; Kaskaoutis, D.G.; Wang, J.; Alpert, P.; Munawar, I. Spatio-temporal changes of spring-summer dust AOD over the Eastern Mediterranean and the Middle East: Reversal of dust trends and associated meteorological effects. Atmos. Res. 2023, 281, 106509. [Google Scholar] [CrossRef]
  155. Samman, A.E.; Butt, M.J. Aerosol Types and Their Climatology over the Dust Belt Region. Atmosphere 2023, 14, 1610. [Google Scholar] [CrossRef]
Figure 1. The study area and location of the AERONET station.
Atmosphere 15 00531 g001
Figure 2. Seasonal mean Terra-MODIS AOD500 and wind vectors at 500 hPa in (a) December, January, and February (DJF); (b) March, April, and May (MAM); (c) June, July, and August (JJA); and (d) September, October, and November (SON) over the central and North African region. The arrows correspond to the seasonal mean vector wind at 500 hPa.
Atmosphere 15 00531 g002
Figure 3. True-color images of the NOAA-20/VIIRS: (a) D1 (24 March 2021), (b) D2 (11 March 2022), (c) D3 (21 May 2022), and (d) D4 (29 May 2023) (source: https://worldview.earthdata.nasa.gov/; accessed on 10 January 2024).
Atmosphere 15 00531 g003
Figure 4. Temporal evolution of the AOD500 values measured at the AERONET station in KAUST_Campus, Saudi Arabia during the examined dust events: D1 (24–27 March 2021), D2 (7–16 March 2022), D3 (19–25 May 2022), and D4 (27–31 May 2023). The hours are in UTC.
Atmosphere 15 00531 g004
Figure 5. Vertical profiles of the backscatter coefficient (Mm−1 sr−1) and aerosol subtype from CALIPSO overpasses over the study area during D1 (a,b), D2 (c,d), D3 (e,f), and D4 (g,h). In the left panels, the red lines of the inset figures illustrate the path of CALIPSO.
Atmosphere 15 00531 g005aAtmosphere 15 00531 g005b
Figure 6. Dust RGB images with geopotential height (blue contours; gpdam) and wind barbs (knots) at 500 hPa (left column), and MSLP (black contours; hPa) along with the streamlines at 500 hPa (right column) at (a,b) 00 UTC on 26 March 2021 (case D1), (c,d) 00 UTC on 11 March 2022 (case D2), (e,f) 00 UTC on 21 May 2022 (case D3), and (g,h) 12 UTC on 28 May 2023 (case D4) (source: Eumetrain ePort).
Atmosphere 15 00531 g006aAtmosphere 15 00531 g006b
Figure 7. Forty-eight-hour backward trajectories (red lines) of the HYSPLIT model reaching the regions with the black matrix at the altitude of 5000 m at 09:00 UTC on (a) 26 March 2021 (D1), (b) 12 March 2022 (D2), (c) 23 May 2022 (D3), and (d) 29 May 2023 (D4) superimposed on the Terra-MODIS true-color satellite image of that day.
Atmosphere 15 00531 g007
Figure 8. Spatial distribution of the AOD values from Terra-MODIS (left), ALADIN (middle), and ICON (right) model outputs with 33 h forecast leading time for D1 at 09:00 UTC on 25 March 2021 (ac), D2 at 09:00 UTC on 12 March 2022 (df), D3 at 09:00 UTC on 23 May 2022 (gi), and D4 at 09:00 UTC on 29 May 2023 (jl).
Atmosphere 15 00531 g008
Figure 9. Spatial distribution of the AOD values from Terra-MODIS (left), ALADIN (middle) and ICON (right) model output with 57 h forecast leading time for D1 at 09:00 UTC on 25 March 2021 (ac), D2 at 09:00 UTC on 12 March 2022 (df), D3 at 09:00 UTC on 23 May 2022 (gi), and D4 at 09:00 UTC on 29 May 2023 (jl).
Atmosphere 15 00531 g009aAtmosphere 15 00531 g009b
Figure 10. Scatter diagrams of AOD values from ALADIN-Dust (left) and ICON-ART (right) model outputs against Terra-MODIS AODs for all grid points in the study area during the four dust storms in the first (a,b), second (c,d), and third (e,f) day forecasts. All the linear correlation coefficients (R) are statistically significant for p = 0.01. The red dashed line indicates the linear regression line.
Atmosphere 15 00531 g010
Table 1. The characteristics of the ALADIN-Dust and ICON-ART models.
ModelMeteorological DriverMeteorological Initial ConditionHorizontal ResolutionVertical ResolutionTransport Size BinsData Assimilation
ALADIN-DustALADINARPEGE25 km × 25 km70 σ-layers3 bins (0.078–5 μm)No
ICON-ARTDWDICON-ART Global40 km global90 (global) and 60 (nest) Smooth Level Vertical SLEVE coordinate [88]3-log-normal modes for mass and number concentrationNo
Disclaimer/Publisher’s Note: The statements, opinions and data contained in all publications are solely those of the individual author(s) and contributor(s) and not of MDPI and/or the editor(s). MDPI and/or the editor(s) disclaim responsibility for any injury to people or property resulting from any ideas, methods, instructions or products referred to in the content.

