A Comparison of Risk Estimates for the Effect of Short-Term Exposure to PM, NO2 and CO on Cardiovascular Hospitalizations and Emergency Department Visits: Effect Size Modeling of Study Findings


 ,
,
Abstract
: Although particulate matter (PM), nitrogen dioxide (NO2) and carbon monoxide (CO) typically exist as part of a complex air pollution mixture, the evidence linking these pollutants to health effects is evaluated separately in the scientific and policy reviews of the National Ambient Air Quality Standards (NAAQS). The objective of this analysis was to use meta-regression methods to model effect estimates for several individual yet correlated NAAQS pollutants in an effort to identify factors that explain differences in the effect sizes across studies and across pollutants. We expected that our consideration of the evidence for several correlated pollutants in parallel could lead to insights regarding exposure to the pollutant mixture. We focused on studies of hospital admissions for congestive heart failure (CHF) and ischemic heart disease (IHD), which have played an important role in the evaluation of the scientific evidence communicated in the PM, NO2, and CO Integrated Science Assessments (ISAs). Of the studies evaluated, 11 CHF studies and 21 IHD studies met our inclusion requirements. The size of the risk estimates was explained by factors related to the pollution mixture, study methods, and monitoring network characteristics. Our findings suggest that additional analyses focusing on understanding differences in effect sizes across geographic areas with different pollution mixtures and monitor network designs may improve our understanding of the independent and combined effects of correlated pollutants.1. Introduction
Recent reports outline strategies for evaluating the health effects of air pollutants using a multipollutant framework [1,2]. These reports address the importance of considering the combined effects of exposure to multiple pollutants as well as the independent effects of each pollutant. The multipollutant approach, however, poses challenges for the scientific and policy reviews required by the Clean Air Act because individual pollutants are evaluated separately, according to a five year cycle, under the Act. Despite the challenges, the US EPA is currently planning to develop a multipollutant science assessment to support reviews of the National Ambient Air Quality Standards (NAAQS) under the Clean Air Act [3].
Although the science needed to inform our understanding of the health effects of air pollution mixtures is not adequately developed at present [4], the current body of evidence on single pollutant effects can be leveraged to characterize the state of knowledge regarding the independent and the combined effects of exposure to multiple pollutants. The objective of this analysis was to consider the evidence on single pollutant associations of PM, CO and NO2 with cardiovascular hospitalizations reported across a range studies. We applied meta-regression methods to understand the differences in the size of the observed effect estimates across studies. We hypothesized that several factors including those related to characteristics of the study design, pollution mixture and monitoring network would explain some of heterogeneity observed.
A large number of studies of the effect of air pollution on hospitalizations or emergency department (ED) visits for cardiovascular diseases were conducted since the early 1990's. Studies of ischemic heart disease (IHD) and Congestive Heart Failure (CHF) were the object of this analysis because evidence on these specific health outcomes formed the basis for EPA's conclusions regarding the short-term health effects attributed to CO and PM in the most recent Integrated Science Assessments (ISAs) conducted by EPA as part of the NAAQS review process [5,6]. Although evidence of the effect of NO2 on cardiovascular diseases was more limited overall, associations of IHD and CHF with short term NO2 exposure were consistently reported in hospitalization studies. Potential confounding by co-pollutants added uncertainty in determining whether causal association exists between CVD hospitalizations and each of these correlated individual pollutant exposures. We expected that our consideration of the evidence for these correlated pollutants, simultaneously and in parallel, would improve our understanding of the air pollution mixture and/or help to characterize what is not known about the health effects of the mixture.
2. Methods
Studies included in this analysis were selected from among those identified for inclusion in the ISAs. The methods employed for study selection and literature review are described in detail in Chapter 1 of these documents (e.g., [5]). All hospital admission or ED visit studies that focused on cardiovascular-related outcomes from 1990 to 2009 were reviewed. From this group of studies we only included single-city short-term exposure studies of hospital admissions or ED visits for IHD or CHF. Studies were excluded if they used generalized additive models (GAM) in S-PLUS and default convergence criteria because this statistical approach was found to underestimate the standard errors of risk estimates [7] and were given less weight in the ISAs. Additionally, studies were only included in this analysis if they presented quantitative results for at least one of the pollutants of interest (i.e., PM2.5, PM10, NO2 or CO).
An additional set of criteria were then applied to select one effect estimate for each pollutant from each study for inclusion in the meta-regression analysis. We selected effect estimates based on the following criteria: (1) if estimates for IHD and Myocardial Infarction (MI) were presented the MI estimate was selected; (2) if effect estimates for gases and PM10 were available, but an effect estimate for PM2.5 was not presented, the PM10 estimate was selected; (3) if estimates for multiple age groups were presented, the estimate for older adults was selected; (4) if multiple averaging times were presented, the 24-h average was selected; (5) if multiple lags were presented, the multi-day average lag was included, and if only single day lags were presented, lag 0 was chosen first, then lag 1, otherwise the “most significant” lag if presented. No co-pollutant adjusted estimates were included in meta-regression analysis.
In order to compare risk estimates for different pollutants within studies we standardized the effect estimates by their interquartile range (IQR) and plotted the estimates with their 95% confidence intervals (CI's) (e.g., Figures 1 and 2).Effect estimates were standardized to the increments EPA used in previous assessments for specific averaging times for the meta-regression analysis(i.e.,10 μg/m3 for PM, 0.5 ppm for 24-h average CO, 1 ppm for 1-h average CO and 25 ppb for NO2 for 24-h average concentrations). The metareg procedure in STATA was used to model effect sizes and determine whether differences in the size of the single pollutant effect estimates across studies was related to study characteristics. Both fixed and random effects models were considered to analyze these data. Results from the random-effects meta-regression are presented because heterogeneity between study estimates was detected. Study level summary data were modeled and each effect estimate was assigned a weight based on the inverse variance of the log Relative Risk (RR). Random effects meta-regression assumes that the log RR's are approximately normally distributed. Tests to identify publication bias were conducted using STATA metabias, which performs the Begg and Mazumdar [8] adjusted rank correlation test and the Egger et al. [9] regression asymmetry test.
The regression coefficient obtained from a meta-regression analysis represents the change in the log RR per incremental increase the air pollutant. The study characteristics examined included: study location (i.e., United States (US)/Canadian versus other); validation of cardiovascular outcome by health professional; PM10 versus PM2.5; multiday average lag versus single day lag; and older adults versus all ages combined. Each of these potential predictors of effect size was modeled separately.
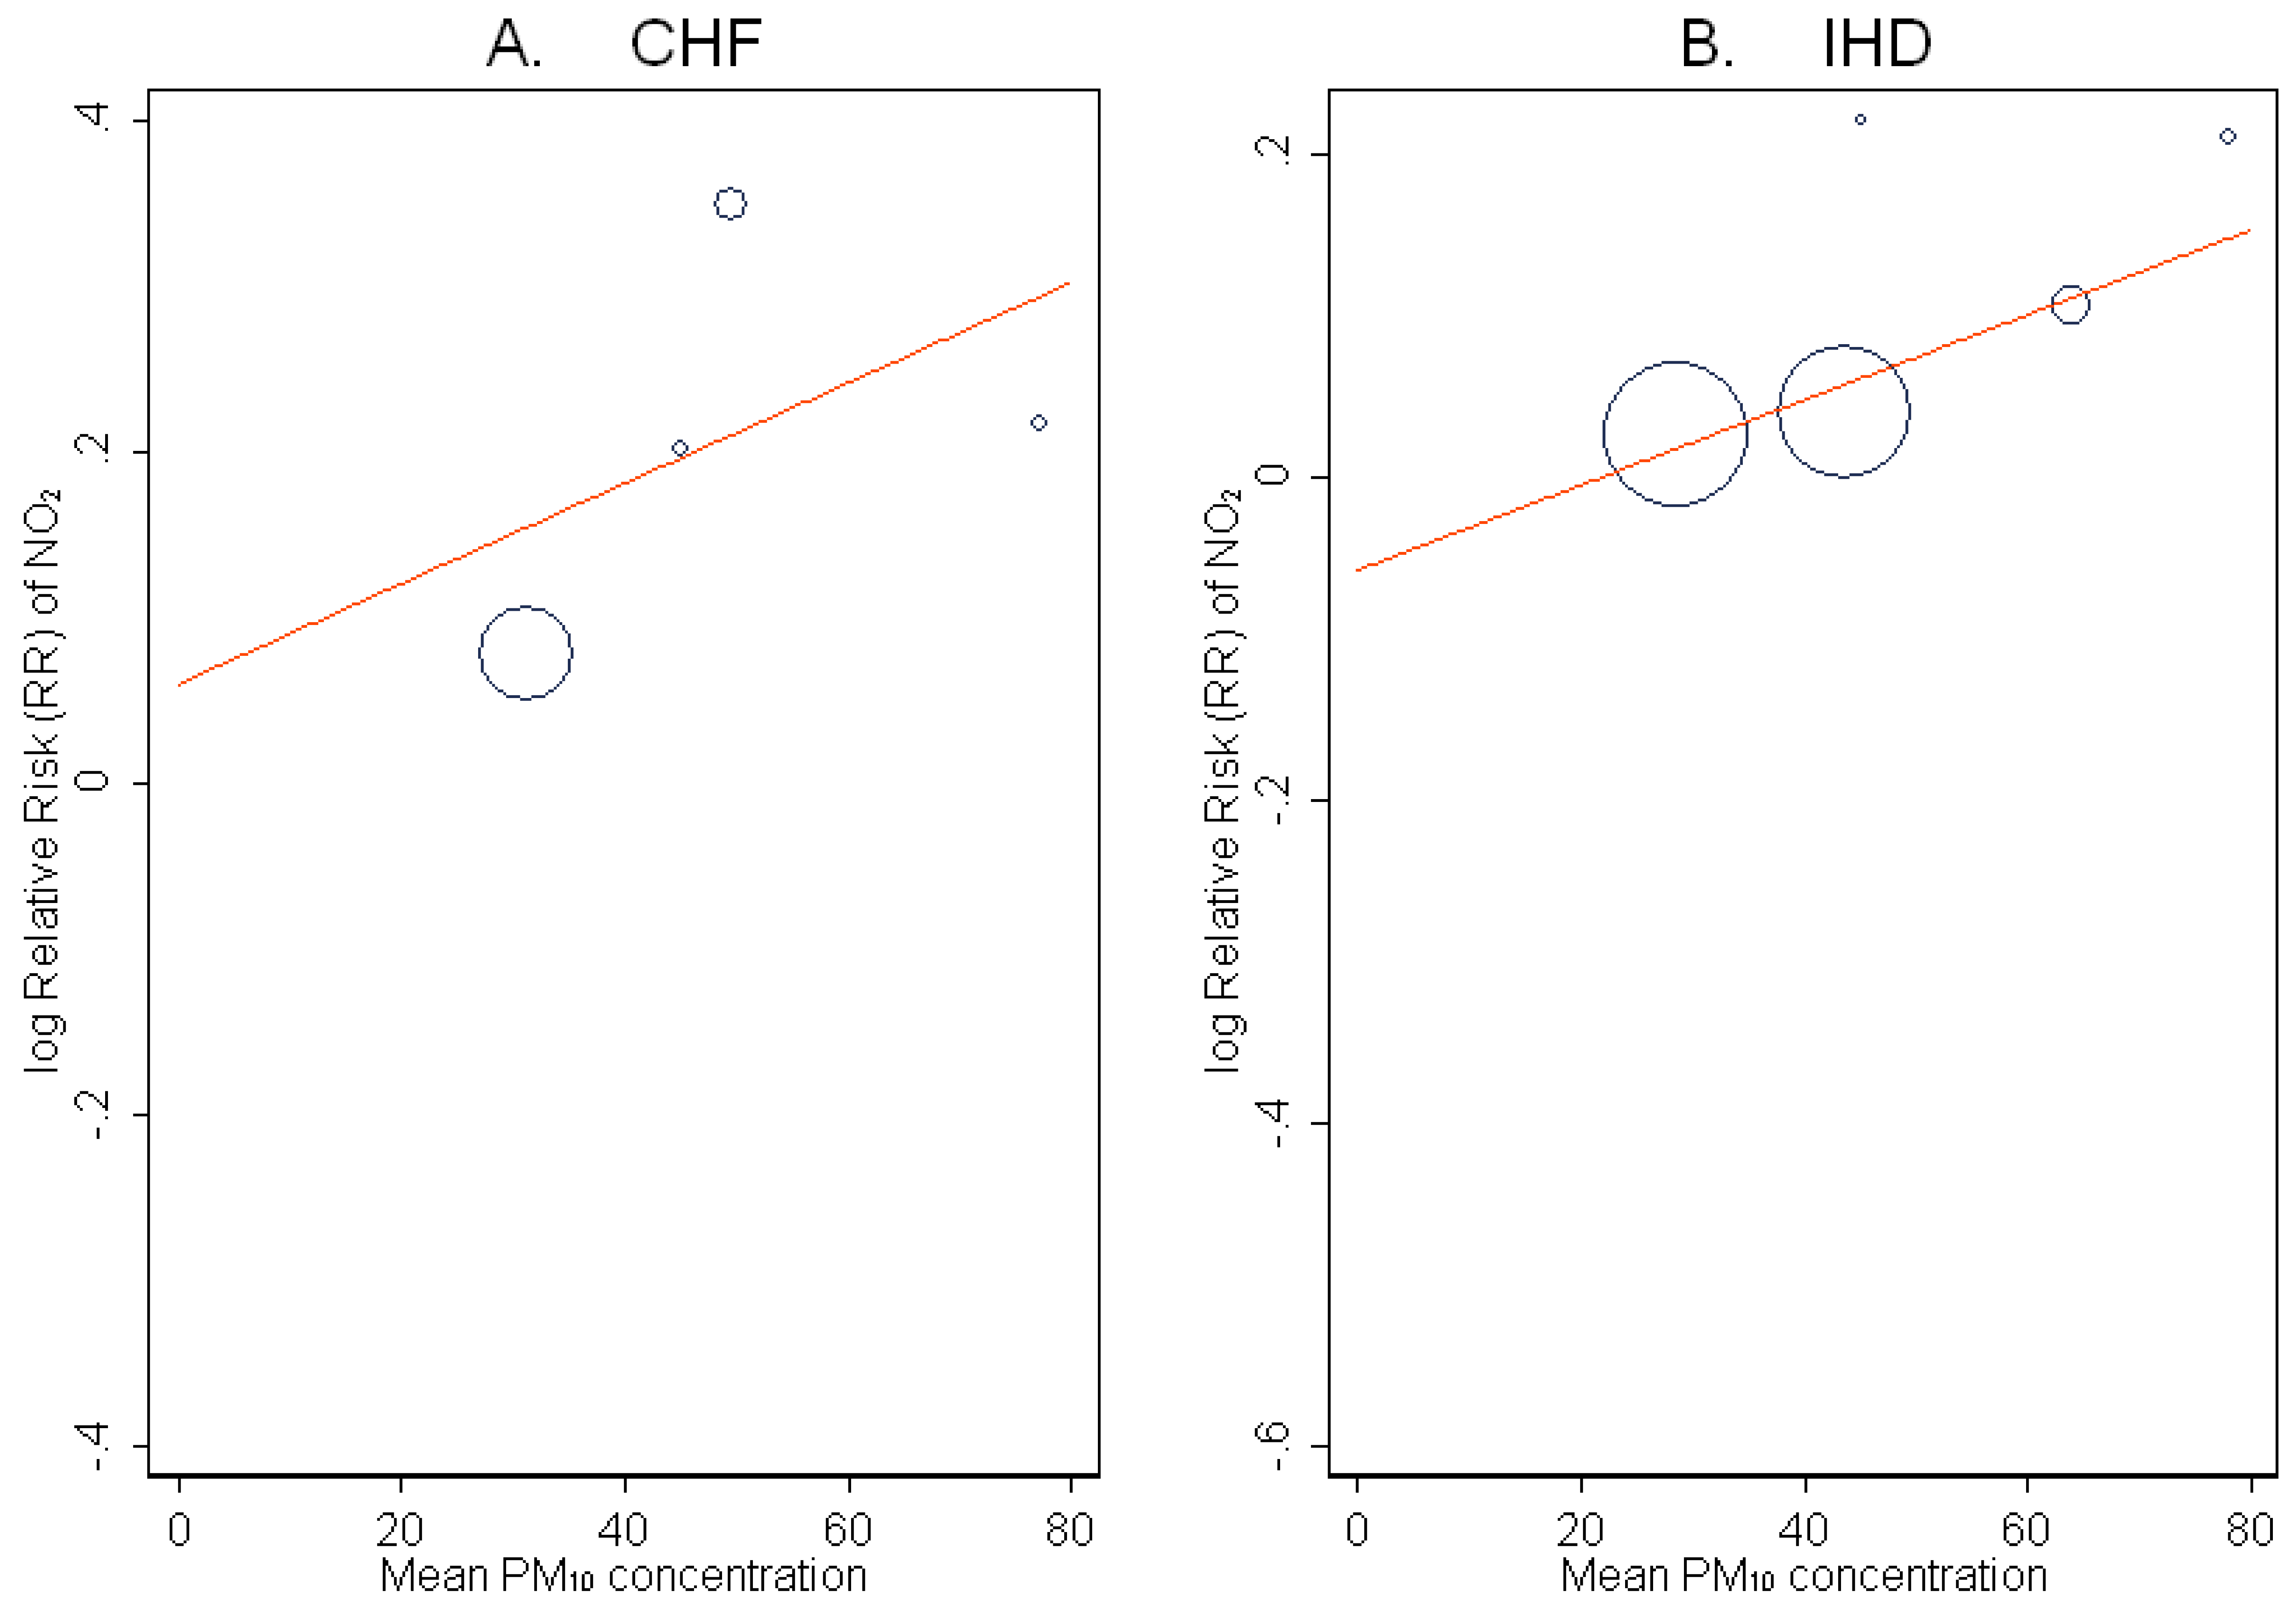
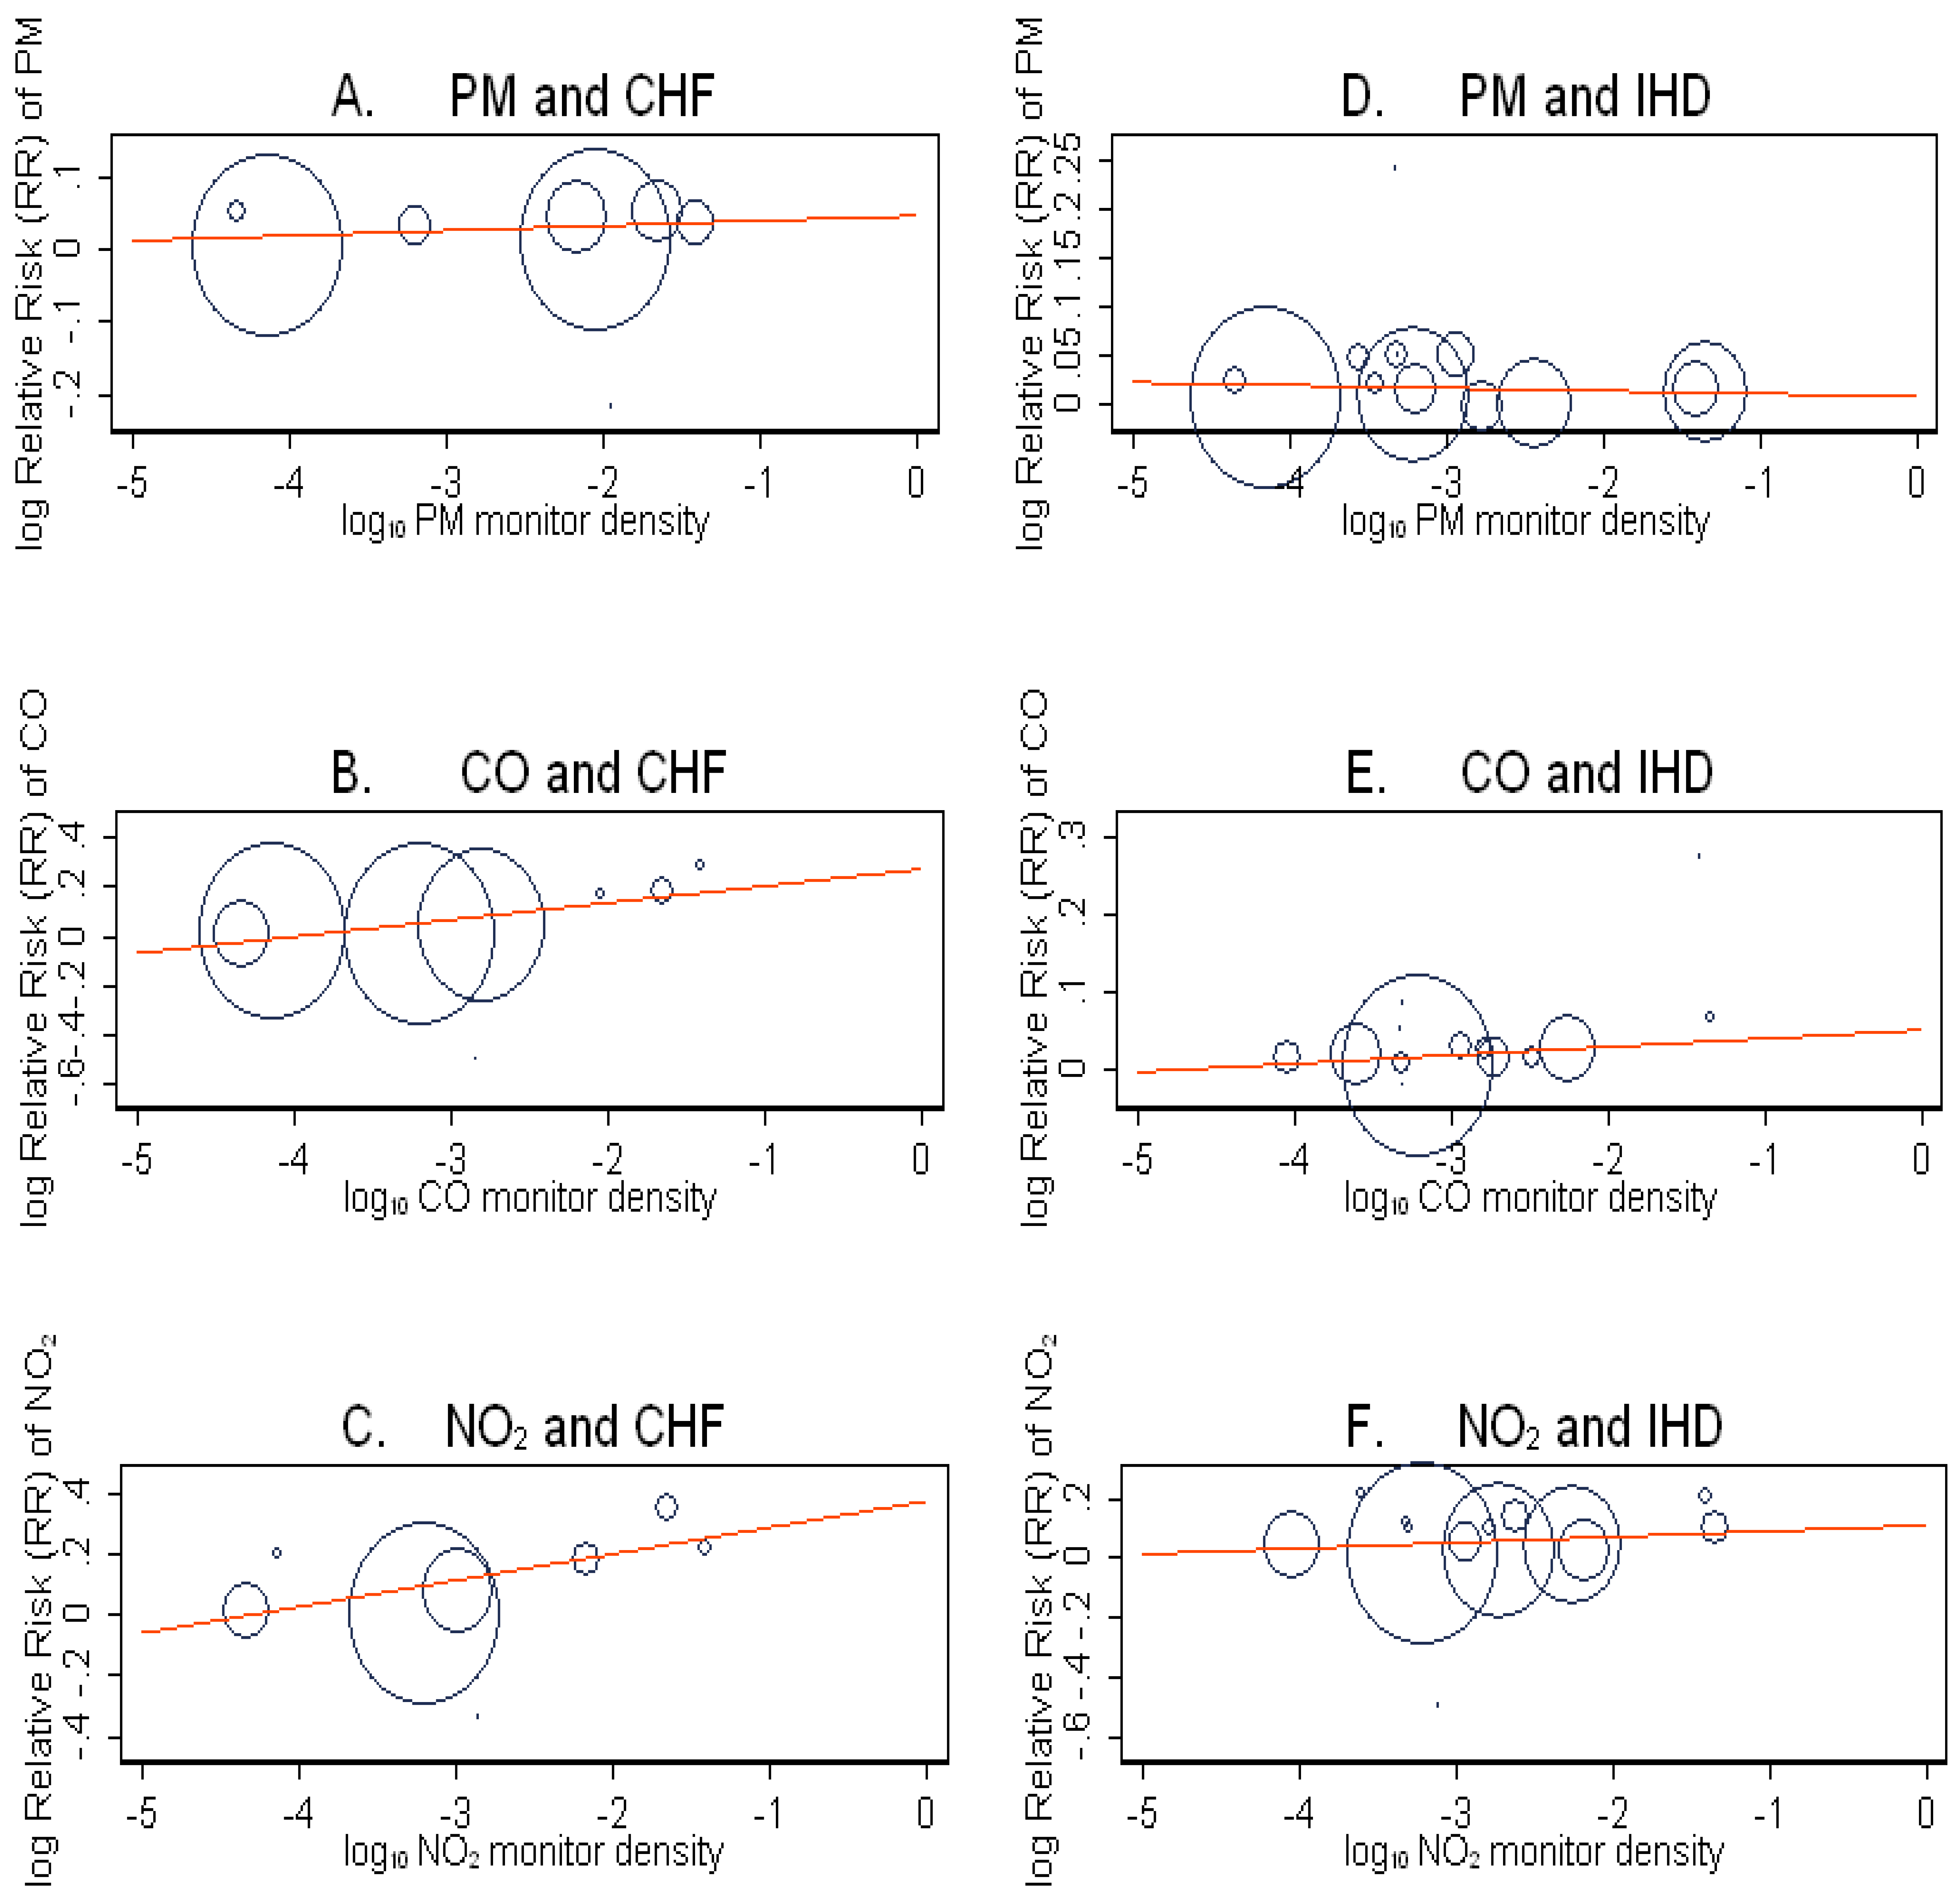
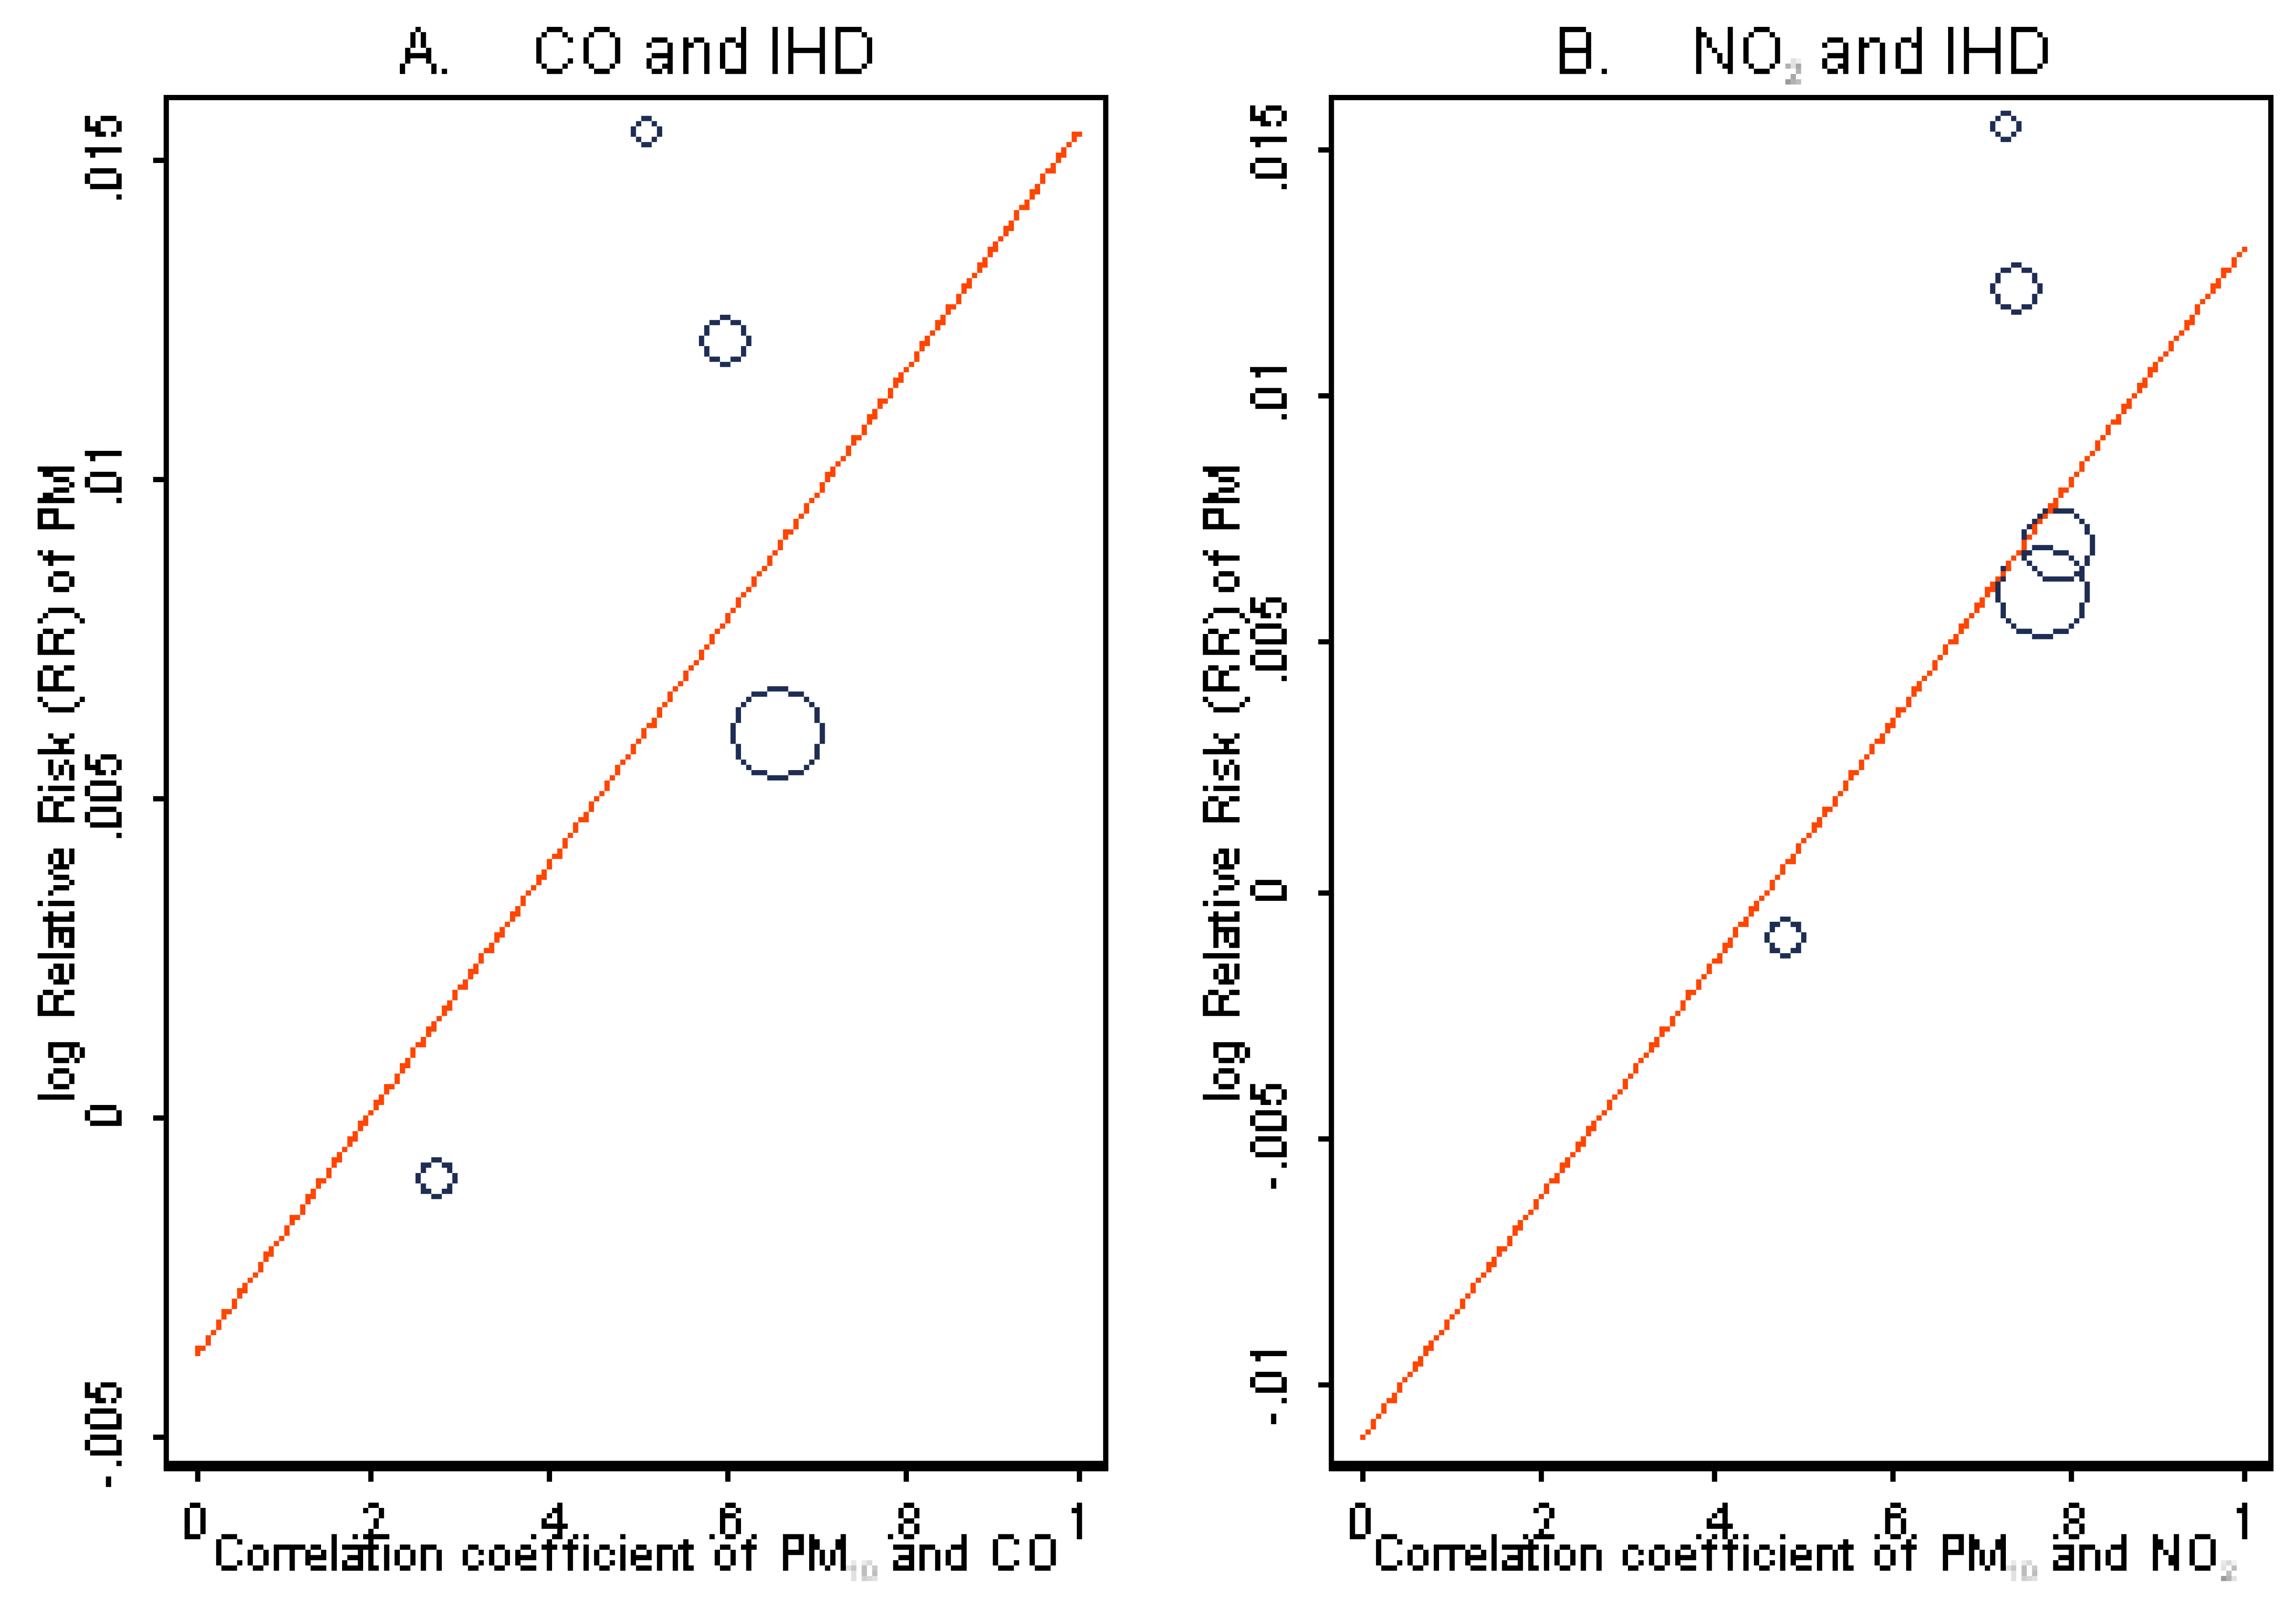
The univariate relationship between the log RR and several continuous variables including, mean concentrations, correlations between pollutants and monitor density, was also determined and plotted. Monitor density was defined as the log of the number of monitors divided by the area of the study as reported by the investigators or as estimated independently using Geographic Information Systems (GIS) methods. The size of the circle on the plots of these univariate relationships is proportional to the inverse of the variance of the log RR. The lines represent the inverse variance weighted regression equations. Larger circles indicate larger studies that are given more weight in the meta-regression analysis.
3. Results
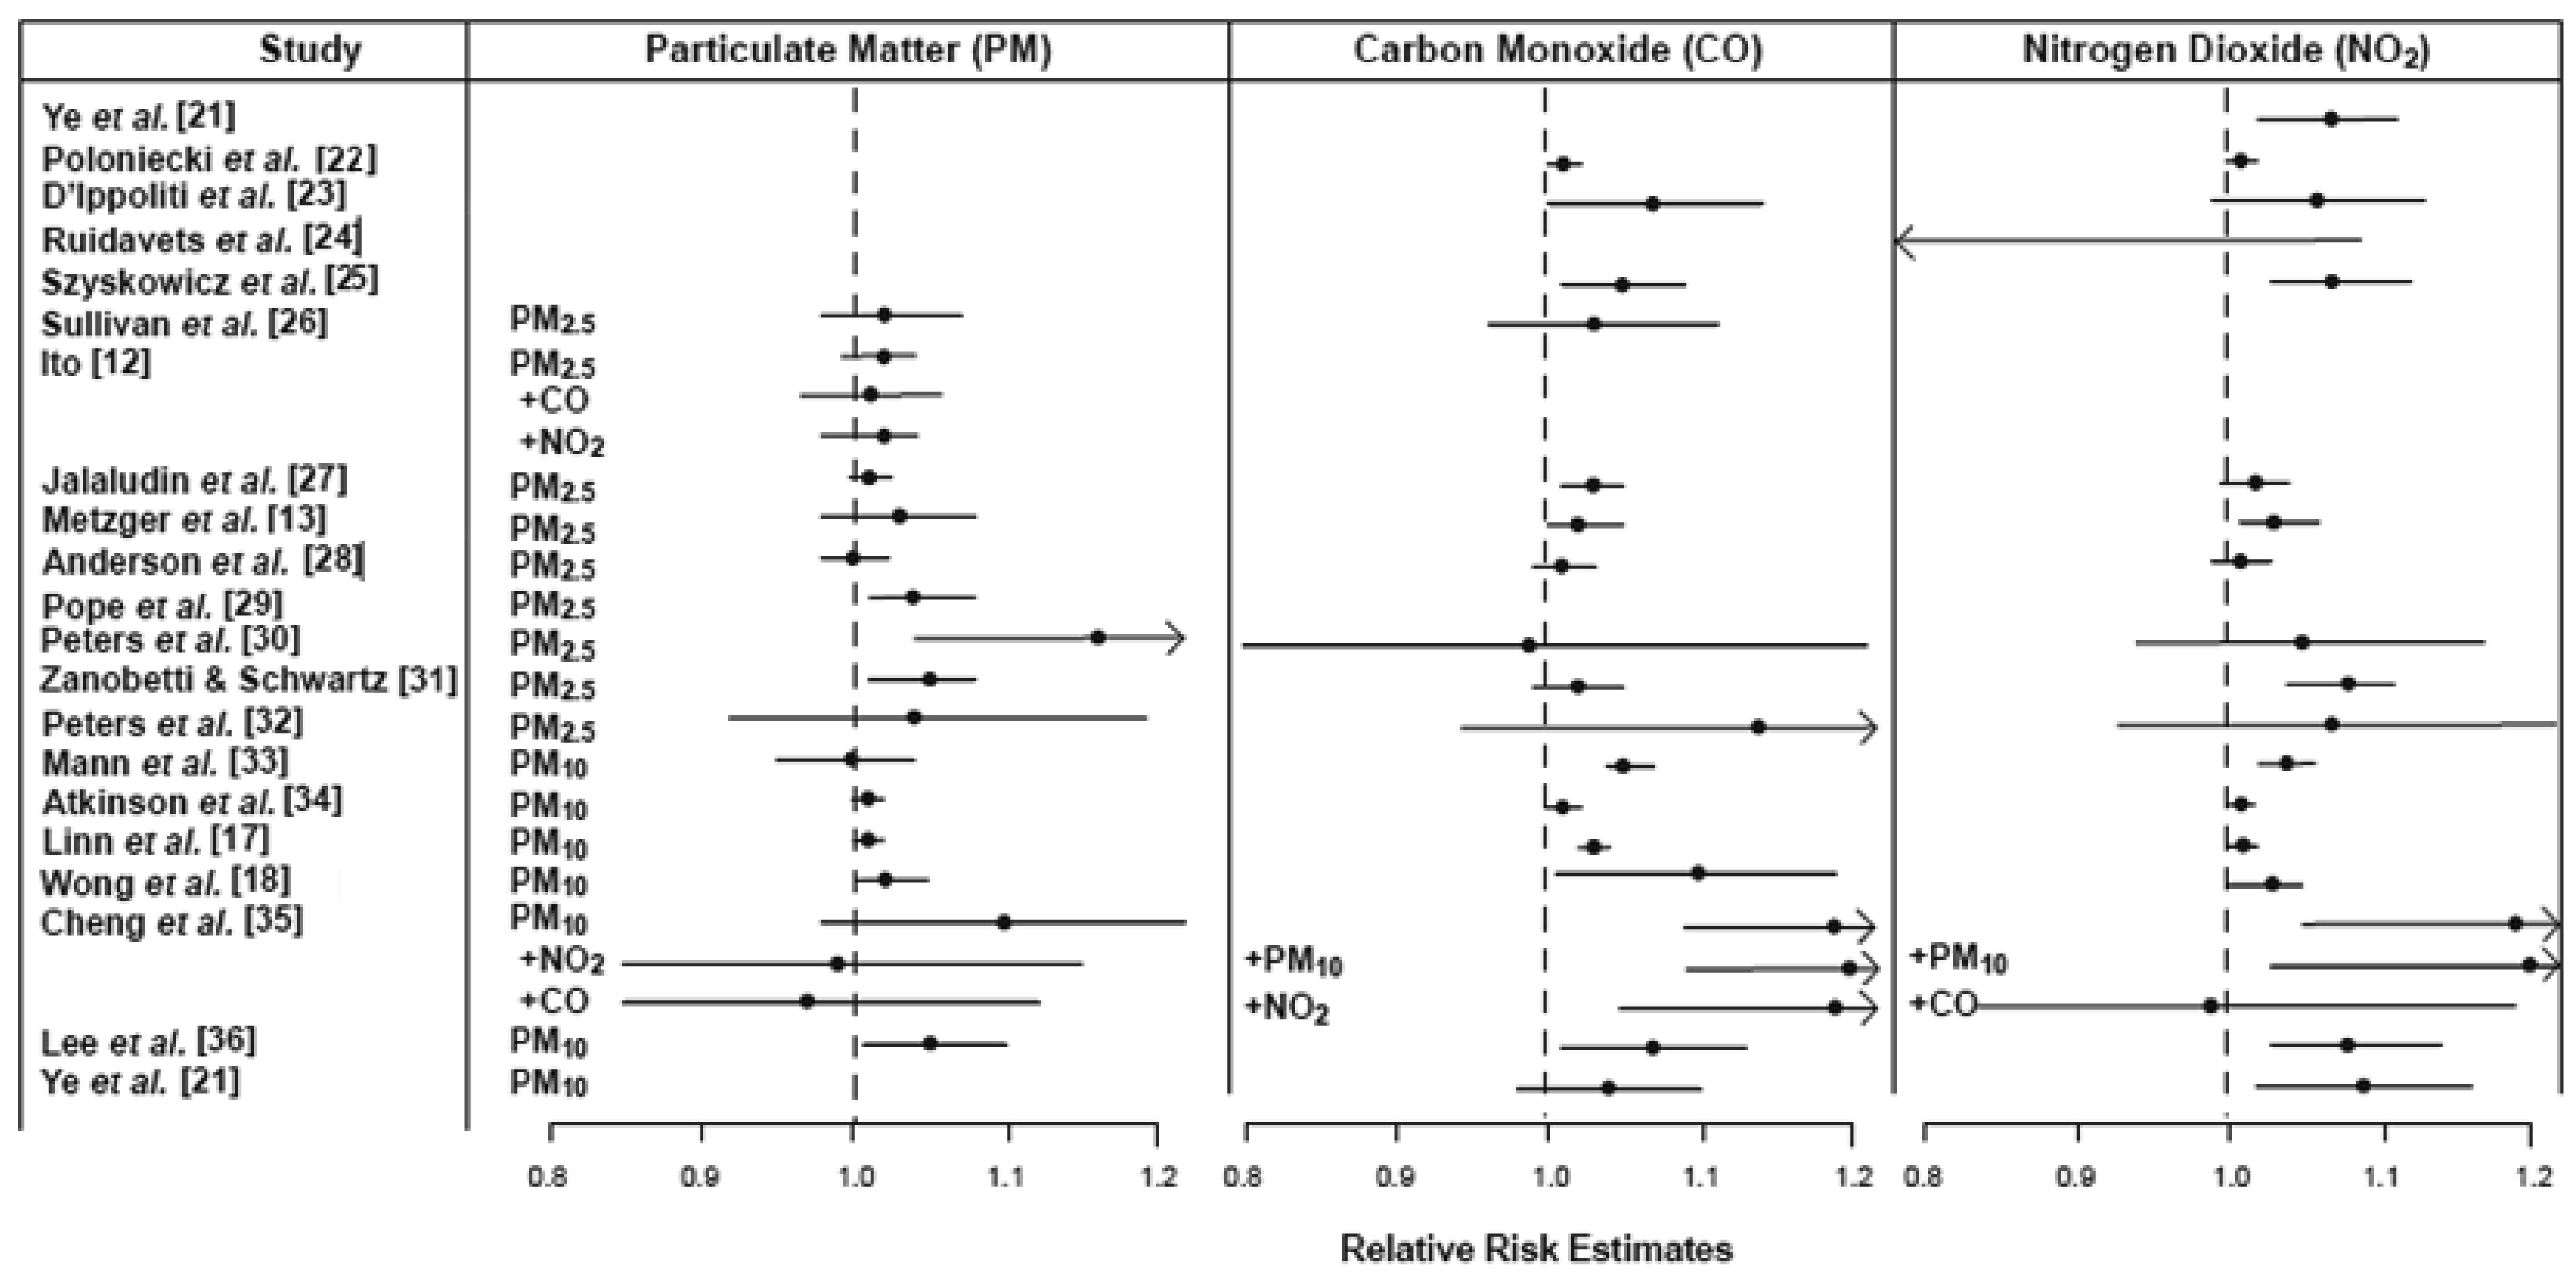
Eleven studies of CHF met our inclusion criteria (Figure 1). The majority of the effect estimates are positive and statistically significant. Most studies do not examine all three pollutants (i.e., PM, CO and NO2) nor do they consistently present quantitative results for the pollutants examined. Three studies present results from two-pollutant models and these results are not consistent regarding which pollutant remains robust after adjustment. Twenty-one studies of IHD/MI were included in the analysis (Figure 2). A similar pattern of positive, statistically significant results was observed. As shown in both figures, not all studies examined or presented results for each of the pollutants of interest. Risk estimates for both CHF and IHD/MI vary in their precision as well as their size.
Results of the meta-regression analysis are presented in Tables 1 and 2. Generally, the Begg's test, which has relatively low power, failed to detect statistical evidence of publication bias for most pollutant-outcome combinations while p-values generated using the Egger's test were smaller and more often significant at the p = 0.05 level. Overall, CHF effect estimates for US studies were smaller but this relationship did not hold for the IHD studies. Case crossover designs yielded somewhat larger estimates for both outcomes while the choice of single day lags resulted in somewhat smaller estimates. Studies restricted to older adults (>64 years old) generally did not report larger estimates although the log RR for the effect of CO on CHF admissions was larger comparing populations restricted to adults 65 years to populations including all adults. Choice of PM size fraction (i.e., PM10 versus PM2.5) did not explain the differences in the size of estimates for PM across the CHF studies included. For the group of IHD/MI studies included in the analyses larger log RR's were observed depending on the PM size fraction (i.e., PM10 versus PM2.5) and independent confirmation of diagnosis (Table 2). Overall, a small proportion of the variance (e.g., <5%) was explained by the covariate evaluated separately.
The univariate relationships between the log RR for PM, NO2 and CO and several continuous variables related to the pollutant mixture and monitoring network (i.e., monitor density, mean concentration, and correlation between pollutants) are shown in Figures 3–5. Mean concentrations and correlations between pollutants were not reported for all pollutants in all studies that met our inclusion criteria (each circle on these figures represents one study). Since these covariates were not reported consistently across studies we interpret the results qualitatively and present results when there was a suggestion of a relationship. The log RR of CHF and IHD hospitalization with NO2 exposure increases with PM10 concentration (Figure 3).The log RR increased with log monitor density in most plots with the relationship for NO2 and CHF hospitalization showing the largest increase with monitor density (Figure 4). The univariate relationship between the log RR for PM10 and the correlations of PM10 with CO and NO2 for the IHD studies are in Figure 5. The log RR increased with stronger correlations in the limited number of studies available to evaluate this relationship. Too few studies presented the necessary data to evaluate the comparable plots for the CHF studies.
4. Discussion
EPA currently plans to develop a multipollutant science assessment whereby the health effects of exposures to multiple pollutants may be systematically evaluated [3]. Although the number of studies specifically designed to evaluate the effect of mixtures of air pollutants is limited, a National Research Council report suggests that review of multiple pollutants simultaneously and in parallel is scientifically prudent at this time [3]. We conducted this effect size modeling analysis in an effort to consider the evidence for PM, CO and NO2 in such a multipollutant context.
Not all studies included in this analysis reported results for all pollutants evaluated and publication bias was detected for associations with each of the pollutants. Studies also varied in their methods and analytical approach. It would have been ideal to evaluate effect modification by relevant parameters of the mixture and design network including the long-term average concentration of the co-pollutant, correlations between pollutants and monitor density, while holding the effect of study design and method constant. However, there were too few studies to include multiple variables in the meta-regression models. Consequently we did not evaluate potential predictors of effect size related to the pollutant mixtures while controlling for study design variables. Further, we did not account for the variable methods of temperature adjustment our analysis because too many strategies were employed across the studies (e.g., stratification, matching, and inclusion of nonlinear or linear terms for temperature).
Despite these limitations, effect size modeling confirmed that some variation in the log RR between studies was due to study design, choice of lag and other methodological differences across studies. We observed that the log RR for NO2 associations increased with PM10 concentration and the log RR for PM associations increased with the correlation of PM10 and NO2. We also found that the size of the risk estimate for CVD hospitalizations increased with increasing monitor density. Enhanced spatial coverage of the monitors is expected to reduce the potential for exposure error and consequently reduce attenuation of the risk estimates. A similar result suggesting increased effect estimates for CVD hospitalizations was observed by Bell et al. [37], who found that an IQR increase in monitor density corresponded to an 8% and 20% increase in the association with CO and NO2, respectively. Sarnat et al. [38] did not find that effect estimates varied across different monitors in an urban area, although they were attenuated for CO and NO2 (but not PM2.5) when a rural monitor located 60 km away was used for the analysis. This finding may be due to the somewhat greater variability for CO and NO2 relative to PM2.5. This is also supported by a simulation study showing a smaller impact of measurement error on effect estimates for pollutants with less spatial heterogeneity [39]. Further, these findings may also be due to chance since a large number of relationships were explored.
To date, only a few multicity studies of hospital admissions and ED visits for IHD/MI or CHF have included analyses of multiple pollutants, in contrast to the single-city analysis results described here. Bell et al. [37] report a significant single pollutant effect of CO with all cardiovascular disease (CVD) admissions and reported that the effect was robust to adjustment for PM2.5, NO2 and elemental carbon (EC). In a separate report, these authors found a significant effect for PM2.5 in a single-pollutant model [40]. These investigators have also analyzed PM2.5 components and size fractions, attempting to distinguish their independent effects through the use of multipollutant models [41–43]. A report from the United Kingdom Department of Health [44] presented pooled estimates for cardiovascular hospital admissions including IHD and CHF. Authors reported that both heterogeneity in the size of the effect estimates and publication bias were detected. Few studies have evaluated the sources of heterogeneity in risk estimates across single city studies of hospital admission and ED visits for cardiovascular diseases. One previous multicity analysis conducted in Europe reported that 84% of the heterogeneity in the PM10 estimates across the cities examined could be explained by the PM10-NO2 correlation. The PM10-NO2 correlation explained a much smaller proportion (i.e., <4%) of the between estimate variation in these analyses.
The integration of findings across scientific disciplines in the ISA supported the independent effects of PM and CO exposure on IHD and CHF [5,6]. Associations between short term NO2 exposure and cardiovascular hospitalizations were also consistently observed [45].The simultaneous consideration of these highly correlated individual pollutants represents an initial step in assessing the health effects of multiple pollutants in the absence of a large number of studies designed specifically to evaluate the effects of complex pollutant mixtures. In this paper, we present preliminary results suggesting that study methodology, concentrations of other pollutants, and monitor density may influence the observed effect estimates in single-city studies of air pollution and cardiovascular hospitalizations or ED visits. Our results may be useful in the design of future studies or aid in interpreting health effects in a multipollutant context. For example, the suggestion that NO2 effect estimates are higher when PM10 concentrations are also elevated may suggest a joint effect of these pollutants, or that PM is an indicator for poor air quality in general. However, our analyses were limited because findings for various pollutants, lags and averaging times examined were not reported consistently across studies, nor were the mean levels of co-pollutants and correlations between pollutants. Efforts by investigators to report results for the complete set of associations examined would maximize the utility of single city studies of air pollution for these types of meta-regression analyses.


| Covariate * | Statistic | PM (n = 9) | CO (n = 8) | NO2 (n = 8) |
|---|---|---|---|---|
| USA or Canada | Beta | −0.0355 | −0.0967 | −0.1117 |
| Standard Error | 0.0067 | 0.0697 | 0.0986 | |
| p-value | <0.001 | 0.166 | 0.257 | |
| Sample Size | n = 6 | n = 4 | n = 4 | |
| Case-crossover design | Beta | 0.0045 | 0.0360 | 0.1031 |
| Standard Error | 0.0091 | 0.0070 | 0.0933 | |
| p-value | 0.621 | <0.001 | 0.269 | |
| Sample Size | ||||
| 65 years or older | Beta | −0.0153 | 0.0262 | −0.0598 |
| Standard Error | 0.175 | 0.0073 | 0.1429 | |
| p-value | 0.381 | <0.001 | 0.676 | |
| Sample Size | n = 5 | n = 4 | n = 4 | |
| PM10 | Beta | −0.0163 | ||
| Standard Error | 0.0141 | |||
| p-value | 0.244 | |||
| Sample Size | n = 4 | |||
| Single day lag | Beta | −0.0373 | −0.0852 | −0.0917 |
| Standard Error | 0065 | 0.0669 | 0.0964 | |
| p-value | <0.001 | 0.203 | 0.341 | |
| Sample Size | n = 3 | n = 4 | n = 4 |
*The meaning of the sign preceding the effect can be interpreted based on the following reference groups: USA and Canadian studies versus other; Case-crossover versus time series design; 65 years and older versus all ages combined; PM10 versus PM2.5; Single day lag versus multi-day average lags.
| Covariate ** | Statistic | PM (n = 16) | CO (n = 15) | NO2(n = 17) |
|---|---|---|---|---|
| USA or Canada | Beta | −0.0031 | 0.0154 | 0.0243 |
| Standard Error | 0.0035 | 0.0033 | 0.0108 | |
| p-value | 0.382 | <0.001 | 0.025 | |
| Sample Size | n = 8 | n = 7 | n = 7 | |
| Case-crossover design | Beta | 0.0192 | 0.0103 | 0.099 |
| Standard Error | 0.0077 | 0.0102 | 0.0271 | |
| p-value | 0.012 | 0.312 | <0.001 | |
| Sample Size | n = 6 | n = 6 | n = 6 | |
| 65 years or older | Beta | 0.0061 | 0.0070 | 0.0219 |
| Standard Error | 0.0036 | 0.0064 | 0.0244 | |
| p-value | 0.095 | 0.276 | 0.369 | |
| Sample Size | n = 4 | n = 4 | n = 5 | |
| Confirmed diagnosis | Beta | 0.0330 | −0.0052 | −0.0005 |
| Standard Error | 0.0144 | 0.0148 | 0.0856 | |
| p-value | 0.022 | 0.726 | 0.995 | |
| Sample Size | n = 3 | n = 3 | n = 3 | |
| PM10 | Beta | −0.018 | ||
| Standard Error | 0.0059 | |||
| p-value | 0.002 | |||
| Sample Size | n = 7 | |||
| Single day lag | Beta | −0.0039 | −0.0087 | −0.187 |
| Standard Error | 0.0040 | 0.0065 | 0.0125 | |
| p-value | 0.338 | 0.181 | 0.134 | |
| Sample Size | n = 4 | n = 5 | n = 6 |
*Including studies of Myocardial Infarction (MI);**The meaning of the sign preceding the effect can be interpreted based on the following reference groups: US and Canadian studies versus other; Case-crossover versus time series design; 65 years and older versus all ages combined; Confirmed diagnosis versus ICD code only; PM10 versus PM2.5; Single day lag versus multi-day average lags.
Acknowledgments
The authors would like to acknowledge the skill and attention to detail of Kaylyn Siporin for the formatting and proofing of this manuscript. The views expressed in this article are those of the authors and do not necessarily represent the views or policies of the U.S. Environmental Protection Agency.
References
- Dominici, F.; Peng, R.D.; Barr, C.D.; Bell, M.L. Protecting human health from air pollution: Shifting from a single-pollutant to a multipollutant approach. Epidemiology 2010, 21, 187–194. [Google Scholar]
- Mauderly, J.L.; Burnett, R.T.; Castillejos, M.; Ozkaynak, H.; Samet, J.M.; Stieb, D.M.; Vedal, S.; Wyzga, R.E. Is the air pollution health research community prepared to support a multipollutant air quality management framework? Inhal. Toxicol. 2010, 22, 1–19. [Google Scholar]
- Johns, D.; Stanek, L.; Luben, T.; Kirrane, E.; Vandenberg, J.; Ross, M. The Development of a Multipollutant Science Assessment to Support Reviews of the US Environmental Protection Agency's National Ambient Air Quality Standards. Poster Presented at ISEE 2011, 23rd Congress of the International Society of Environmental Epidemiology, Barcelona Spain, 13–16 September 2011.
- National Research Council (NRC). Air Quality Management in the United States; NRC: Washington, DC, USA, 2004. [Google Scholar]
- U.S. EPA. Integrated Science Assessment for Carbon Monoxide; EPA/600/R-09/019F; Office of Research and Development, Research Triangle Park: Durham, NC, USA, 2010. [Google Scholar]
- U.S. EPA. Integrated Science Assessment for Particulate Matter; EPA/600/R-08/139F; Office of Research and Development, Research Triangle Park: Durham, NC, USA, 2009. [Google Scholar]
- Dominici, F.; McDermott, A.; Zeger, S.L.; Samet, J.M. On the use of generalized additive models in time-series studies of air pollution and health. Am. J. Epidemiol. 2002, 156, 193–203. [Google Scholar]
- Begg, C.B.; Mazumdar, M. Operating characteristics of a rank correlation test for publication bias. Biometrics 1994, 50, 1088–1101. [Google Scholar]
- Egger, M.; Smith, G.D.; Schneider, M.; Minder, C. Bias in meta-analysis detected by a simple, graphical test. British Medical Journal 1997, 315, 629–634. [Google Scholar]
- Poloniecki, J.D.; Atkinson, R.W.; de Leon, A.P.; Anderson, H.R. Daily time series for cardiovascular hospital admissions and previous day's air pollution in London, UK. Occup. Environ. Med. 1997, 54, 535–540. [Google Scholar]
- Koken, P.J.M.; Piver, W.T.; Ye, F.; Elixhauser, A.; Olsen, L.M.; Portier, C.J. Temperature, air pollution, and hospitalization for cardiovascular diseases among elderly people in Denver. Environ. Health Perspect. 2003, 111, 1312–1317. [Google Scholar]
- Ito, K. Associations of Particulate Matter Components with Daily Mortality and Morbidity in Detroit, Michigan. In Revised Analyses of Time-Series Studies of Air Pollution and Health; Special Report; Health Effects Institute: Boston, MA, USA, 2003; p. R828112. [Google Scholar]
- Metzger, K.B.; Tolbert, P.E.; Klein, M.; Peel, J.L.; Flanders, W.D.; Todd, K.H.; Mulholland, J.A.; Ryan, P.B.; Frumkin, H. Ambient air pollution and cardiovascular emergency department visits. Epidemiology 2004, 15, 46–56. [Google Scholar]
- Pope, C.; Renlund, D.; Kfoury, A.; May, H.; Horne, B. Relation of heart failure hospitalization to exposure to fine particulate air pollution. Am. J. Cardiol. 2008, 102, 1230–1234. [Google Scholar]
- Symons, J.M.; Wang, L.; Guallar, E.; Howell, E.; Dominici, F.; Schwab, M.; Ange, B.A.; Samet, J.; Ondov, J.; Harrison, D.; et al. A case-crossover study of fine particulate matter air pollution and onset of congestive heart failure symptom exacerbation leading to hospitalization. Am. J. Epidemiol. 2006, 164, 421–433. [Google Scholar]
- Wellenius, G.A.; Bateson, T.F.; Mittleman, M.A.; Schwartz, J. Particulate air pollution and the rate of hospitalization for congestive heart failure among Medicare beneficiaries in Pittsburgh, Pennsylvania. Am. J. Epidemiol. 2005, 161, 1030–1036. [Google Scholar]
- Linn, W.S.; Szlachcic, Y.; Gong, H., Jr.; Kinney, P.L.; Berhane, K.T. Air pollution and daily hospital admissions in metropolitan Los Angeles. Environ. Health Perspect. 2000, 108, 427–434. [Google Scholar]
- Wong, T.W.; Lau, T.S.; Yu, T.S.; Neller, A.; Wong, S.L.; Tam, W.; Pang, S.W. Air pollution and hospital admissions for respiratory and cardiovascular diseases in Hong Kong. Occup. Environ. Med. 1999, 56, 679–683. [Google Scholar]
- Lee, I.M.; Tsai, S.S.; Ho, C.K.; Chiu, H.F.; Yang, C.Y. Air pollution and hospital admissions for congestive heart failure in a tropical city: Kaohsiung, Taiwan. Inhal. Toxicol. 2007, 19, 899–904. [Google Scholar]
- Yang, C.Y. Air pollution and hospital admissions for congestive heart failure in a subtropical city: Taipei, Taiwan. J. Toxicol. Environ. Health A Curr. Iss. 2008, 71, 1085–1090. [Google Scholar]
- Ye, F.; Piver, W.T.; Ando, M.; Portier, C.J. Effects of temperature and air pollutants on cardiovascular and respiratory diseases for males and females older than 65 years of age in Tokyo, July and August 1980-1995. Environ. Health Perspect. 2001, 109, 355–359. [Google Scholar]
- Poloniecki, J.D.; Atkinson, R.W.; de Leon, A.P.; Anderson, H.R. Daily time series for cardiovascular hospital admissions and previous day's air pollution in London, UK. Occup. Environ. Med. 1997, 54, 535–540. [Google Scholar]
- D'Ippoliti, D.; Forastiere, F.; Ancona, C.; Agabiti, N.; Fusco, D.; Michelozzi, P.; Perucci, C.A. Air pollution and myocardial infarction in Rome: a case-crossover analysis. Epidemiology 2003, 14, 528–535. [Google Scholar]
- Ruidavets, J.B.; Cournot, M.; Cassadou, S.; Giroux, M.; Meybeck, M.; Ferrieres, J. Ozone air pollution is associated with acute myocardial infarction. Circulation 2005, 111, 563–569. [Google Scholar]
- Szyszkowicz, M. Air pollution and emergency department visits for ischemic heart disease in Montreal, Canada. Int. J.Occup. Med. Environ. Health 2007, 20, 167–173. [Google Scholar]
- Sullivan, J.; Sheppard, L.; Schreuder, A.; Ishikawa, N.; Siscovick, D.; Kaufman, J. Relation between short-term fine-particulate matter exposure and onset of myocardial infarction. Epidemiology 2005, 16, 41–48. [Google Scholar]
- Jalaludin, B.; Morgan, G.; Lincoln, D.; Sheppeard, V.; Simpson, R.; Corbett, S. Associations between ambient air pollution and daily emergency department attendances for cardiovascular disease in the elderly (65+ years), Sydney, Australia. J. Expo. Sci. Environ. Epidemiol. 2006, 16, 225–237. [Google Scholar]
- Anderson, H.R.; Bremner, S.A.; Atkinson, R.W.; Harrison, R.M.; Walters, S. Particulate matter and daily mortality and hospital admissions in the west midlands conurbation of the United Kingdom: associations with fine and coarse particles, black smoke and sulphate. Occup. Environ. Med. 2001, 58, 504–510. [Google Scholar]
- Pope, C.; Renlund, D.; Kfoury, A.; May, H.; Horne, B. Relation of heart failure hospitalization to exposure to fine particulate air pollution. Am. J. Cardiol. 2008, 102, 1230–1234. [Google Scholar]
- Peters, A.; Dockery, D.W.; Muller, J.E.; Mittleman, M.A. Increased particulate air pollution and the triggering of myocardial infarction. Circulation 2001, 103, 2810–2815. [Google Scholar]
- Zanobetti, A.; Schwartz, J. Air pollution and emergency admissions in Boston, MA. J. Epidemiol. Community Health 2006, 60, 890–895. [Google Scholar]
- Peters, A.; von Klot, S.; Heier, M.; Trentinaglia, I.; Cyrys, J.; Hormann, A.; Hauptmann, M.; Wichmann, H.E.; Lowel, H. Particulate Air Pollution and Nonfatal Cardiac Events. Part I. Air Pollution, Personal Activities, and Onset of Myocardial Infarction in a Case-Crossover Study; Health Effects Institute: Boston, MA, USA, 2005. [Google Scholar]
- Mann, J.K.; Tager, I.B.; Lurmann, F.; Segal, M.; Quesenberry, C.P., Jr.; Lugg, M.M.; Shan, J.; van den Eeden, S.K. Air pollution and hospital admissions for ischemic heart disease in persons with congestive heart failure or arrhythmia. Environ. Health Perspect. 2002, 110, 1247–1252. [Google Scholar]
- Atkinson, R.W.; Bremner, S.A.; Anderson, H.R.; Strachan, D.P.; Bland, J.M.; de Leon, A.P. Short-term associations between emergency hospital admissions for respiratory and cardiovascular disease and outdoor air pollution in London. Arch. Environ. Occup. Health 1999, 54, 398–411. [Google Scholar]
- Cheng, M.F.; Tsai, S.S.; Yang, C.Y. Air pollution and hospital admissions for myocardial infarction in a tropical city: Kaohsiung, Taiwan. J. Toxicol. Environ. Health A 2009, 72, 1135–1140. [Google Scholar]
- Lee, J.T.; Kim, H.; Cho, Y.S.; Hong, Y.C.; Ha, E.H.; Park, H. Air pollution and hospital admissions for ischemic heart diseases among individuals 64+ years of age residing in Seoul, Korea. Arch. Environ. Health 2003, 58, 617–623. [Google Scholar]
- Bell, M.L.; Peng, R.D.; Dominici, F.; Samet, J.M. Emergency admissions for cardiovascular disease and ambient levels of carbon monoxide: Results for 126 U.S. urban counties, 1999–2005. Circulation 2009, 120, 949–955. [Google Scholar]
- Goldman, G.T.; Mulholland, J.A.; Russell, A.G.; Strickland, M.J.; Klein, M.; Waller, L.A.; Tolbert, P.E. Impact of exposure measurement error in air pollution epidemiology: Effect of error type in time-series studies. Environ. Health 2011, 10, 61. [Google Scholar]
- Sarnat, S.E.; Klein, M.; Sarnat, J.A.; Flanders, W.D.; Waller, L.A.; Mulholland, J.A.; Russell, A.G.; Tolbert, P.E. An examination of exposure measurement error from air pollutant spatial variability in time-series studies. J. Expo. Sci. Environ. Epidemiol. 2010, 20, 135–146. [Google Scholar]
- Bell, M.L.; Ebisu, K.; Peng, R.D.; Walker, J.; Samet, J.M.; Zeger, S.L.; Dominic, F. Seasonal and regional short-term effects of fine particles on hospital admissions in 202 U.S. counties, 1999-2005. Am. J. Epidemiol. 2008, 168, 1301–1310. [Google Scholar]
- Bell, M.L.; Ebisu, K.; Peng, R.D.; Samet, J.M.; Dominici, F. Hospital admissions and chemical composition of fine particle air pollution. Am. J. Respir. Crit. Care Med. 2009, 179, 1115–1120. [Google Scholar]
- Peng, R.; Bell, M.; Geyh, A.; McDermott, A.; Zeger, S.; Samet, J.; Dominici, F. Emergency admissions for cardiovascular and respiratory diseases and the chemical composition of fine particle air pollution. Environ. Health Perspect. 2009, 117, 957–963. [Google Scholar]
- Peng, R.D.; Chang, H.H.; Bell, M.L.; McDermott, A.; Zeger, S.L.; Samet, J.M.; Dominici, F. Coarse particulate matter air pollution and hospital admissions for cardiovascular and respiratory diseases among Medicare patients. JAMA 2008, 18, 2172–2179. [Google Scholar]
- Cardiovascular Disease and Air Pollution: A report by the Committee on the Medical Effects of Air Pollutants; Department of Health: London, UK, 2006.
- U.S. EPA. Integrated Science Assessment for Oxides of Nitrogen-Health Criteria; EPA/600/R-08/071; Office of Research and Development, Research Triangle Park: Durham, NC, USA, 2008. [Google Scholar]
© 2011 by the authors; licensee MDPI, Basel, Switzerland. This article is an open access article distributed under the terms and conditions of the Creative Commons Attribution license (http://creativecommons.org/licenses/by/3.0/).
Share and Cite
Kirrane, E.; Svendsgaard, D.; Ross, M.; Buckley, B.; Davis, A.; Johns, D.; Kotchmar, D.; Long, T.C.; Luben, T.J.; Smith, G.; et al. A Comparison of Risk Estimates for the Effect of Short-Term Exposure to PM, NO2 and CO on Cardiovascular Hospitalizations and Emergency Department Visits: Effect Size Modeling of Study Findings. Atmosphere 2011, 2, 688-701. https://doi.org/10.3390/atmos2040688
Kirrane E, Svendsgaard D, Ross M, Buckley B, Davis A, Johns D, Kotchmar D, Long TC, Luben TJ, Smith G, et al. A Comparison of Risk Estimates for the Effect of Short-Term Exposure to PM, NO2 and CO on Cardiovascular Hospitalizations and Emergency Department Visits: Effect Size Modeling of Study Findings. Atmosphere. 2011; 2(4):688-701. https://doi.org/10.3390/atmos2040688
Chicago/Turabian StyleKirrane, Ellen, David Svendsgaard, Mary Ross, Barbara Buckley, Allen Davis, Doug Johns, Dennis Kotchmar, Thomas C. Long, Thomas J. Luben, Genee Smith, and et al. 2011. "A Comparison of Risk Estimates for the Effect of Short-Term Exposure to PM, NO2 and CO on Cardiovascular Hospitalizations and Emergency Department Visits: Effect Size Modeling of Study Findings" Atmosphere 2, no. 4: 688-701. https://doi.org/10.3390/atmos2040688