Abstract
Thanks to its observational frequency of 15 min, the Meteosat Second Generation (MSG) geostationary satellite offers a great potential to monitor dust storms. To explore this potential, an algorithm for the detection and the retrieval of dust aerosol optical properties has been tested. This is a multispectral algorithm based on visible and infrared data which has been applied to 15 case studies selected between 2007 and 2011. The algorithm has been validated in the latitude–longitude box between 30 and 50 degrees north, and −10 and 20 degrees east, respectively. Hereafter we present the obtained results that have been validated against Aerosol Robotic Network (AERONET) ground-based measurements and compared with the retrievals from the Moderate Resolution Imaging Spectroradiometer (MODIS) on NASA’s Terra and Aqua satellites. The dust aerosol optical depth variations observed at the AERONET sites are well reproduced, showing good correlation of about 0.77, and a root mean square difference within 0.08, and the spatial patterns retrieved by using the algorithm developed are in agreement with those observed by MODIS.
1. Introduction
The Sahara desert is the largest source of dust in the world and thus it plays an important role in the radiative budget and climate change [1,2,3,4,5,6]. Solar radiation can be absorbed and scattered by mineral dust, and the mineral dust properties determine the fractions of the radiations absorbed or scattered as a function of wavelength. Mineral dust can also affect the global radiation balance indirectly through their interaction with clouds by acting as cloud condensation nuclei [7]. Mineral dust causes changes in the size distribution, persistence time, and the optical properties of clouds, thus influencing the radiative budget and causing a secondary effect on the global climate change [8,9,10]. The radiative impact of mineral dust in the atmosphere is not completely clear because of the lack of a deep knowledge of the nature, transport and removal processes and the chemical and physical properties of the particles. Aerosol satellite remote sensing is the most convenient tool for providing global aerosol spatial and temporal distributions. However, the satellite aerosol signal is difficult to be discriminated from the surface reflectance, which is the reason why algorithms based only on the visible spectral region often fail over bright surfaces [11,12,13], unless they use additional information such as that available on instruments like TOMS (UV observations), AATSR, MISR (multi-angle observation), and POLDER (polarization observations) [14,15,16]. Measurements from the Spinning Enhanced Visible and Infrared Imager (SEVIRI) on board the Meteosat Second Generation (MSG) can be used to identify atmospheric dust, and to infer the dust aerosol optical depth [17,18,19,20]. Some of these algorithms are based on visible channel only, and thus present limitations over bright background surfaces [18]. Alternative solutions have been proposed to address this issue, such as the MODIS deep blue algorithm [21]. A large set of dust optical depth over North Africa and the Middle East at half-hourly temporal resolution during daylight hours has been shown in [17]. The algorithms based on infrared channels developed over the last few years [22,23] show reasonable results over bright surfaces. The algorithm presented here is based on the observations from MSG/SEVIRI infrared and visible channels, and thus it allows the detection of the dust presence and the retrieval of the dust optical depth over a large area (in the latitude-longitude box between 30 and 50 degrees north, and −10 and 20 degrees east). The algorithm has been developed in a previous work [24] devoted to retrieve surface solar irradiance, and it is now applied to detect and retrieve dust in order to quantify its performances. With respect to previous studies, this algorithm is based on a very accurate FOV discrimination (clear, cloudy, affected by aerosol/dust) [25] and an accurate land-cover, which is crucial in order to retrieve the optical aerosol depth over land. With this accurate land cover, the algorithm permits to retrieve dust in very difficult cases, such as when it is hard to discriminate dust signal from the surface reflectance.
2. Algorithm Description
Section 2.1 describes the considered data set, Section 2.2 describes the dust aerosol detection, Section 2.3 describes the albedo and the emissivity data used, and finally Section 2.4 describes the dust aerosol optical retrieval.
2.1. Data Set
The algorithm presented here is based on MSG/SEVIRI radiometer visible and infrared observations. The SEVIRI has been available on board MSG since its launch in August 2002, but the data have been available only since February 2004. Every 15 min SEVIRI provides measurements in 12 spectral channels: 3 solar channels (0.6, 0.8 and 1.6 μm), 8 infrared channels (3.9, 6.2, 7.3, 8.7, 9.7, 10.8, 12.0 and 13.4 μm) and one High-Resolution broadband Visible channel (HRV) (0.4–1.1 μm). The SEVIRI nadir spatial sampling at sub-satellite point is 1 km for the HRV channel and 3 km for the other channels. Four of the twelve SEVIRI channels look at sunlight reflected both from the clouds and the Earth’s surface, the other eight monitor thermal infrared emission. Among the latter, four measure the temperature of the clouds, land and sea surface, whereas the other four detect radiation emitted by water vapour, carbon dioxide and ozone in the atmosphere
A database of simulated MSG/SEVIRI radiance (HRV broadband and channels at 0.6 µm, 0.8 µm, 1.6 µm, 10.8 µm and 12.0 µm) was created by using temperature, humidity and trace gas concentration profiles for four standard atmospheres (tropical, midlatitude summer, midlatitude winter and US standard), diverse observation geometries, different types of albedo/emissivity values (more details in Section 2.3 , total water vapour column, and aerosol distributions. The simulations of aerosols have been carried out by using the following parameters: the number of atmospheric levels and phase function moments, the optical depth, the single scattering albedos and the Legendre moments of the phase function. These aerosol parameters are extracted from the Global Aerosol Data Set (GADS) [26,27]. GADS is a fully revised version of the aerosol climatology by D’Almeida et al. [28]. The data now consist of number distribution, mass per volume and optical properties. The aerosols are modelled as 10 components described with size distribution and spectral refractive index (on the basis of [26]). The optical properties are derived from these data in accordance with the Mie theory at wavelengths between 0.25 and 40 µm. The aerosol component properties themselves are available in the software package, for the entire globe, on a grid of 5 degrees in longitude and latitude with 7 differentiating height profiles, and both for summer and winter. The 10 different aerosol types are used for the simulations at 8 different relative humidity values. In GADS mineral aerosol or desert dust consist of a mixture of quartz and clay minerals and they are modelled with three modes allowing to consider increasing relative amount of large particles for increasing turbidity [26]. Also mineral transported is used to describe desert dust that is transported over long distances with a reduced amount of large particles. The atmospheric radiative transfer is modelled by using SBDART (Santa Barbara DISORT Atmospheric Radiative Transfer) [29] with 32 layers, 60 streams and delta-M method approximation (a natural extension of the delta-Eddington approximation to all orders M of angular approximation). SBDART is a software tool that computes plane-parallel radiative transfer in clear and cloudy conditions within the earth’s atmosphere and at the surface. Each aerosol type has been given a vertical distribution according to [26], which divides the atmosphere into four discrete layers, where the distributions of aerosol particles follow exponential profiles. The database was used to create a look-up table as a function of the profiles and four geophysical parameters: skin surface temperature (ST), total water vapour column, albedo/emissivity value, and aerosol microphysical parameters.
2.2. Dust Aerosol Detection
The technique developed for the detection of dust-contaminated pixels uses both MSG-SEVIRI infrared and visible observations. This technique is applied only to the pixels classified as cloud-free by the MACSP (cloud MAsk Coupling of Statistical and Physical methods) algorithm [25]. The dust aerosol detection algorithm has been validated in the latitude-longitude box between 30 and 50 degrees north, and −10 and 20 degrees east, for a total of 15 case studies selected between 2007 and 2011. The MSG-SEVIRI visible channel reflectances are used for detecting dust-contaminated pixels over sea (only during day time); a cloud-free pixel is classified as dust-contaminated when the following tests are successful:

The threshold tests applied both over land and sea (during day and night-time), uses the 8.7 µm, 10.8 µm, and 12.0 µm brightness temperatures by considering that the transmittance of many aerosols is characterized by a strong spectral variation in 8–10 µm and 10–12 µm spectral regions, over which the atmosphere is nearly transparent otherwise. In particular, Ackerman [30] investigated the detection of volcanic and soil-derived aerosol by using infrared measurements at three infrared wavelengths, 8.5 µm, 10.8 µm, and 12.0 µm. This technique has been applied to study volcanic aerosols [31] as well as dust outbreaks over Africa [32]. Dust detection is successfully carried out by using the difference between the brightness temperatures at channels centred at 10.8 µm (T10.8) and 12.0 µm (T12.0), because in the atmosphere the mineral dust absorption is stronger at 10.8 µm than it is at 12.0 µm [30,33]. On the basis of this knowledge, a pixel is classified as dust-contaminated if:
- Thresh1_T10.8 < T10.8 < Thresh2_T10.8
- T10.8 − T12.0 < Thresh_∆T10.8,12.0
- T10.8 − T8.7 > Thresh_∆T10.8,8.7
The thresholds have been determined from samples of dust-contaminated pixels carefully selected by examining a MSG-SEVIRI data set acquired during night and day time. In particular, during day time the MSG-SEVIRI pixels have been co-located with the correspondent Aerosol Robotic Network (AERONET) data and Moderate Resolution Imaging Spectroradiometer (MODIS) aerosol products (MOD04/MYD04); these ancillary data have been used to help the classification of dust-contaminated areas that are difficult to detect, especially the ones characterized by low aerosol optical depth values. MOD04/MYD04 (Collection 5.1) are daily products with spatial resolution of 10 km × 10 km containing MODIS aerosol products acquired from Terra/Aqua platforms, respectively. MODIS Deep Blue optical depths have been used in this comparison. The collocation procedure designates the product with the coarser resolution as the master (in this case MOD04/MYD04). The collocation assigns to each master pixel all the observations from the other products that fall within the spatial coverage of that master pixel. The thresholds have been determined by examining RGB composition of MSG-SEVIRI channels acquired at 8.7 µm, 10.8 µm, and 12.0 µm. In particular, Red = T12.0 − T10.8 (the range considered for this brightness temperature difference is from −4 K to +2 K, approximately), Green = T10.8 − T8.7 (approximately from 0 K to +15 K), and Blue = T10.8 (approximately from 261 K to +289 K). The RGB dust colour changes from blue/violet to red passing from high to low pressure levels during night time. During daytime, the RGB dust colour presents different gradations of pink by passing from high to low pressure levels. The same RGB composite of MSG channels has been analyzed by Banks and Brindley (2012). The dust-contaminated pixels are grouped for brightness temperature ranges, solar and satellite zenith angles as well as for land cover types, and a Look-Up Table (LUT) for thresholds has been build. The threshold values have been set as the mean values for each sample and for each test. The algorithm selects thresholds according to the satellite zenith angle, land cover, solar illumination and the image brightness temperature ranges. The MODIS land cover product (MOD12Q1) is used for the land-cover characterization of MSG-SEVIRI pixel. Firstly, the algorithm detects whether the pixel is dust-contaminated or not; when the pixel is dust-contaminated a further set of thresholds tests are applied. These tests consider the differences between the T10.8, T10.8 − T12.0, T10.8 – T8.7, R0.8, R0.6, R1.6 actual values and the respective thresholds, and based on them, the dust-contaminated pixel is classified as contaminated by:
- Thin dust (corresponding to AOD ≤ 0.4)
- Medium dense dust (0.4 < AOD < 0.6)
- Dense dust (0.6 ≤ AOD)
Table 1, Table 2 list the AERONET stations and MYD04/MOD04 products, respectively, used as support for the determination of the threshold values. Table 3 lists the MYD04/MOD04 products used for validating the dust detection. Table 4 reports the performance of the MSG dust-detection technique, obtained through the comparison against the MOD04/MYD04 products listed in Table 3. Figure 1 shows the RGB SEVIRI image and the dust-detection results for a case study. The RGB composition of the brightness temperature difference (T12.8 − T10.0, T10.8 − T8.7) and the brightness temperature at 10.8 µm is very useful to highlight dust contaminated pixels. Figure 1 (right) shows a large pink area of dust-contaminated pixels in the southern Mediterranean above Algeria; this area has been correctly detected by the technique as shown in Figure 1 (left) (yellow pixels). Small dust-contaminated areas are also visible in the south of Sardinia (Italy). Table 4 shows the percentage of pixels classified as (thin, medium, high) dust-contaminated by the MSG dust-detection technique in agreement with the values provided by the MYD04/MOD04 products. The performances are expressed in terms of the percentage of hits with respect to the total number of pixels. The standard deviation indicates the dispersion of the percentage hits over the batch of MODIS granules listed in Table 3. On the basis of the MODIS MYD04/MOD04 product comparison results shown in Table 4, it is possible to assert that MSG dust-detection technique performs better over sea than over land, with a percentage of (thin, medium, high) dust-contaminated pixels correctly detected equal to (80.3%, 81.4%, 83.5%) over sea and (50.7%, 74.0%, 79.2%) over land.

Table 1.
AERONET sites used in dust detection and retrieval validation.
| Barcellona (41.38N, 2.11E) | Messina (38.19N, 15.56E) | Archacon (44.66N, 1.16W) |
| Palencia (41.99N, 4.51W) | Modena (44.63N, 10.94E) | Autilla (41.99N, 4.60W) |
| Ispra (45.80N, 8.62E) | Munich_University (48.14N, 11.57E) | Caceres (39.48N, 6.34W) |
| IMAA_Potenza (40.60N, 15.72E) | Oukaimedena (31.21N, 7.88W) | - |
| Lecce_University (40.33N, 18.11E) | Tamanrasset_INM (22.79N, 5.53E) | - |
| Cabo_de_Roca (38.78N, 9.50W) | Venise (45.31N, 12.50E) | - |
| Rome_Tor_Vergata (41.84N, 12.64E) | Villefranche (43.68N, 7.33E) | - |
| Malaga (36.71N, 4.48W) | Evora (38.56N, 7.91W) | - |
Table 2.
List of MYD04/MOD04 data used for the determination of MSG dust-detection technique thresholds.
| MODIS Linear Lat/Lon | Dates (yyyy-dd-yy) and Times (hh:mm) in GMT | |
|---|---|---|
| Lat (28.154, 49.351) | Lon (−10.834, 20.755) | 2007-01-15 11:55 |
| Lat (4.368, 25.158) | Lon (−25.622, −0.644) | 2007-03-15 11:35 |
| Lat (29.868, 51.123) | Lon (1.798, 34.261) | 2007-03-15 13:15 |
| Lat (31.531, 52.845) | Lon (−5.718, 27.707) | 2007-05-15 11:05 |
| Lat (30.583, 51.813) | Lon (−0.943, 31.962) | 2007-07-15 12:15 |
| Lat (23.560, 44.582) | Lon (7.959, 37.535) | 2007-09-15 12:25 |
| Lat (27.459, 49.589) | Lon (−19.017, 12.252) | 2010-01-03 10:40 |
| Lat (27.558, 48.681) | Lon (13.455, 44.761) | 2010-01-04 10:40 |
| Lat (36.453, 57.922) | Lon (−10.170, 26.637) | 2010-01-11 09:50 |
| Lat (28.468, 49.619) | Lon (−7.263, 24.492) | 2011-01-01 10:20 |
Table 3.
List of MYD04/MOD04 data used for the validation of dust aerosol detection.
| MODIS Linear Lat/Lon | Dates (yyyy-dd-yy) and Times (hh:mm) in GMT | |
|---|---|---|
| Lat (34.557, 55.989) | Lon (−13.075, 22.312) | 2007-11-15 11:55 |
| Lat (32.405, 53.747) | Lon (0.562, 34.527) | 2007-11-15 13:35 |
| Lat (30.248, 51.508) | Lon (14.182, 46.879) | 2008-04-28 12:15 |
| Lat (26.356, 47.497) | Lon (−11.079, 19.652) | 2008-04-30 12:00 |
| Lat (33.597, 54.940) | Lon (−3.117, 31.613) | 2010-02-20 10:40 |
| Lat (37.418, 58.942) | Lon (−31.149, 6.459) | 2010-02-25 12:40 |
| Lat (35.792.57.326) | Lon (−9.695, 26.707) | 2010-03-08 12:25 |
| Lat (26.561, 47.667) | Lon (0.155, 31.016) | 2010-03-19 14:20 |
| Lat (18.685, 39.600) | Lon (24.336, 52.252) | 2010-04-05 11:00 |
| Lat (27.838, 48.974) | Lon (−9.931, 21.512) | 2010-04-05 11:10 |
| Lat (40.315, 61.999) | Lon (−15.589, 24.613) | 2010-04-05 12:40 |
| Lat (32.236, 53.523) | Lon (−37.623, −3.768) | 2011-09-01 10:50 |
| Lat (3.735, 24.455) | Lon (23.919, 48.813) | 2011-09-02 09:55 |
| Lat (38.739, 60.412) | Lon (4.584, 43.360) | 2011-09-03 09:00 |
| Lat (7.716, 28.472) | Lon (−2.116, 23.318) | 2011-09-03 10:40 |
Table 4.
Performance of the MSG dust aerosol detection technique, obtained by comparisons with the MOD04/MYD04 product results listed in Table 3. Hits are considered when pixels detected as thin/medium/dense-contaminated by the MSG/SEVIRI dust detection tests are confirmed by the MOD04/MYD04 products. The performances are expressed in terms of the percentage of hits with respect to the total number of pixels. The standard deviation indicates the dispersion of the percentage hits over the batch of MODIS granules in Table 3.
| Over Land (%) | Over Sea (%) | |
|---|---|---|
| Thin-dust contaminated hits | 50.7 | 80.3 |
| Standard deviation | 16.0 | 3.7 |
| Medium dense-dust contaminated hits | 74.0 | 81.4 |
| Standard deviation | 7.5 | 3.0 |
| Dense-dust contaminated hits | 79.2 | 83.5 |
| Standard deviation | 7.2 | 3.0 |
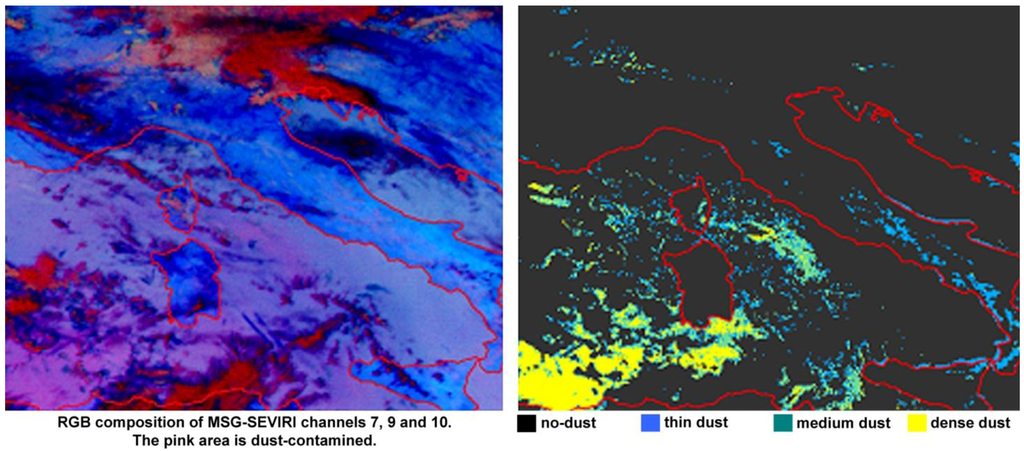
Figure 1.
RGB and dust detection technique for image at 2011-09-01 10:45 GMT. Left: 10.8 µm, 8.7 µm and 12.0 µm RGB composition. Right: results of the dust detection technique (black means no dust, blue thin, green medium dense, and yellow dense dust).
2.3. Albedo and Emissivity Values
The simulation of visible SEVIRI channels has been carried out by using MODIS albedo values. The MODIS Bidirectional Reflectance Directional Function (BRDF) and Albedo product provides an intrinsic characterization of surface anisotropy used for the determination of global land surface albedos. The MODIS product relies on multi-date, clear-sky and atmospherically corrected surface reflectances coupled with a BRDF model both to understand the surface anisotropy and provide albedo measurements. In particular, the MOD43B1 BRDF/Albedo Model Parameter Product (MODIS/Terra BRDF/Albedo Model_1 16-Day L3 Global 1km SIN Grid) provides the weighting parameters associated with the Ross-Thick-Li Sparse Reciprocal BRDF model which best describes the anisotropy of each pixel. These three albedo model parameters (fiso, fvol and fgeo), provided for each MODIS spectral channel as well as for the three broadbands (0.3–0.7 µm, 0.7–5.0 µm, and 0.3–5.0 µm), can be used with a polynomial to estimate the black-sky albedo for any solar zenith angle with good accuracy [34]. The MODIS albedo has been spectrally interpolated to match the spectral location of SEVIRI channels following the approach described hereafter. First of all, a set of reference reflectance spectra in the 0.2–3.0 µm range for different surfaces was obtained from the United States Geological Survey (USGS) Digital Spectral Library [35] and the Johns Hopkins University (JHU) spectral library. For each MODIS albedo, a subset of the reference spectra was selected, choosing only the spectra consistent with MODIS values at MODIS bands [36]. Then, the range of variation of these reference spectra at the wavelengths of SEVIRI channels has been used to set the boundaries for searching the most appropriate values for SEVIRI albedo; these values were obtained as the result of minimizing the difference between simulated and observed SEVIRI radiances for a set of clear-sky cases.
The global database of infrared land surface emissivity, based on MODIS operational land surface emissivity product (MOD11A) [37], has been used to simulate IR channels. The MODIS/Terra LST/E Daily L3 Global 1 km Grid product (MOD11A1) is tile-based, gridded in the Sinusoidal projection at 1 km spatial resolution. The MODIS product is derived from a physics-based day/night land-surface temperature and emissivity algorithm used for the simultaneous retrieval of surface emissivity and temperature from a pair of day- and night-time MODIS observations at 20, 22, 23, 29, and 31–33 channels over all types of land cover. The high-spatial and moderate-spectral resolution global database of infrared land surface emissivity has been developed through a procedure based on a fit method to fill in the spectral gaps between the six emissivity wavelengths available in MOD11 [38].
2.4. Optical Depth Estimation
The developed dust aerosol retrieval algorithm is based on the visible and near-infrared channels. When a pixel is detected as dust-contaminated, the dust aerosol optical depth is retrieved in an iterative way by simultaneously comparing the satellite radiance observed at visible, near-infrared and infrared wavelengths with the look-up table of simulated brightness temperatures and radiances affected by dust aerosol. The skin surface temperature (ST) and the total water vapour (WV) column have been retrieved using the split window techniques [24]. The retrieval method searches in the look-up table the simulated data that correspond to the retrieved albedo/emissivity, ST and WV, and starts from a first-guess dust aerosol profiles. The brightness temperatures and the radiances at SEVIRI channels within the look-up tables are compared with the measured values. This comparison is judged to be satisfactory if the root mean squared (RMS) difference between the brightness temperatures and the radiances observed and computed in all the channels is lower than a threshold (0.1 K); this threshold was determined as the RMS difference between simulations and measurements in clear sky conditions. If this condition is not satisfied, the procedure iterates taking in consideration a different dust aerosol profile until a suitable solution is reached. The categorization of the aerosol loading (Section 2.1 reduces the iterations and thus reaches the solution more rapidly. The procedure is stopped and yields no retrieved values whenever any retrieved parameter assumes a value that falls outside the range covered by the look-up table. Linear interpolation is used to fill the gaps in a look-up table.
3. Results
The algorithm results have been compared with MODIS products (MOD04_L2/MYD04_L2), taking into consideration both Aqua and Terra platforms acquired within ±30 min and with Aerosol Robotic Network (AERONET), and the comparison is proved to be satisfactory. Table 3 reports the MODIS granules used in the comparison. Table 1 reports the station used in the validation. The MODIS/SEVIRI pixels closest (within 10 km) to the AERONET station sites have been considered. We use AERONET values of the Angstrom coefficients (440 nm/870 nm) and the AOD at 440 nm to estimate AODs at 550 nm [39]. The comparison confirms that the dust aerosol optical depth can be obtained with good accuracy when using SEVIRI data. The values estimated by using SEVIRI data show a better scatter plot (Figure 2) than the MODIS product, though we need to consider that the SEVIRI acquisitions are often spatially/temporally closer to the AERONET sites. The root mean square error and correlation coefficient resulting from the comparison with the AERONET acquisition are, respectively, 0.08 and 0.77 for the algorithm proposed here and 0.18 and 0.36 for the MODIS products. It should be mentioned that the AODs shown here are relatively low, with respect to typical dust AODs which can be greater than 1, and therefore these results strictly apply to light dust loading cases, which indeed are the most difficult to detect from satellite platforms.
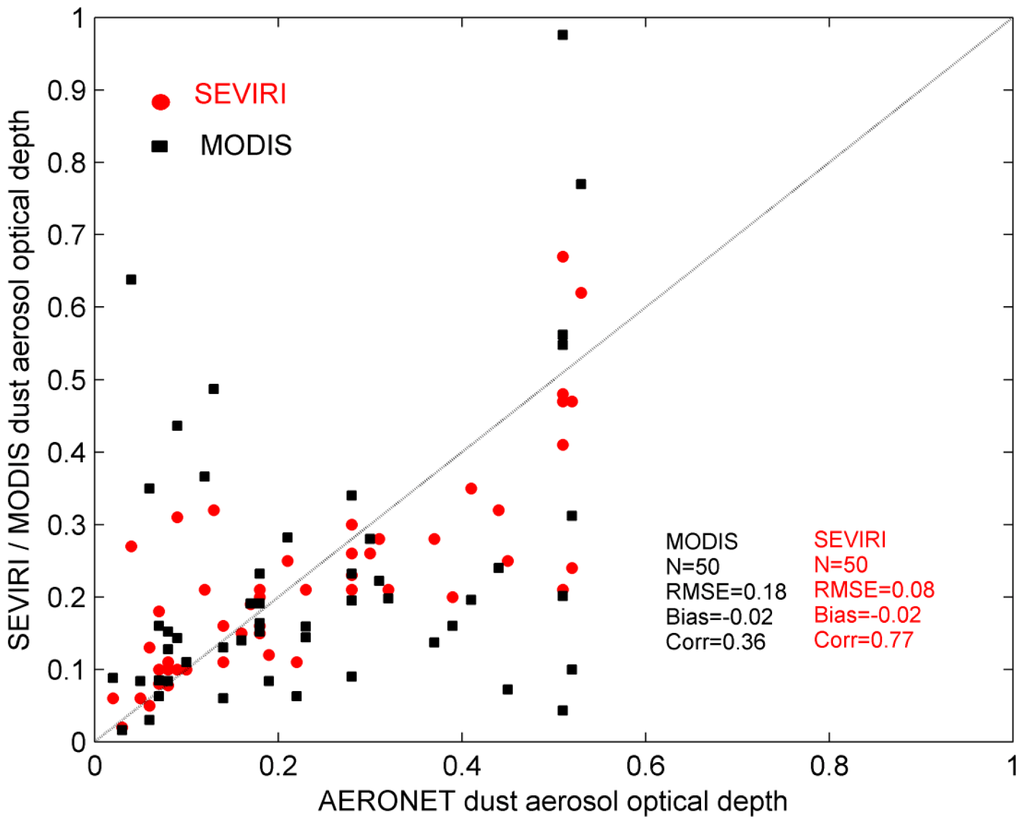
Figure 2.
The dust aerosol optical depth on land retrieved using MSG/SEVIRI data and the MODIS (MYD04/MOD04) products compared to AERONET data. Statistics of the comparison are listed in the figure. In particular we report the number of the pixels considered (N), the root mean square error (RMSE), the bias and the correlation coefficient.
4. Conclusions
This paper discusses a technique based on MSG/SEVIRI data for dust aerosol detection and retrieval, showing the capability of a geostationary satellite to monitor dust events. With respect to previous studies, the proposed algorithm is based on a more accurate FOV discrimination (clear, cloudy, affected by aerosol/dust) and an accurate land-cover, which is crucial in order to retrieve the optical dust aerosol depth over land. With this accurate land cover, the algorithm permits to retrieve dust in very difficult cases, such as when it is hard to discriminate dust signal from the surface reflectance. Of course, uncertainties in dust/aerosol optical and physical properties still represent a limitation of the dataset and aerosol retrievals. The algorithm starts with the classification of the pixels as clear, cloudy, partially cloudy or affected by dust aerosol presence. For the pixels affected by dust aerosol presence, the algorithm retrieves the optical depth in an iterative way by simultaneously comparing the satellite radiance observed at visible, near-infrared, and infrared wavelengths with the look-up table of simulated radiances affected by dust aerosol. The identification, evolution and retrieval of dust are well shown by SEVIRI data with high spatial resolution (3 km) and high temporal resolution (15 min). Comparisons against the satellite-based MODIS product and the ground-based measurements available at AERONET sites show a good agreement with the values retrieved by using the proposed algorithm. Quantitatively, the results show a good correlation of about 0.77, a root mean square and a mean difference within respectively 0.08 and −0.02.
Acknowledgments
The MODIS atmospheric products have been provided by the MODIS L1 and Atmospheres Archive and Distribution System (LAADS). The MODIS land products have been provided by the Land Process Distributed Active Center (LP DAAC). The AERONET data have been provided by the AErosol RObotic NETwork archive (NASA Goddard AERONET site).
References
- Sokolik, I.; Toon, O.; Bergstrom, R. Modeling the radiative characteristics of airborne mineral aerosols at infrared wavelengths. J. Geophys. Res. 1998, 103, 8813–8826. [Google Scholar] [CrossRef]
- Mahowald, N.; Zender, C.; Luo, C.; Savoie, D.; Torres, O.; del Corral, J. Understanding the 30-year Barbados desert dust record. J. Geophys. Res. 2002, 107, 4561. [Google Scholar] [CrossRef]
- McConnell, C.L.; Highwood, E.J.; Coe, H.; Formenti, P.; Anderson, B.; Osborne, S.; Nava, S.; Desboeufs, K.; Chen, G.; Harrison, M.A.J. Seasonal variations of the physical and optical characteristics of Saharan dust: Results from the Dust Outflow and Deposition to the Ocean (DODO) experiment. J. Geophys Res. 2008, 113, D14S05. [Google Scholar] [CrossRef]
- Weinzierl, B.; Petzold, A.; Esselborn, M.; Wirth, M.; Rasp, K.; Kandler, K.; Schutz, L.; Koepke, P.; Fiebig, M. Airborne measurements of dust layer properties, particle size distribution and mixing state of Saharan dust during SAMUM 2006. Tellus B 2009, 61, 96–117. [Google Scholar] [CrossRef]
- Weinzierl, B.; Sauer, D.; Esselborn, M.; Petzold, A.; Veira, A.; Rose, M.; Mund, S.; Wirth, M.; Ansmann, A.; Tesche, M.; et al. Microphysical and optical properties of dust and tropical biomass burning aerosol layers in the Cape Verde region—An overview of the airborne in situ and lidar measurements during SAMUM-2. Tellus B 2011, 63, 589–618. [Google Scholar] [CrossRef]
- Papayannis, A.; Amiridis, V.; Mona, L.; Tsaknakis, G.; Balis, D.; Bösenberg, J.; Chaikovski, A.; de Tomasi, F.; Grigorov, I.; Mattis, I.; et al. Systematic lidar observations of Saharan dust over Europe in the frame of EARLINET (2000-2002). J. Geophys. Res. 2007, 113, D10204. [Google Scholar] [CrossRef]
- Andreae, M.O.; Rosenfeld, D. Aerosol-cloud-precipitation interactions. Part 1. The nature and sources of cloud-active aerosols. Earth Sci. Reviron. 2008, 89, 13–41. [Google Scholar] [CrossRef]
- Rosenfeld, D.; Rudich, Y.; Lahav, R. Desert dust suppressing precipitation: A possible desertification feedback loop. Proc. Natl. Acad. Sci. USA 2001 98, 5975–5980.
- Albrecht, B.A. Aerosols, cloud microphysics, and fractional cloudiness. Science 1989, 245, 1227–1229. [Google Scholar]
- Matsuki, A.; Schwarzenboeck, A.; Venzac, H.; Laj, P.; Crumeyrolle, S.; Gomes, L. Cloud processing of mineral dust: Direct comparison of cloud residual and clear sky particles during AMMA aircraft campaign in summer. Atmos. Chem. Phys. 2006, 10, 1057–1069. [Google Scholar]
- Carboni, E. GOME aerosol optical depth retrieval over ocean: Correcting for the effect of residual clouds contamination. Atmos. Environ. 2006, 40, 6975–6987. [Google Scholar] [CrossRef]
- Santer, R.; Carrere, V.; Dubuisson, P.; Roger, J.C. Atmospheric corrections over land for MERIS. Int. J. Remote Sens. 1999, 20, 1819–1840. [Google Scholar] [CrossRef]
- Levy, R.C.; Remer, L.A.; Mattoo, S.; Vermote, E.F.; Kaufman, Y.J. Second-generation operational algorithm: Retrieval of aerosol properties over land from inversion of Moderate Resolution Imaging Spectroradiometer spectral reflectance. J. Geophys. Res. 2007, 112, D13211. [Google Scholar] [CrossRef]
- Grey, W.M.F.; North, P.R.J.; Los, S.O.; Mitchell, R.M. Aerosol optical depth and land surface reflectance from multi-angle AATSR measurements: Global validation and inter-sensor comparisons. IEEE Trans. Geosci. Remote Sens. 2006, 44, 2184–2197. [Google Scholar] [CrossRef]
- Veihelmann, B.; Levelt, P.F.; Stammes, P.; Veefkind, J.P. Simulation study of the aerosol information content in OMI spectral reflectance measurements. Atmos. Chem. Phys. 2007, 7, 3115–3127. [Google Scholar] [CrossRef]
- Deuzé, J.L.; Breon, F.M.; Devaux, C.; Goloub, P.; Herman, M.; Lafrance, B.; Maignan, F.; Marchand, A.; Nadal, F.; Perry, G.; Tanre, D. Remote sensing of aerosols over land surfaces from POLDER-ADEOS-1 polarized measurements. J. Geophys. Res. 2001, 106, 4913–4926. [Google Scholar] [CrossRef]
- Banks, J.R.; Brindley, H.E. Evaluation of MSG-SEVIRI mineral dust retrieval products over Africa and the Middle East. Remote Sens. Environ. 2012, 128, 58–73. [Google Scholar] [CrossRef]
- Popp, C.; Hauser, A.; Foppa, N.; Wunderle, S. Remote sensing of aerosol optical depth over central Europe from MSG-SEVIRI data and accuracy assessment with ground-based AERONET measurements. J. Geophys. Res. 2007, 112. [Google Scholar] [CrossRef]
- Govaerts, Y.M.; Wagner, S.; Lattanzio, A.; Watts, P. Joint retrieval of surface reflectance and aerosol optical depth from MSG/SEVIRI observations with an optimal estimation approach: 1. Theory. J. Geophys. Res. 2010, 115. [Google Scholar] [CrossRef]
- Mei, L.; Xue, Y.; de Leeuw, G.; Holzer-Popp, T.; Guang, J.; Li, Y.; Yang, L.; Xu, H.; Xu, X.; Li, C.; et al. Retrieval of aerosol optical depth over land based on a time series technique using MSG/SERIVI data. Atmos. Chem. Phys. Discuss. 2012, 12, 4031–4071. [Google Scholar] [CrossRef]
- Hsu, N.C.; Tsay, S.C.; King, M.D.; Herman, J.R. Aerosol properties over bright reflecting source regions. IEEE Trans. Geosci. Remote Sens. 2004, 42, 557–569. [Google Scholar] [CrossRef]
- Pierangelo, C.; Chedin, A.; Heilliette, S.; Jacquinet-Husson, N.; Armante, R. Dust altitude and infrared optical depth from AIRS. Atmos. Chem. Phys. 2004, 4, 1813–1822. [Google Scholar] [CrossRef]
- DeSouza-Machado, S.G.; Strow, L.L.; Hannon, S.E.; Motteler, H.E. Infrared dust spectral signatures from AIRS. Geophys. Res. Lett. 2006, 33. [Google Scholar] [CrossRef]
- Geraldi, E.; Romano, F.; Ricciardelli, E. An advanced model for the estimation of the surface solar irradiance under all atmospheric conditions using MSG/SEVIRI data. IEEE Trans. Geosci. Remote Sens. 2012, 50, 2934–2953. [Google Scholar] [CrossRef]
- Ricciardelli, E.; Romano, F.; Cuomo, V. Physical and statistical approaches for cloud identification using Meteosat Second Generation-Spinning Enhanced Visible and Infrared Imager Data. Remote Sens. Environ. 2008, 112, 2741–2760. [Google Scholar] [CrossRef]
- Hess, M.; Koepke, P.; Schult, I. Optical Properties of Aerosols and Clouds: The software package OPAC. Bull. Am. Meteorol. Soc. 1998, 79, 831–844. [Google Scholar] [CrossRef]
- Koepke, P.; Hess, M.; Schult, I. Global Aerosol Data Set; Report No. 243; Max-Planck-Institut für Meteorologie: Hamburg, Germany, 1997. [Google Scholar]
- D’Almeida, G.A.; Koepke, P.; Shettle, E.P. Atmospheric Aerosols: Global Climatology and Radiative Characteristics; A. Deepak Publishing: Hampton, VA, USA, 1991. [Google Scholar]
- Ricchiazzi, P.; Yang, S.; Gautier, C.; Sowle, D. SBDART: A research and teaching software tool for plane parallel radiative transfer in the Earth’s atmosphere. Bull. Am. Meteorol. Soc. 1998, 79, 2101–2114. [Google Scholar] [CrossRef]
- Ackerman, S.A. Remote sensing aerosols using satellite infrared observations. J. Geophys. Res. 1997, 102, 17069–17079. [Google Scholar] [CrossRef]
- Bennouna, Y.S.; de Leeuw, G. Aerosol Retrieval over Land and Sea Surfaces Using Combined Satellite Measurements from MSG-SEVIRI and ENVISAT-AATSR. In Proceeding ofEnvisat Symposium 2007, Montreux, Switzerland, 23–27 April 2007.
- Legrand, M.; Nertrand, J.J.; Desbois, M.; Menenger, L.; Fouquard, Y. The potential of infrared satellite data for the retrieval of Saharan dust optical depth over Africa. J. Clim. Appl. Meteorol. 1989, 28, 309–318. [Google Scholar] [CrossRef]
- Li, J.; Zhang, P.; Schmit, T.J.; Schmetz, J.; Menzel, W.P. Quantitative monitoring of a Saharan dust event with SEVIRI on Meteosat-8. Int. J. Remote Sens. 2008, 28, 2181–2186. [Google Scholar]
- Strahler, A.H.; Muller, J.P. MODIS Science Team Members,MODIS BRDF/Albedo Product: Algorithm Theorical Basis Documents Ver. 5.0. Available online: http://modis-sr.ltdri.org/publications/MODIS_BRDF.pdf (accessed on 31 October 2012).
- Clark, R.N.; Swayze, G.A.; Wise, R.; Livo, E.; Hoefen, T.; Kokaly, R.; Sutley, S.J. USGS Digital Spectral Library splib06a; Digital Data Series 231; US Geological Survey, 2007. Available online: http://speclab.cr.usgs.gov/spectral.lib06 (accessed on 31 October 2012).
- Zhu, L.; Martins, J.V.; Yu, H. Effect of spectrally varying albedo of vegetation surfaces on shortwave radiation fluxes and aerosol direct radiative forcing. Atmos. Meas. Tech. 2012, 5, 3055–3067. [Google Scholar] [CrossRef]
- Wan, Z. MODIS Land Surface Temperature Products Users’ Guide. 2009. Available online: http://www.icess.ucsb.edu/modis/LstUsrGuide/usrguide.html (accessed on 31 October 2012).
- Seemann, S.W.; Borbas, E.E.; Knuteson, R.O.; Stephenson, G.R.; Huang, H.-L. Development of a global infrared land surface emissivity database for application to clear sky sounding retrievals from multispectral satellite radiance measurements. J. Appl. Meteor. Climatol. 2008, 47, 108–123. [Google Scholar] [CrossRef]
- Santese, M.; Perrone, M.R.; Zakey, A.S.; de Tomasi, F.; Giorgi, F. Modeling of Saharan dust outbreaks over the Mediterranean by RegCM3: Case studies. Atmos. Chem. Phys. 2010, 10, 133–156. [Google Scholar] [CrossRef]
© 2013 by the authors; licensee MDPI, Basel, Switzerland. This article is an open-access article distributed under the terms and conditions of the Creative Commons Attribution license (http://creativecommons.org/licenses/by/3.0/).