A Survey of Mercury in Air and Precipitation across Canada: Patterns and Trends

Abstract
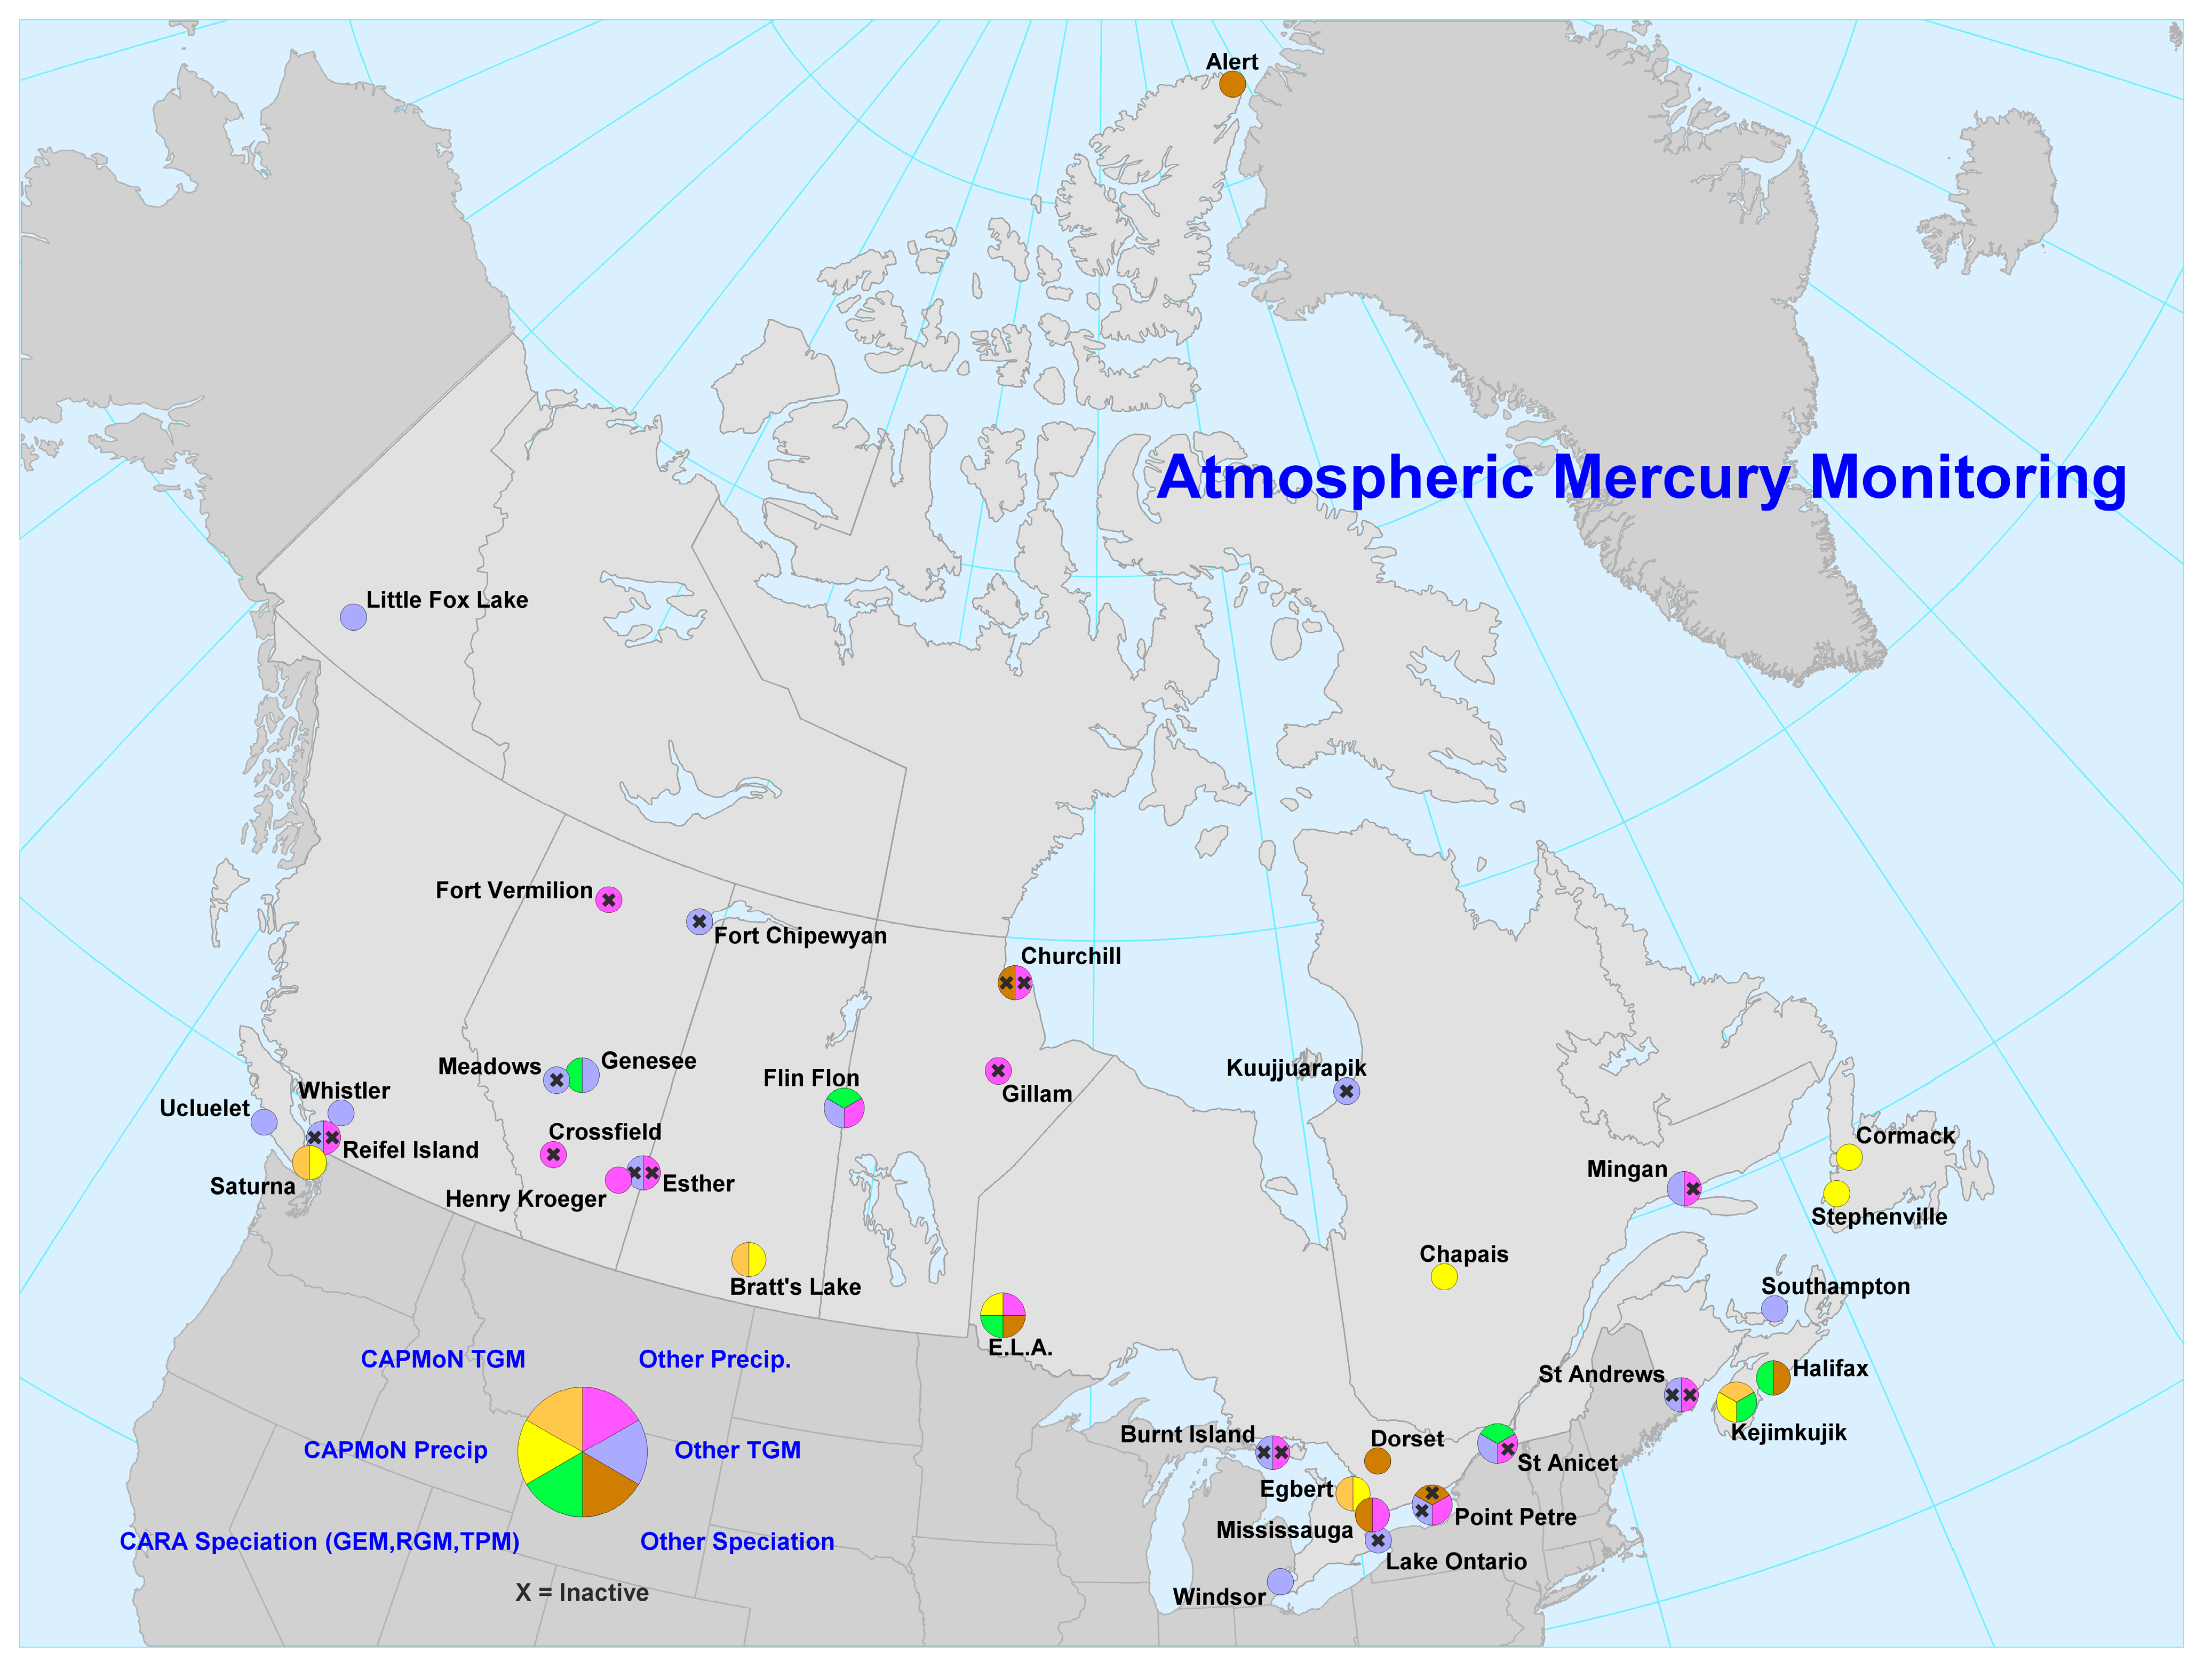
:1. Introduction

| Station | Network | Longitude (ºW) | Latitude (ºN) | Measurement Period for Data Included Here | Mean TGM ± SD (ng∙m−3) |
|---|---|---|---|---|---|
| Little Fox Lake YK | NCP a | 135.63 | 61.35 | June 2007–November 2011 | 1.28 ± 0.17 |
| Reifel Island BC | CAMNet | 123.17 | 49.10 | March 1999–Febuary 2004 | 1.67 ± 0.19 |
| Saturna BC | CAPMoN | 123.13 | 48.78 | March 2009–December 2010 | 1.43 ± 0.20 |
| Whistler BC | INCATPA b/CARA c | 122.93 | 50.07 | August 2008–November 2011 | 1.21 ± 0.20 |
| Meadows AB | None | 114.64 | 53.53 | May 2005–December 2008 | 1.51 ± 0.21 |
| Genesee AB | None | 114.20 | 53.30 | March 2004–December 2010 | 1.53 ± 0.25 |
| Fort Chipewyan AB | CAMNet | 111.12 | 58.78 | June 2000–July 2001 | 1.36 ± 0.15 |
| Esther AB | CAMNet | 110.20 | 51.67 | June 1998–April 2001 | 1.65 ± 0.15 |
| Bratt's Lake SK | CAPMoN | 104.71 | 50.20 | May 2001–December 2010 | 1.44 ± 0.25 |
| Flin Flon MB | CARA c | 101.88 | 54.77 | July 2008–June 2011 | 3.75 ± 2.22 |
| Windsor ON | None | 83.01 | 42.18 | January 2007–December 2008 | 1.93 ± 0.80 |
| Burnt Island ON | CAMNet | 82.95 | 45.81 | May 1998–December 2007 | 1.55 ± 0.22 |
| Egbert ON | CAMNet | 79.78 | 44.23 | December 1996–December 2010 | 1.58 ± 0.29 |
| Buoy ON | CAMNet | 79.45 | 43.40 | July–September 2005 | 1.71 ± 0.20 |
| Kuujjuarapik PQ | CAMNet | 77.73 | 55.30 | August 1999–September 2009 | 1.68 ± 0.46 |
| Point Petre ON | CAMNet | 77.15 | 43.84 | November 1996–December 2007 | 1.75 ± 0.33 |
| St. Anicet PQ | CAMNet | 74.28 | 45.12 | August 1994–December 2009 | 1.60 ± 0.37 |
| St. Andrews NB | CAMNet | 67.08 | 45.09 | January 1996–July 2007 | 1.38 ± 0.24 |
| Kejimkujik NS | CAMNet | 65.21 | 44.43 | January 1996–December 2010 | 1.40 ± 0.31 |
| Mingan PQ | CAMNet | 64.17 | 50.27 | January 1997–December 2000 | 1.57 ± 0.19 |
| Southampton PE | CAMNet | 62.58 | 46.39 | January 2005–December 2006 | 1.23 ± 0.19 |
| Alert NU | CAMNet | 62.33 | 82.50 | January 1995–December 2011 | 1.51 ± 0.37 |
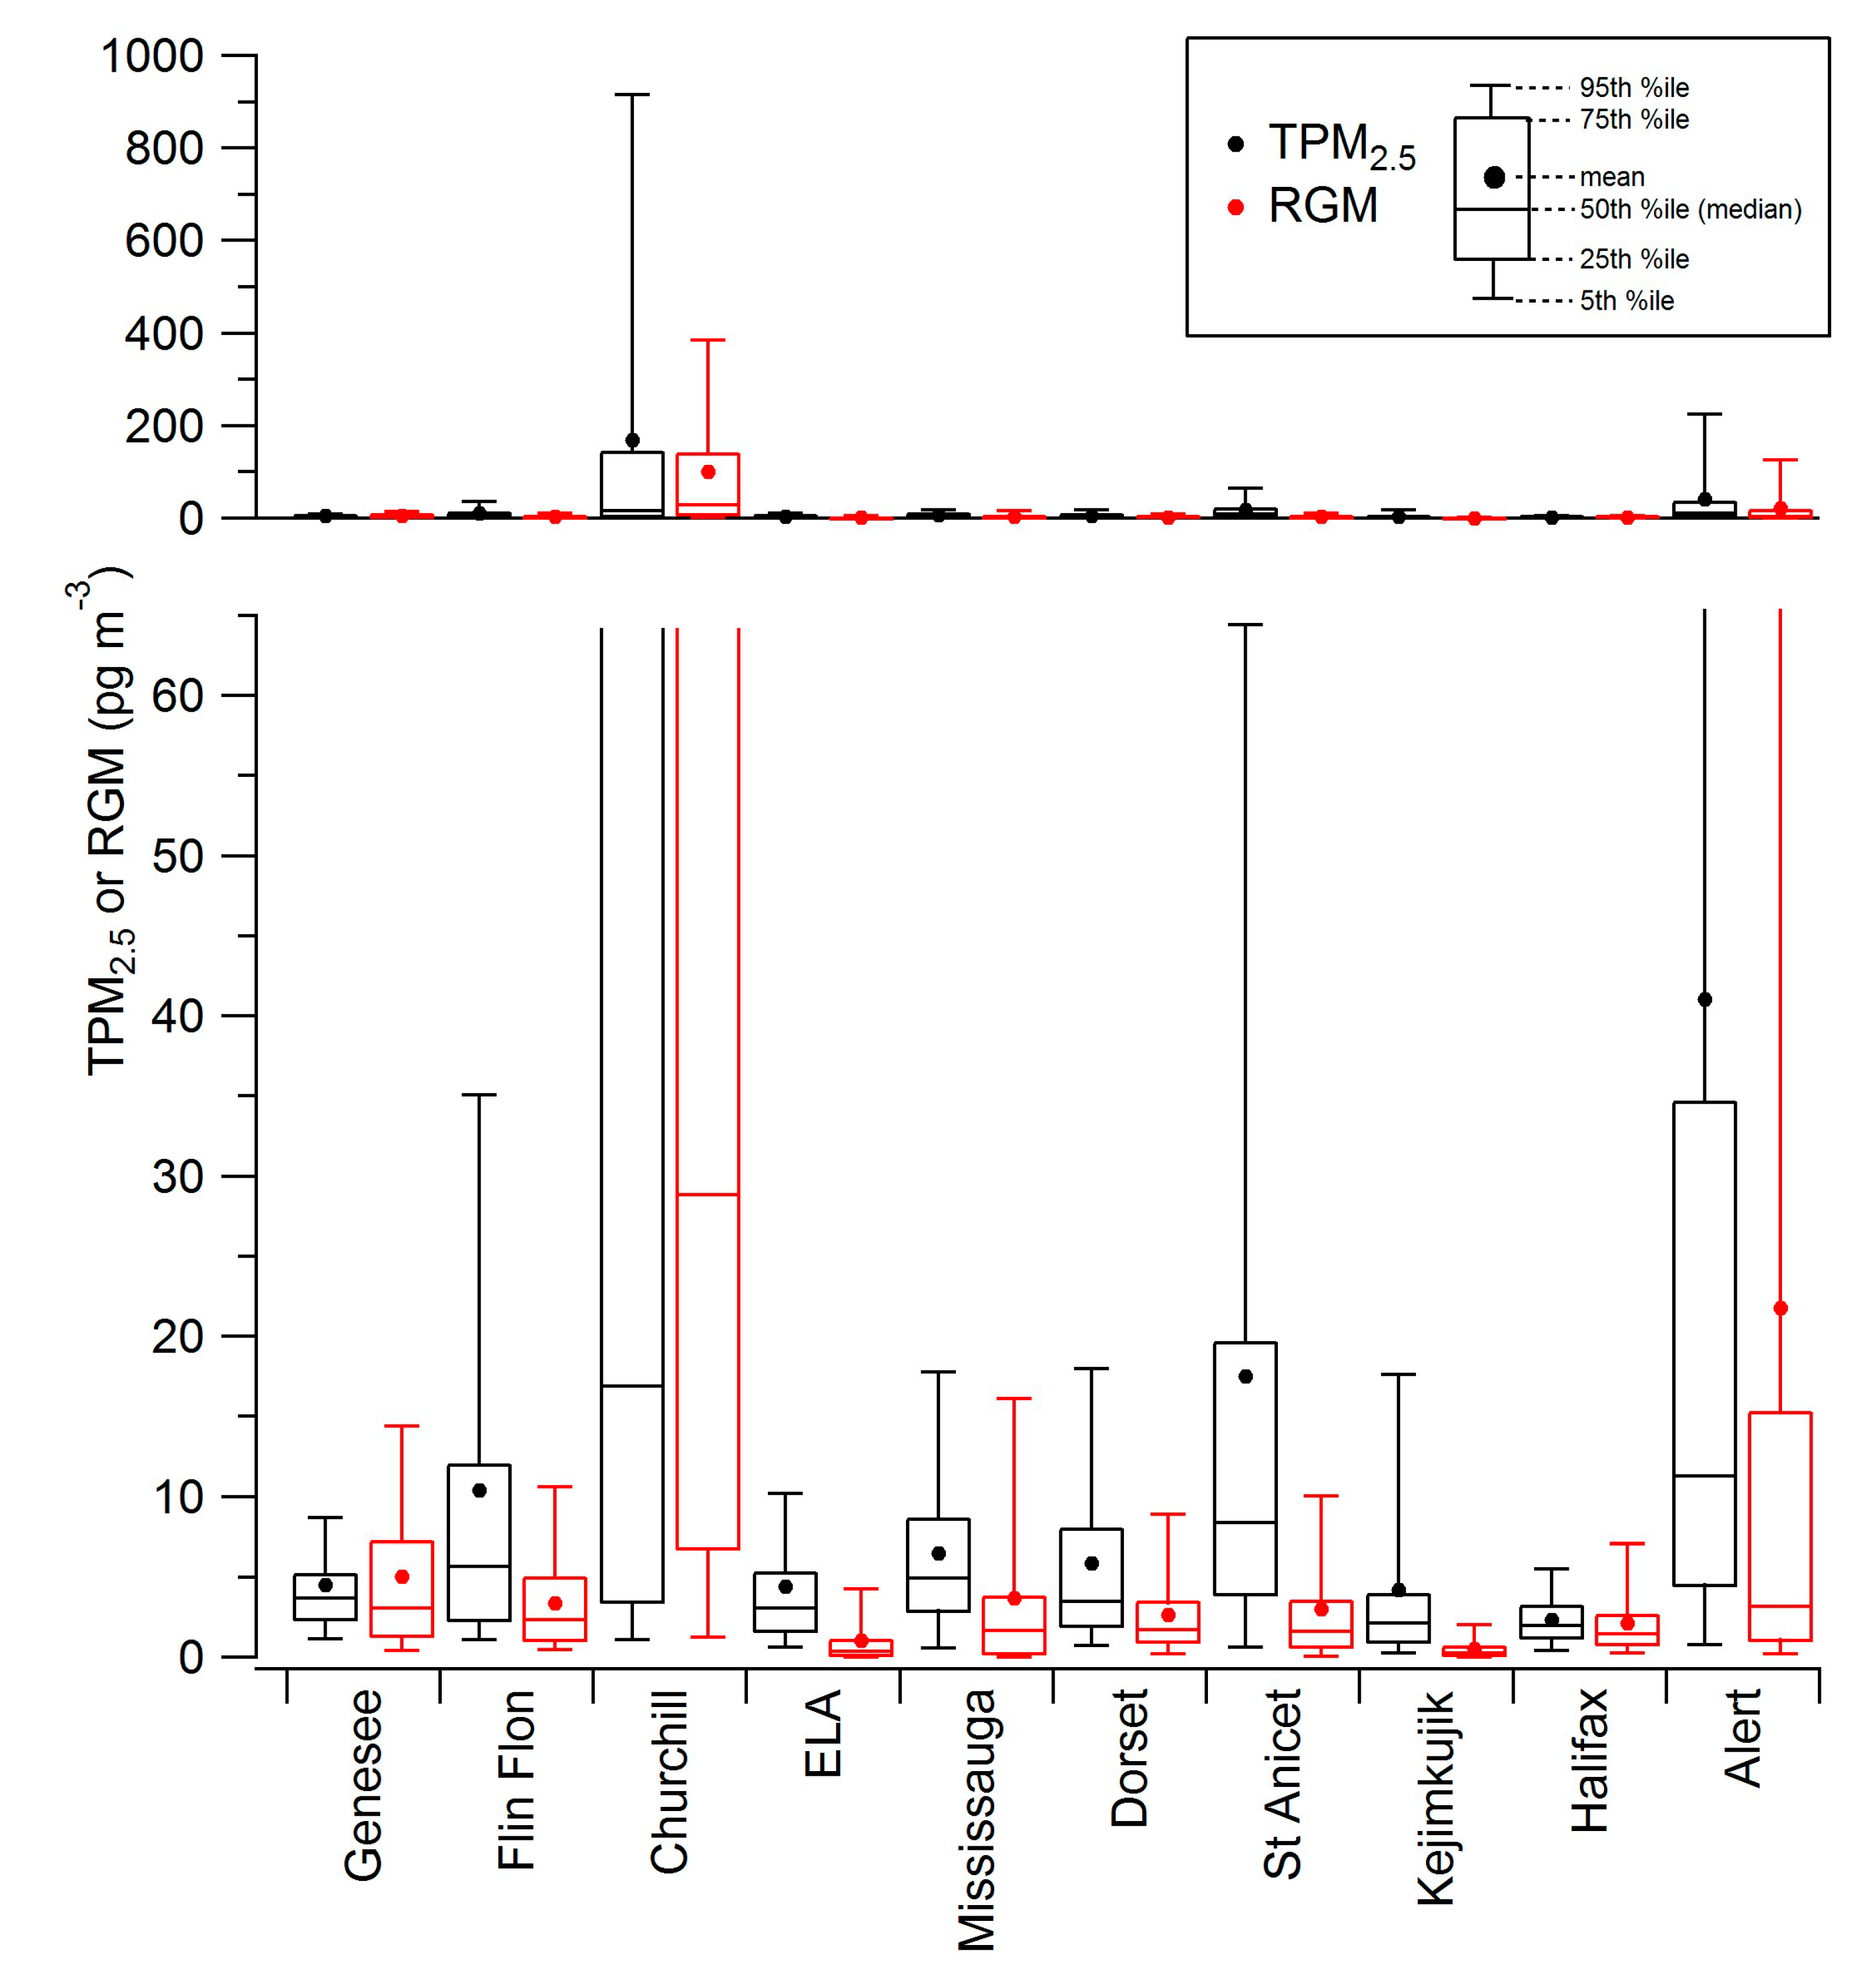
| Station | Longitude (ºW) | Latitude (ºN) | Measurement Period for Data Included Here | Mean GEM (ng∙m−3) | Mean RGM (pg∙m−3) | Mean TPM2.5 (pg∙m−3) |
|---|---|---|---|---|---|---|
| Genesee AB | 114.20 | 53.30 | January–September 2009 | 1.40 | 5.0 | 4.5 |
| Flin Flon MB | 101.88 | 54.77 | July 2010–May 2011 | 2.06 | 3.4 | 10.4 |
| Churchill MB | 94.07 | 58.75 | March–August 2004 | 1.52 | 100.9 | 168.5 |
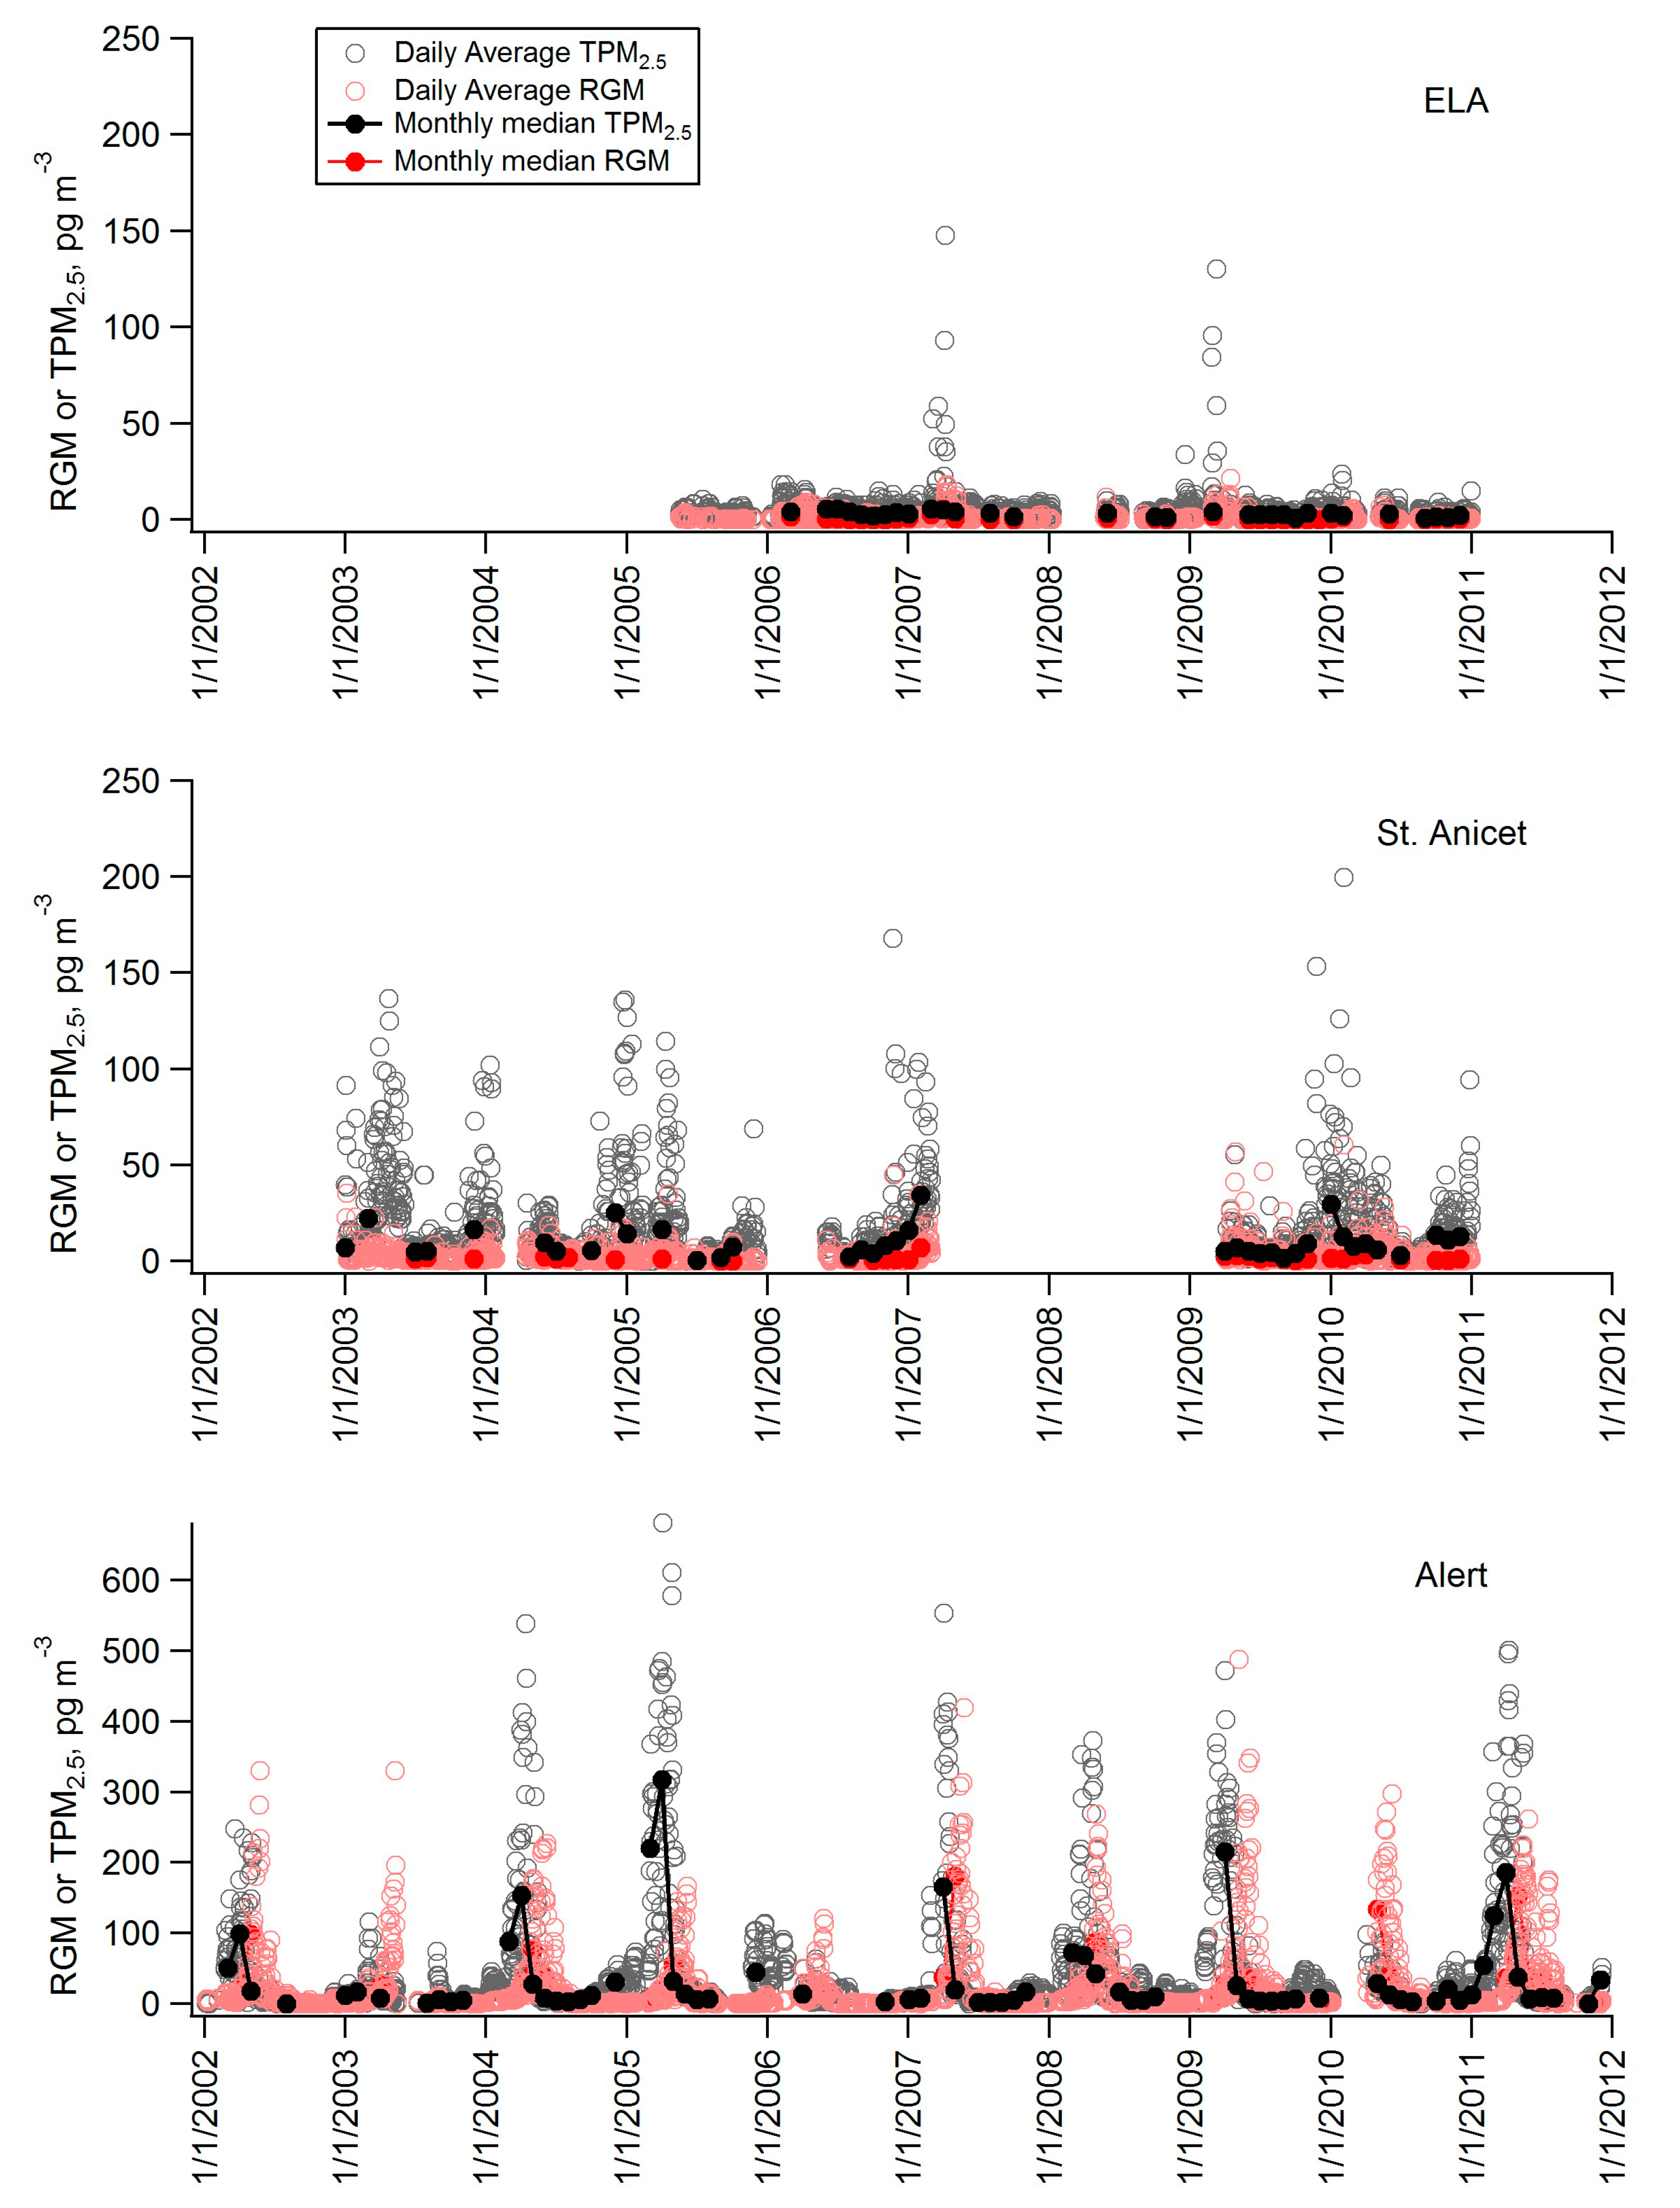
| ELA ON | 93.72 | 49.66 | May 2005–December 2010 | 1.39 | 1.0 | 4.4 |
| Mississauga ON | 79.65 | 43.54 | January–December 2009 | 1.40 | 3.7 | 6.5 |
| Dorset ON | 78.93 | 45.22 | July 2008–March 2010 | 1.38 | 2.7 | 5.9 |
| St Anicet PQ | 74.28 | 45.12 | January 2003–December 2010 | 1.52 | 3.0 | 17.5 |
| Kejimkujik NS | 65.21 | 44.43 | January 2009–December 2010 | 1.34 | 0.5 | 4.2 |
| Halifax NS | 63.67 | 44.67 | October 2009–December 2010 | 1.68 | 2.1 | 2.3 |
| Alert NU | 62.33 | 82.50 | January 2002–December 2011 | 1.26 | 21.8 | 41.1 |
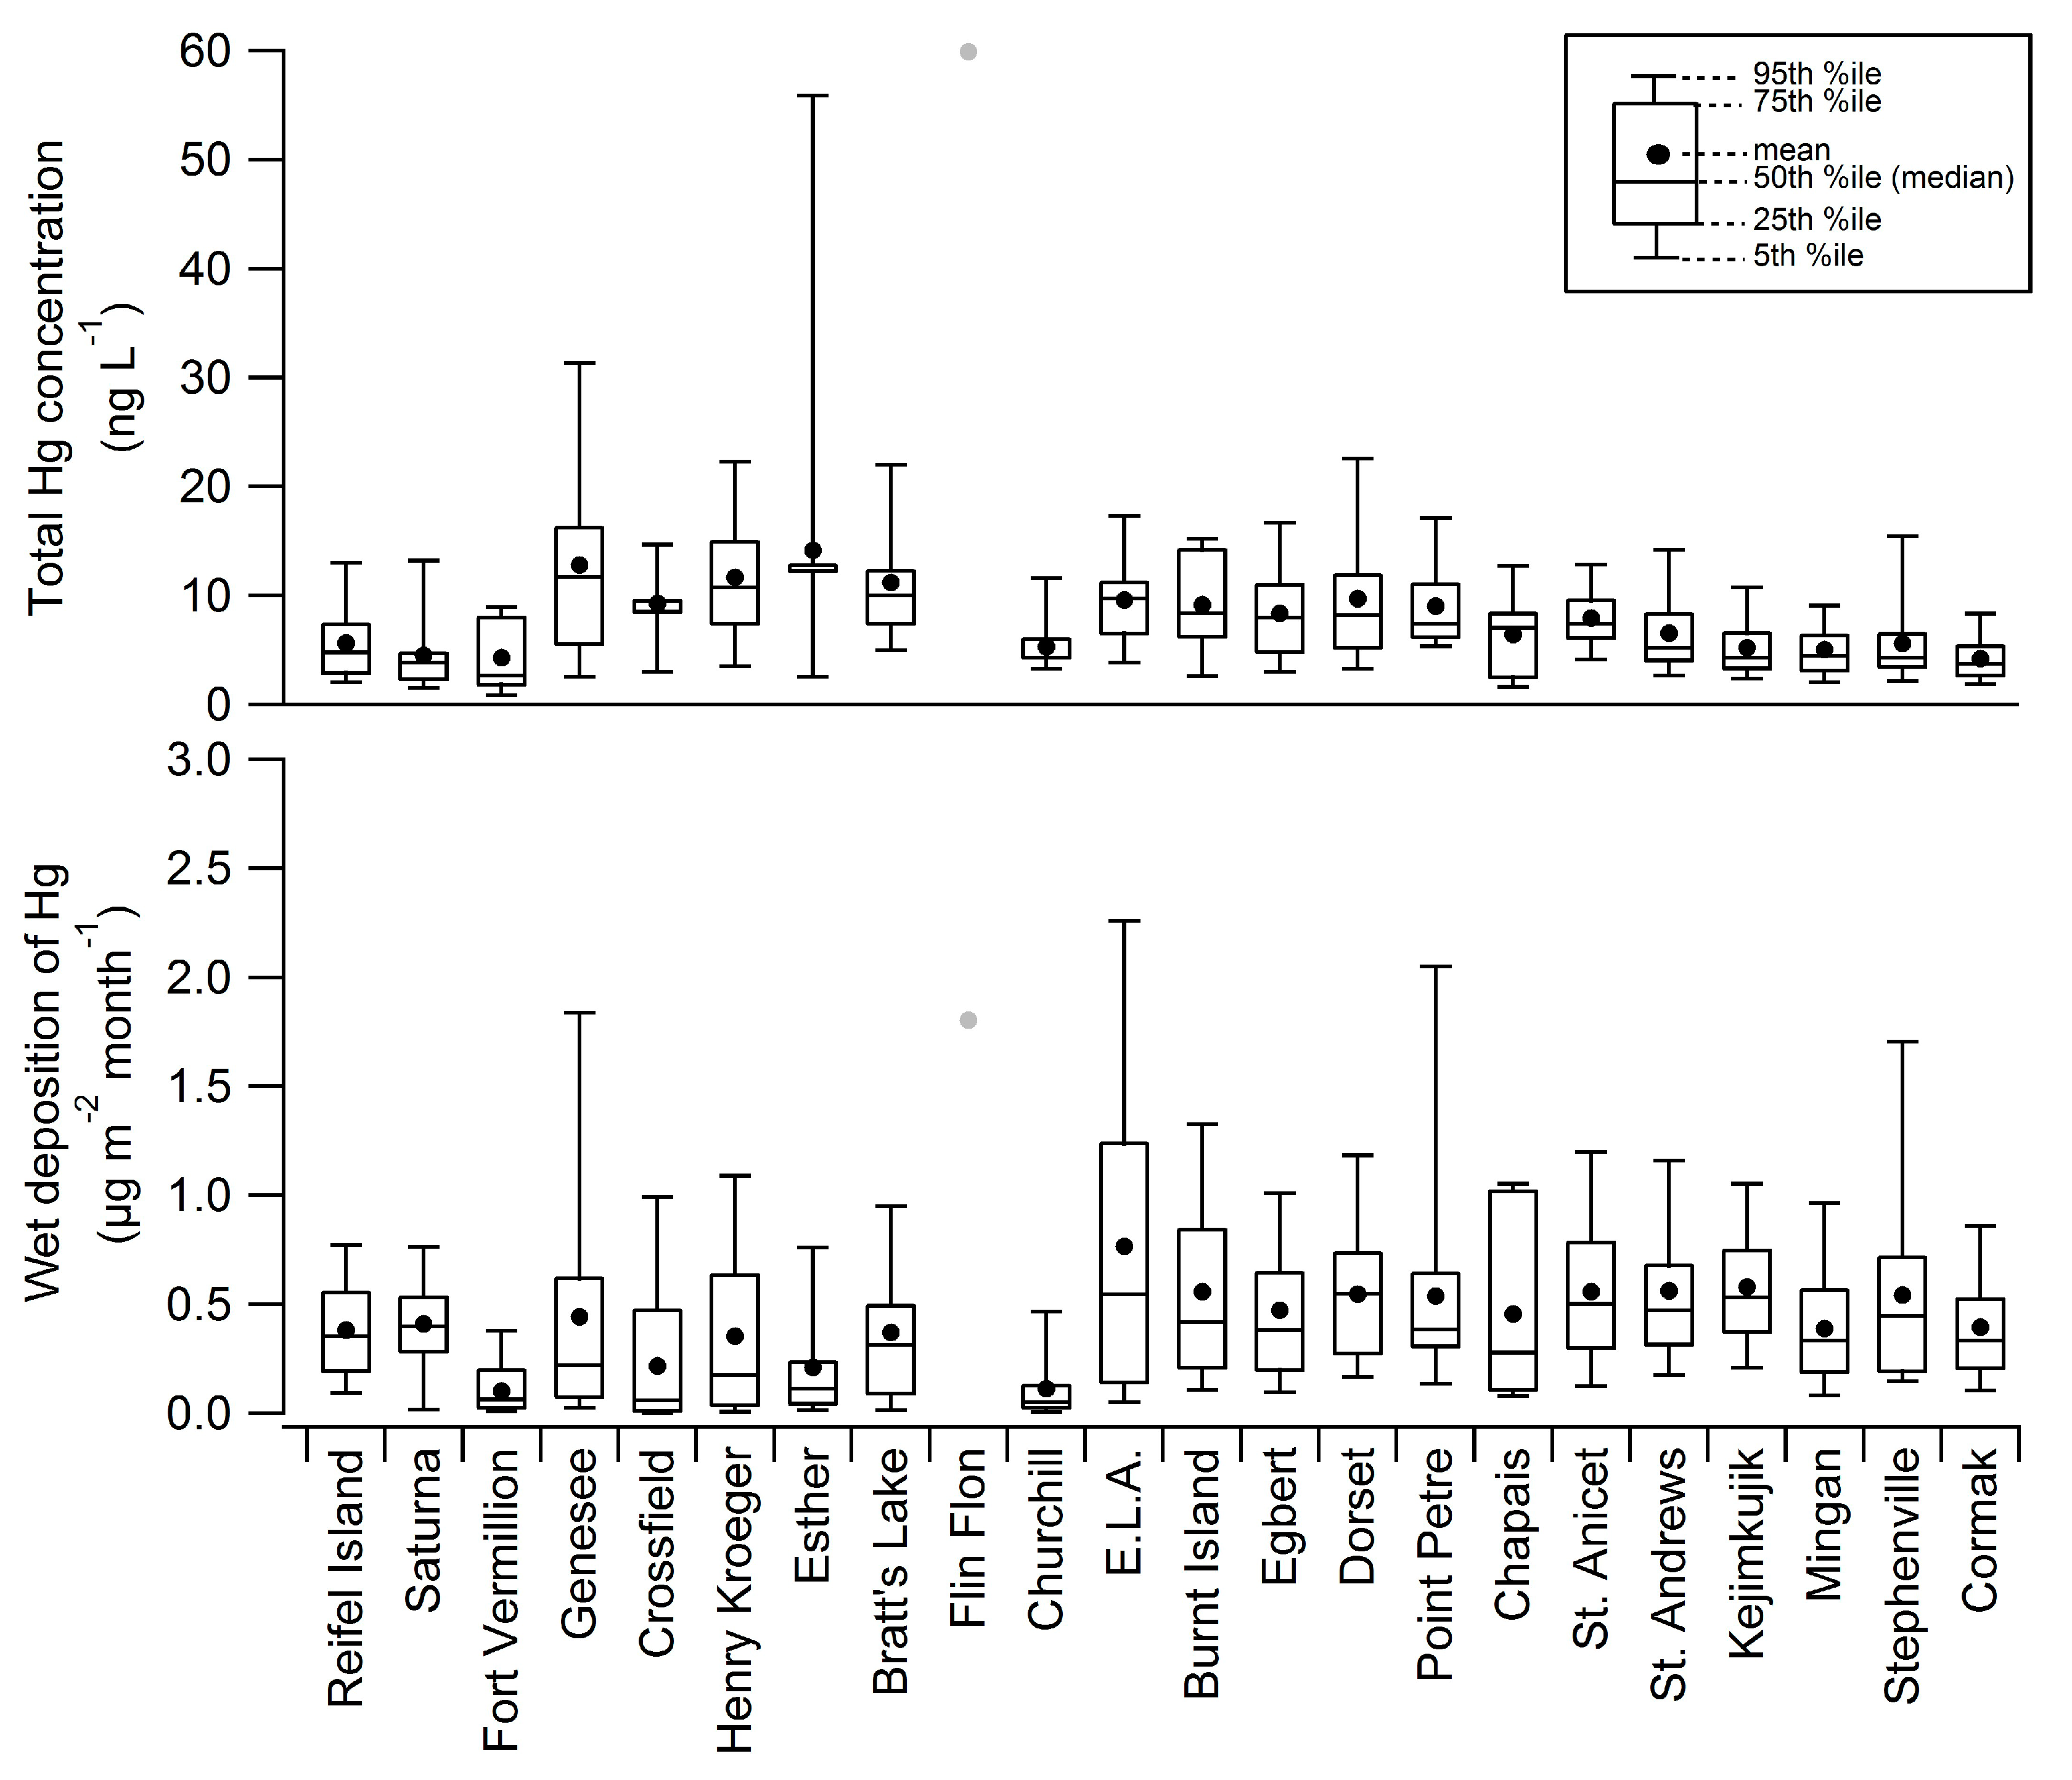
| Station | Network | Long (ºW) | Lat (ºN) | Measurement Period for Data Presented Here | Mean Total Hg Conc. (ng∙L−1) | Mean Monthly Precip (mm) | Mean Hg Dep. (μg∙m−2∙month−1) |
|---|---|---|---|---|---|---|---|
| Reifel Island BC | MDN | 123.17 | 49.10 | April 2000–Febuary 2004 | 5.6 | 68 | 0.38 |
| Saturna BC | MDN | 123.13 | 48.78 | September 2009–January 2011 | 4.5 | 91 | 0.41 |
| Fort Vermillion AB | GSC | 116.02 | 58.38 | December 2006–January 2008 | 4.3 | 22 | 0.10 |
| Genesee AB | MDN | 114.20 | 53.30 | July 2006–December 2009 | 12.8 | 32 | 0.44 |
| Crossfield AB | GSC | 114.00 | 51.29 | May 2006–December 2007 | 9.3 | 23 | 0.22 |
| Henry Kroeger AB | MDN | 110.83 | 51.42 | October 2004–December 2009 | 11.7 | 25 | 0.35 |
| Esther AB | MDN | 110.20 | 51.67 | April 2000–May 2001 | 14.2 | 14 | 0.21 |
| Bratts Lake SK | MDN | 104.72 | 50.20 | June 2001–December 2009 | 11.2 | 26 | 0.37 |
| Flin Flon MB | Edmonton | 101.88 | 54.77 | September 2009–December 2010 | 59.9 | 30 | 1.80 |
| Churchill MB | GSC | 94.07 | 58.75 | June 2006–December 2007 | 5.3 | 15 | 0.11 |
| ELA ON | MDN | 93.72 | 49.66 | November 2009–January 2011 | 9.6 | 69 | 0.77 |
| Burnt Island ON | MDN | 82.95 | 45.81 | November 2001–March 2003 | 9.2 | 61 | 0.56 |
| Egbert ON | MDN | 79.78 | 44.23 | March 2000–January 2010 | 8.4 | 57 | 0.47 |
| Dorset ON | MDN | 78.93 | 45.22 | January 1997–December 1998 | 9.7 | 56 | 0.55 |
| Point Petre ON | MDN | 77.15 | 43.84 | November 2001–March 2003 | 9.1 | 58 | 0.54 |
| Chapais PQ | MDN | 74.98 | 49.82 | December 2009–January 2011 | 6.4 | 71 | 0.46 |
| St. Anicet PQ | MDN | 74.03 | 45.20 | April 1998–August 2007 | 7.9 | 70 | 0.56 |
| St. Andrews NB | MDN | 67.08 | 45.08 | July 1996–December 2003 | 6.6 | 86 | 0.56 |
| Kejimkujik NS | MDN | 65.21 | 44.43 | July 1996–January 2010 | 5.2 | 111 | 0.58 |
| Mingan PQ | MDN | 64.23 | 50.27 | April 1998–August 2007 | 5.0 | 77 | 0.39 |
| Stephenville NL | MDN | 58.57 | 48.56 | Febuary 2010–January 2011 | 5.6 | 97 | 0.54 |
| Cormak NL | MDN | 57.38 | 49.32 | May 2000–January 2010 | 4.2 | 94 | 0.40 |

2. Results and Discussion
2.1. Spatial Patterns of Hg in Canada


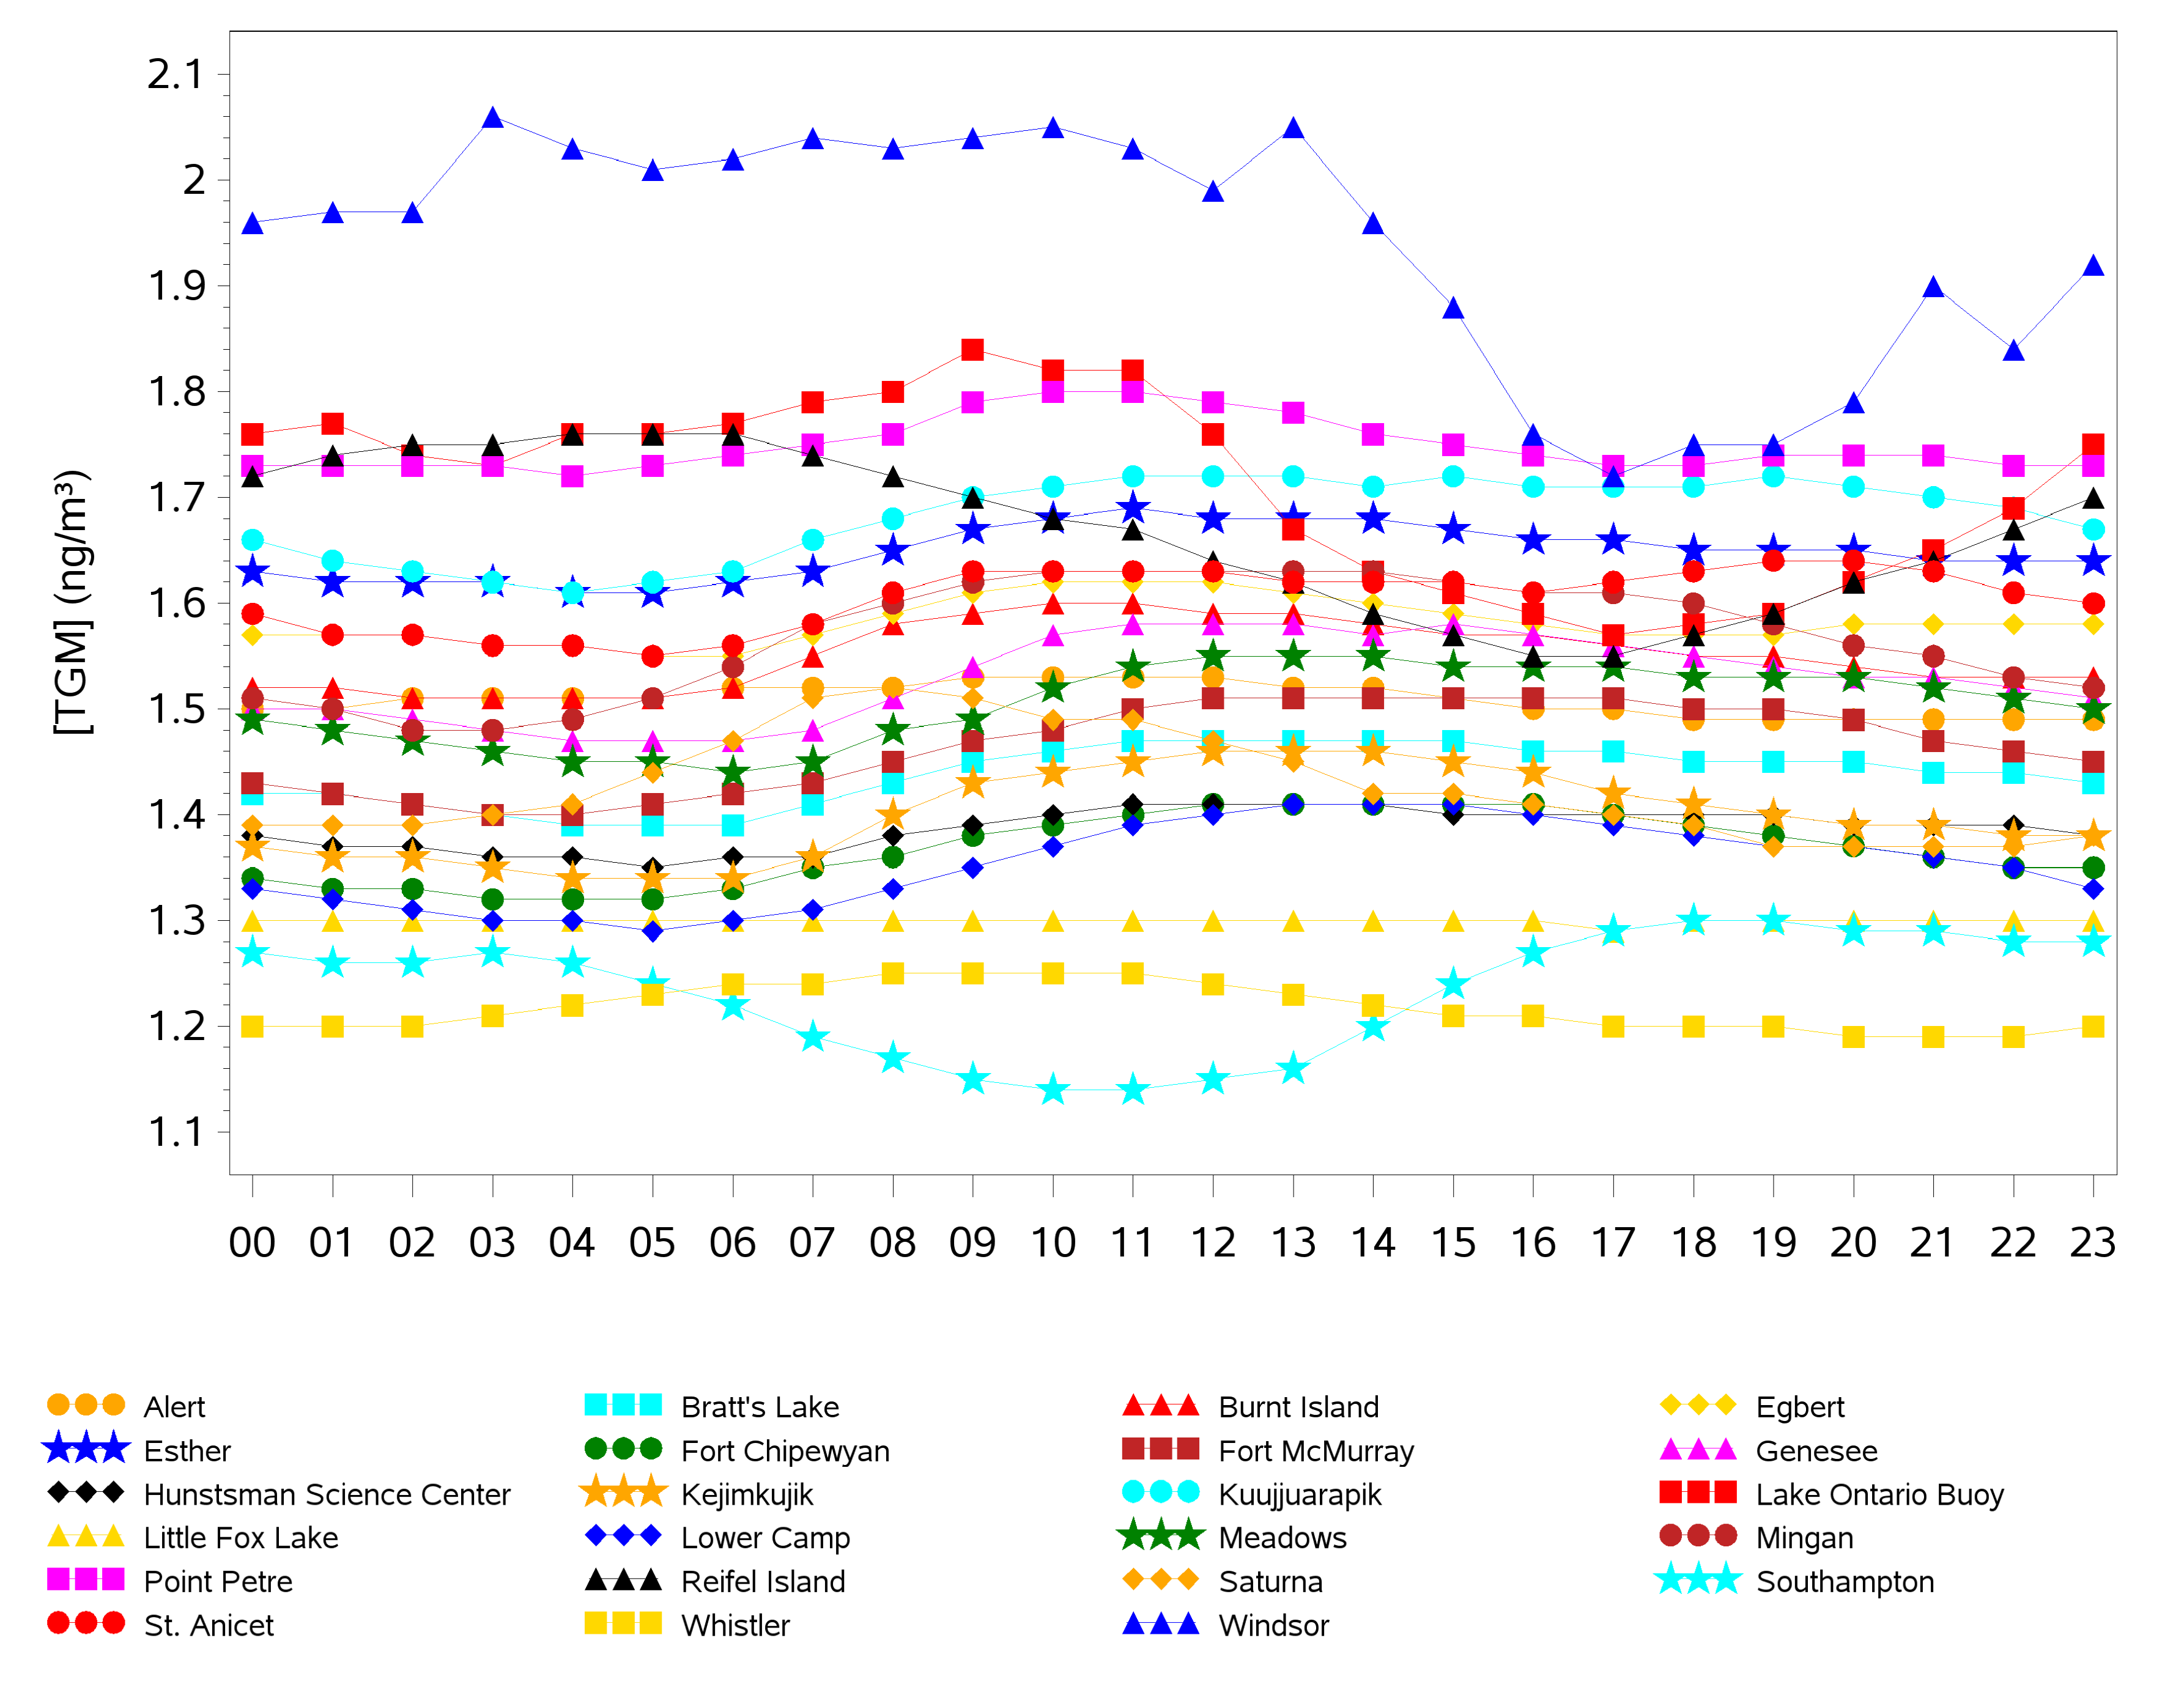
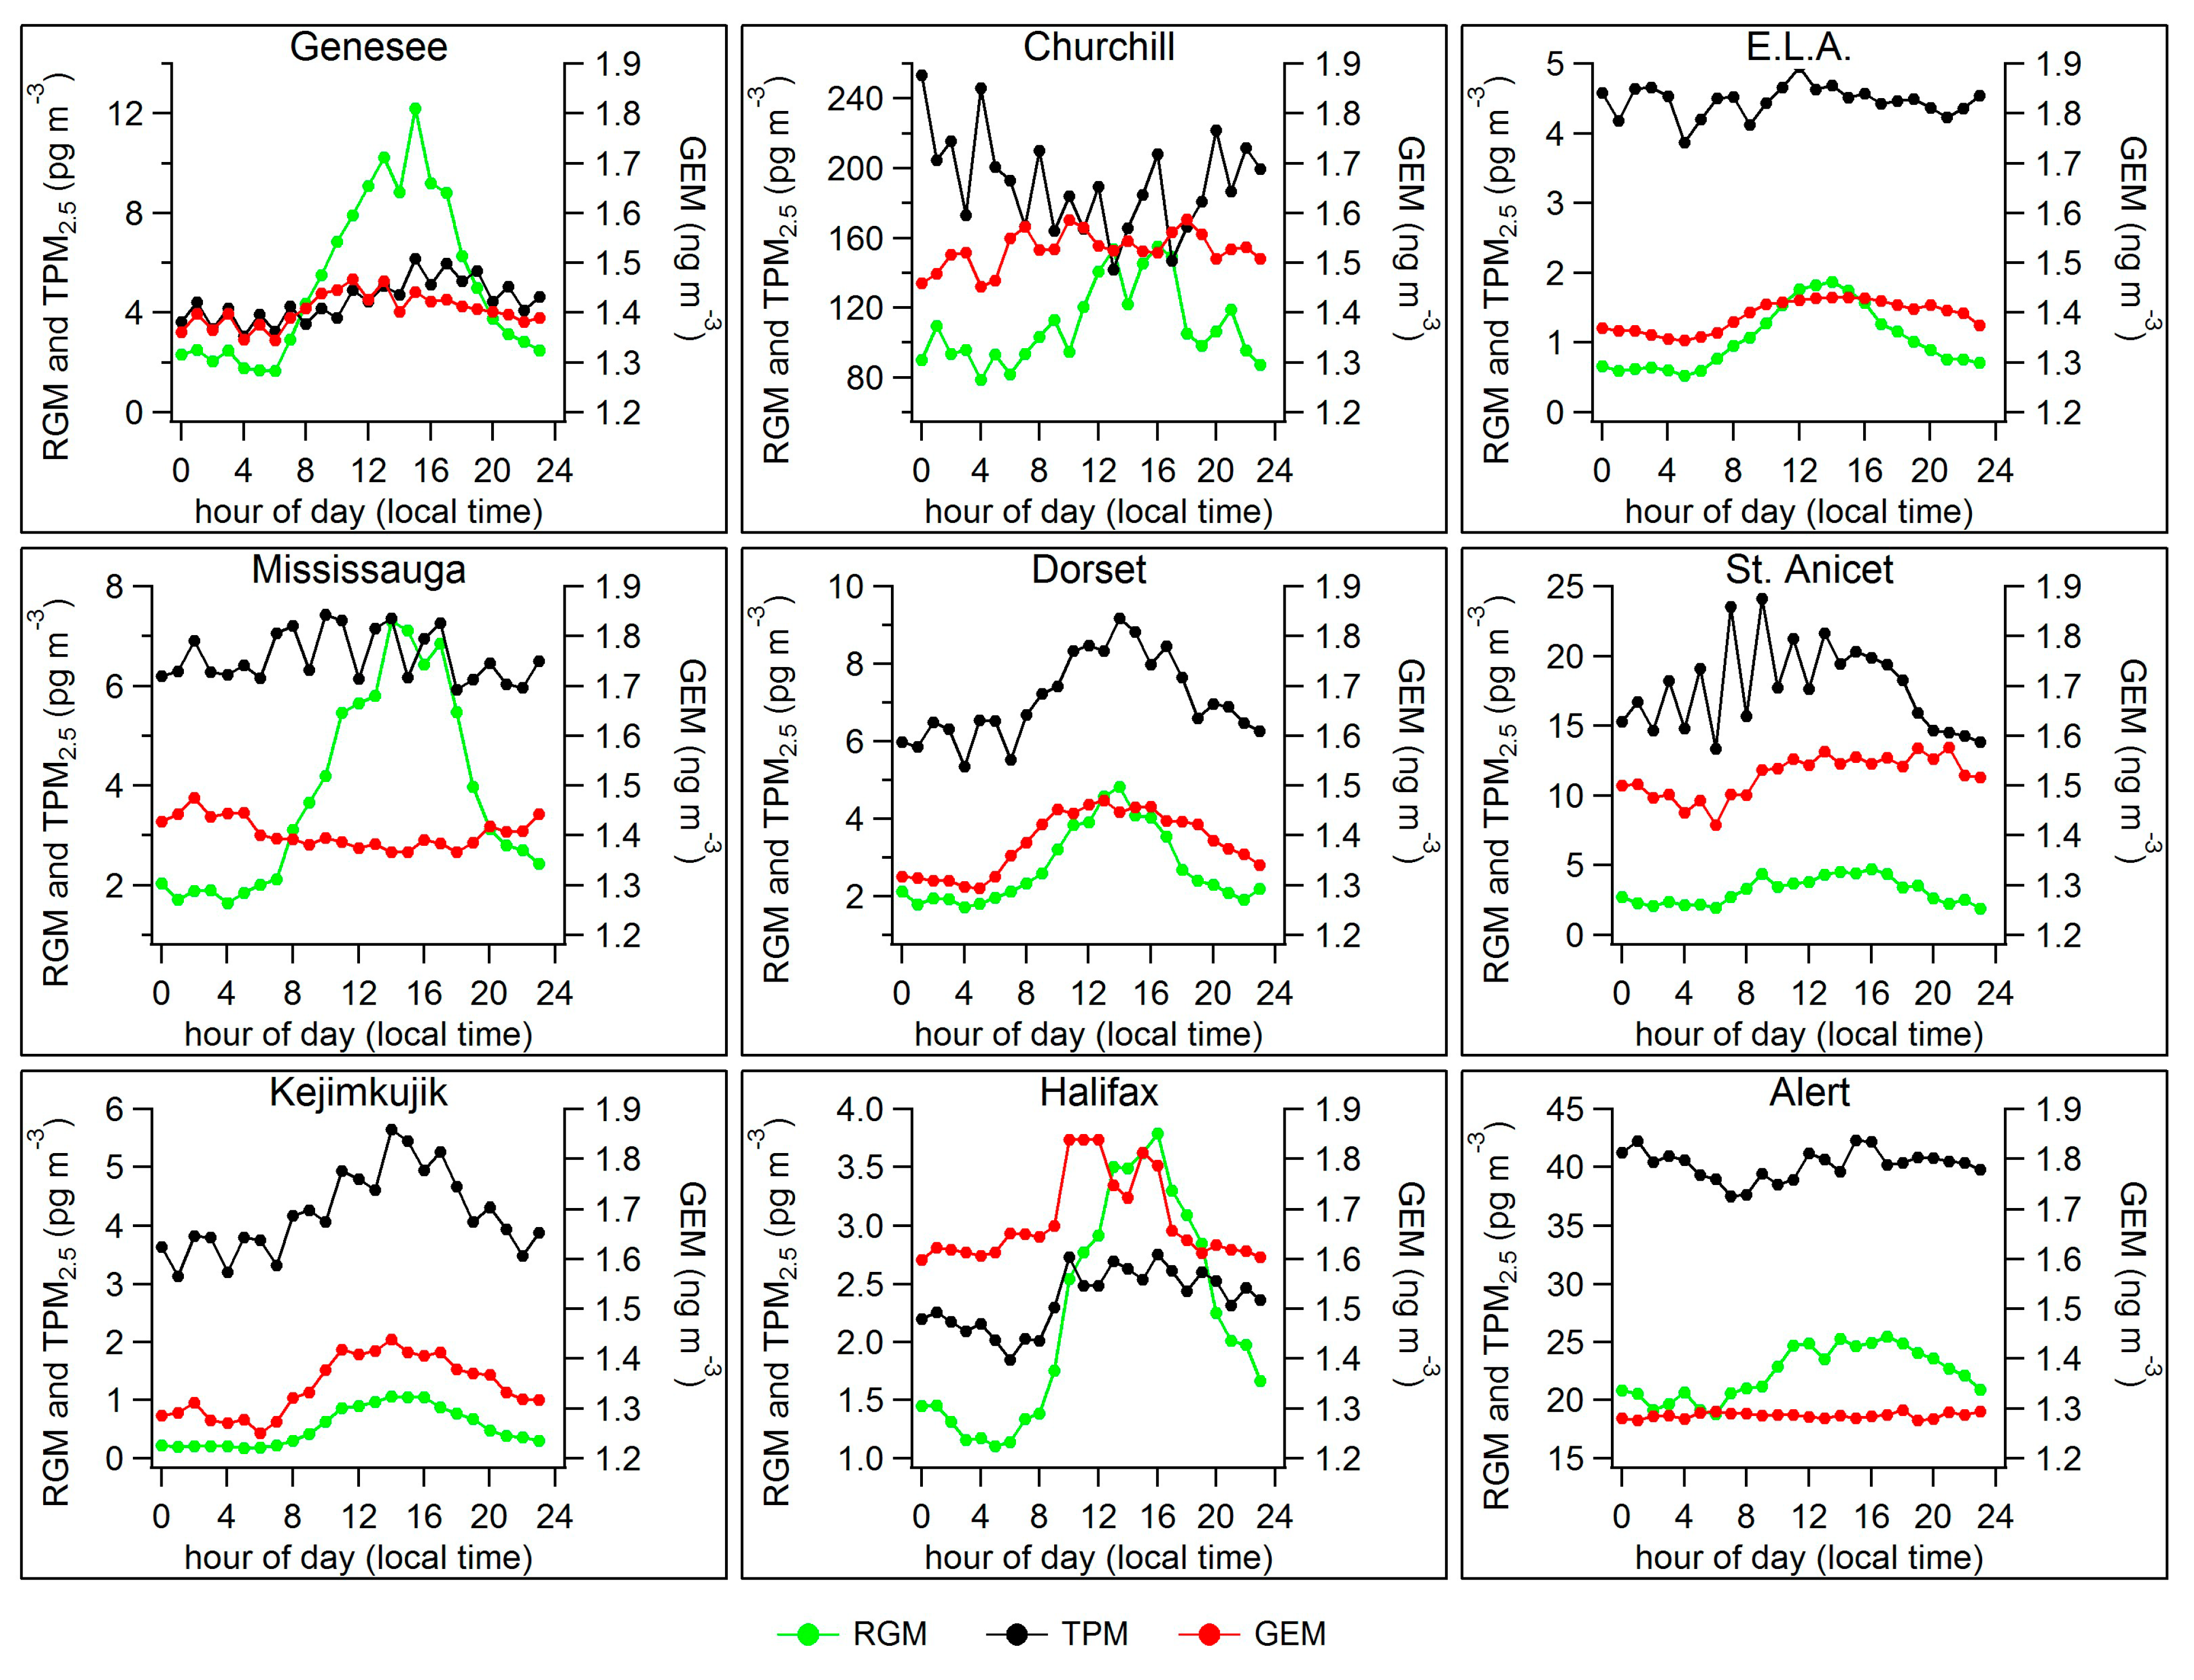
2.2. Diel Patterns of Atmospheric Hg


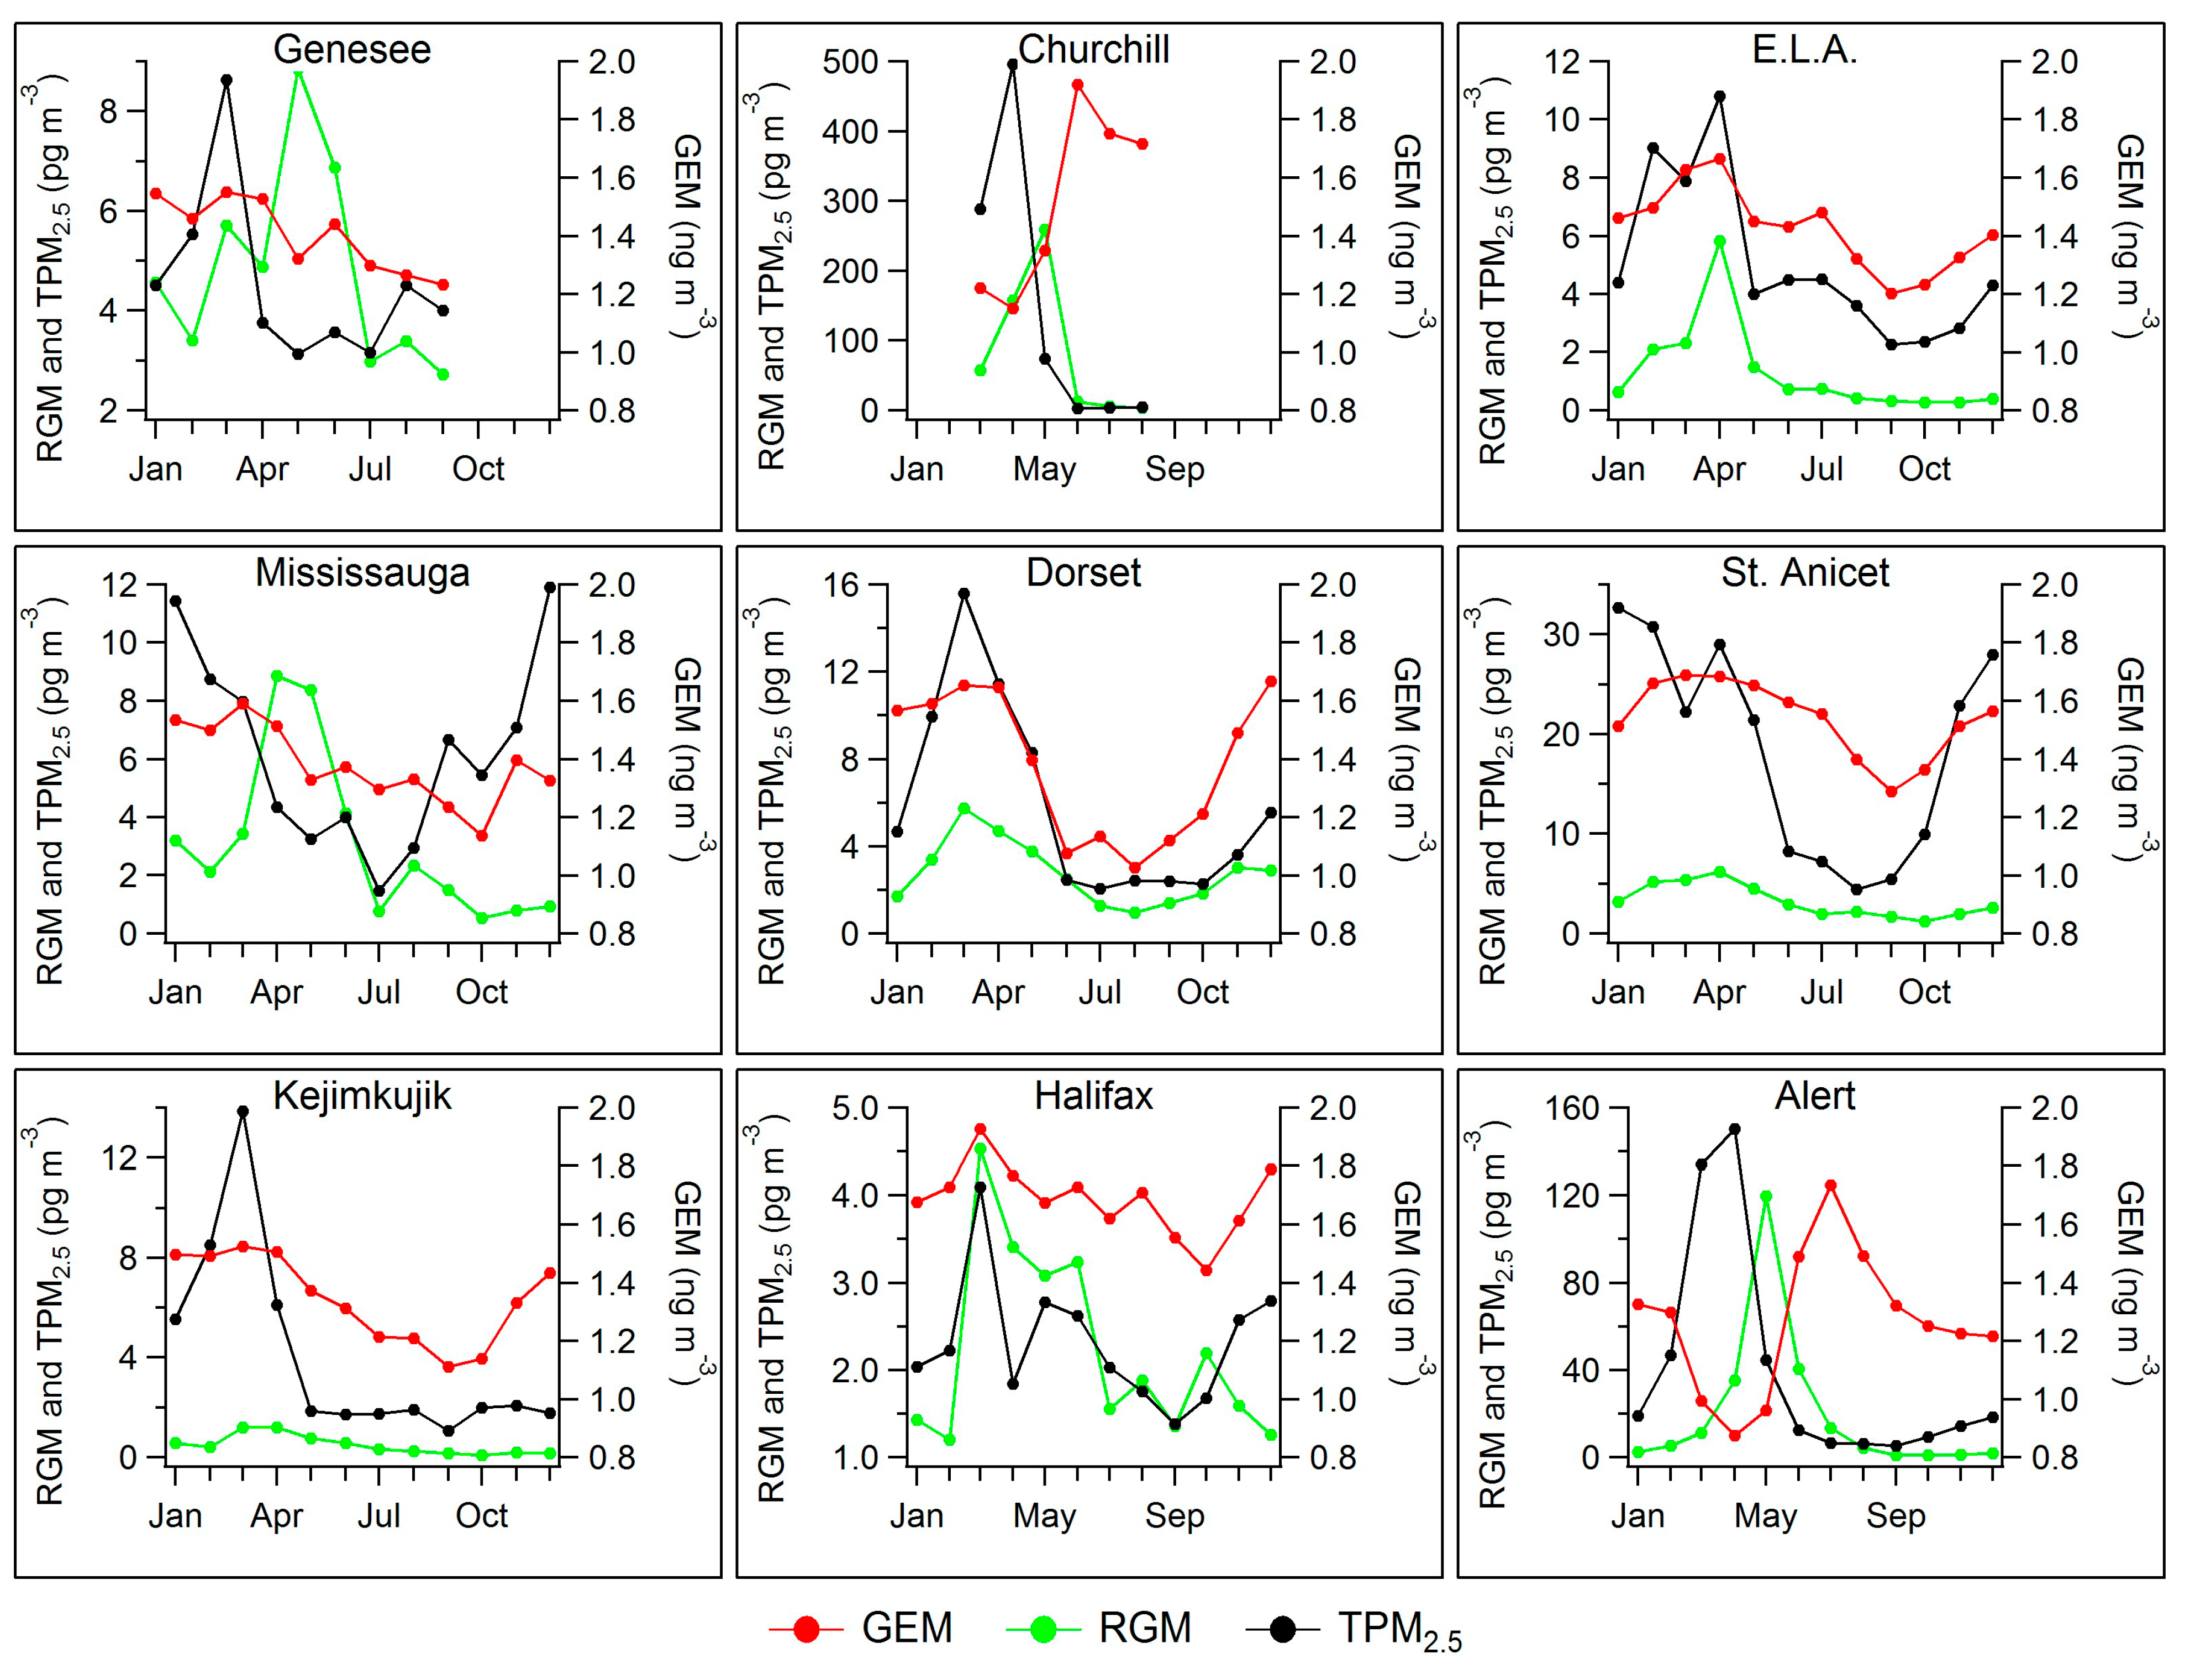
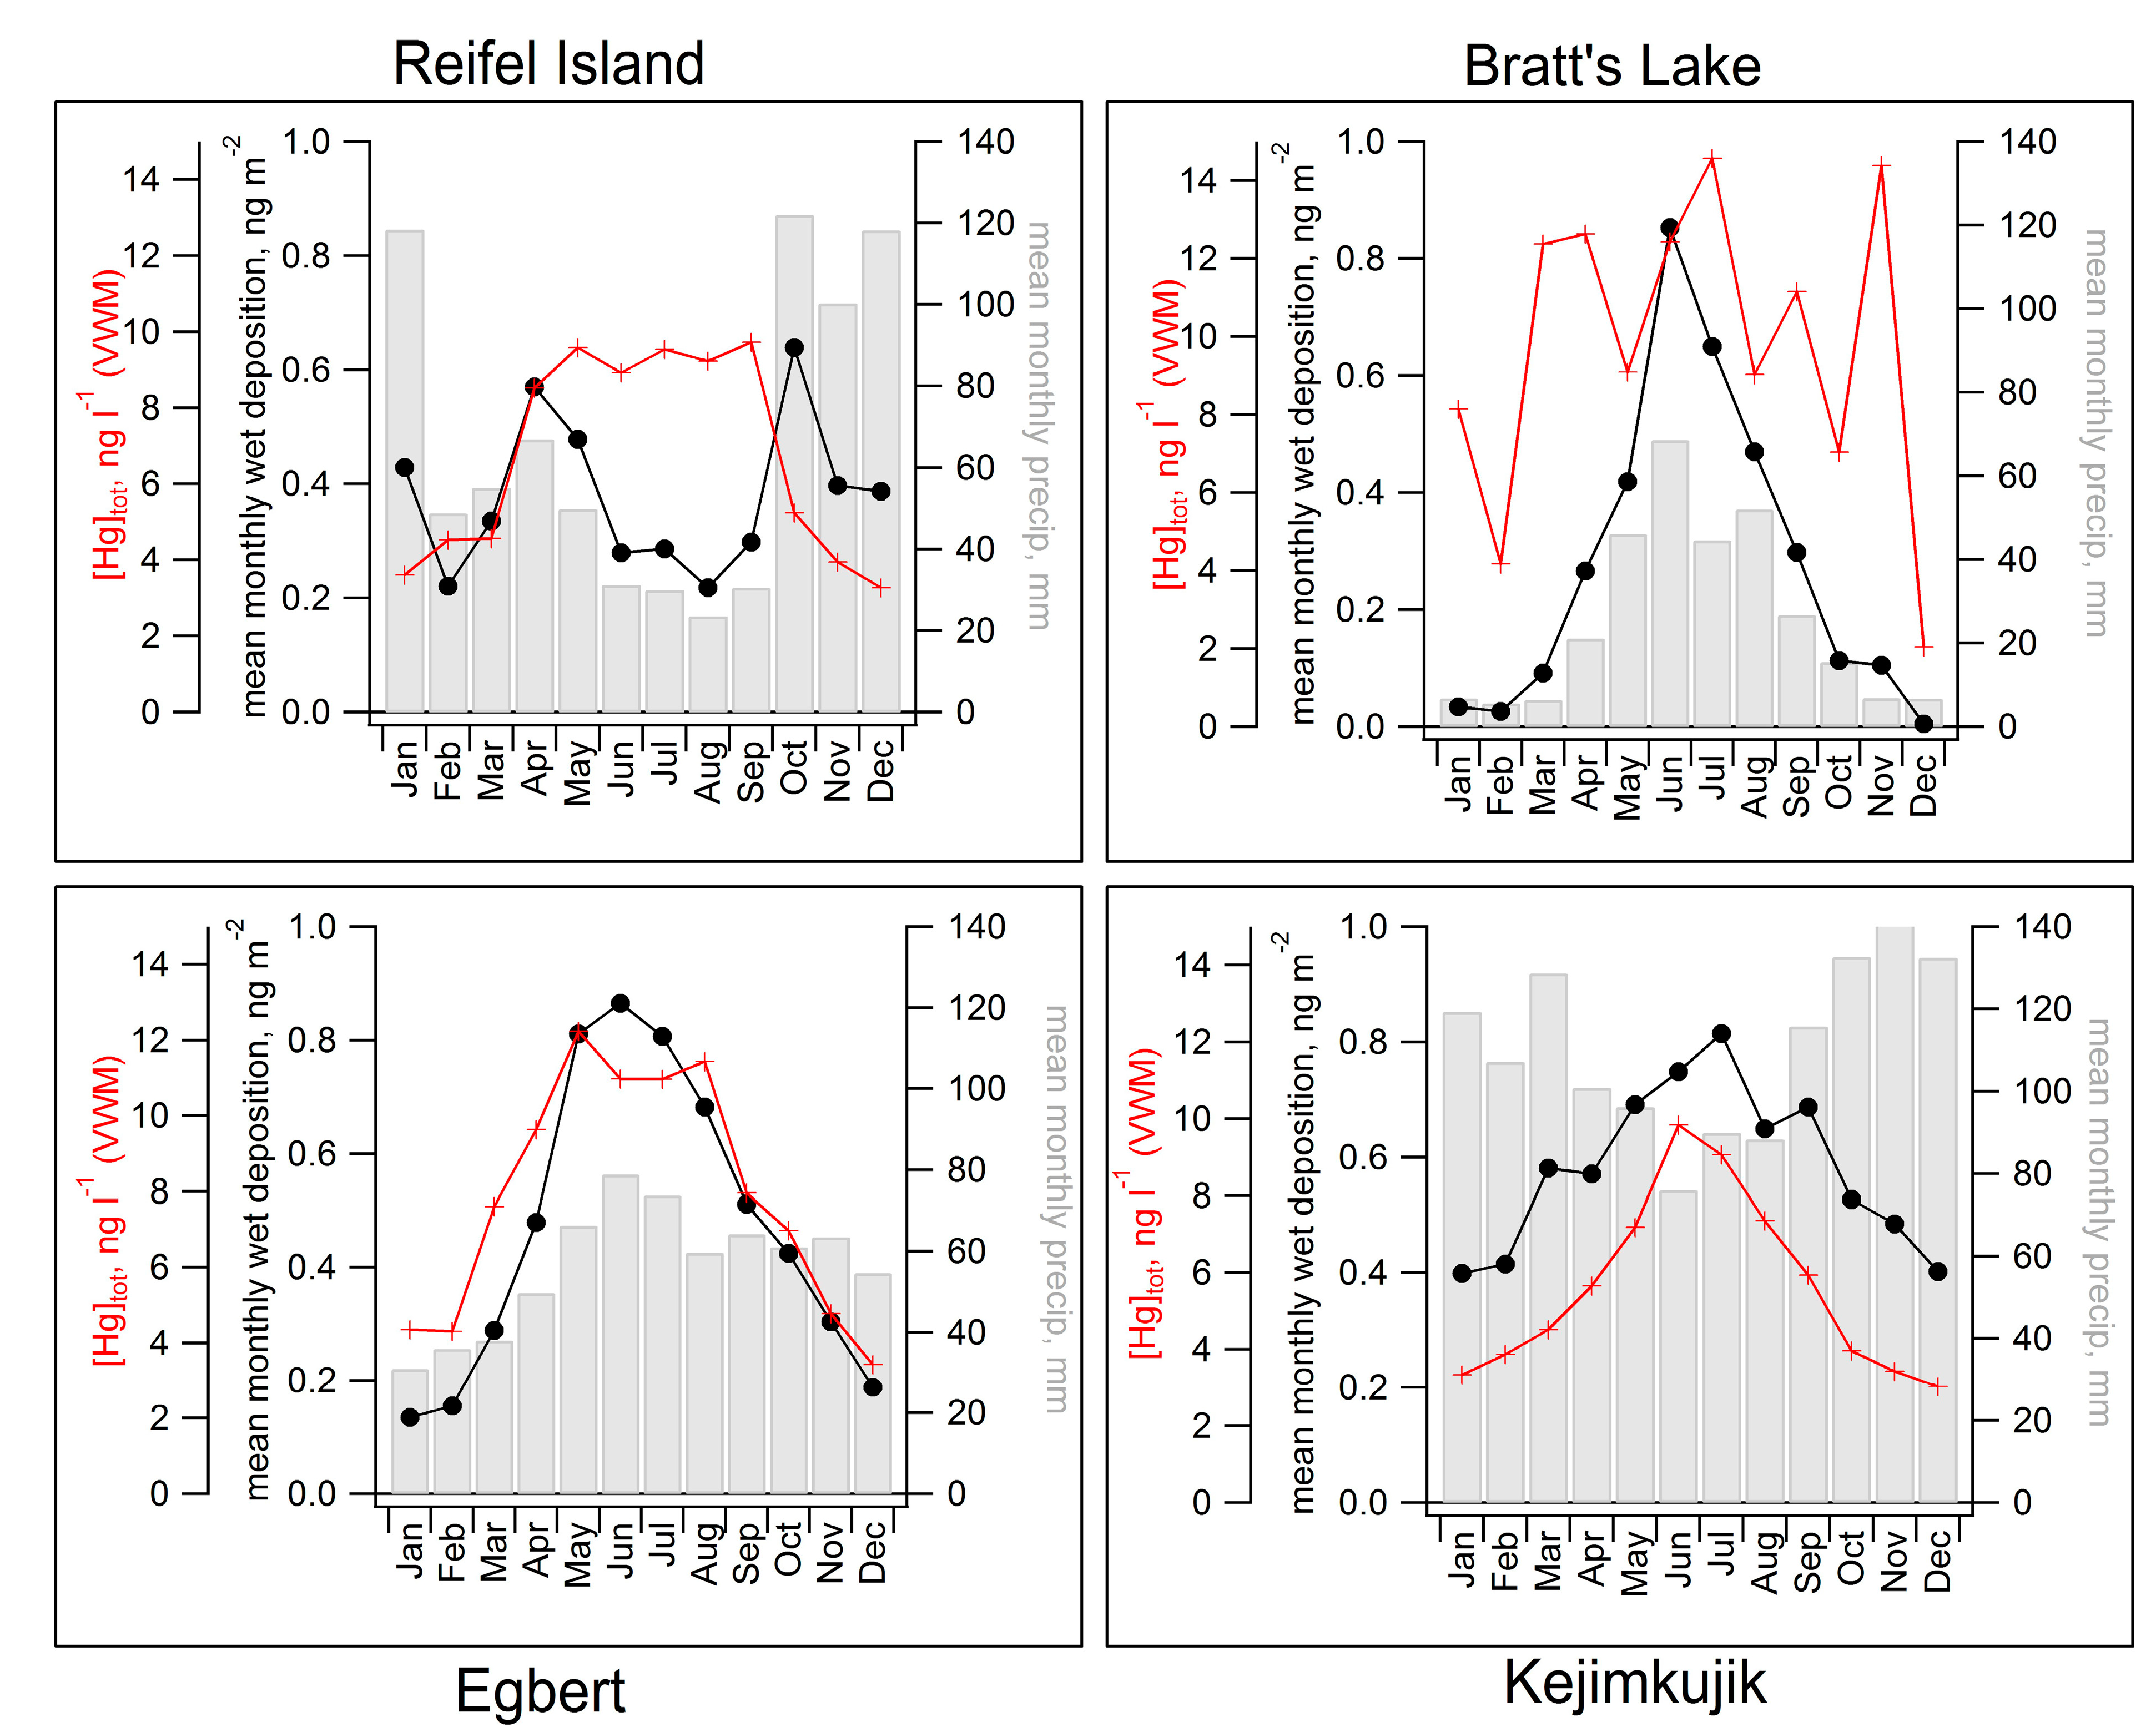
2.3. Seasonal Patterns in Atmospheric Hg and Hg in Precipitation


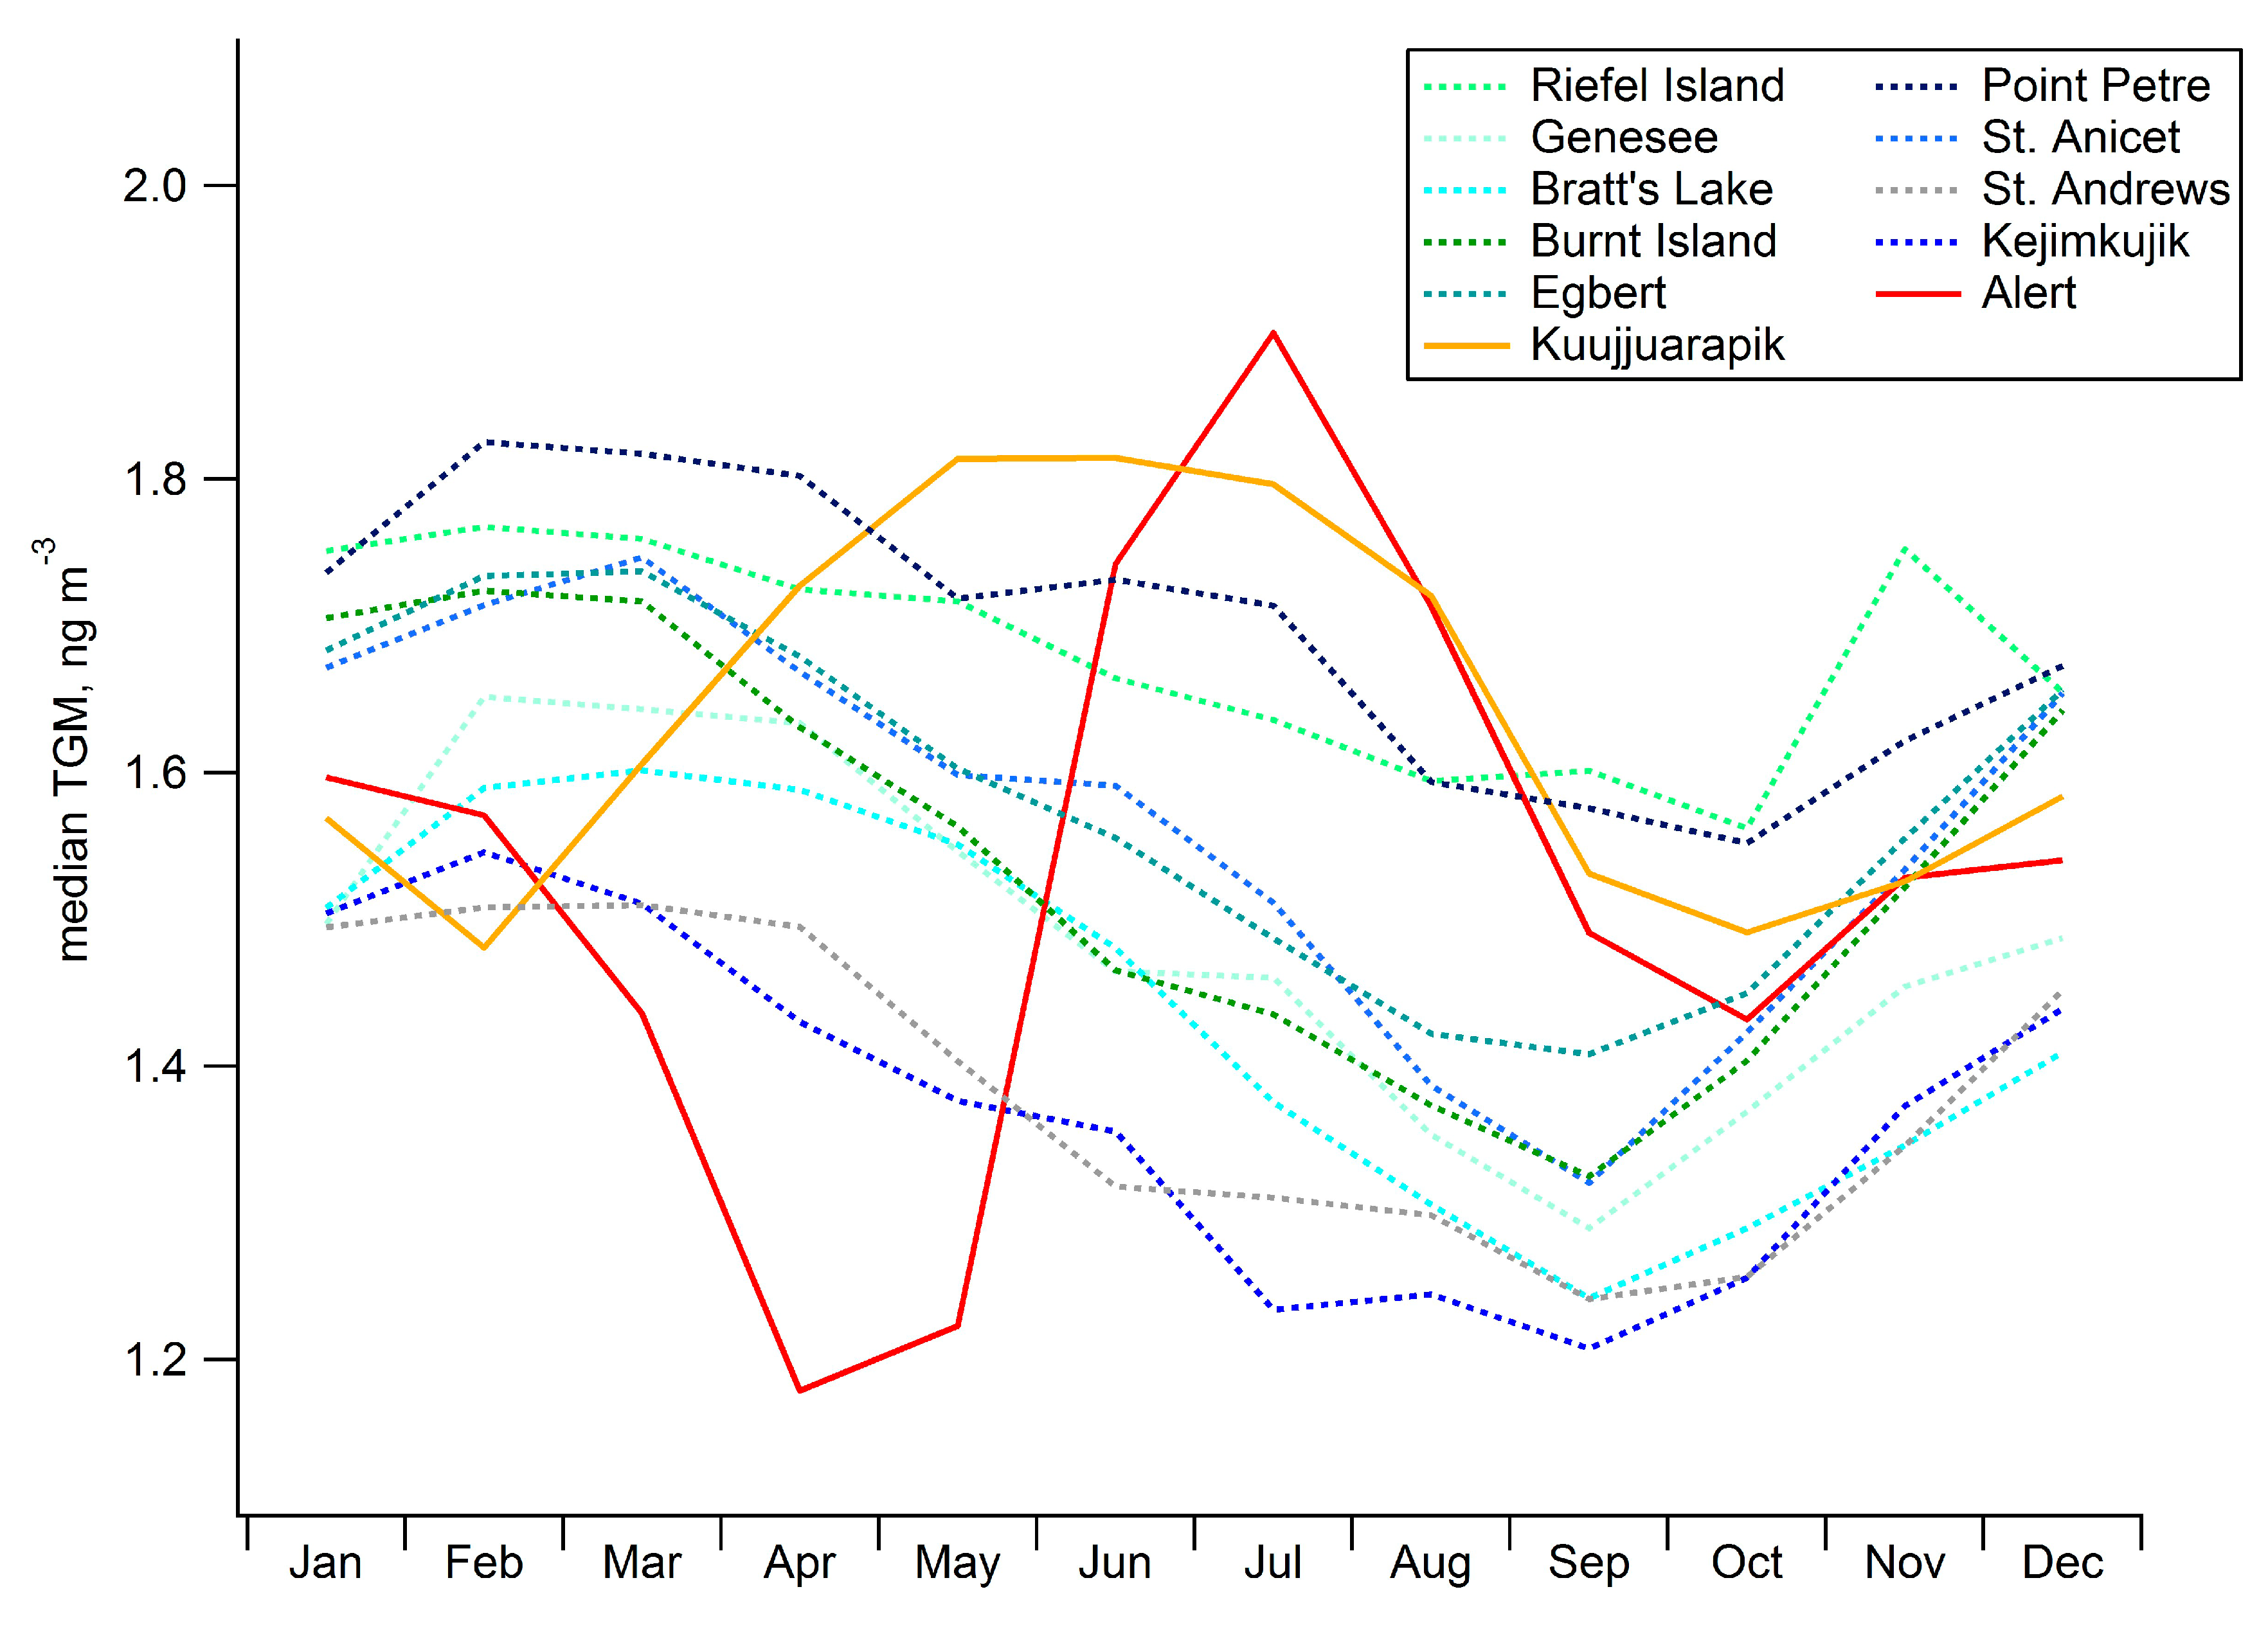
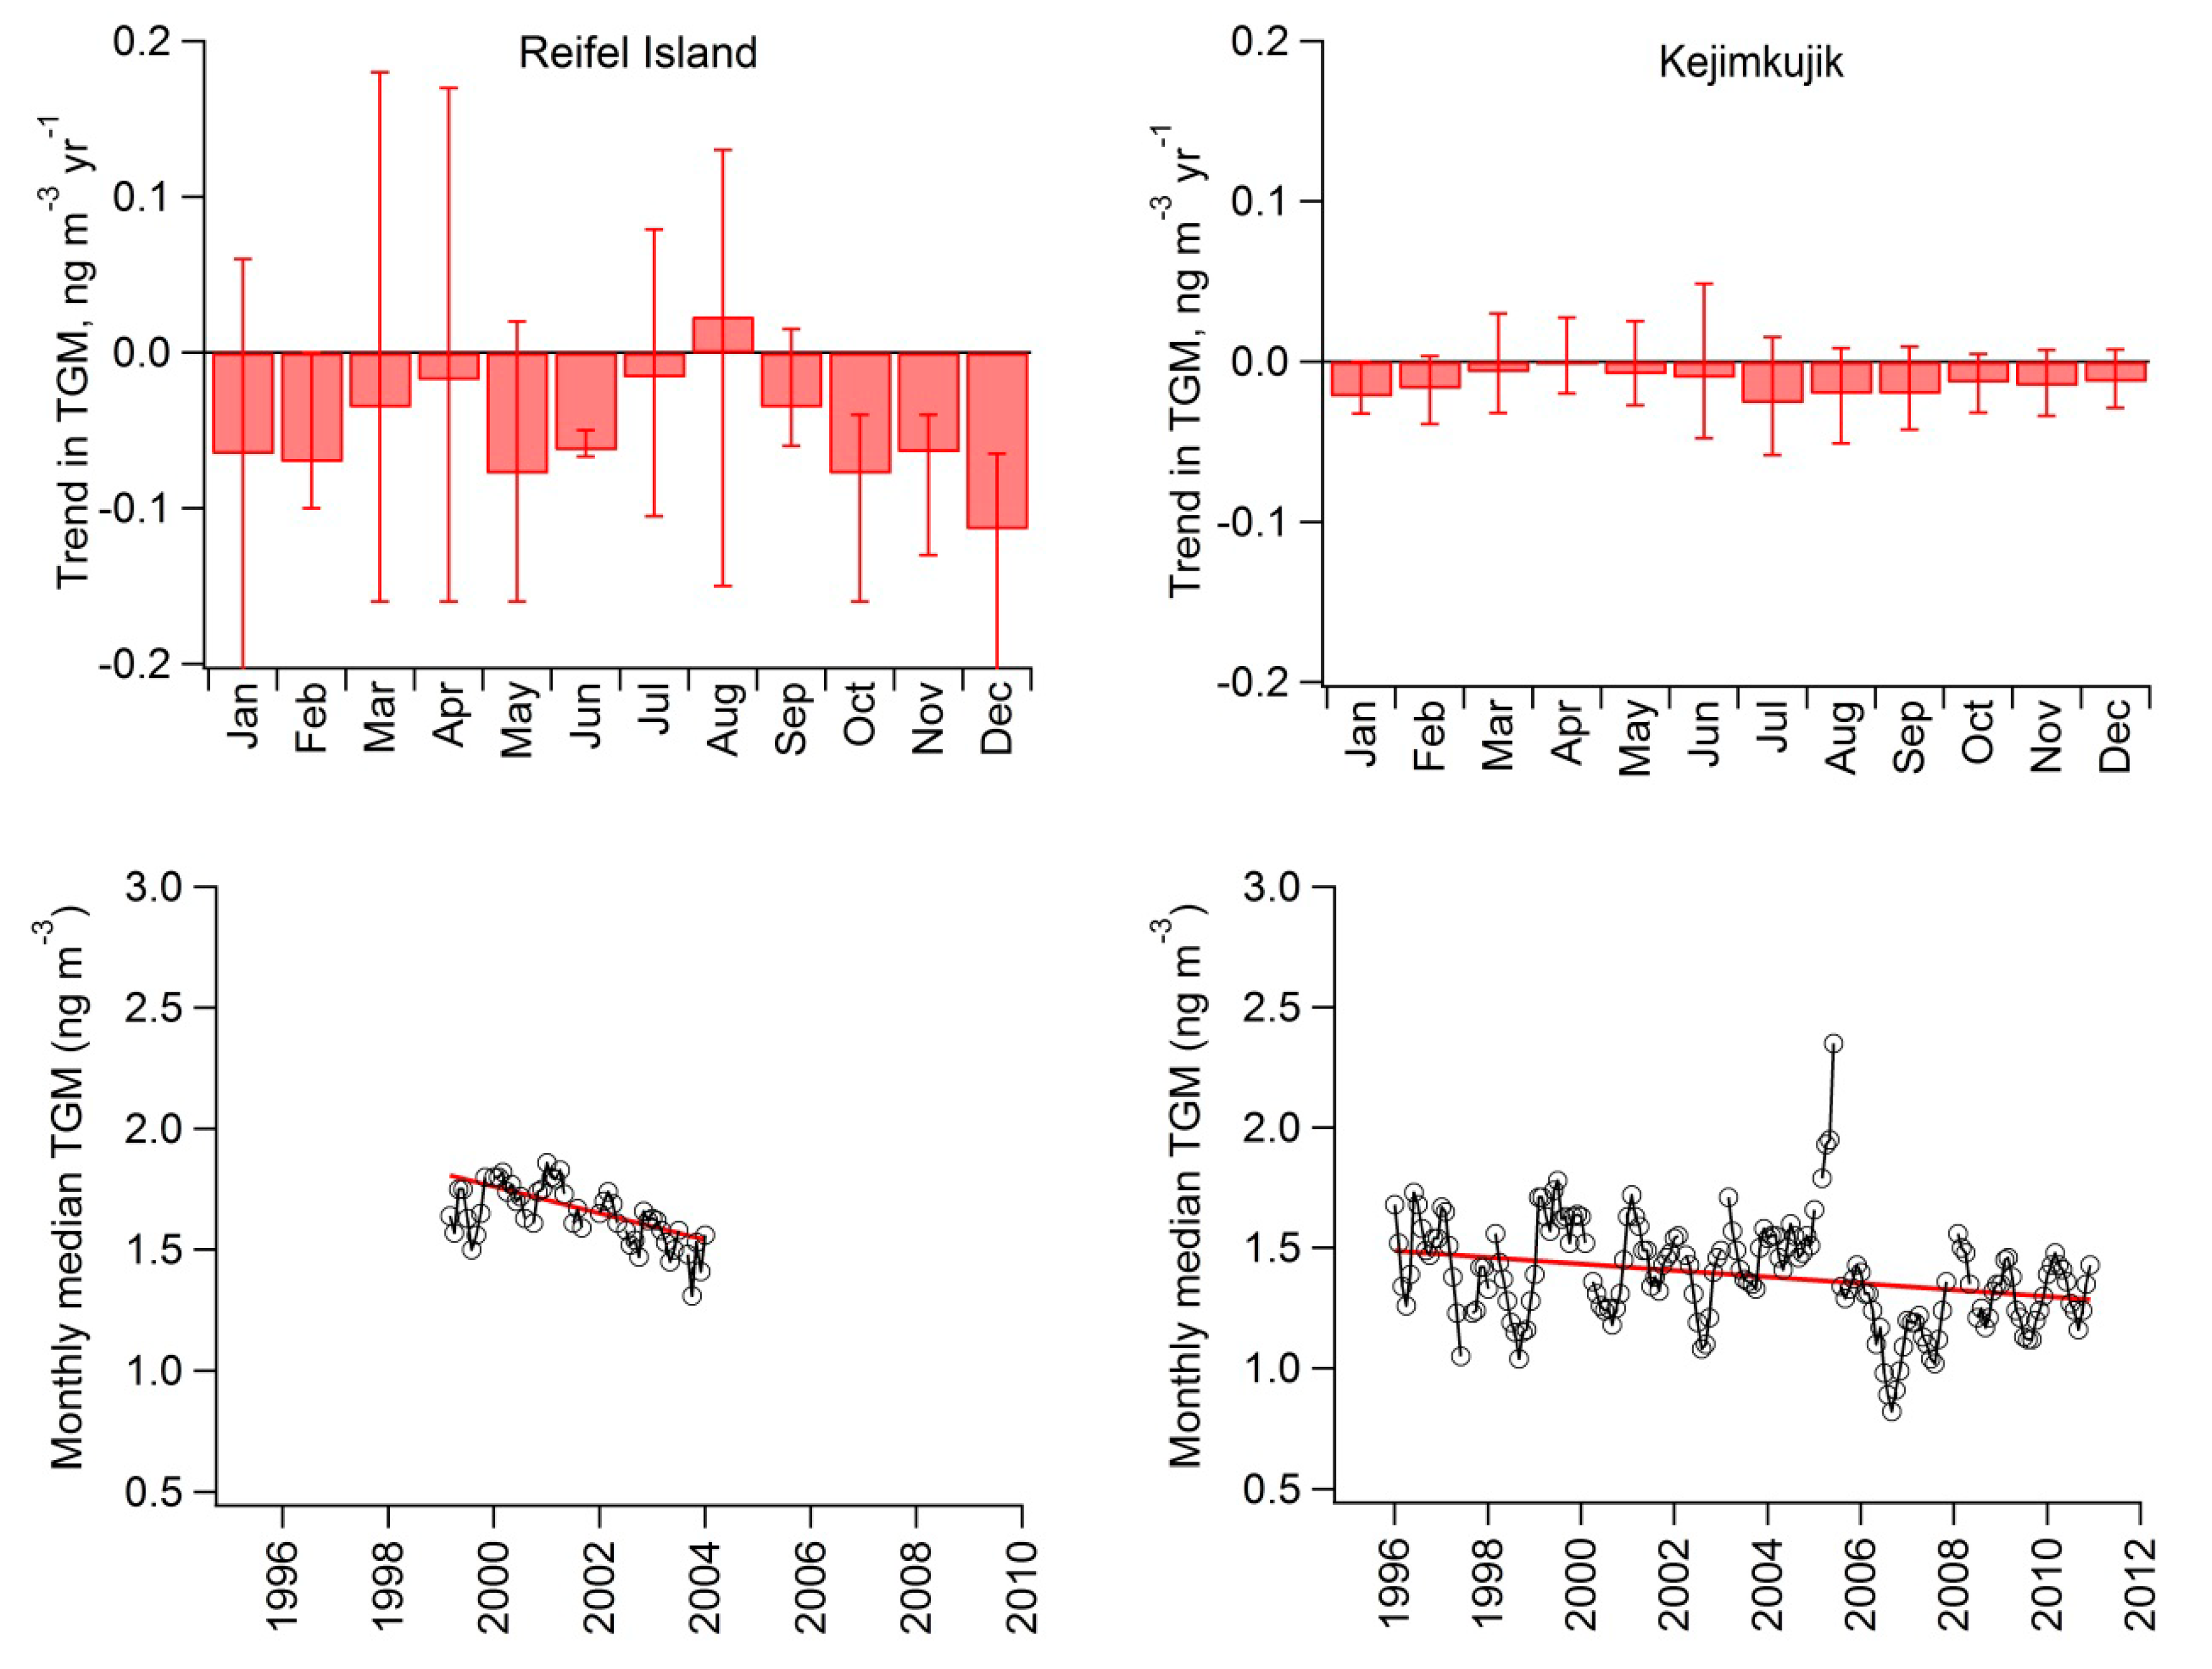
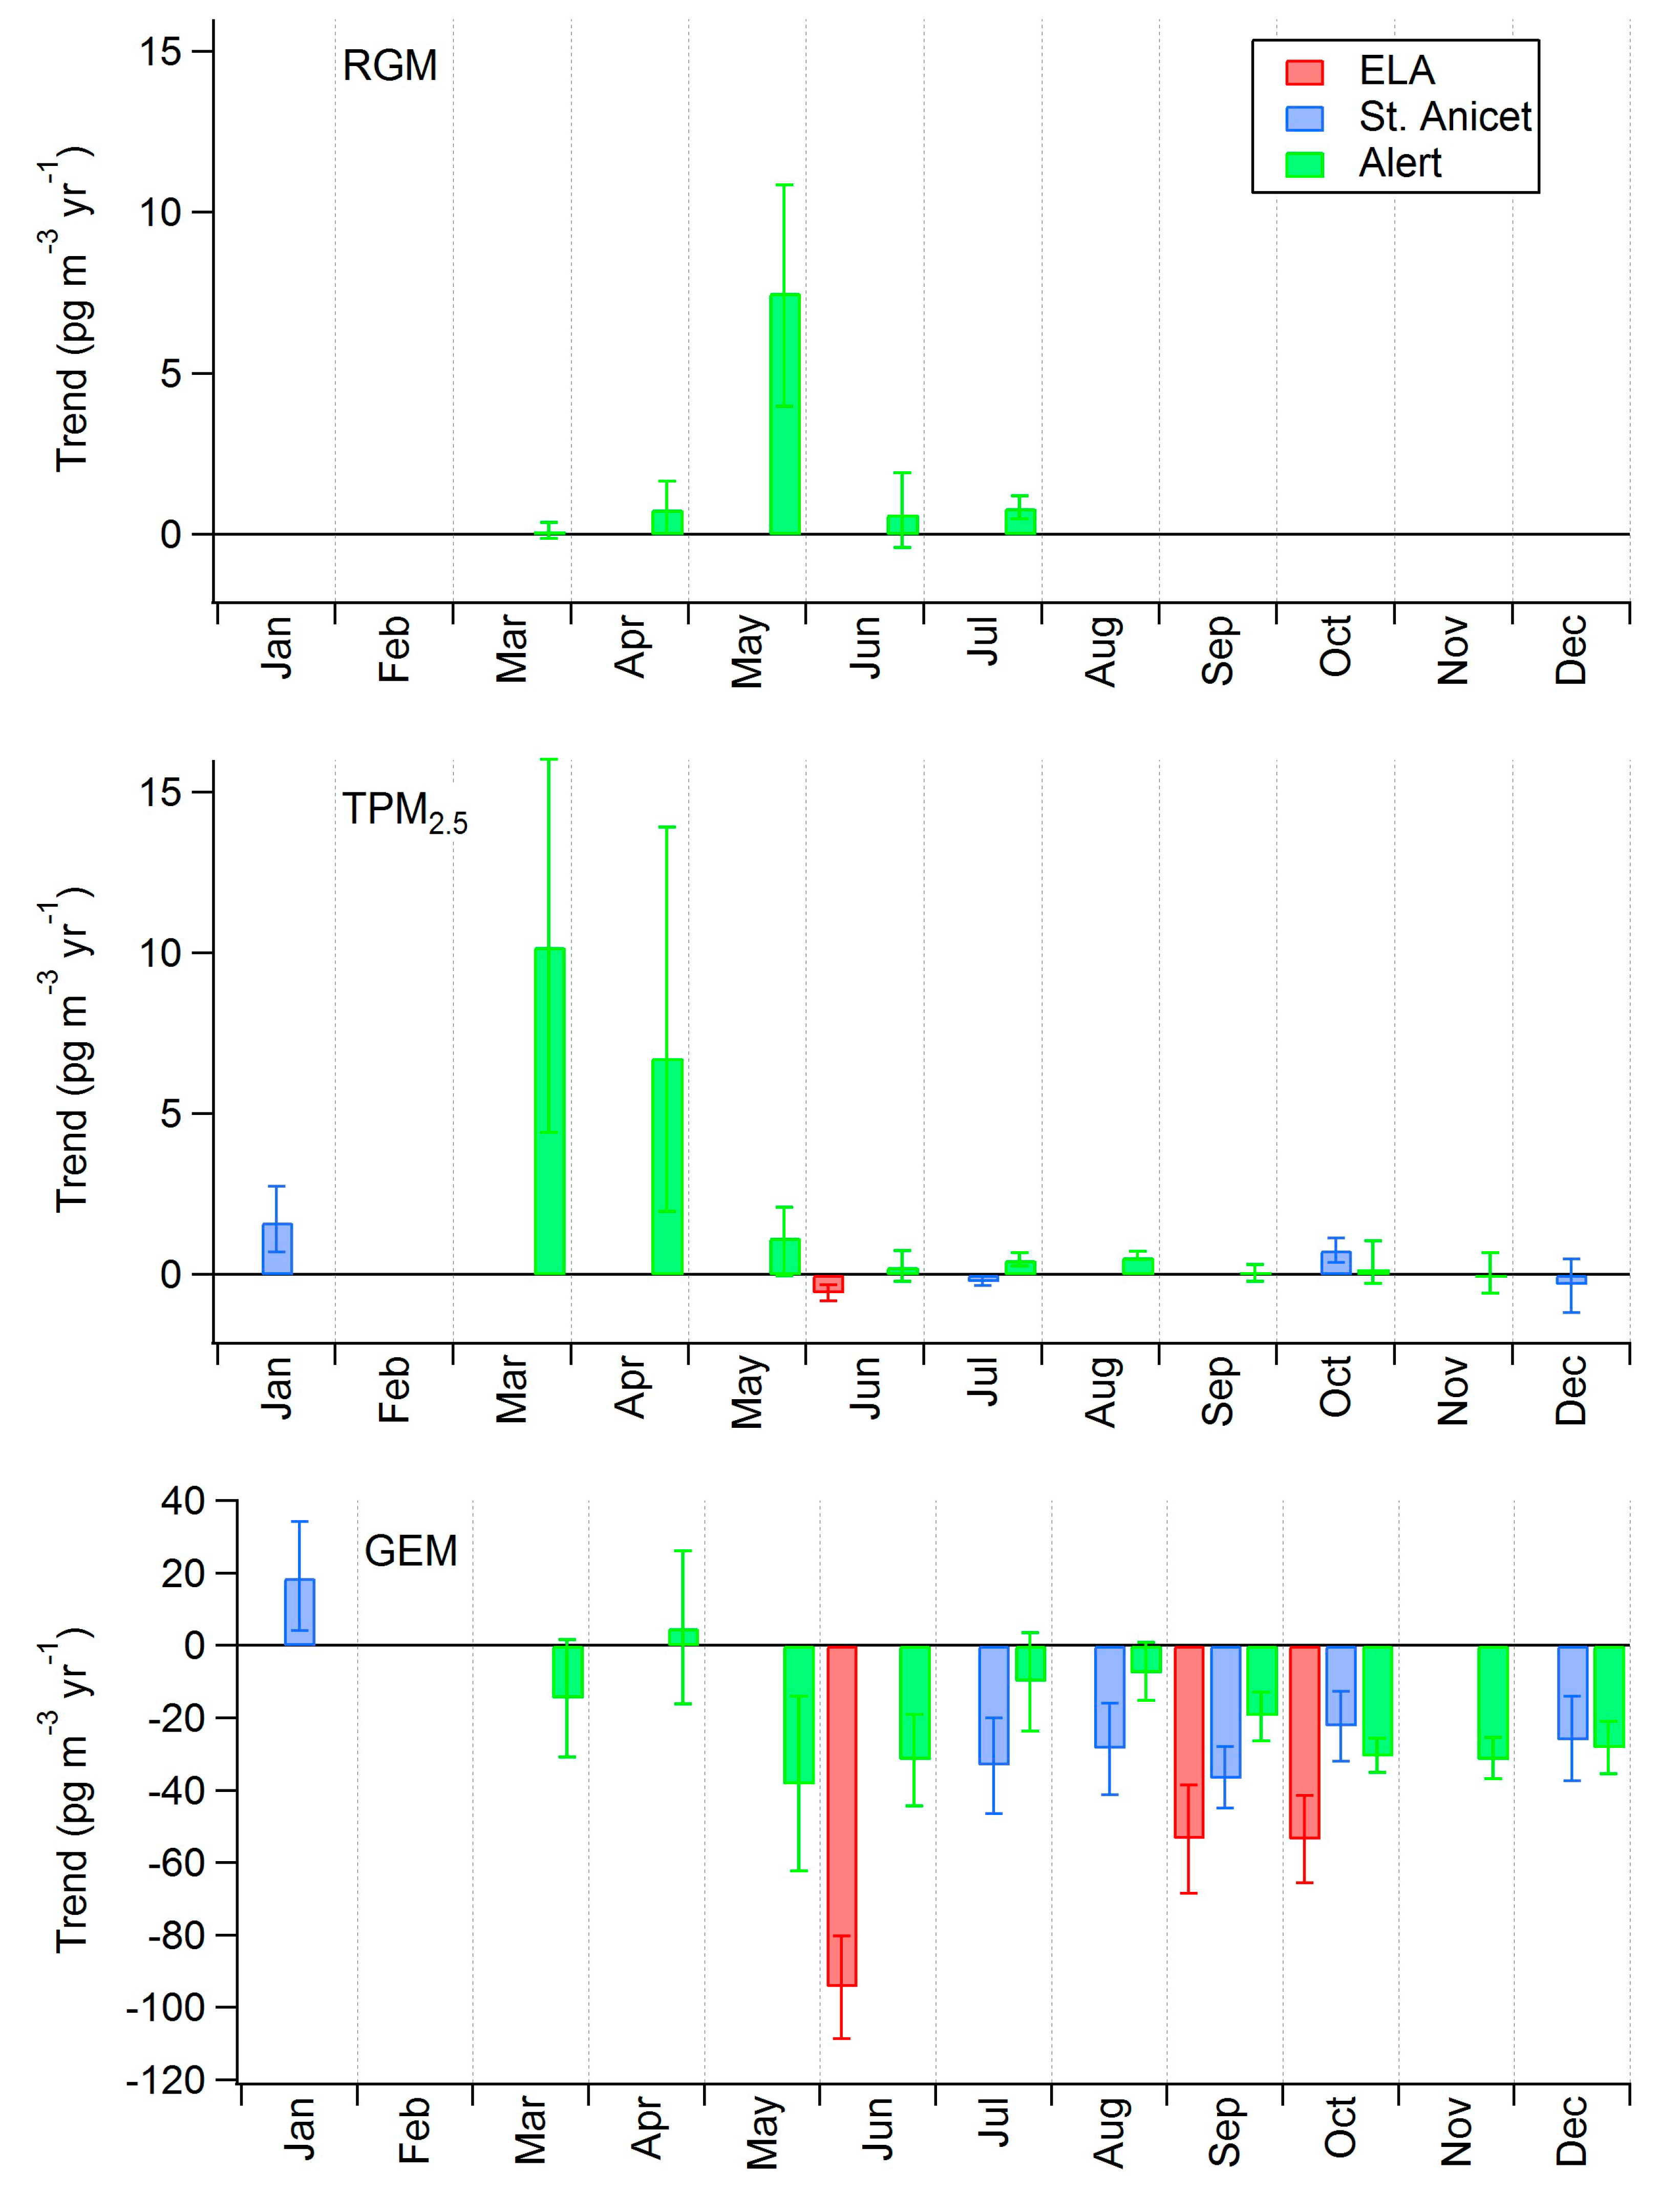
2.4. Long-Term Trends
| Site | Time Period | TGM Trend, pg·m−3·yr−1 | TGM Trend, % yr−1 |
|---|---|---|---|
| Reifel Island | 1999–2004 | −55 (−70 to −40) | −3.3 (−4.2 to −2.4) |
| Genesee | 2004–2010 | −6 (−21 to +1) (ns) | −0.4 (−1.4 to +0.1) (ns) |
| Bratt’s Lake | 2001–2010 | −37 (−48 to −23) | −2.5 (−3.4 to −1.6) |
| Burnt Island | 1998–2007 | −15 (−22 to −7) | −1.0 (−1.4 to −0.4) |
| Egbert | 1996–2010 | −20 (−27 to −16) | −1.3 (−1.7 to −1.0) |
| Kuujjuarapik | 1999–2009 | −40 (−55 to −23) | −2.4 (−3.4 to −1.4) |
| Point Petre | 1996–2007 | −29 (−38 to −20) | −1.7 (−2.2 to −1.2) |
| St. Anicet | 1995–2009 | −24 (−29 to −19) | −1.5 (−1.8 to −1.2) |
| St. Andrews | 1996–2007 | −30 (−42 to −20) | −2.2 (−3.1 to −1.5) |
| Kejimkujik | 1996–2010 | −14 (−20 to −6) | −1.0 (−1.4 to −0.5) |
| Alert | 1995–2011 | −14 (−18 to −10) | −0.9 (−1.1 to −0.6) |


| Site | Time Period | [Hg] Trend, ng·L−1·yr−1 | [Hg] Trend, % yr−1 | Time Period (PG 2009) | [Hg] Trend (PG 2009), % yr−1 |
|---|---|---|---|---|---|
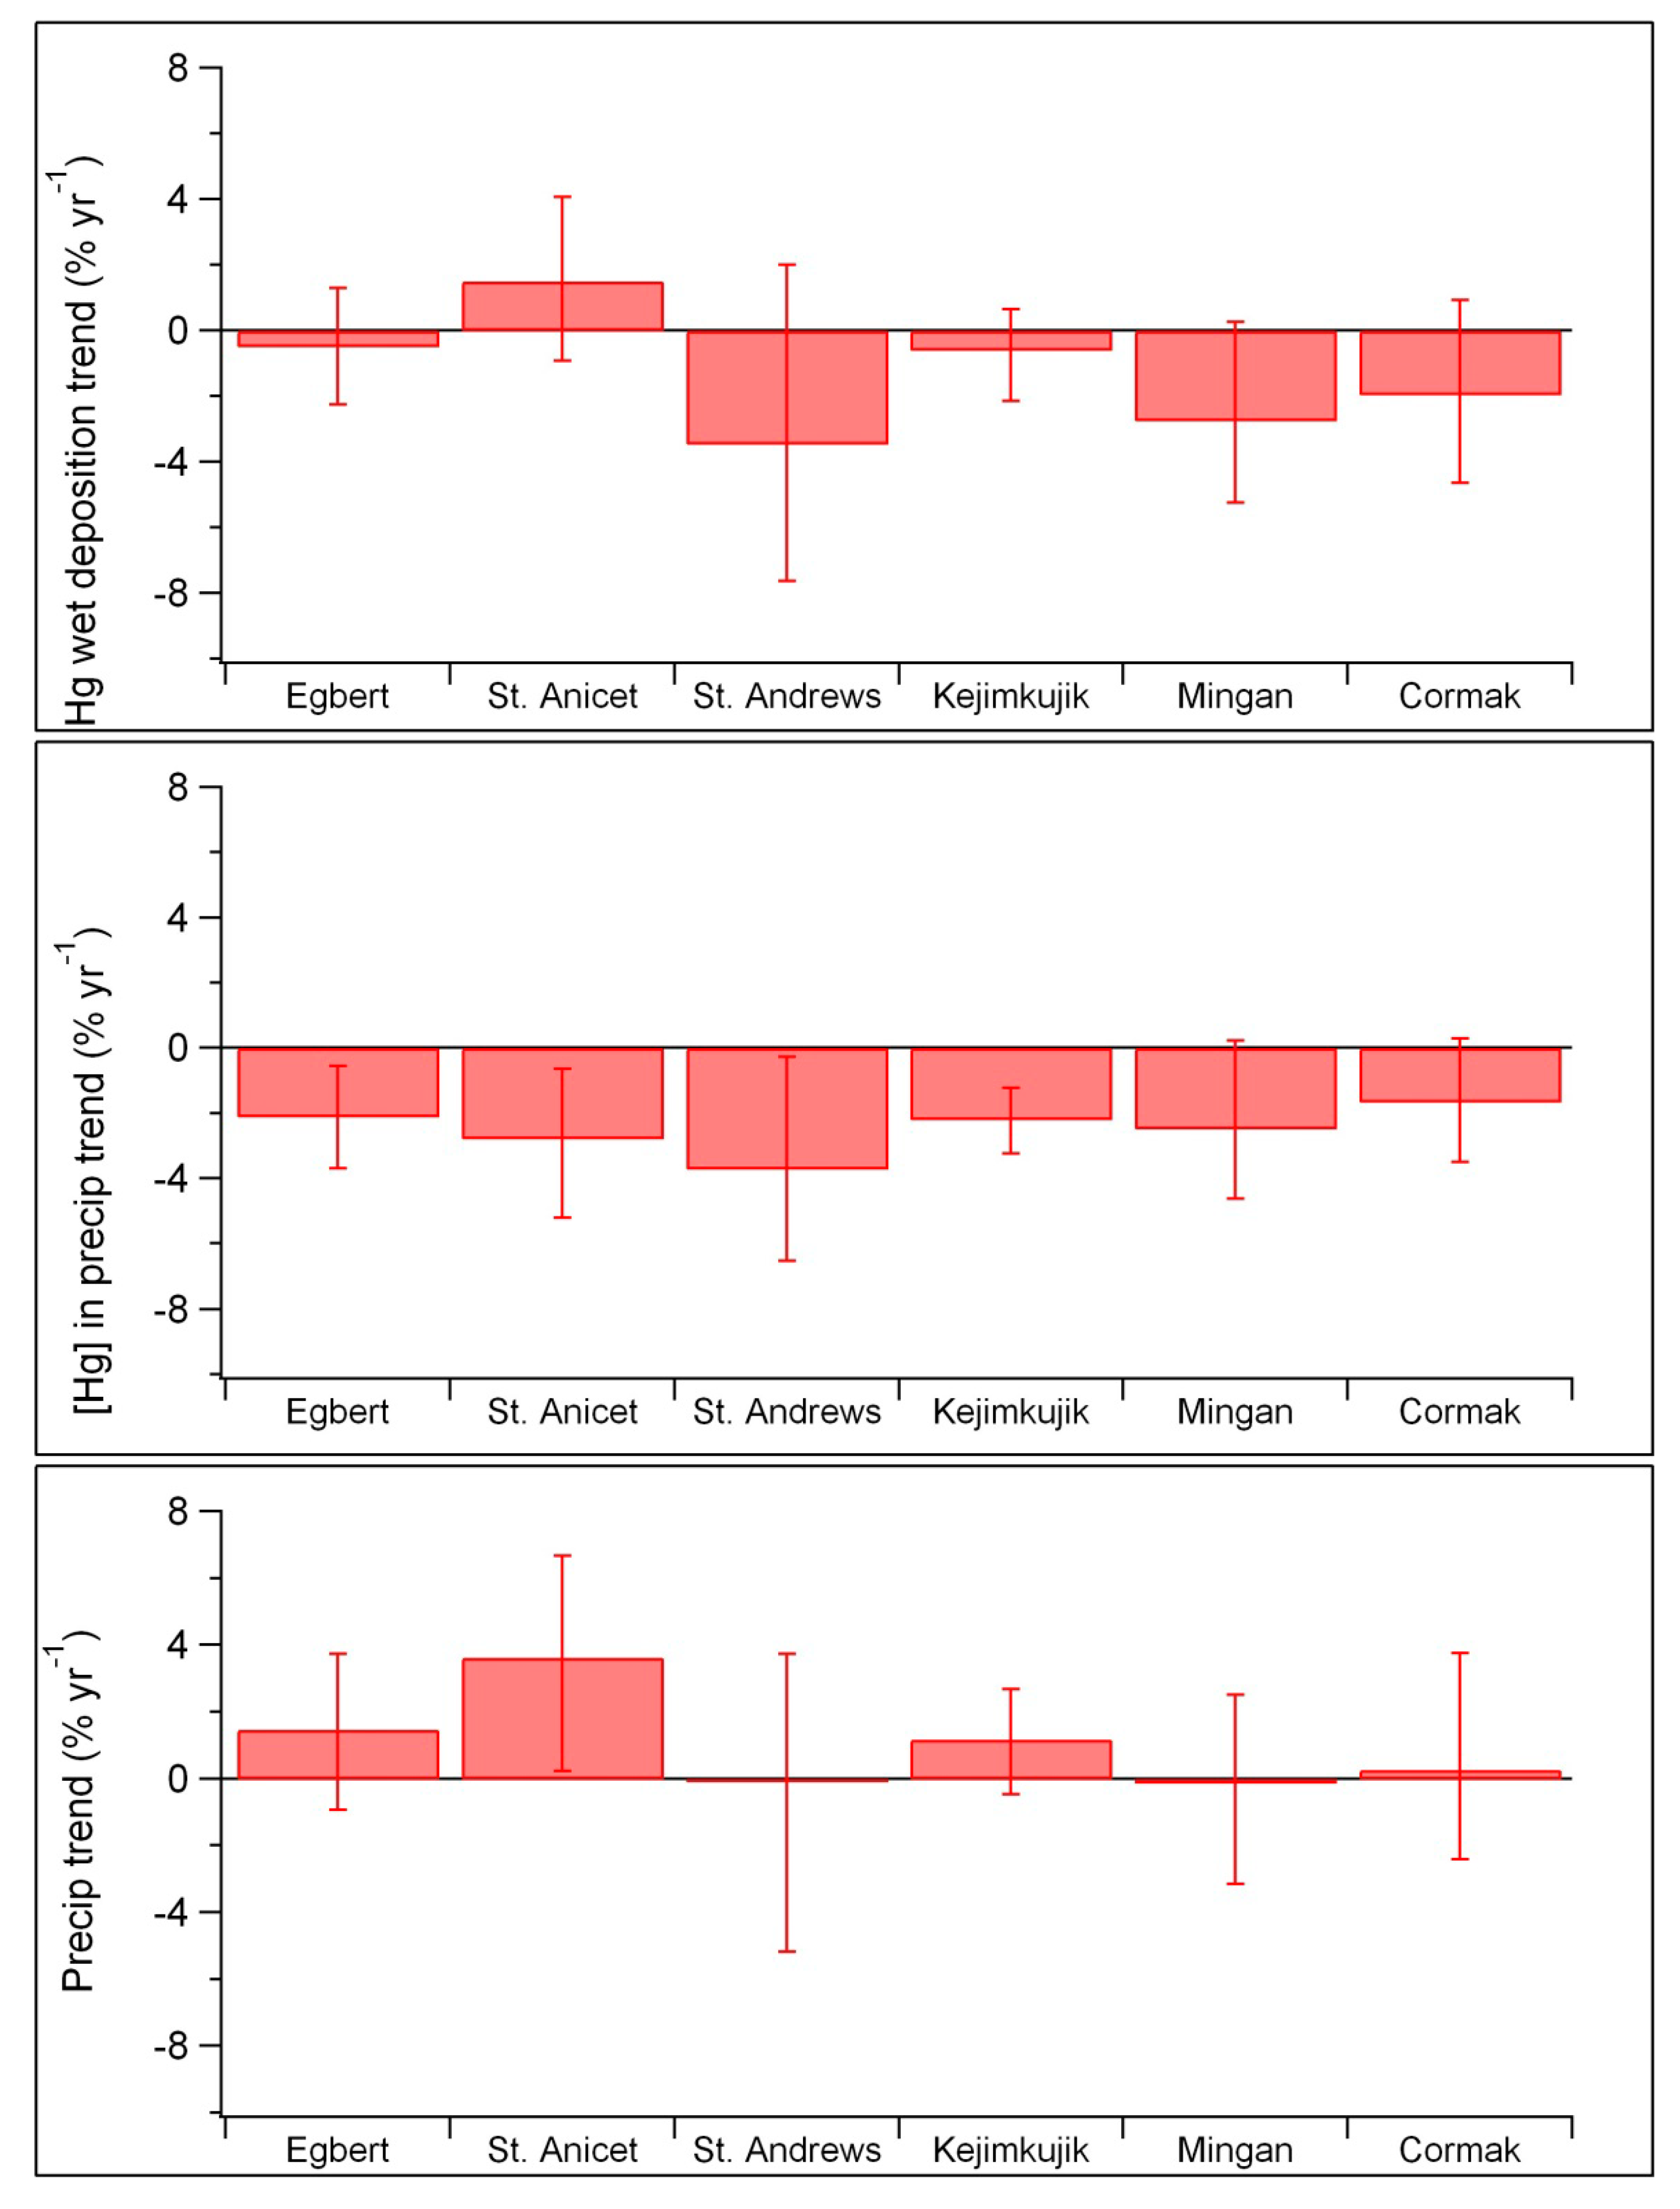
| Egbert | 2000–2010 | −0.18 (−0.31 to −0.05) | −2.1 (−3.7 to −0.6) | 2000–2005 | ns |
| St. Anicet | 1998–2007 | −0.22 (−0.41 to −0.05) | −2.8 (−5.2 to −0.6) | 1998–2005 | −1.5 |
| St. Andrews | 1996–2003 | −0.25 (−0.43 to −0.02) | −3.7 (−6.5 to −0.3) | 1997–2003 | −1.9 ** |
| Kejimkujik | 1996–2010 | −0.12 (−0.17 to −0.06) | −2.2 (−3.3 to −1.2) | 1997–2005 | −2.0 |
| Mingan | 1998–2007 | −0.13 (−0.23 to +0.01) ns | −2.5 (−4.6 to +0.2) ns | 1998–2005 | ns |
| Cormak | 2000–2010 | −0.07 (−0.15 to +0.01) ns | −1.7 (−3.5 to +0.3) ns | 2000–2005 | −4.4 |
3. Methods
3.1. Data Collection
3.2. Data Analysis
4. Conclusions
Acknowledgments
Author Contributions
Conflicts of Interest
References
- Selin, N.E. Global biogeochemical cycling of mercury: A review. Ann. Rev. Environ. Resour. 2009, 34, 43–63. [Google Scholar] [CrossRef]
- Corbitt, E.S.; Jacob, D.J.; Holmes, C.D.; Streets, D.G.; Sunderland, E.M. Global source-receptor relationships for mercury deposition under present-day and 2050 emissions scenarios. Environ. Sci. Technol. 2011, 45, 10477–10484. [Google Scholar] [CrossRef]
- Holmes, C.D.; Jacob, D.J.; Corbitt, E.S.; Mao, J.; Yang, X.; Talbot, R.; Slemr, F. Global atmospheric model for mercury including oxidation by bromine atoms. Atmos. Chem. Phys. 2010, 10, 12037–12057. [Google Scholar] [CrossRef]
- Lindberg, S.; Bullock, R.; Ebinghaus, R.; Engstrom, D.R.; Feng, X.; Fitzgerald, W.F.; Pirrone, N.; Prestbo, E.; Seigneur, C. A synthesis of progress and uncertainties in attributing the sources of mercury in deposition. Ambio 2007, 36, 19–32. [Google Scholar]
- Schroeder, W.H.; Munthe, J. Atmospheric mercury—An overview. Atmos. Environ. 1998, 32, 809–822. [Google Scholar]
- Hynes, A.J.; Donohoue, D.L.; Goodsite, M.E.; Hedgecock, I.M. Our current understanding of major chemical and physical processes affecting mercury dynamics in the atmosphere and at the air-water/terrestrial interfaces. In Mercury Fate and Transport in the Global Atmosphere; Pirrone, N., Mason, R.P., Eds.; Springer: New York, NY, USA, 2009; pp. 427–457. [Google Scholar]
- Cole, A.S.; Steffen, A. Trends in long-term gaseous mercury observations in the Arctic and effects of temperature and other atmospheric conditions. Atmos. Chem. Phys. 2010, 10, 4661–4672. [Google Scholar] [CrossRef]
- Kellerhals, M.; Beauchamp, S.; Belzer, W.; Blanchard, P.; Froude, F.; Harvey, B.; McDonald, K.; Pilote, M.; Poissant, L.; Puckett, K.; et al. Temporal and spatial variability of total gaseous mercury in Canada: Results from the Canadian Atmospheric Mercury Measurement Network (CAMNet). Atmos. Environ. 2003, 37, 1003–1011. [Google Scholar] [CrossRef]
- Temme, C.; Blanchard, P.; Steffen, A.; Beauchamp, S.T.; Poissant, L.; Tordon, R.J.; Weins, B. Trend, seasonal and multivariate analysis study of total gaseous mercury data from the Canadian Atmospheric Mercury Measurement Network (CAMNet). Atmos. Environ. 2007, 41, 5423–5441. [Google Scholar] [CrossRef]
- Poissant, L.; Pilote, M.; Beauvais, C.; Constant, P.; Zhang, H.H. A year of continuous measurements of three atmospheric mercury species (GEM, RGM and Hgp) in southern Quebec, Canada. Atmos. Environ. 2005, 39, 1275–1287. [Google Scholar] [CrossRef]
- Blanchard, P.; Froude, F.A.; Martin, J.B.; Dryfhout-Clark, H.; Woods, J.T. Four years of continuous total gaseous mercury (TGM) measurements at sites in Ontario, Canada. Atmos. Environ. 2002, 36, 3735–3743. [Google Scholar] [CrossRef]
- Kim, K.-H.; Ebinghaus, R.; Schroeder, W.H.; Blanchard, P.; Kock, H.H.; Steffen, A.; Froude, F.A.; Kim, M.-Y.; Hong, S.; Kim, J.-H. Atmospheric mercury concentrations from several observatory sites in the Northern Hemisphere. J. Atmos. Chem. 2005, 50, 1–24. [Google Scholar] [CrossRef]
- Steffen, A.; Schroeder, W.H.; Macdonald, R.; Poissant, L.; Konoplev, A. Mercury in the Arctic atmosphere: an analysis of eight years of measurements of GEM at Alert (Canada) and a comparison with observations at Amderma (Russia) and Kuujjuarapik (Canada). Sci. Total Environ. 2005, 342, 185–198. [Google Scholar] [CrossRef]
- Xu, X.; Akhtar, U.S. Identification of potential regional sources of atmospheric total gaseous mercury in Windsor, Ontario, Canada using hybrid receptor modeling. Atmos. Chem. Phys. 2010, 10, 7073–7083. [Google Scholar]
- Sanei, H.; Outridge, P.M.; Goodarzi, F.; Wang, F.; Armstrong, D.; Warren, K.; Fishback, L. Wet deposition mercury fluxes in the Canadian sub-Arctic and southern Alberta, measured using an automated precipitation collector adapted to cold regions. Atmos. Environ. 2010, 44, 1672–1681. [Google Scholar] [CrossRef]
- Prestbo, E.M.; Gay, D.A. Wet deposition of mercury in the U.S. and Canada, 1996–2005: Results and analysis of the NADP mercury deposition network (MDN). Atmos. Environ. 2009, 43, 4223–4233. [Google Scholar] [CrossRef]
- Mazur, M.; Mintz, R.; Lapalme, M.; Wiens, B.J. Ambient air total gaseous mercury concentrations in the vicinity of coal-fired power plants in Alberta, Canada. Sci. Total Environ. 2009, 408, 373–381. [Google Scholar] [CrossRef]
- Gay, D.A.; Schmeltz, D.; Prestbo, E.; Olson, M.L.; Sharac, T.; Tordon, R. The Atmospheric Mercury Network: measurement and initial examination of an ongoing atmospheric mercury record across North America. Atmos. Chem. Phys. 2013, 13, 11339–11349. [Google Scholar]
- Eckley, C.S.; Parsons, M.T.; Mintz, R.; Lapalme, M.; Mazur, M.; Tordon, R.; Elleman, R.; Graydon, J.A.; Blanchard, P.; St Louis, V.L. Impact of closing Canada's largest point-source of mercury emissions on local atmospheric mercury concentrations. Environ. Sci. Technol. 2013, 47, 10339–10348. [Google Scholar]
- Kirk, J.L.; St. Louis, V.L.; Sharp, M.J. Rapid reduction and reemission of mercury deposited into snow packs during atmospheric mercury depletion events at Churchill, Manitoba, Canada. Environ. Sci. Technol. 2006, 40, 7590–7596. [Google Scholar] [CrossRef]
- Stupple, G.W.; Branfireun, B.A. Canopy mercury accumulation in urban and rural forests in southern Ontario. Environ. Pollut. 2014. in preparation. [Google Scholar]
- Steffen, A.; Bottenheim, J.; Cole, A.; Ebinghaus, R.; Lawson, G.; Leaitch, W.R. Atmospheric mercury speciation and mercury in snow over time at Alert, Canada. Atmos. Chem. Phys. 2014, 14, 2219–2231. [Google Scholar] [CrossRef]
- Steffen, A.; Cole, A.S.; Ariya, P.; Banic, C.; Dastoor, A.; Durnford, D.; Eckley, C.; Graydon, J.A.; Mintz, R.; Pilote, M.; et al. Chapter 4: Atmospheric processes, transport, levels and trends. In Canadian Mercury Science Assessment; Environment Canada: Toronto, ON, Canada, 2014; in press. [Google Scholar]
- Slemr, F.; Brunke, E.; Ebinghaus, R.; Temme, C.; Munthe, J.; Wängberg, I.; Schroeder, W.H.; Steffen, A.; Berg, T. Worldwide trend of atmospheric mercury since 1977. Geophys. Res. Lett. 2003, 30, 23–21. [Google Scholar]
- Slemr, F.; Brunke, E.G.; Ebinghaus, R.; Kuss, J. Worldwide trend of atmospheric mercury since 1995. Atmos. Chem. Phys. 2011, 11, 4779–4787. [Google Scholar] [CrossRef]
- Cole, A.; Steffen, A.; Aspmo Pfaffhuber, K.; Berg, T.; Pilote, M.; Tordon, R.; Hung, H. Ten-year trends of atmospheric mercury in the high Arctic compared to Canadian sub-Arctic and mid-latitude sites. Atmos. Chem. Phys. 2013, 13, 1535–1545. [Google Scholar] [CrossRef] [Green Version]
- Steffen, A.; Douglas, T.; Amyot, M.; Ariya, P.; Aspmo, K.; Berg, T.; Bottenheim, J.; Brooks, S.; Cobbett, F.D.; Dastoor, A.; et al. A synthesis of atmospheric mercury depletion event chemistry in the atmosphere and snow. Atmos. Chem. Phys. 2008, 8, 1445–1482. [Google Scholar] [CrossRef] [Green Version]
- Durnford, D.; Dastoor, A.; Ryzhkov, A.; Poissant, L.; Pilote, M.; Figueras-Nieto, D. How relevant is the deposition of mercury onto snowpacks?—Part 2: A modeling study. Atmos. Chem. Phys. 2012, 12, 9251–9274. [Google Scholar] [CrossRef]
- Fisher, J.A.; Jacob, D.J.; Soerensen, A.L.; Amos, H.M.; Steffen, A.; Sunderland, E.M. Riverine source of Arctic Ocean mercury inferred from atmospheric observations. Nat. Geosci. 2012, 5, 499–504. [Google Scholar] [CrossRef]
- Hirdman, D.; Aspmo, K.; Burkhart, J.F.; Eckhardt, S.; Sodemann, H.; Stohl, A. Transport of mercury in the Arctic atmosphere: Evidence for a springtime net sink and summer-time source. Geophys. Res. Lett. 2009. [Google Scholar] [CrossRef]
- Lalonde, J.D.; Poulain, A.J.; Amyot, M. The role of mercury redox reactions in snow on snow-to-air mercury transfer. Environ. Sci. Technol. 2002, 36, 174–178. [Google Scholar] [CrossRef]
- Lindberg, S.E.; Brooks, S.; Lin, C.-J.; Scott, K.J.; Landis, M.S.; Stevens, R.K.; Goodsite, M.; Richter, A. Dynamic oxidation of gaseous mercury in the Arctic troposphere at polar sunrise. Environ. Sci. Technol. 2002, 36, 1245–1256. [Google Scholar] [CrossRef]
- Huang, J.; Miller, M.B.; Weiss-Penzias, P.; Gustin, M.S. Comparison of gaseous oxidized Hg measured by KCl-coated denuders, and nylon and cation exchange membranes. Environ. Sci. Technol. 2013, 47, 7307–7316. [Google Scholar]
- Lyman, S.N.; Jaffe, D.A.; Gustin, M.S. Release of mercury halides from KCl denuders in the presence of ozone. Atmos. Chem. Phys. 2010, 10, 8197–8204. [Google Scholar] [CrossRef] [Green Version]
- Graydon, J.A.; St. Louis, V.; Hintlemann, H.; Lindberg, S.E.; Sandilands, K.A.; Rudd, J.W.M.; Kelly, C.A.; Hall, B.; Mowat, L.D. Long-term wet and dry deposition of total and methyl mercury in the remote boreal ecoregion of Canada. Environ. Sci. Technol. 2008, 42, 8345–8351. [Google Scholar] [CrossRef]
- Poulain, A.J.; Garcia, E.; Amyot, J.D.; Campbell, P.G.C.; Raofie, F.; Ariya, P.A. Biological and chemical redox transformations of mercury in fresh and salt waters of the high Arctic during spring and summer. Environ. Sci. Technol. 2007, 41, 1883–1888. [Google Scholar]
- Poulain, A.J.; Lalonde, J.D.; Amyot, J.D.; Shead, J.A.; Raofie, F.; Ariya, P.A. Redox transformations of mercury in an Arctic snowpack at springtime. Atmos. Environ. 2004, 38, 6763–6774. [Google Scholar] [CrossRef]
- Poissant, L.; Casimir, A. Water-air and soil-air exchange rate of total gaseous mercury measured at background sites. Atmos. Environ. 1998, 32, 883–893. [Google Scholar] [CrossRef]
- Choi, H.-D.; Holsen, T.M.; Hopke, P.K. Atmospheric mercury (Hg) in the Adirondacks: Concentrations and sources. Environ. Sci. Technol. 2008, 42, 5644–5653. [Google Scholar] [CrossRef]
- Nair, U.S.; Wu, Y.; Walters, J.; Jansen, J.; Edgerton, E.S. Diurnal and seasonal variation of mercury species at coastal-suburban, urban, and rural sites in the southeastern United States. Atmos. Environ. 2012, 47, 499–508. [Google Scholar]
- Poissant, L. Total gaseous mercury in Quebec (Canada) in 1998. Sci. Total Environ. 2000, 259, 191–201. [Google Scholar] [CrossRef]
- Liu, B.; Keeler, G.J.; Dvonch, J.T.; Barres, J.A.; Lynam, M.M.; Markis, F.J.; Morgan, J.T. Temporal variability of mercury speciation in urban air. Atmos. Environ. 2007, 41, 1911–1923. [Google Scholar] [CrossRef]
- Engle, M.A.; Tate, M.T.; Krabbenhoft, D.P.; Schauer, J.J.; Kolker, A.; Shanley, J.B.; Bothner, M.H. Comparison of atmospheric mercury speciation and deposition at nine sites across central and eastern North America. J. Geophys. Res.: Atmos. 2010. [Google Scholar] [CrossRef]
- Engle, M.A.; Tate, M.T.; Krabbenhoft, D.P.; Kolker, A.; Olson, M.L.; Edgerton, E.S.; DeWild, J.F.; McPherson, A.K. Characterization and cycling of atmospheric mercury along the central US Gulf Coast. Appl. Geochem. 2008, 23, 419–437. [Google Scholar] [CrossRef]
- Fain, X.; Obrist, D.; Hallar, A.G.; McCubbin, I.; Rahn, T. High levels of reactive gaseous mercury observed at a high elevation research laboratory in the Rocky Mountains. Atmos. Chem. Phys. 2009, 9, 8049–8060. [Google Scholar] [CrossRef]
- Swartzendruber, P.C.; Jaffe, D.A.; Prestbo, E.; Weiss-Penzias, P.; Selin, N.E.; Park, R.; Jacob, D.J.; Strode, S.; Jaegle, L. Observations of reactive gaseous mercury in the free troposphere at the Mount Bachelor Observatory. J. Geophys. Res.: Atmos. 2006. [Google Scholar] [CrossRef]
- Poissant, L.; Pilote, M.; Xu, X.; Zhang, H.; Beauvais, C. Atmospheric mercury speciation and deposition in the Bay St. Francois wetlands. J. Geophys. Res.: Atmos. 2004. [Google Scholar] [CrossRef]
- Bottenheim, J.; Chan, H.M. A trajectory study into the origin of spring time Arctic boundary layer ozone depletion. J. Geophys. Res.: Atmos. 2006. [Google Scholar] [CrossRef]
- Weiss-Penzias, P.; Gustin, M.S.; Lyman, S.N. Observations of speciated atmospheric mercury at three sites in Nevada: Evidence for a free tropospheric source of reactive gaseous mercury. J. Geophys. Res.: Atmos. 2009. [Google Scholar] [CrossRef]
- Iverfeldt, A. Occurrence and turnover of atmospheric mercury over the Nordic countries. Water Air Soil Pollut. 1991, 56, 251–265. [Google Scholar] [CrossRef]
- Kock, H.H.; Bieber, E.; Ebinghaus, R.; Spain, T.G.; Thees, B. Comparison of long-term trends and seasonal variations of atmospheric mercury concentrations at the two European coastal monitoring stations Mace Head, Ireland, and Zingst, Germany. Atmos. Environ. 2005, 39, 7549–7556. [Google Scholar] [CrossRef]
- Slemr, F.; Schell, H.E. Trends in atmospheric mercury concentrations at the summit of the Wank Mountain, southern Germany. Atmos. Environ. 1998, 32, 845–853. [Google Scholar] [CrossRef]
- Corbett-Hains, H.; Walters, N.E.; Van Heyst, B.J. Evaluating the effects of sub-zero temperature cycling on mercury flux from soils. Atmos. Environ. 2012, 63, 102–108. [Google Scholar]
- Briggs, C.; Gustin, M.S. Building upon the conceptual model for soil mercury flux: Evidence of a link between moisture evaporation and Hg evasion. Water Air Soil Pollut. 2013, 224, 1–13. [Google Scholar]
- Gustin, M.S.; Stamenkovic, J. Effect of watering and soil moisture on mercury emissions from soils. Biogeochemistry 2005, 76, 215–232. [Google Scholar] [CrossRef]
- Lin, C.J.; Gustin, M.S.; Singhasuk, P.; Eckley, C.; Miller, M. Empirical models for estimating mercury flux from soils. Environ. Sci. Technol. 2010, 44, 8522–8528. [Google Scholar] [CrossRef]
- Song, X.; Van Heyst, B. Volatilization of mercury from soils in response to simulated precipitation. Atmos. Environ. 2005, 39, 7494–7505. [Google Scholar] [CrossRef]
- Zhang, L.; Wright, L.P.; Blanchard, P. A review of current knowledge concerning dry deposition of atmospheric mercury. Atmos. Environ. 2009, 43, 5853–5864. [Google Scholar]
- Baker, K.R.; Bash, J.O. Regional scale photochemical model evaluation of total mercury wet deposition and speciated ambient mercury. Atmos. Environ. 2012, 49, 151–162. [Google Scholar] [CrossRef]
- Amos, H.M.; Jacob, D.J.; Holmes, C.D.; Fisher, J.D.; Wang, Q.; Corbitt, E.S.; Galarneau, E.; Rutter, A.P.; Gustin, M.S.; Steffen, A.; et al. Gas-particle partitioning of atmospheric Hg(II) and its effect on global mercury deposition. Atmos. Chem. Phys. 2012, 12, 591–603. [Google Scholar] [CrossRef]
- Fain, X.; Ferrari, C.P.; Dommergue, A.; Albert, M.R.; Battle, M.; Severinhaus, J.; Arnaud, L.; Barnola, J.-M.; Cairns, W.; Barbante, C.; et al. Polar firn air reveals large-scale impact of anthropogenic mercury emissions during the 1970s. Proc. Natl. Acad. Sci. USA 2009, 106, 16114–16119. [Google Scholar]
- Zhang, Y.; Jaeglé, L. Decreases in mercury wet deposition over the United States during 2004–2010: Roles of domestic and global background emission reductions. Atmosphere 2013, 4, 113–131. [Google Scholar] [CrossRef]
- Ebinghaus, R.; Jennings, S.G.; Kock, H.H.; Derwant, R.G.; Manning, A.J.; Spain, T.G. Decreasing trends in total gaseous mercury in baseline air at Mace Head, Ireland from 1996–2009. Atmos. Environ. 2011, 159, 1577–1583. [Google Scholar]
- Durnford, D.; Dastoor, A.; Figueras-Nieto, D.; Ryjkov, A. Long range transport of mercury to the Arctic and across Canada. Atmos. Chem. Phys. 2010, 10, 6063–6086. [Google Scholar] [CrossRef]
- Strode, S.A.; Jaegle, L.; Jaffe, D.A.; Swartzendruber, P.C.; Selin, N.E.; Holmes, C.D.; Yantosca, R.M. Trans-Pacific transport of mercury. J. Geophys. Res.: Atmos. 2008. [Google Scholar] [CrossRef]
- Streets, D.G.; Devane, M.K.; Lu, Z.; Sunderland, E.M.; Jacob, D.J. All-time releases of mercury to the atmosphere from human activities. Environ. Sci. Technol. 2011, 45, 10485–10491. [Google Scholar] [CrossRef]
- Li, C.; Cornett, J.; Willie, S.; Lam, J. Mercury in Arctic air: The long-term trend. Sci. Total Environ. 2009, 407, 2756–2759. [Google Scholar] [CrossRef]
- Soerensen, A.L.; Jacob, D.J.; Streets, D.G.; Witt, M.L.I.; Ebinghaus, R.; Mason, R.P.; Andersson, M.; Sunderland, E.M. Multi-decadal decline of mercury in the North Atlantic atmosphere explained by changing subsurface seawater concentrations. Geophys. Res. Lett. 2012. [Google Scholar] [CrossRef]
- Poissant, L. Field observation of total gaseous mercury behaviour: Interactions with ozone concentration and water vapour mixing ratio in air at a rural site. Water Air Soil Pollut. 1997, 97, 341–353. [Google Scholar]
- Steffen, A.; Scherz, T.; Olson, M.L.; Gay, D.A.; Blanchard, P. A comparison of data quality control protocols for atmospheric mercury speciation measurements. J. Environ. Monit. 2012, 14, 752–765. [Google Scholar] [CrossRef]
- Slemr, F.; Ebinghaus, R.; Brenninkmeijer, M.; Hermann, M.; Kock, H.H.; Martinsson, B.G.; Schuck, T.; Sprung, D.; Van Velthoven, P.; Zahn, A.; et al. Gaseous mercury distribution in the upper troposphere and lower stratosphere observed onboard the CARIBIC passenger aircraft. Atmos. Chem. Phys. 2009, 9, 1957–1969. [Google Scholar]
- Temme, C.; Einax, J.W.; Ebinghaus, R.; Schroeder, W.H. Measurements of atmospheric mercury species at a coastal site in the Antarctic and over the South Atlantic Ocean during polar summer. Environ. Sci. Technol. 2003, 37, 22–31. [Google Scholar]
- Landis, M.; Stevens, R.K.; Schaedlich, F.; Prestbo, E.M. Development and characterization of an annular denuder methodology for the measurement of divalent inorganic reactive gaseous mercury in ambient air. Environ. Sci. Technol. 2002, 36, 3000–3009. [Google Scholar] [CrossRef]
- The Canadian National Atmospheric Chemistry (NAtChem) Database and Analysis System. Available online: http://www.ec.gc.ca/natchem/ (accessed on 29 August 2014).
- Gilbert, R.O. Statistical Methods for Environmental Pollution Monitoring; Van Nostrand Reinhold Company: New York, NY, USA, 1987. [Google Scholar]
- van Belle, G.; Hughes, J.P. Nonparametric tests for trend in water quality. Water Resour. Res. 1984, 20, 127–136. [Google Scholar] [CrossRef]
- Minamata Convention on Mercury. Available online: http://www.mercuryconvention.org/Convention/tabid/3426/Default.aspx (accessed on 27 June 2014).
© 2014 by the authors; licensee MDPI, Basel, Switzerland. This article is an open access article distributed under the terms and conditions of the Creative Commons Attribution license (http://creativecommons.org/licenses/by/3.0/).
Share and Cite
Cole, A.S.; Steffen, A.; Eckley, C.S.; Narayan, J.; Pilote, M.; Tordon, R.; Graydon, J.A.; St. Louis, V.L.; Xu, X.; Branfireun, B.A. A Survey of Mercury in Air and Precipitation across Canada: Patterns and Trends. Atmosphere 2014, 5, 635-668. https://doi.org/10.3390/atmos5030635
Cole AS, Steffen A, Eckley CS, Narayan J, Pilote M, Tordon R, Graydon JA, St. Louis VL, Xu X, Branfireun BA. A Survey of Mercury in Air and Precipitation across Canada: Patterns and Trends. Atmosphere. 2014; 5(3):635-668. https://doi.org/10.3390/atmos5030635
Chicago/Turabian StyleCole, Amanda S., Alexandra Steffen, Chris S. Eckley, Julie Narayan, Martin Pilote, Rob Tordon, Jennifer A. Graydon, Vincent L. St. Louis, Xiaohong Xu, and Brian A. Branfireun. 2014. "A Survey of Mercury in Air and Precipitation across Canada: Patterns and Trends" Atmosphere 5, no. 3: 635-668. https://doi.org/10.3390/atmos5030635
APA StyleCole, A. S., Steffen, A., Eckley, C. S., Narayan, J., Pilote, M., Tordon, R., Graydon, J. A., St. Louis, V. L., Xu, X., & Branfireun, B. A. (2014). A Survey of Mercury in Air and Precipitation across Canada: Patterns and Trends. Atmosphere, 5(3), 635-668. https://doi.org/10.3390/atmos5030635