Article

Aerosol Optical Properties over Beijing during the World Athletics Championships and Victory Day Military Parade in August and September 2015

1
Collaborative Innovation Center on Forecast and Evaluation of Meteorological Disasters and Key Laboratory for Aerosol-Cloud-Precipitation of China Meteorological Administration, Nanjing University of Information Science & Technology, Nanjing 210044, China
2
Institute of Atmospheric Composition and State Key Laboratory of Severe Weather (LASW), Chinese Academy of Meteorological Sciences, China Meteorological Administration (CMA), Beijing 100081, China
3
Institute of Atmospheric Physics (IAP), Chinese Academy of Sciences, Beijing 100029, China
4
College of Atmospheric Science, Chengdu University of Information Technology, Chengdu 610225, China
5
National Meteorological Center, CMA, Beijing 100081, China
6
Hangzhou Meteorological Bureau, Hangzhou 310051, China
*
Author to whom correspondence should be addressed.
Atmosphere 2016, 7(3), 47; https://doi.org/10.3390/atmos7030047
Submission received: 5 January 2016 / Revised: 11 March 2016 / Accepted: 15 March 2016 / Published: 19 March 2016
(This article belongs to the Special Issue Atmospheric Aerosols and Their Radiative Effects)

Abstract

:
A special period in Beijing from 6 August to 17 September 2015, during which the World Athletics Championships and Victory Day military parade took place, and which involved measures to restrict traffic and reduce factory emissions, was selected to analyze the aerosol optical properties and the impact of meteorological conditions on pollution levels. The study was based on AERONET observational and retrieval data, particulate matter measurements (TEOM 1405), meteorological data, and then the HYSPLIT model was used to analyze the pollution sources. The study period was divided into three sub-periods according to the different stages of implementation of the control measures, and the main conclusions can be summarized as follows. During the period in which the restrictive measures were applied, the air quality improved significantly, with the average value of the AOD being 0.34 ± 0.20, about 69% less than before. Meanwhile, the average Ångström exponent was about 9.5% higher than before, with an average value of 1.38 ± 0.25, indicating that the main pollutants were fine particles. Single scattering albedo decreased as wavelength increased, being higher than in the other two stages (mean value of 0.944 ± 0.045). This showed that the strong scattering capacity and absorption aerosol optical depth was at its lowest, at about 0.008 ± 0.009. The peaks of aerosol volume concentration in the fine and coarse mode were significantly reduced. Meteorological conditions also had a certain effect on the aerosol optical properties, with the blowing of clean and dry wind and the occurrence of precipitation contributing to the overall improvement in air quality.

1. Introduction

Aerosol particles play an important role in global and regional climate because particulate matter (PM) can scatter or absorb solar radiation, depending on the particles’ composition, size and spatio-temporal distribution [1]. Furthermore, they can indirectly influence cloud physics, e.g. the lifetime of clouds, their albedo, and precipitation, and they can cause environmental and public health problems [2]. Despite recent progress in modeling [3] and observation techniques, including passive [2,4] and active remote sensing [5,6], in-situ measurements [7] and combinations of these [8], aerosols remain one of the largest sources of uncertainty in current assessments and predictions of global climate change [9,10]. One of the main reasons is the large temporal and spatial variability—this is particularly true for regional air quality studies.
With its rapid economic development in the past three decades, China has experienced obvious changes, characterized by expanding industrialization and urbanization, explosive growth in vehicle numbers, and intense human activity. These changes have resulted in high aerosol particle loading levels [10,11,12] and reductions in visibility [13,14], solar radiation [15] and air quality [16], especially in areas of eastern China such as the Jing-Jin-Ji (Beijing, Tianjin and Hebei) region [17]. Studying the optical properties of aerosols is a prerequisite for furthering our understanding of atmospheric pollution. However, the absorption and scattering properties of aerosols of different types and different particle sizes vary considerably at different wavelengths [18,19,20,21,22], and the changes in aerosol optical properties in different regions are also very complex.
At present, most research into aerosol optical properties focuses mainly on the aerosol optical depth (AOD), Ångström exponent (AE, α), single scattering albedo (SSA), and complex refractive index [23,24,25]. In recent years, a number of studies on aerosol optical properties over the Beijing region have been conducted. Che et al. analyzed the data from seven stations located in the North China Plain in 2013 [26]. They determined that the AOD at 500 nm (AOD500nm) during non-pollution periods at all these stations was lower than 0.30 and increased significantly to greater than 1.00 as pollution events developed. The AOD500nm averages increased from north to south during both polluted and non-polluted periods at the three urban sites in Beijing. Eck et al. [27] analyzed the aerosol optical properties of mixed coarse and fine particles in Beijing, and reported that the AOD reached its maximum in June with an average value of 1.3, whereas winter featured lower values (0.45~0.55).
Beijing held the 15th World Athletics Championships during 22–30 August 2015, and then a Victory Day military parade took place shortly afterwards on 3 September 2015. A number of pollution control measures were taken to ensure the smooth running of these two major events. Specifically, from 20 August to 3 September, cars on the capital’s roads had to strictly observe an “odd-even” traffic restriction policy, not only in Beijing, but also in Tianjin, Hebei, Shanxi, Inner Mongolia, Shandong and Henan as shown in Figure 1. Unified implementation of interim measures to strengthen the reduction of emissions took place with the aim of reducing major pollutant emissions by more than 30% during this period based on the government’s comprehensive consideration of the environment and economy.
The purpose of the present study was to investigate the aerosol optical properties in Beijing during the period of the World Athletics Championships and Victory Day military parade in August and September 2015, based on comprehensive analysis of ground-based observation data, PM concentrations, and weather conditions. The intention was to improve understanding of the nature of aerosol optical properties during special events/periods in the Beijing region, particularly the contribution of measures to restrict traffic and reduce emissions [28,29,30,31].

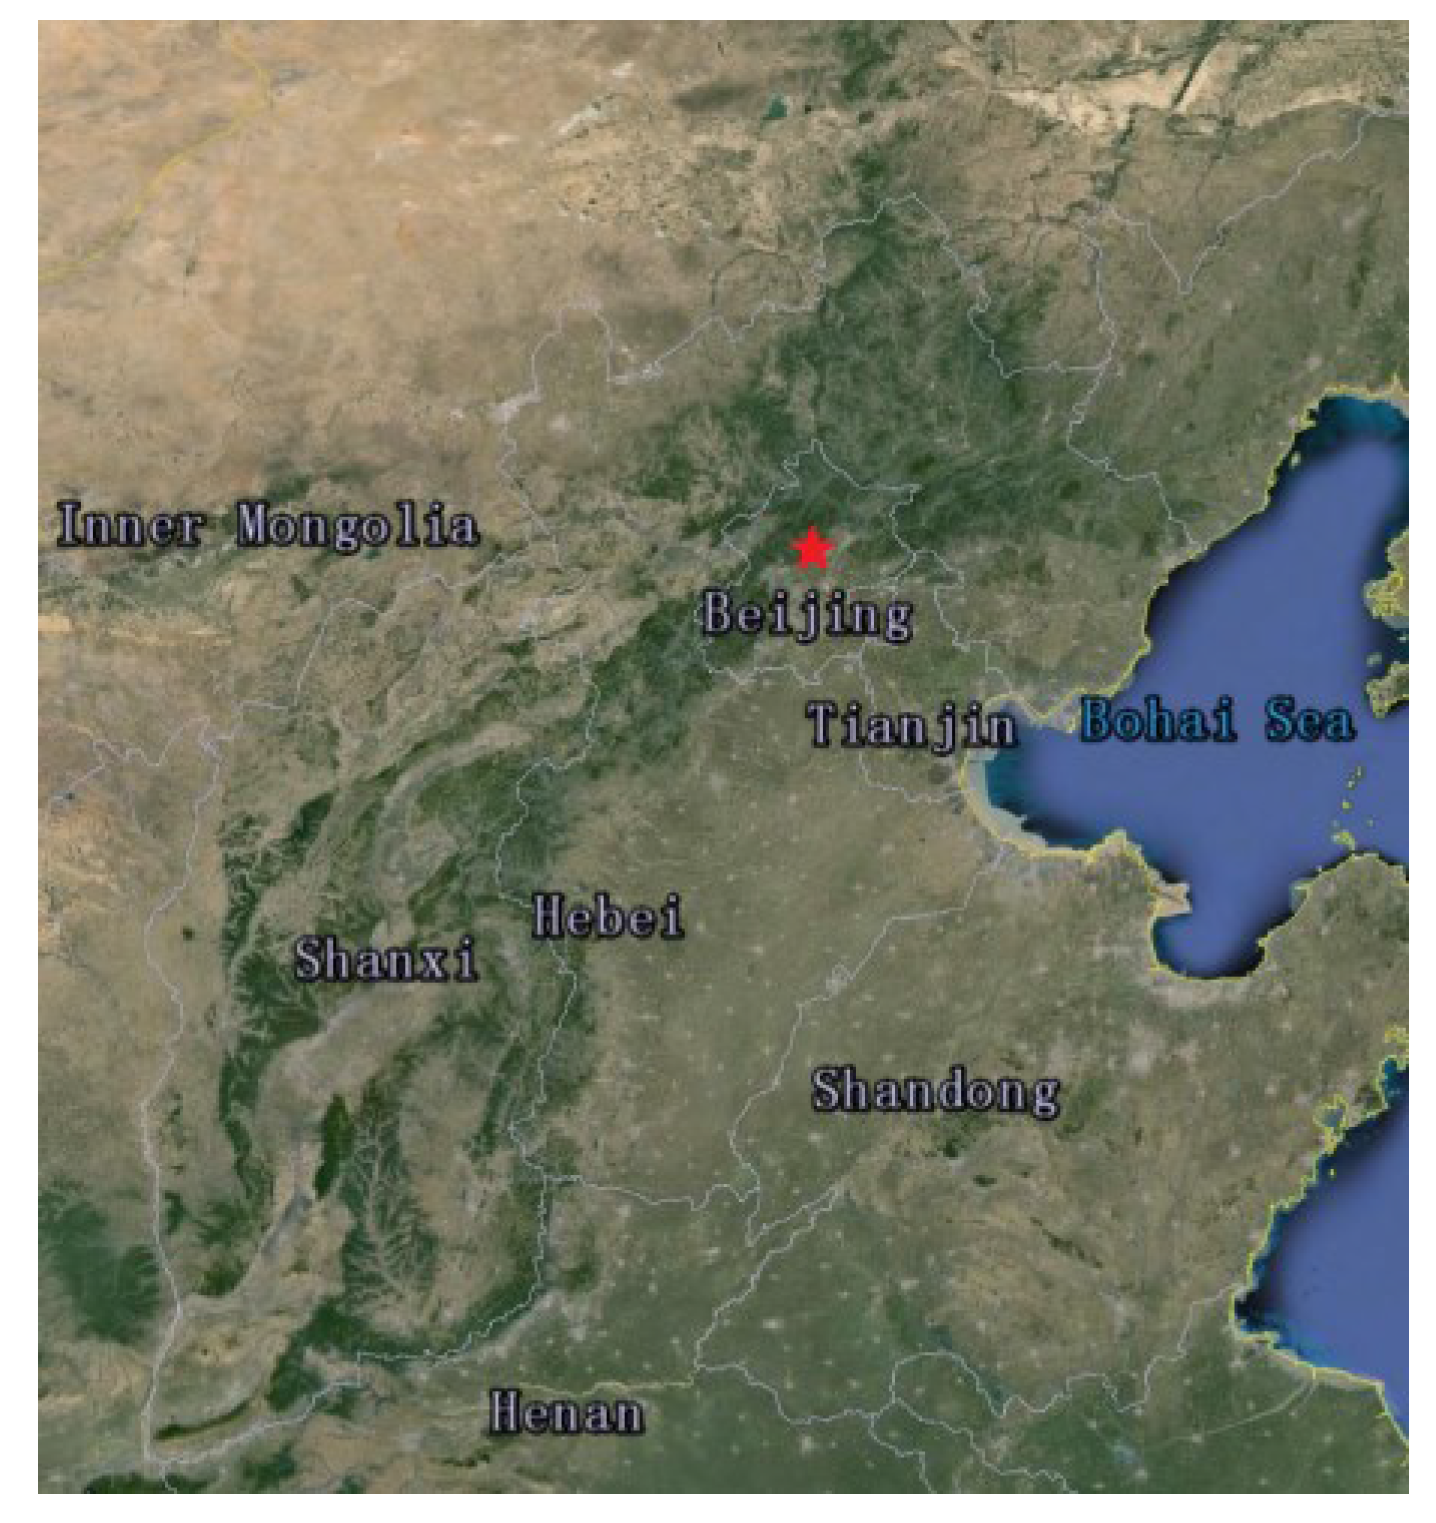
2. Site, Instruments, and Data Method

The observation site is located on the roof of the Chinese Academy of Meteorological Sciences building (39.56°N, 116.19°E, 106 m), where the main pollution source is likely derived from urban activities.
The aerosol optical properties observation data of level 1.5 were obtained from the Aerosol Robotic Network (AERONET), which is a ground-based aerosol monitoring network, established by NASA (http://aeronet.gsfc.nasa.gov/) [26]. The instrument used by AERONET is the automatic Cimel-318 sun and sky scanning radiometer (Cimel Electronique, Paris, France) [26]. The CE-318 has a 1.2° full field-of-view and eight channels: four observation channels at 440 nm, 670 nm, 870 nm and 1020 nm; three 870-nm polarization channels; and a 940-nm water vapor channel. Measurements at 440 nm, 670 nm, 870 nm and 1020 nm are used to retrieve the AOD, and measurements at 940 nm are used to obtain the total precipitable water content in cm [32,33]. The total uncertainty of each optical depth measurement is about 0.01–0.02 [34].
The hourly PM data for Beijing during the study period were measured by TEOM 1405 (accuracy: ±2.0 µg/m3, resolution: 0.1 µg/m3, 1-h average) and these data were obtained from the China National Environmental Monitoring Centre. The surface meteorological data were obtained from the CMA (China Meteorological Administration). Version 4 of the Hybrid Single Particle Lagrangian Integrated Trajectory (HYSPLIT) model [35], which is a professional model for calculating and analyzing the transport and diffusion of atmospheric pollutants, was used, and the input data were obtained from the NCEP (a comprehensive analysis of observation data set, established by the National Centers for Environmental Prediction and National Center for Atmospheric Research).
This study used the period of 6 August to 17 September 2015, within which three sub-periods were defined: 6–19 August as stage 1 (S1 for short), when there were no restrictive measures; 20 August to 3 September as stage 2 (S2 for short), when the restrictive measures were employed; and 4–17 September as stage 3 (S3 for short), when there were no emission limitations.

3. Results and Analysis

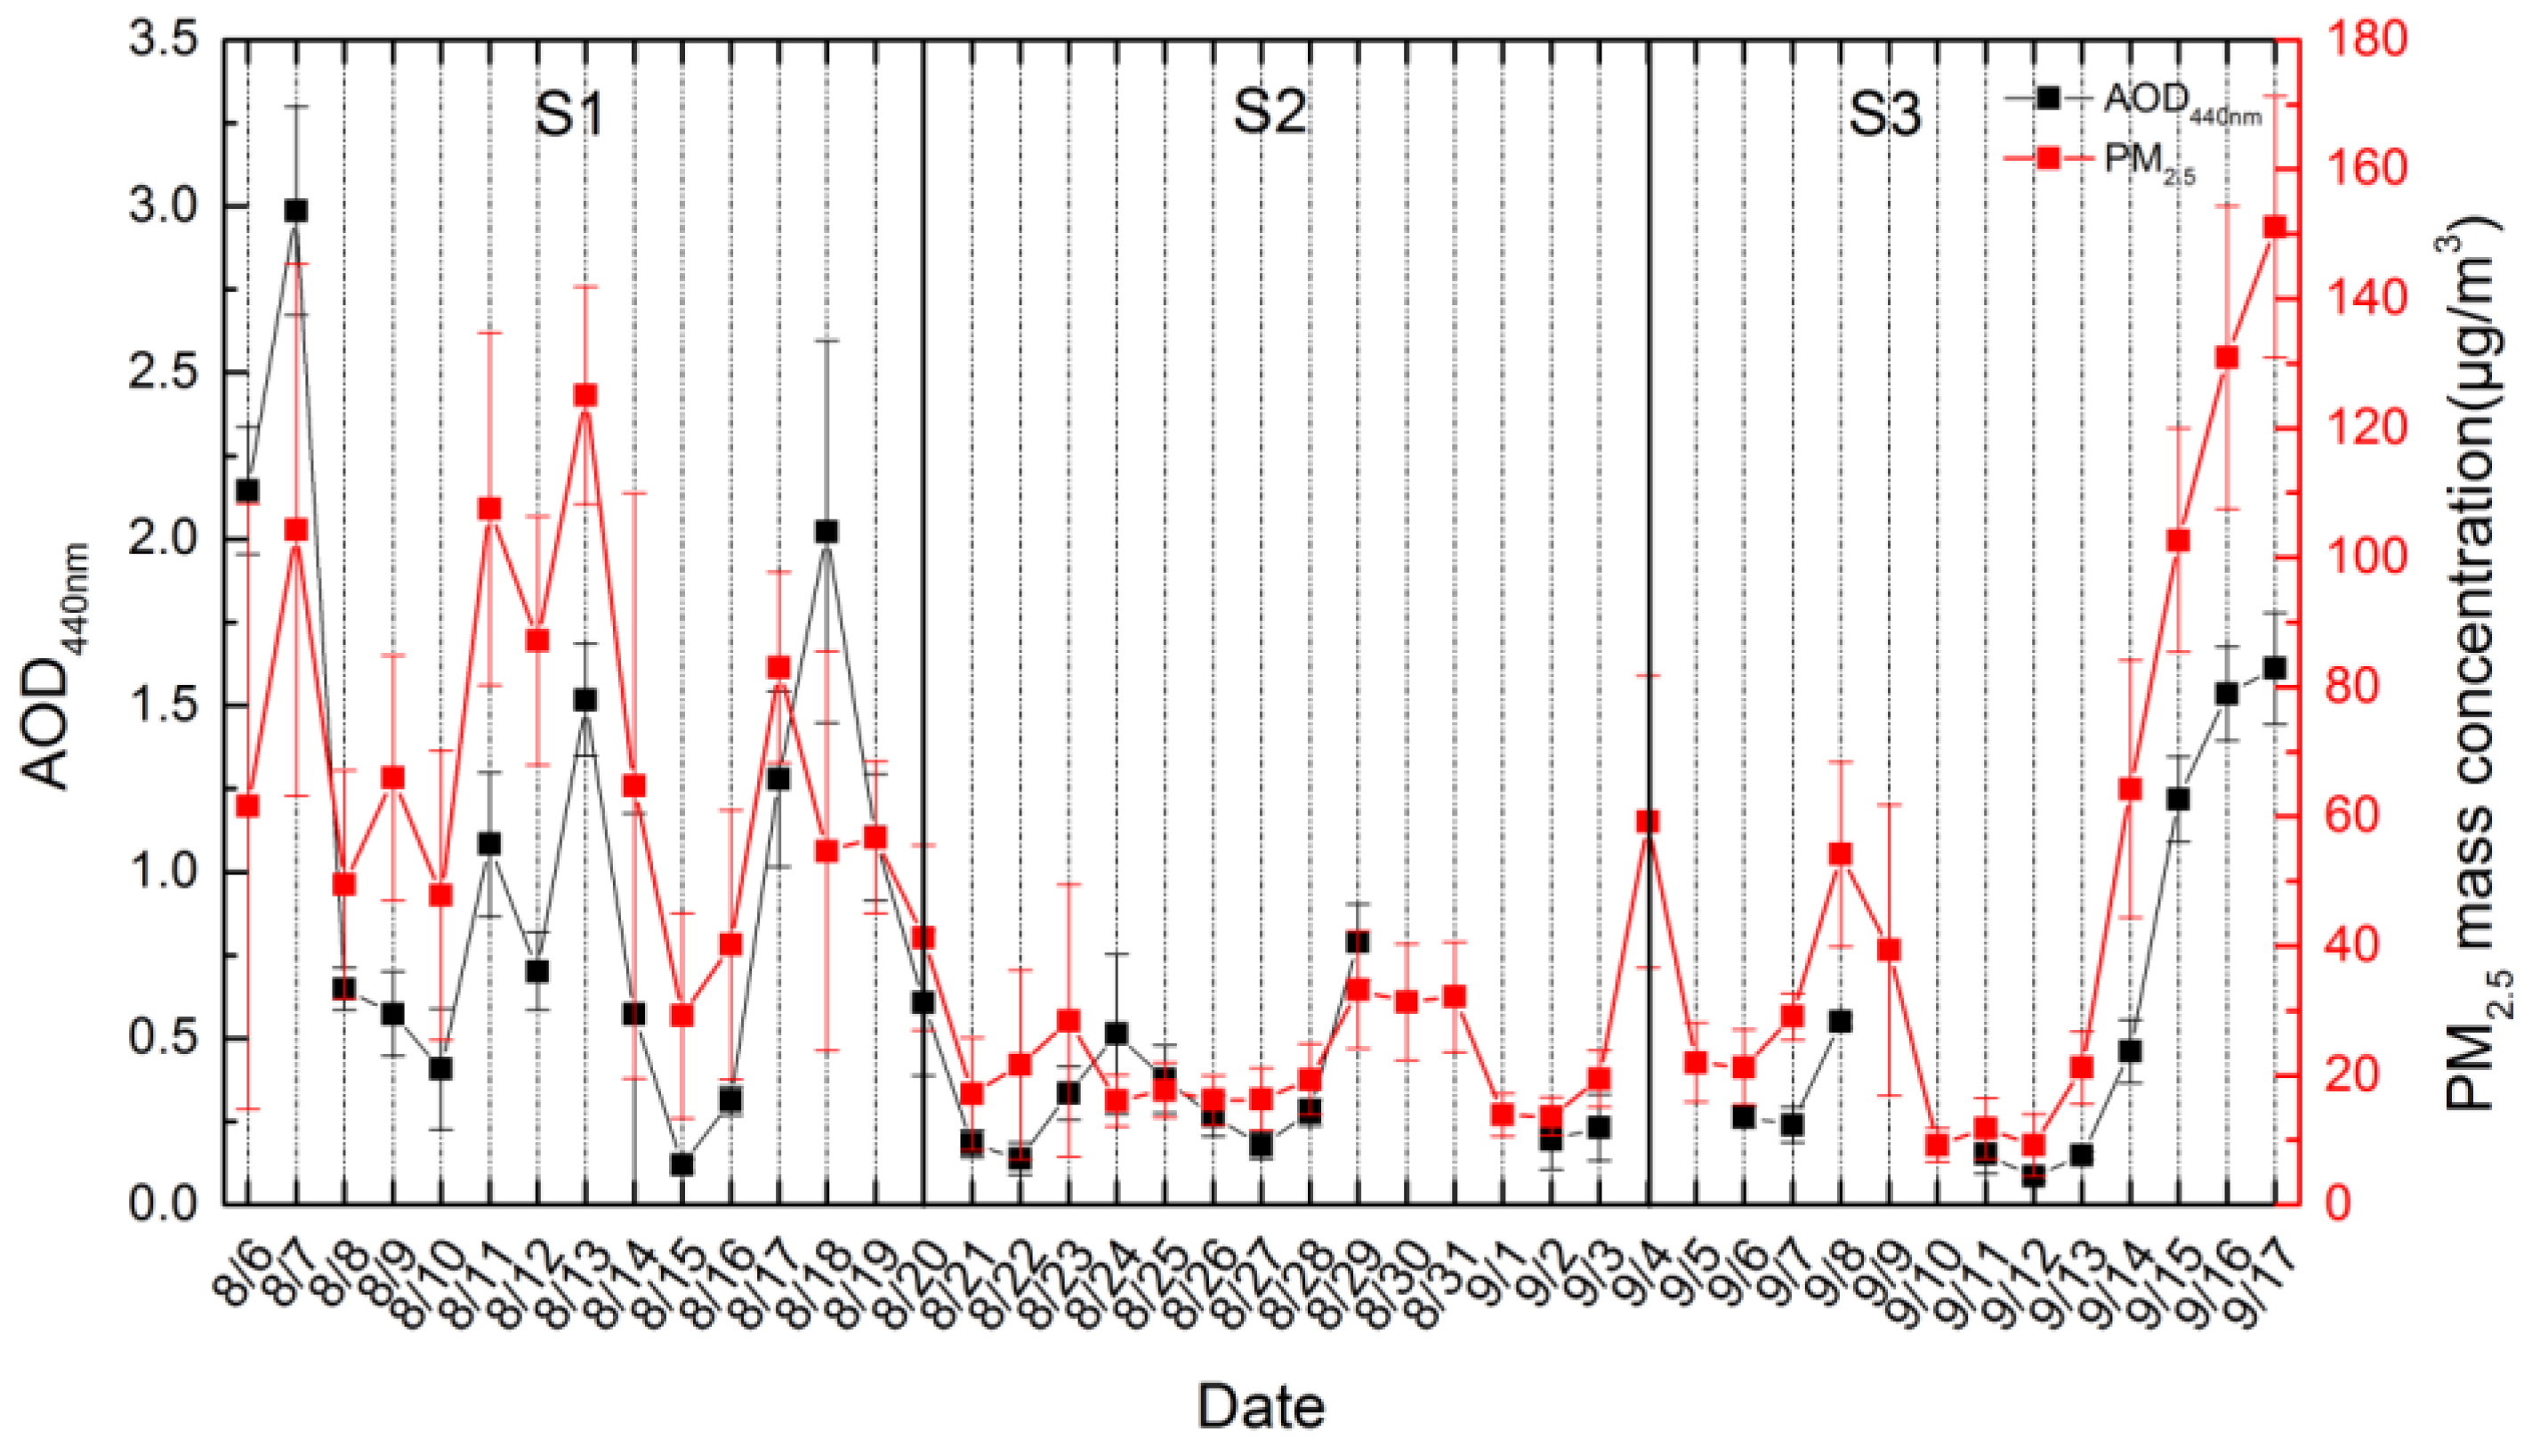
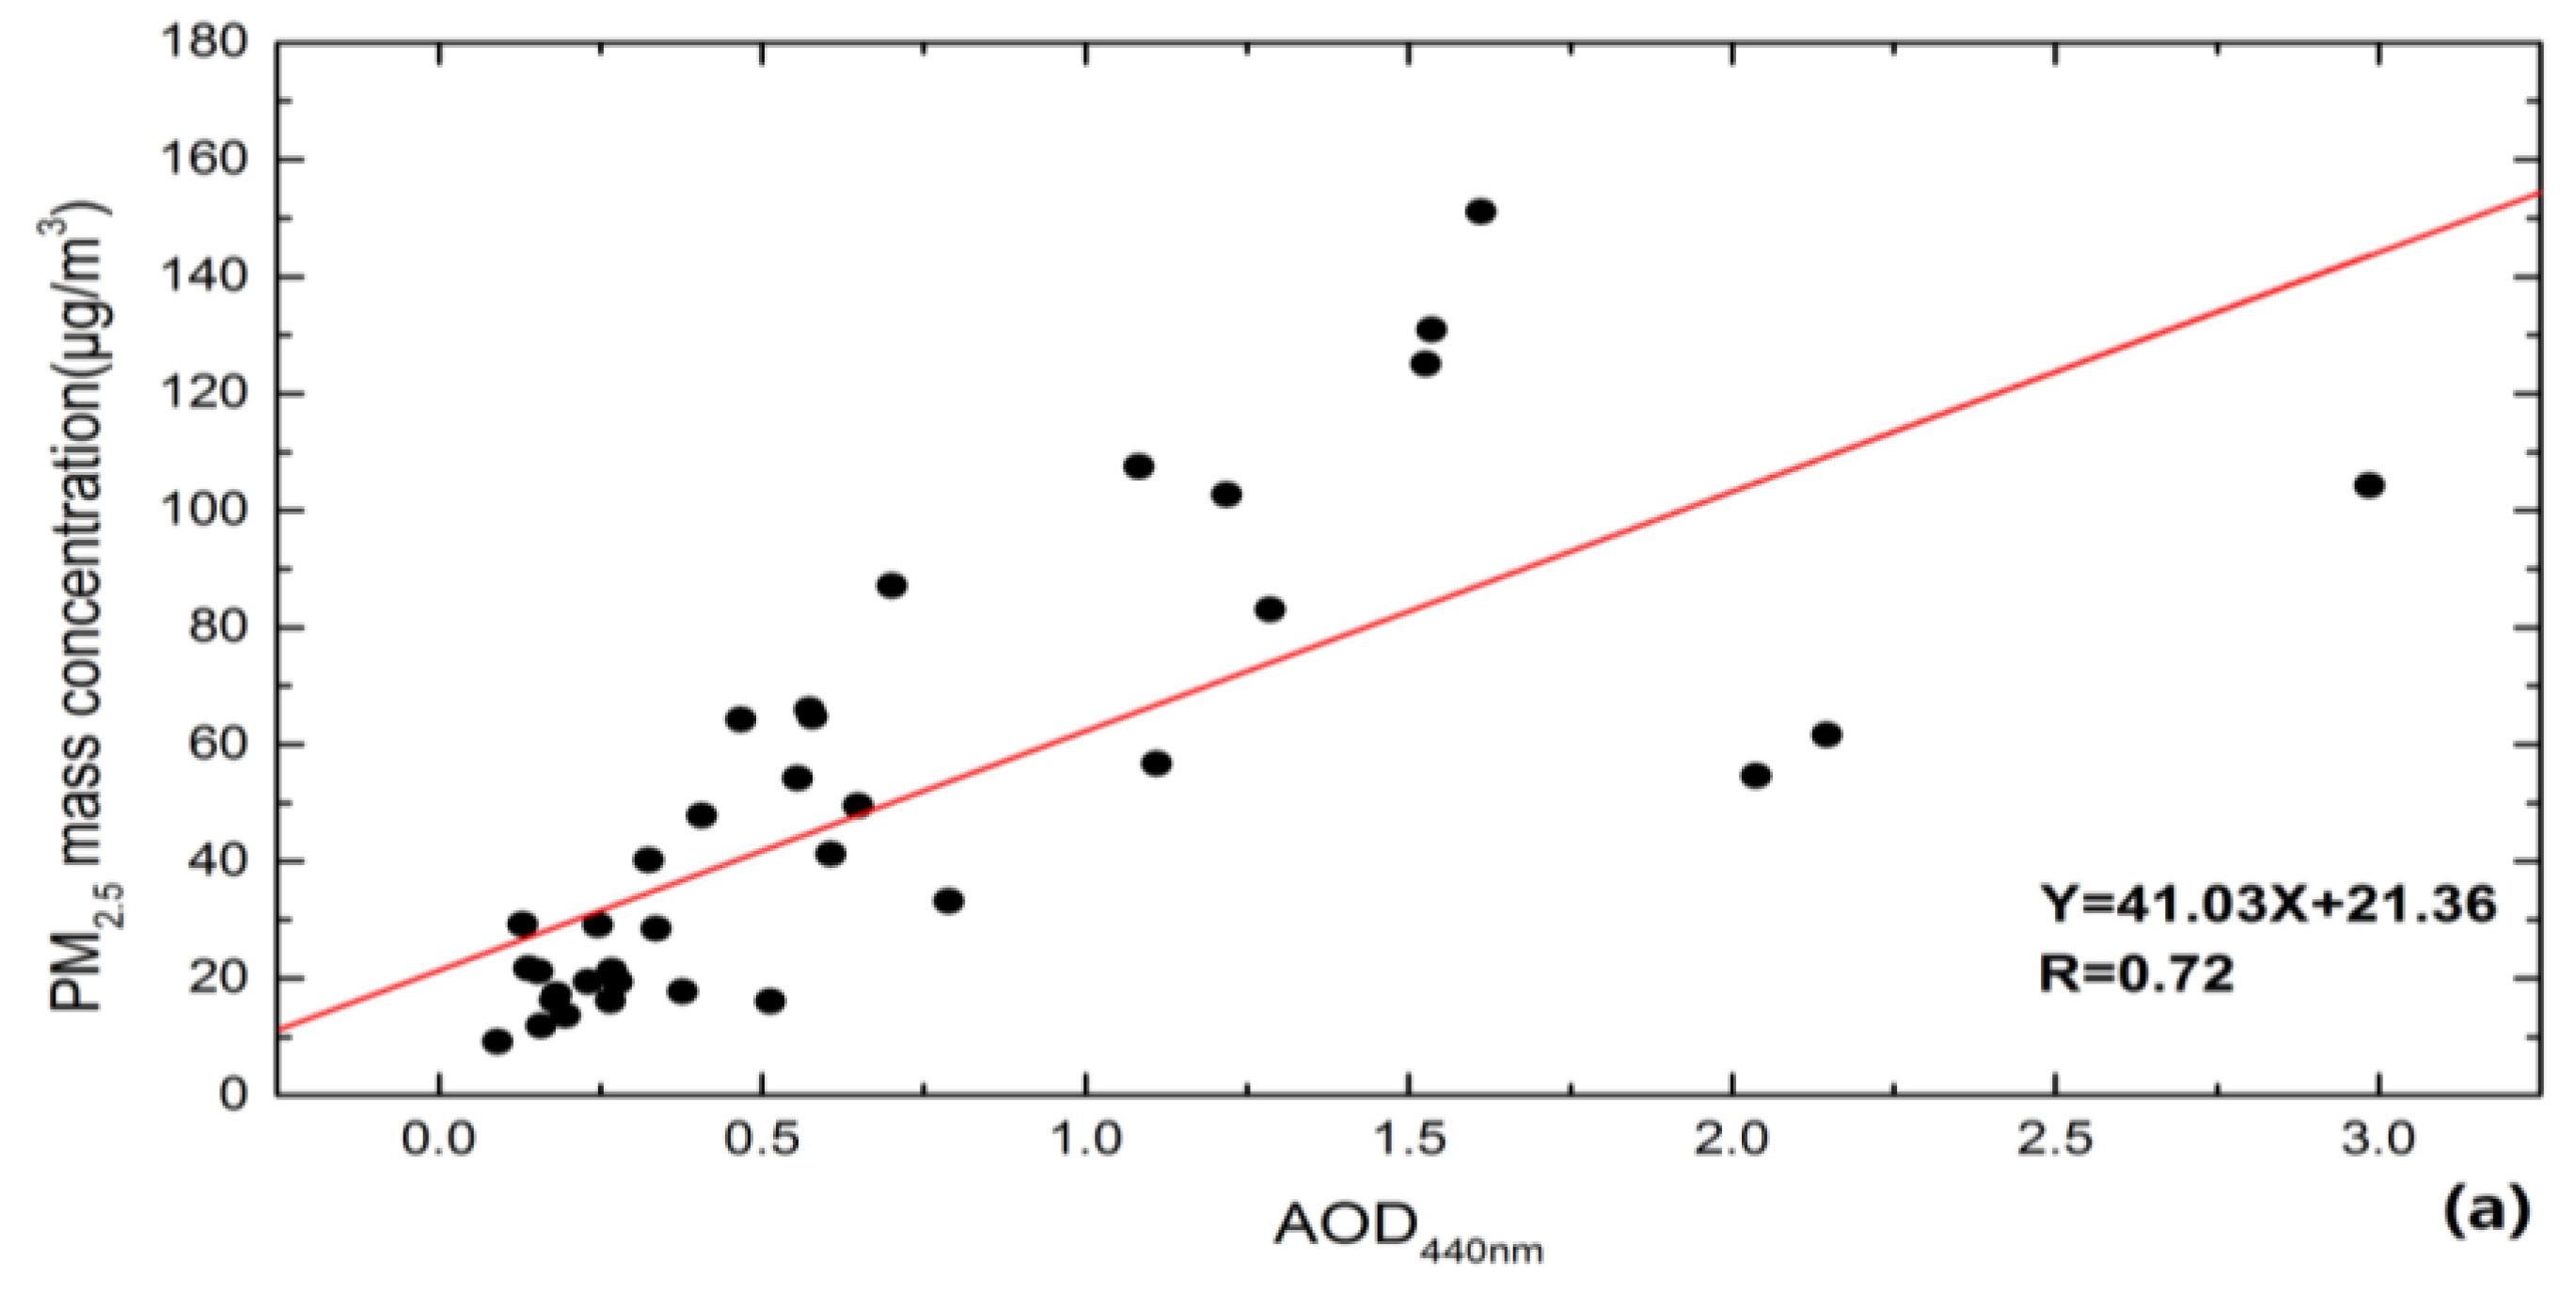
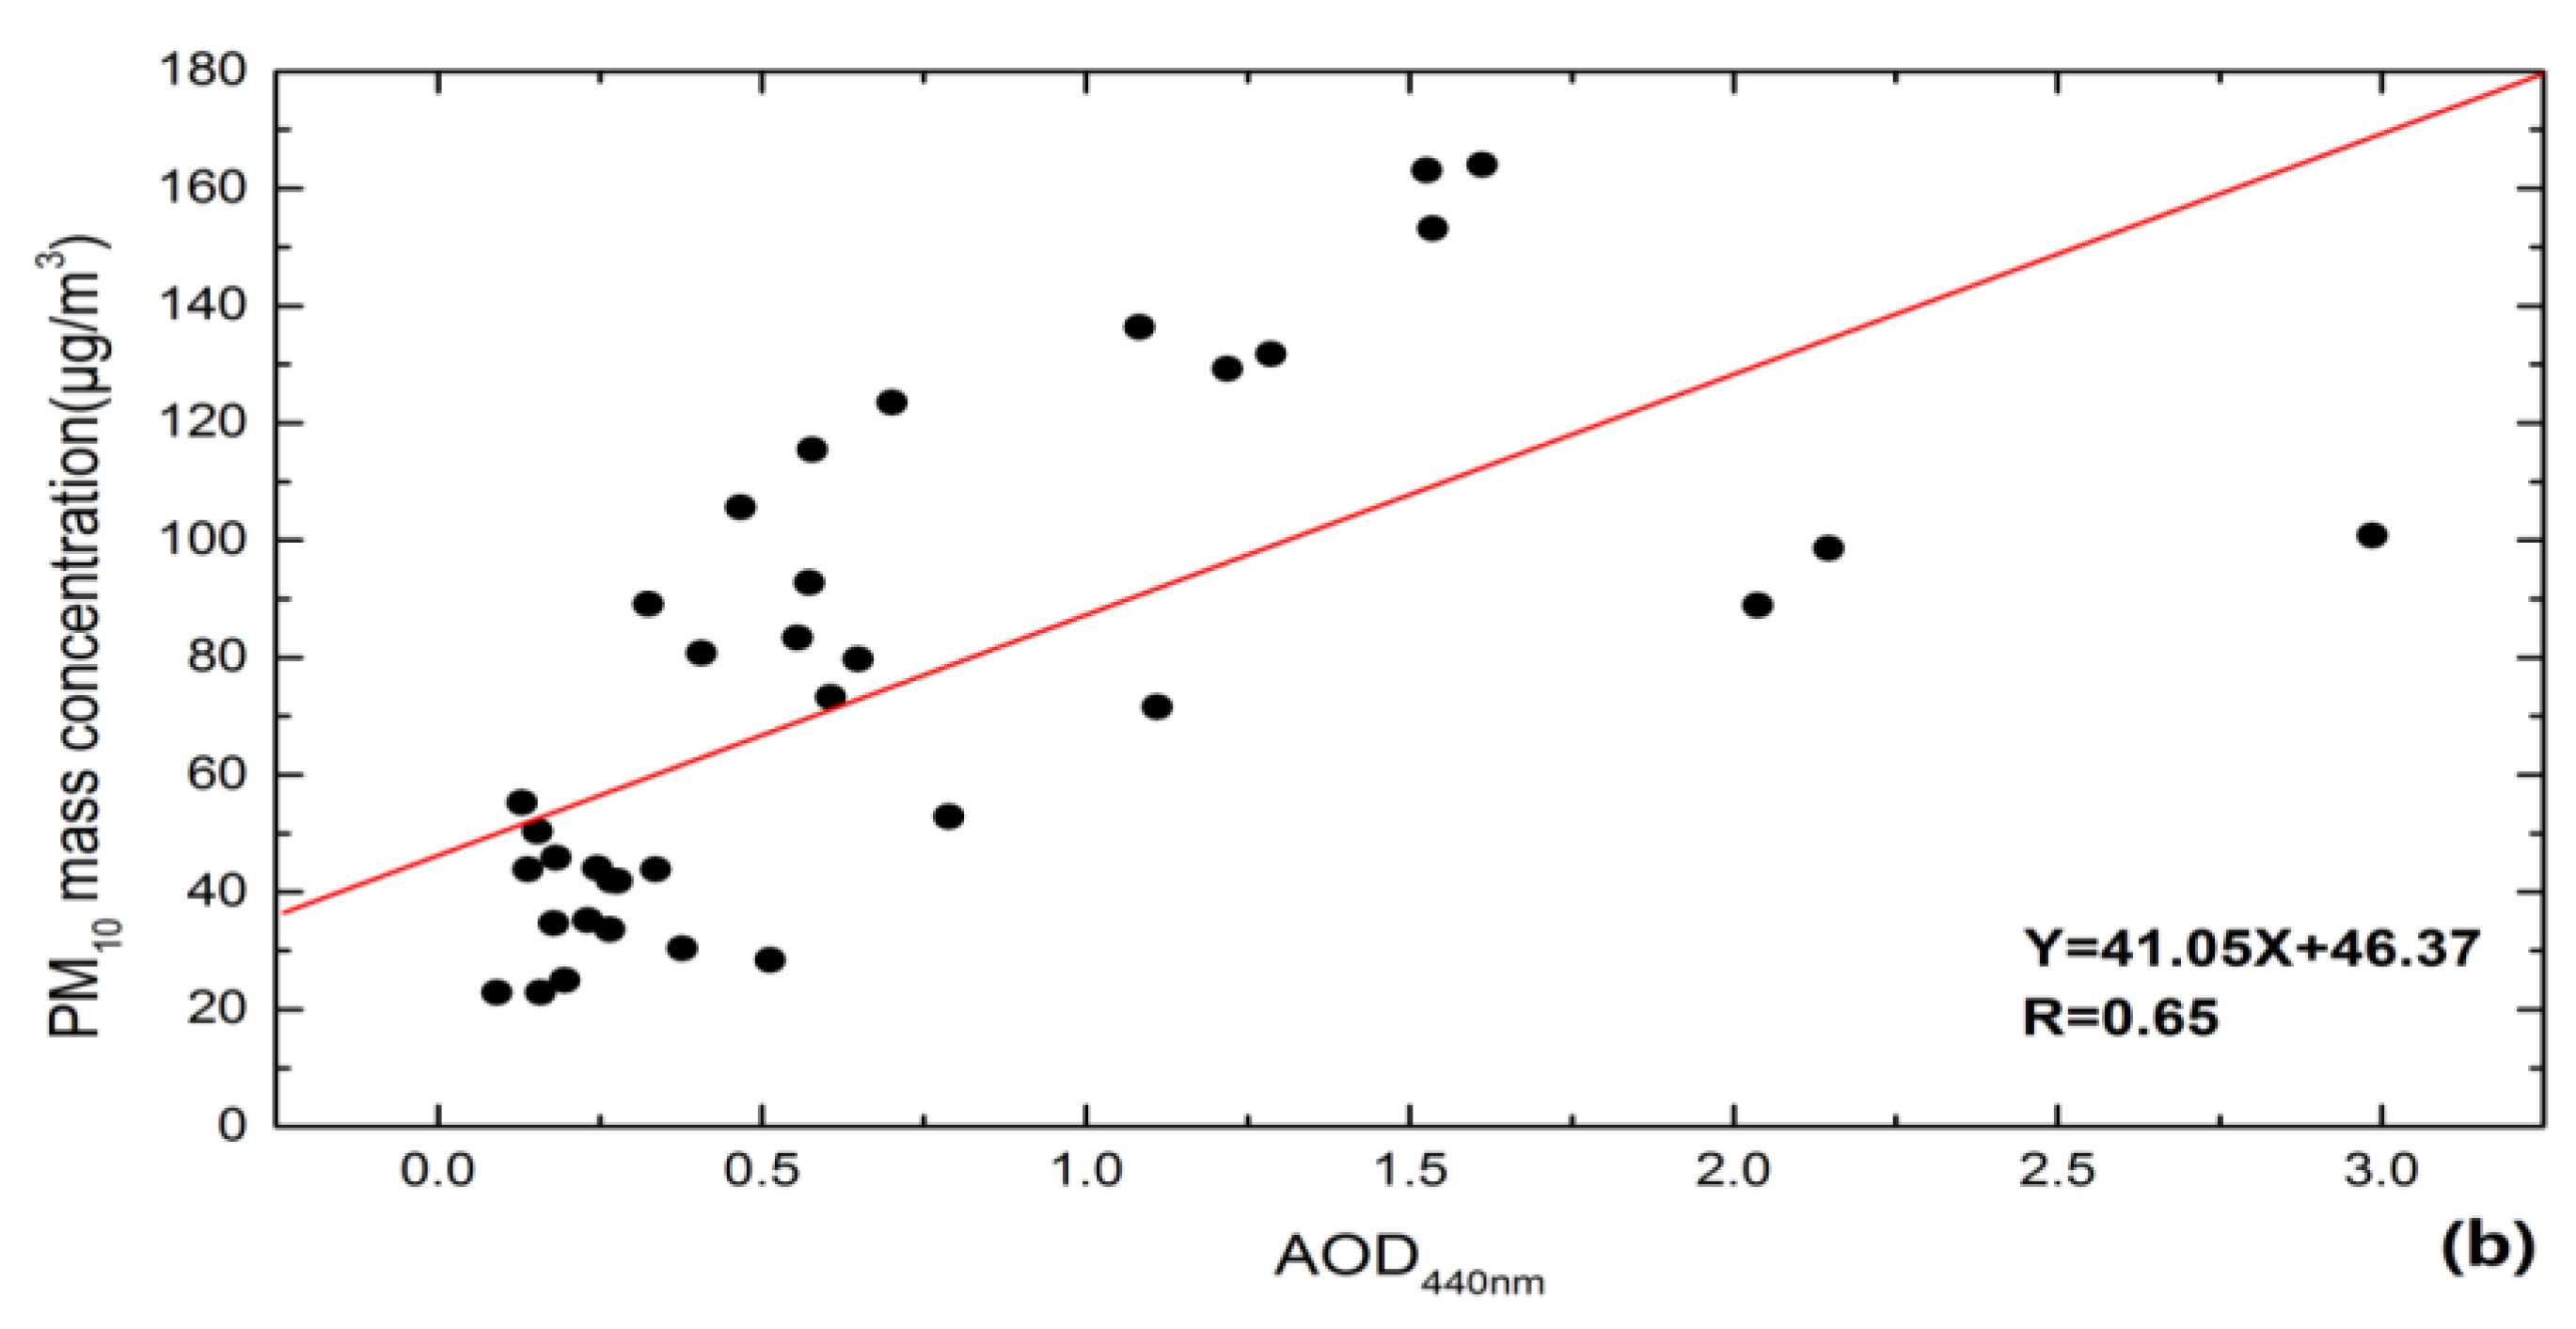
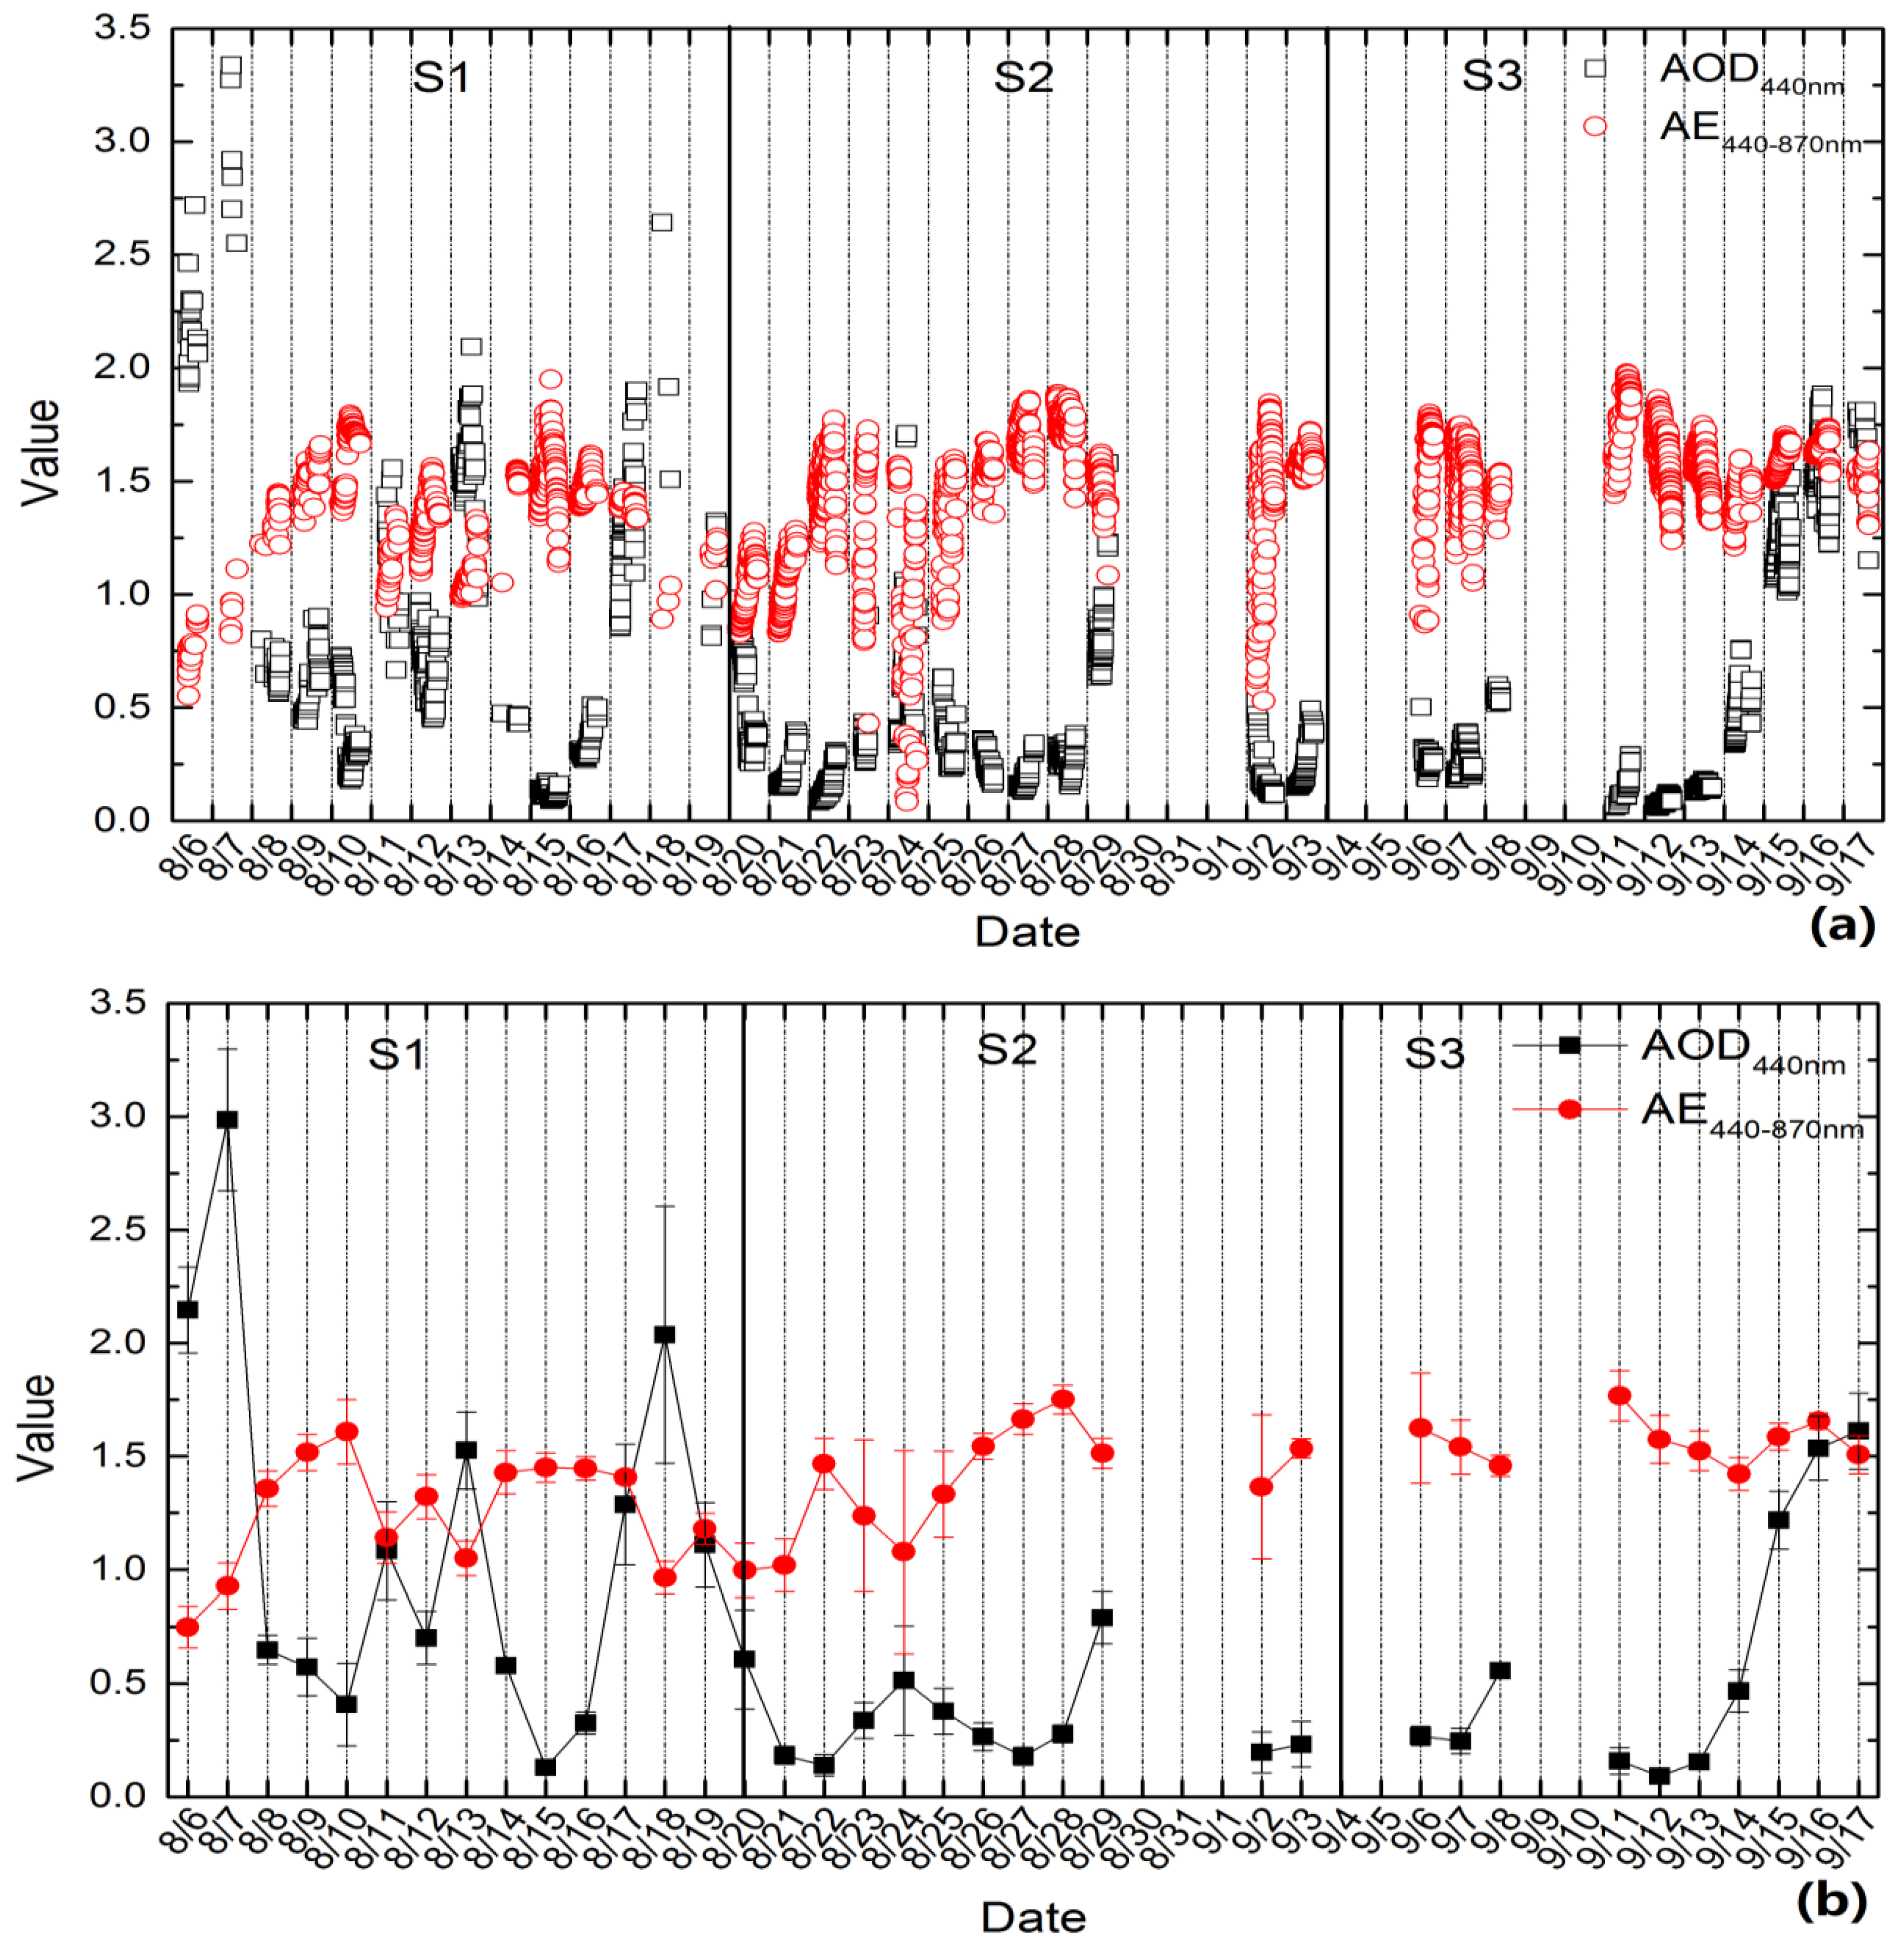
3.1. Daily Average AOD and PM Concentration

The daily mean values of the observed AOD data and PM measurements are shown in Figure 2; the missing AOD data are due to cloud accumulation and precipitation, and the error bars represent the standard deviation (as do all error bars shown in the following figures). In S1, apart from 10, 15 and 16 August, AOD440nm was more than 0.50, with an average value of 1.11 ± 0.82 and a large variational range. The extent of the PM2.5 variation was large and greater than 50 μg/m3, except on 15 and 16 August, with an average value of 70 ± 25 μg/m3. On 7 August, the weather was moderate rain and the AOD was the highest (2.99), which was possibly affected by the hygroscopic growth of aerosol particles [36]. On 13 August, pollution was more serious: AOD440 was 1.53, PM2.5 was greater than 125 μg/m3. On 18 August, aerosol particles activated cloud droplets or hygroscopic growth due to rainfall [36,37], which possibly led to a decrease in particles of 2.5 microns or less and an increase in AOD440. That is to say, the AOD440 on this day was high (~2.04) for the period, whereas the PM2.5 level was not as high, ~55 μg/m3. In S2, the overall level of AOD440 was less than that of S1. The majority (75%) of the AOD440 values were less than 0.5, and the mean value was 0.34 ± 0.20. The PM2.5 value was lower than 40 μg/m3, apart from 20 August (41 μg/m3). The mean value was 23 ± 12 μg/m3 with little variation, which was about 67% less than in S1. During this period, the total amount of PM was reduced likely because of the effective restriction. In S3, the overall level of AOD440 was higher than that of S2 but lower than that of S1, with an average value of 0.62 ± 0.59, possibly due to large quantities of PM that were carried down to the ground by two precipitation processes [36,37] in Beijing (4–5 and 9–10 September). In this period, the change trends of PM2.5 and AOD440 were similar, characterized by low values after precipitation. This would then cause a gradual increase. The mean value of PM2.5 was 52 ± 12 μg/m3. This may have been due to the combined action of the end of the restrictive measures and the precipitation. They would cause a sharp increase and decrease in PM2.5, respectively. In summary, fine particles caused by human activities during the restrictive period (S2) were the main aerosol component in the atmosphere. The variation of AOD440 and PM2.5 was small and the overall values were low, illustrating that the restrictive measures were highly effective [37,38]. Meanwhile, Figure 3 shows the linear fitting for PM2.5 and PM10 with AOD440 for all days that were considered. It can be seen that the PM2.5 (R = 0.72) had a better correlation than PM10 (R = 0.65) with AOD440. When the AOD440 was lower than 0.7, the PM2.5 point deviated less with the results of the linear fit than when the AOD440nm was higher than 0.7. The PM10 showed a smaller deviation when AOD was lower than 0.4 and when the AOD440 was higher than 0.5, the deviation was bigger. However, the PM concentration data reflected the situation at the surface and are dominated by local emissions. The AERONET observations covered the total column, including the dust in the free troposphere, but was dominated by local aerosols as well as long-range transport of pollution. This may be one of the reasons for the mismatch in the figure.

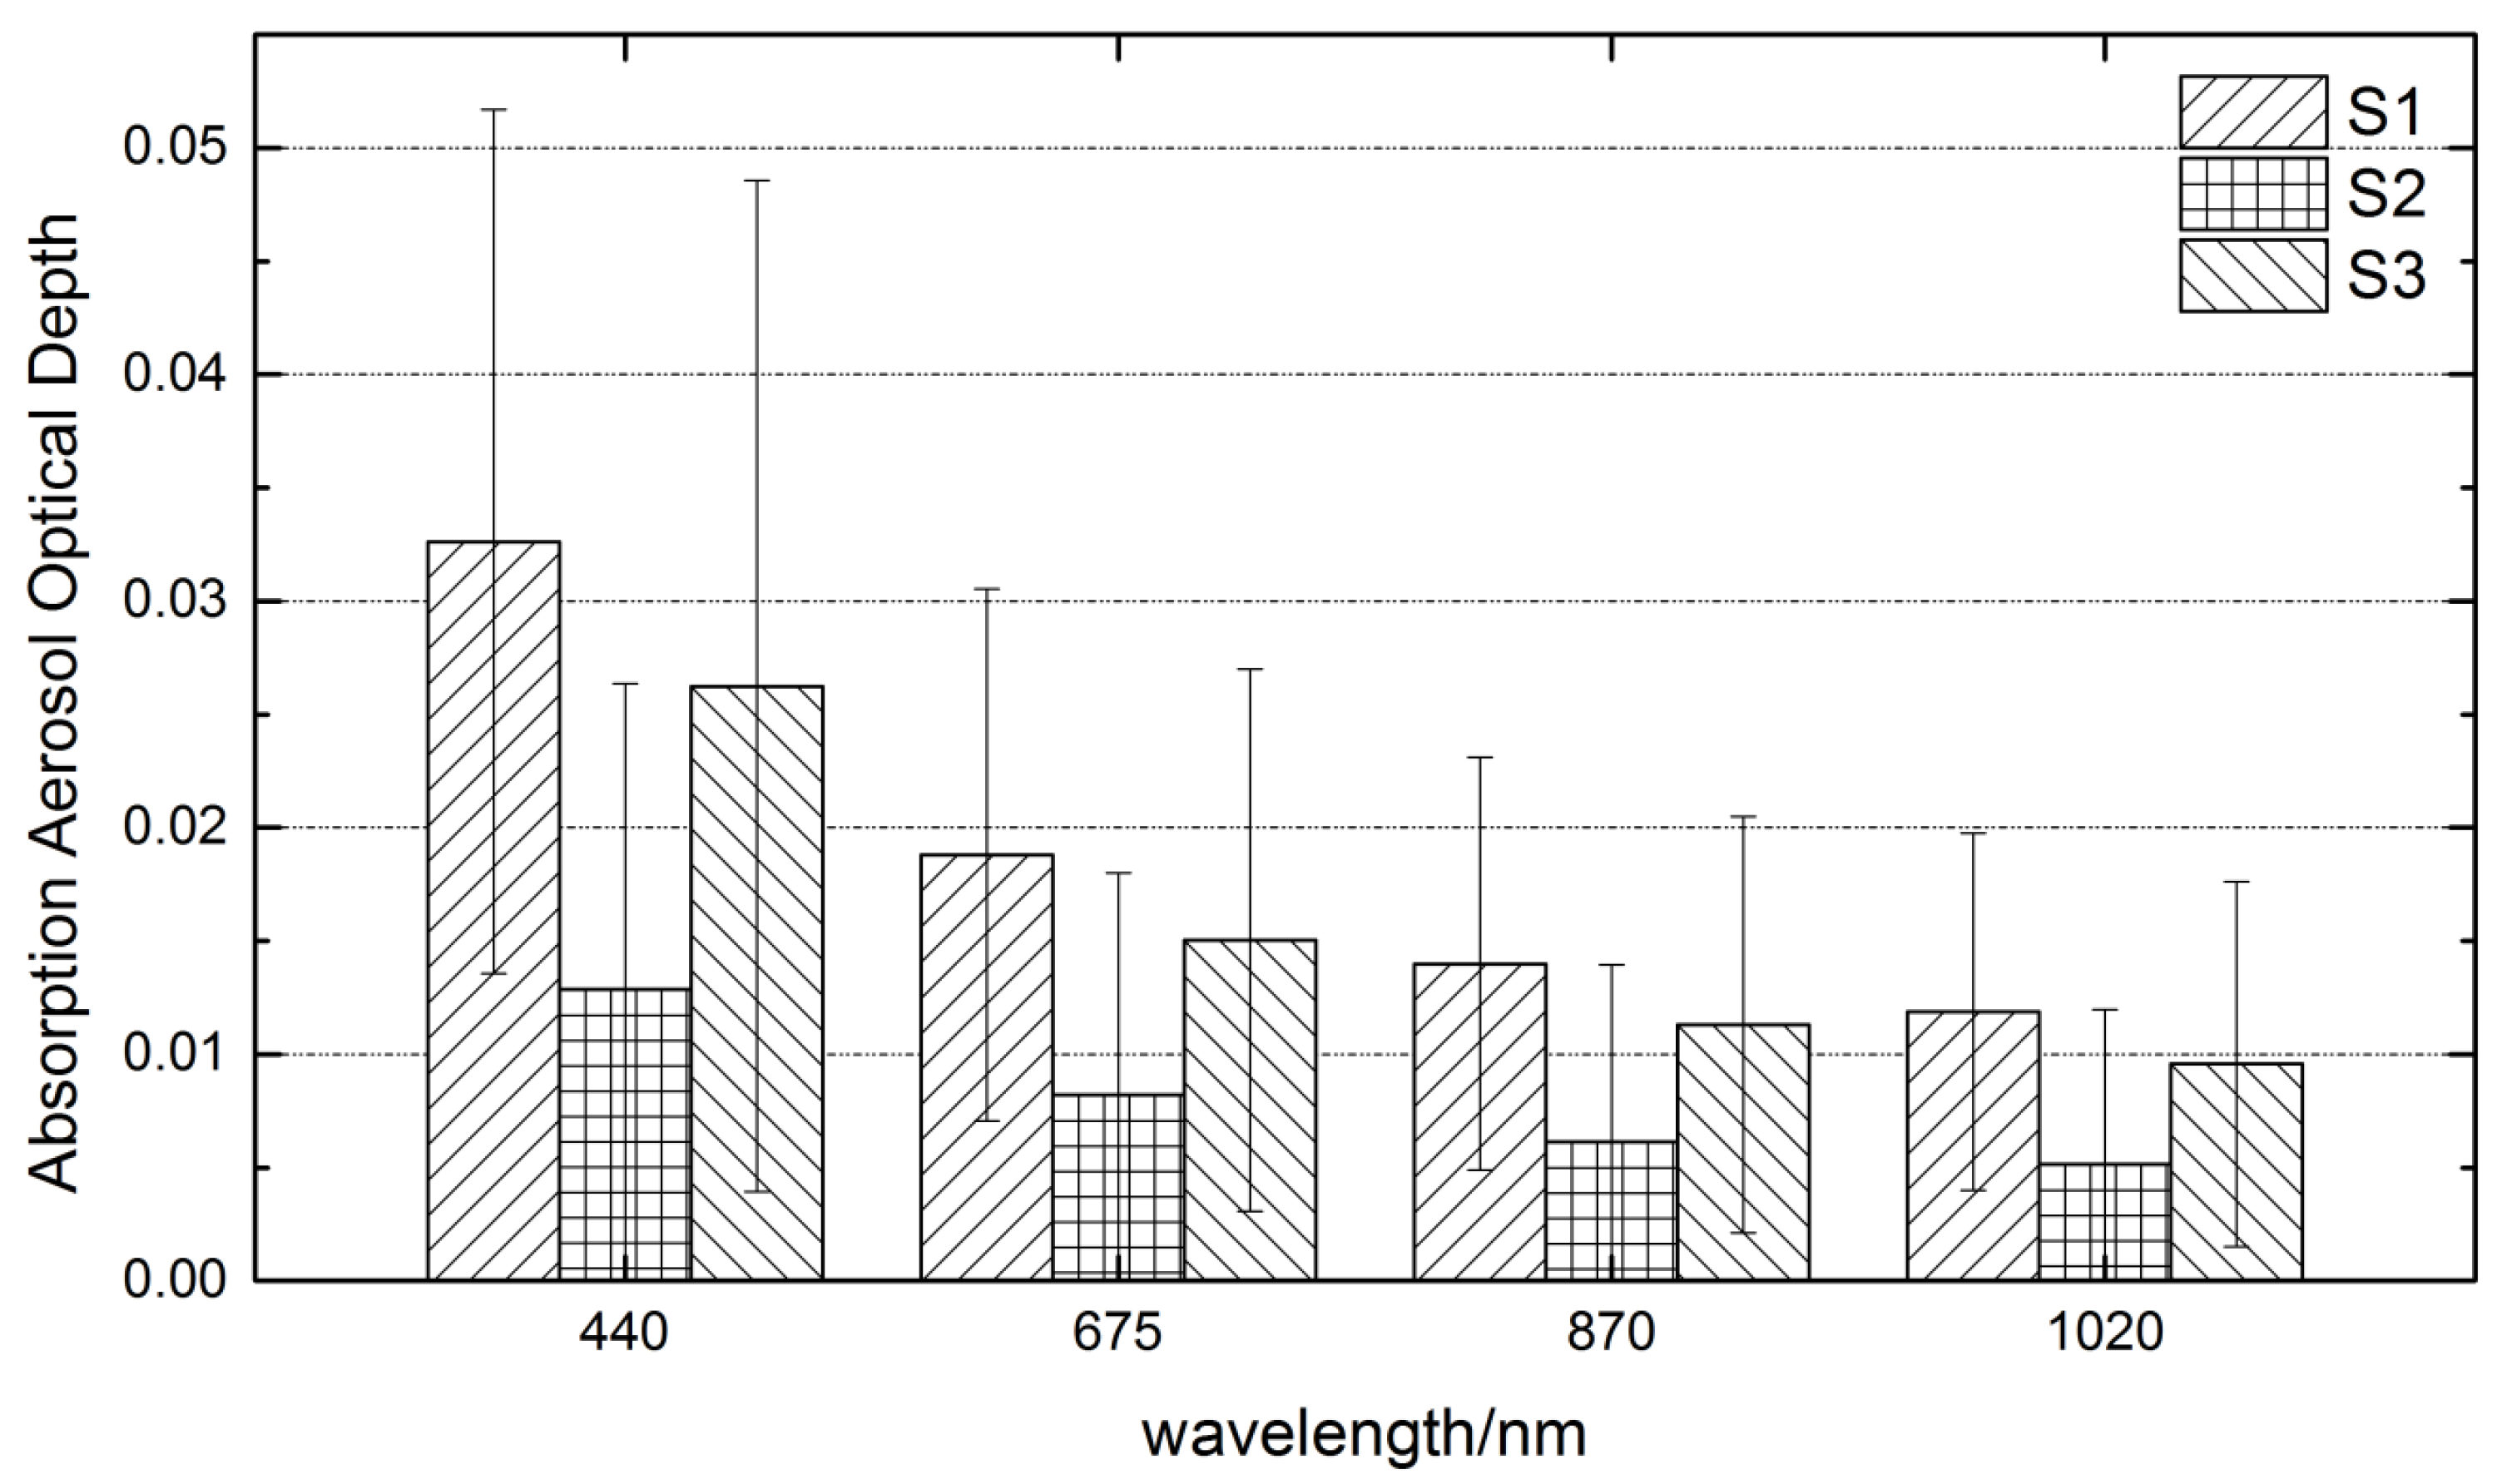
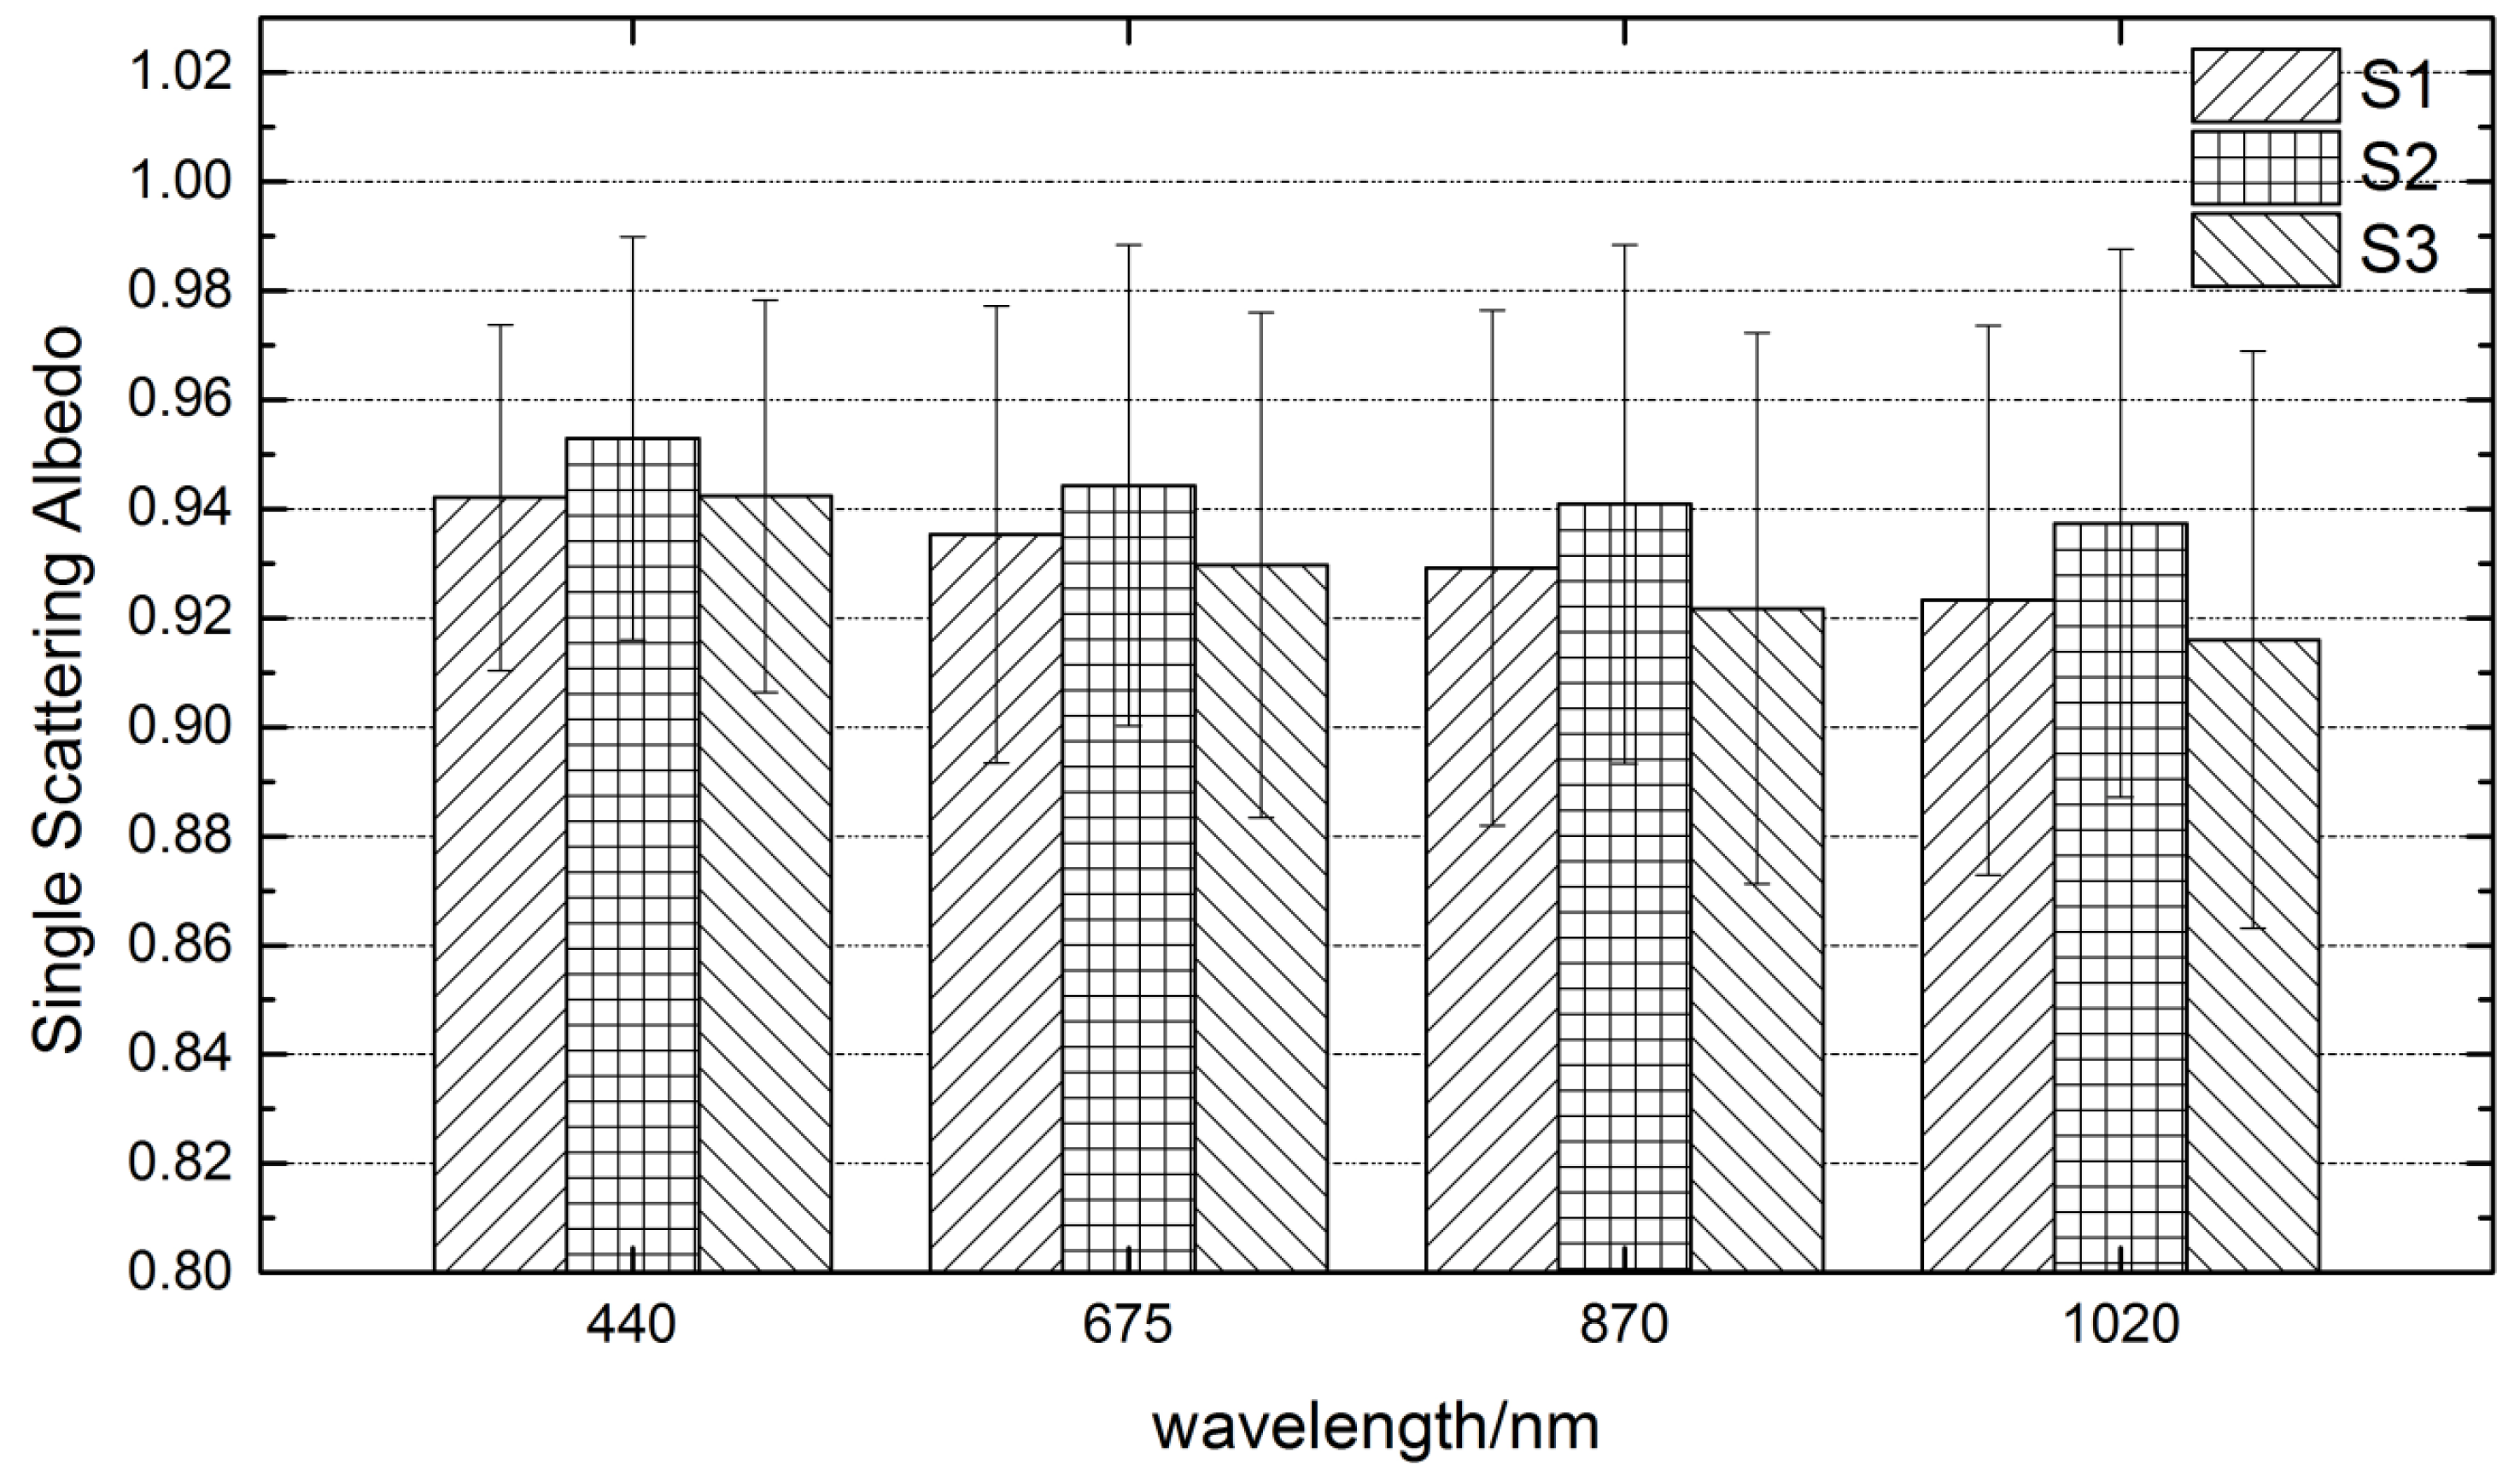
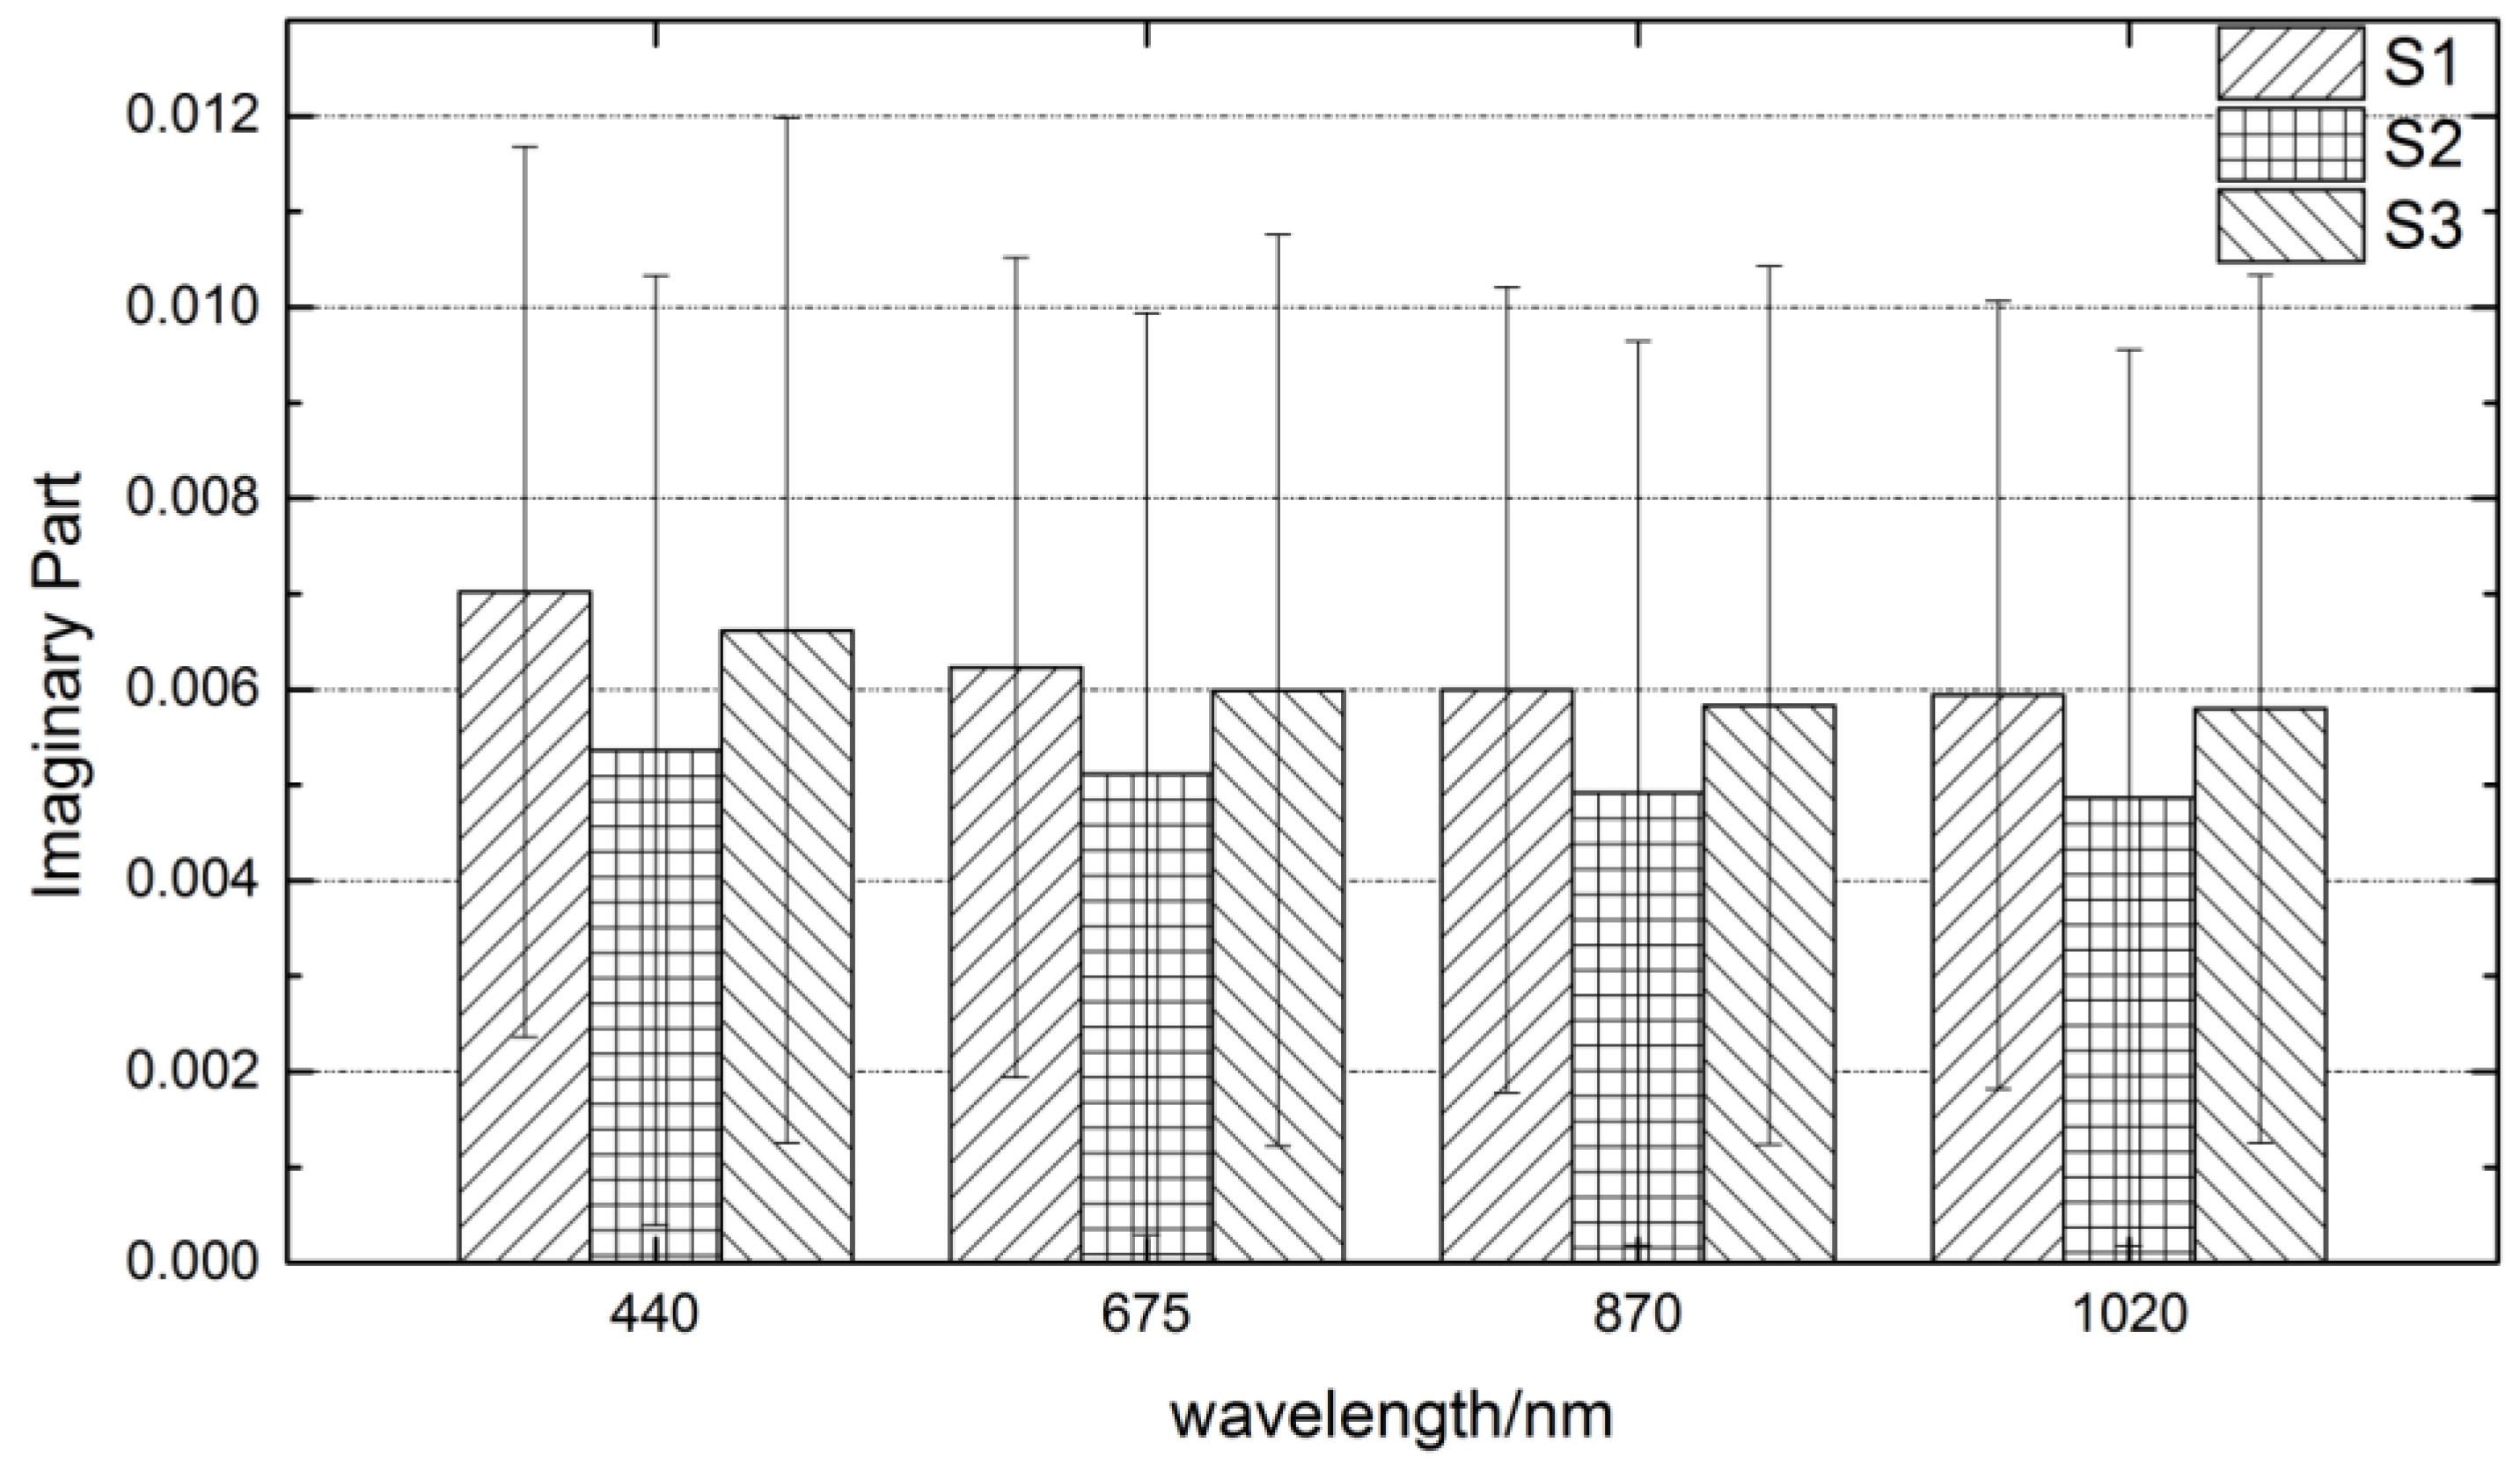
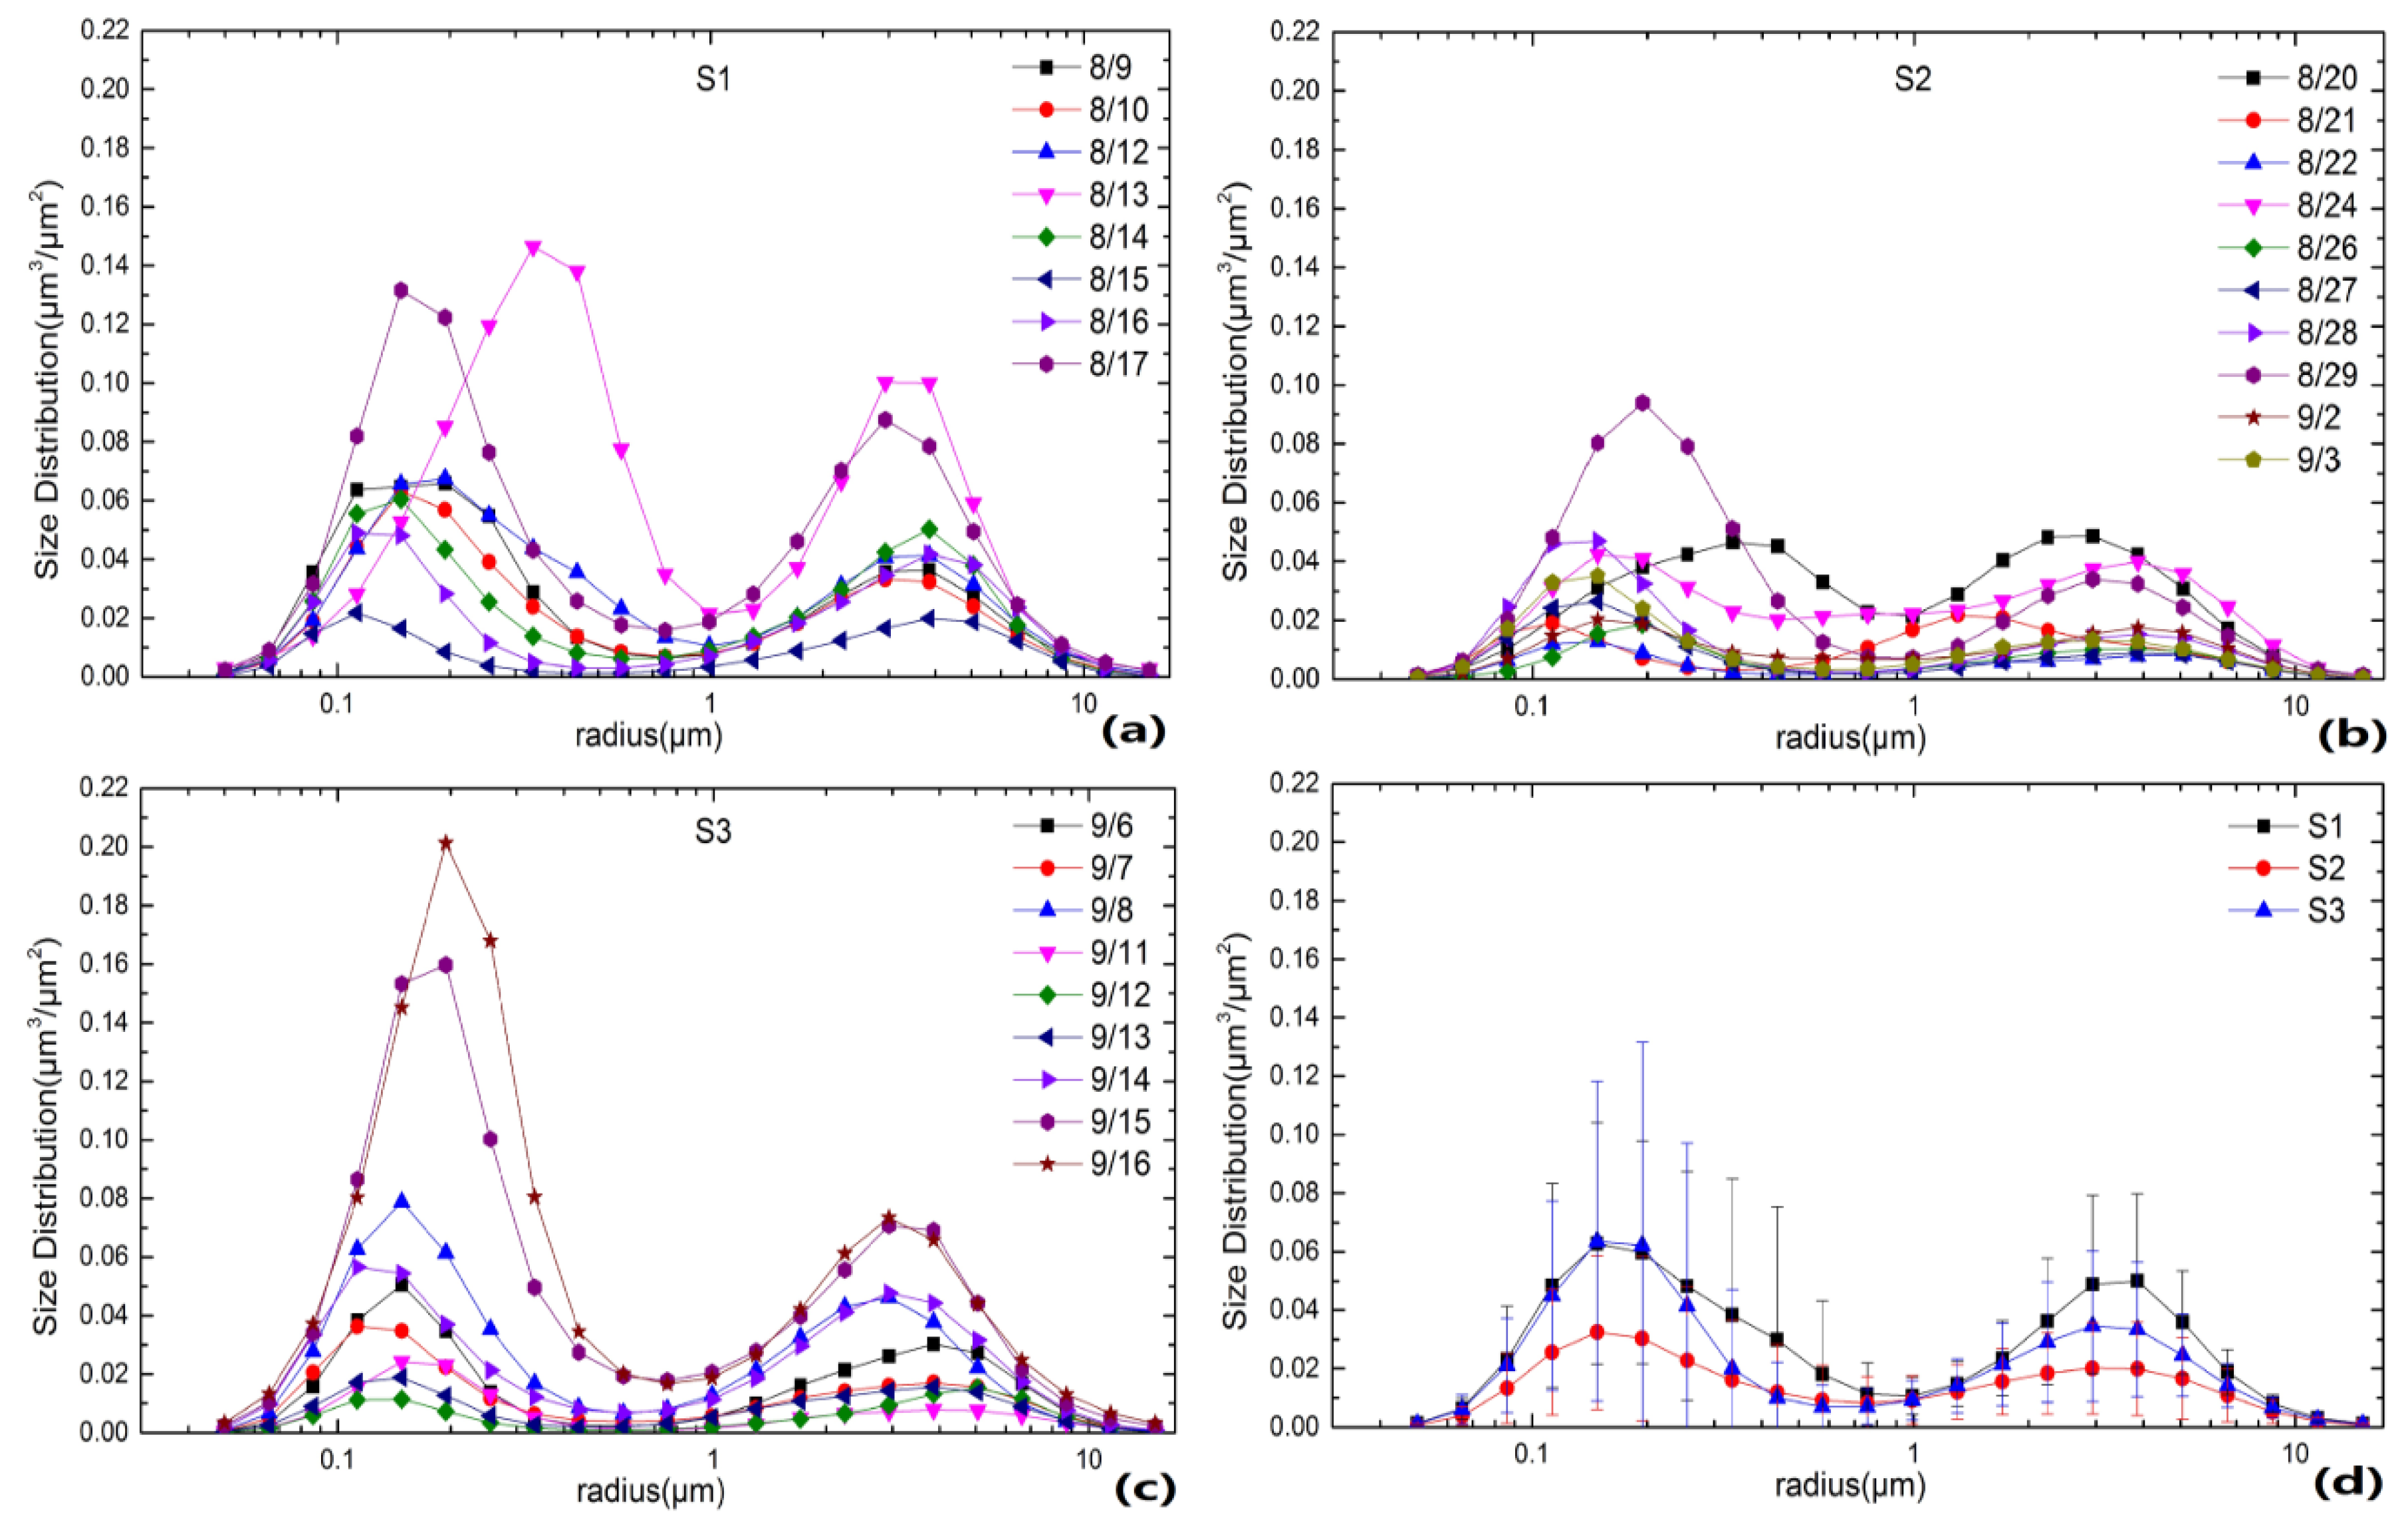
3.2. Aerosol Optical Properties

Figure 4 shows the daily variation of AOD440nm and AE440–870nm observed by AERONET. In S1, the AOD440 was at the highest level on 7 August and then sharply decreased due to the precipitation. The AOD440 fluctuated from 8 to 13 August and then began to decrease from 13 to 15 August when it reached its lowest level. A slight AOD440 increase occurred on 16 August, and then a sharp increase occurred on 17 August. The value of AOD varied from 1.18 to 1.90. It then reached a high level on 18 August (2.04), when a thunder shower occurred. Before the precipitation, the high relative humidity led to the strong hygroscopic effect of particles and thus the AOD increased. After the precipitation, effected by the wet removal, the AOD decreased sharply. Compared to the significant changes in AOD440, the change in AE was not as sharp: the mean value was 1.26 ± 0.27, indicating the main particles of air pollution in S1 were fine particles. In S2, the overall level of AOD440 was lower than that in S1. Almost all values were less than 1.00 and 82% were less than 0.50. However, AE showed greater variation, with a mean value of 1.38 ± 0.25. The AE reached its lowest value of 0.08 on 24 August, and then increased continuously until 28 August, with a maximum value of 1.87. In S2, AE values > 1.50, and > 1.00 were 56% and 84%, respectively. This indicates that coarse particles produced by factories were significantly reduced following the restrictive measures. In addition, the air quality was more affected by the generation of fine particles, such as vehicle exhaust and secondary aerosol formation. In S3, AOD440 was affected by the wet removal of two precipitation processes. The overall level was lower than the S1 stage but higher than the S2 stage due to the end of restrictive measures. The AE was most >1.00, and the mean value was 1.58 ± 0.11. Therefore, before the restrictive measures were introduced, air pollution was more serious than during the period when attempts were being made to control air pollution. Following the end of the measures, AOD440 remained at a low level due to the beneficial weather conditions [36,37,38,39].
The SSA, single scattering albedo, reflects the proportion of aerosol particle scattering in the total extinction, which is calculated by the equation SSA = σ s c σ s c + σ a b sc and σab stands for the scattering coefficient and absorption coefficient, respectively). A low variation of aerosol particles has a great influence on this property, which is important to evaluate the effects of aerosols on climate. Dubovik et al. [40] showed that the spectral properties of SSA are not only determined by the category of aerosol but also by the size of the aerosol. Figure 5 shows the average SSA in the three stages of the present study. It can be seen that the SSA in each stage decreased gradually with wavelength. The SSA of all the bands was more than 0.90, reflecting the strong scattering effect of aerosol particles during the study period. In S2, the SSA was relatively greater than in the other two stages: the mean value of all wavelengths was 0.944 ± 0.045 (S1 = 0.932 ± 0.043; S3 = 0.927 ± 0.046), and aerosol particles showed strong scattering capacity. This may have been due to the main pollutants such as sulfur or nitrogen oxides in the Beijing area resulting from anthropogenic activities (e.g., vehicle exhaust) in the restrictive period. The rate that these hygroscopic particles converted into sulfate and nitrate was enhanced [41]. The SSA increased because sulfate, nitrate and other secondary aerosols have strong scattering capacities. The SSA in S1 was between 0.92 and 0.95 for all bands, while S3 featured the lowest SSA level for all bands, with all values falling between 0.91 and 0.95.
Absorption AOD (AAOD) reflects the proportion of aerosol particles absorbing in the total extinction, which is calculated by the equation AAOD = AOD × (1 − SSA). As Figure 6 shows, AAOD decreased with wavelength in each stage. In S1, AAOD was significantly greater than in the other stages and AAODs were more than 0.01 at all wavelengths. In particular, AAOD at 440 nm exceeded 0.03, reflecting the higher content of absorbing aerosol particles in the atmosphere. The AAOD level in S2 was the lowest, with a mean value between 0.005 and 0.015, indicating that emissions of air pollutants during this period of restriction were greatly reduced and the air quality improved. Although the AAOD in S3 was lower than that in S1, it was still greater than in S2 (0.010–0.030). This suggests that although the wet removal effect was beneficial to the reduction of pollutants in the atmosphere, the emissions of pollutants and their content in the atmosphere still increased. These results fully verify the importance of restrictive measures to improve air quality. The above discussion could allow a deeper understanding of the scattering and absorption capacity of aerosols.
Figure 7 shows the imaginary part of the complex refractive index for each wavelength in S1, S2 and S3. It is apparent that the imaginary part of each wavelength had a tendency to decrease with wavelength during the whole period. The imaginary part in S2 was the smallest, with a mean value of 0.0051 ± 0.0048, indicating that absorption ability during S2 was lowest. The imaginary part for each wavelength in S1 was the highest and most were more than 0.006, indicating the serious pollution before the restrictive measures. The imaginary part of each wavelength in S3 was around 1.20 times that of the imaginary part in S2. This indicates that atmospheric aerosol absorption increased after the end of the restrictive measures.
Table 1 displays the statistical parameters (mean and standard deviation) of the aerosol optical properties. It can be seen that the AOD440nm in S1 was the highest of these three stages. When the restrictive measures were taken, the AOD440 in S2 was about 69% lower than before with the value of 0.34. The α440–870 in S2 was about 9.5% higher than in S1, indicating the component of coarse particle was decreased. In addition, this was also reflected in a Cf/Cc ratio that was about 6.4% larger than S1. The effective radius of coarse particles in S2 (2.27 ± 0.46) was the smallest in these three stages, about 13.4% and 8.5% smaller than S1 and S3, respectively.
The aerosol particle size distribution was obtained from the AERONET observation data, and the results are shown in Figure 8. It can be seen that during the study period, the aerosol size distribution showed an obvious double-peak distribution. In S1, the peak value of fine-mode particles on 13 August was significantly higher than at other times, ~0.15 μm3/μm2 with a radius of 0.35 μm (effective radius of 0.26 μm). The coarse-mode particle peak was also higher than at other times, reaching 0.10 μm3/μm2 (effective radius reaching 2.79 μm). These data imply that air pollution was relatively more serious on these days. During 16–17 August, fine-mode particles peaked in the range of 0.06 μm3/μm2 to 0.13 μm3/μm2. The particle radius corresponding to the peak value increased as did the number of fine-mode particles with a radius between 0.20 μm and 1.00 μm on 17 August. It was much higher than on 16 August, possibly due to the occurrence of precipitation. The precipitation led to collision and/or coalescence growth of fine particles. In S2, the peak value of fine-mode particles on 29 August was significantly higher than that on other days, exceeding 0.09 μm3/μm2. The radius corresponding to the peak value increased from 0.15 μm to 0.19 μm and the effective radius reached 0.18 μm. This showed that there were many fine particles affected by collision and coalescence growth, resulting in the peak concentration and corresponding increase in radius. Meanwhile, at other times in S2, the fine or coarse mode particle quantities were both less than 0.05 μm3/μm2, significantly lower than in S1—reflecting the important role of the air pollution restrictive measures. The peak value of fine particles in S3 exceeded 0.16 μm3/μm2 and 0.20 μm3/μm2 on 15 and 16 August, respectively. However, the overall level on other days was lower than in S1, with the value basically below 0.08 μm3/μm2.
Figure 8d shows the average particle size distribution of the three stages. Clearly, the S1 size distribution curve is higher than that of S2, indicating a higher aerosol particle content. The peak concentrations of fine particles reached 0.063 μm3/μm2, ~97% higher than in S2. The volume median radius in S1 was 0.19 ± 0.05 μm, which was slightly larger than in S2 (about 0.18 ± 0.04 μm) and much larger than in S3 (about 0.16 ± 0.02 μm). The effective radius of S1 was 0.32 ± 0.08 μm, also larger than in S2 and S3, which had values of about 0.28 ± 0.09 μm and 0.30 ± 0.09 μm, respectively. Meanwhile, the coarse-mode particle concentration in S1 was obviously larger than that in S2 and S3, with the peak concentration reaching about 0.050 μm3/μm2, which was 1.5 times higher than in S2 and 0.5 times higher than in S3. The volume median radius of coarse-mode particles in S1 was 3.14 ± 0.24 μm, which was slightly larger than that in S3 (about 3.06 ± 0.41 μm) and much larger than that in S2 (about 2.81 ± 0.38 μm). The largest effective radius of coarse-mode particle was still in S1, at about 2.62 ± 0.22 μm, followed by S3 (2.48 ± 0.35 μm) and S2 (2.26 ± 0.34μm). Therefore, we can see from the above that before the restrictive measures, the atmospheric aerosol content was higher, and the air pollution was more serious. With the implementation of the restrictive measures, the concentration of aerosol was significantly reduced, and the air quality notably improved. After the end of the measures, the aerosol concentration was still at a low level and showed improved air quality due to the beneficial weather conditions.

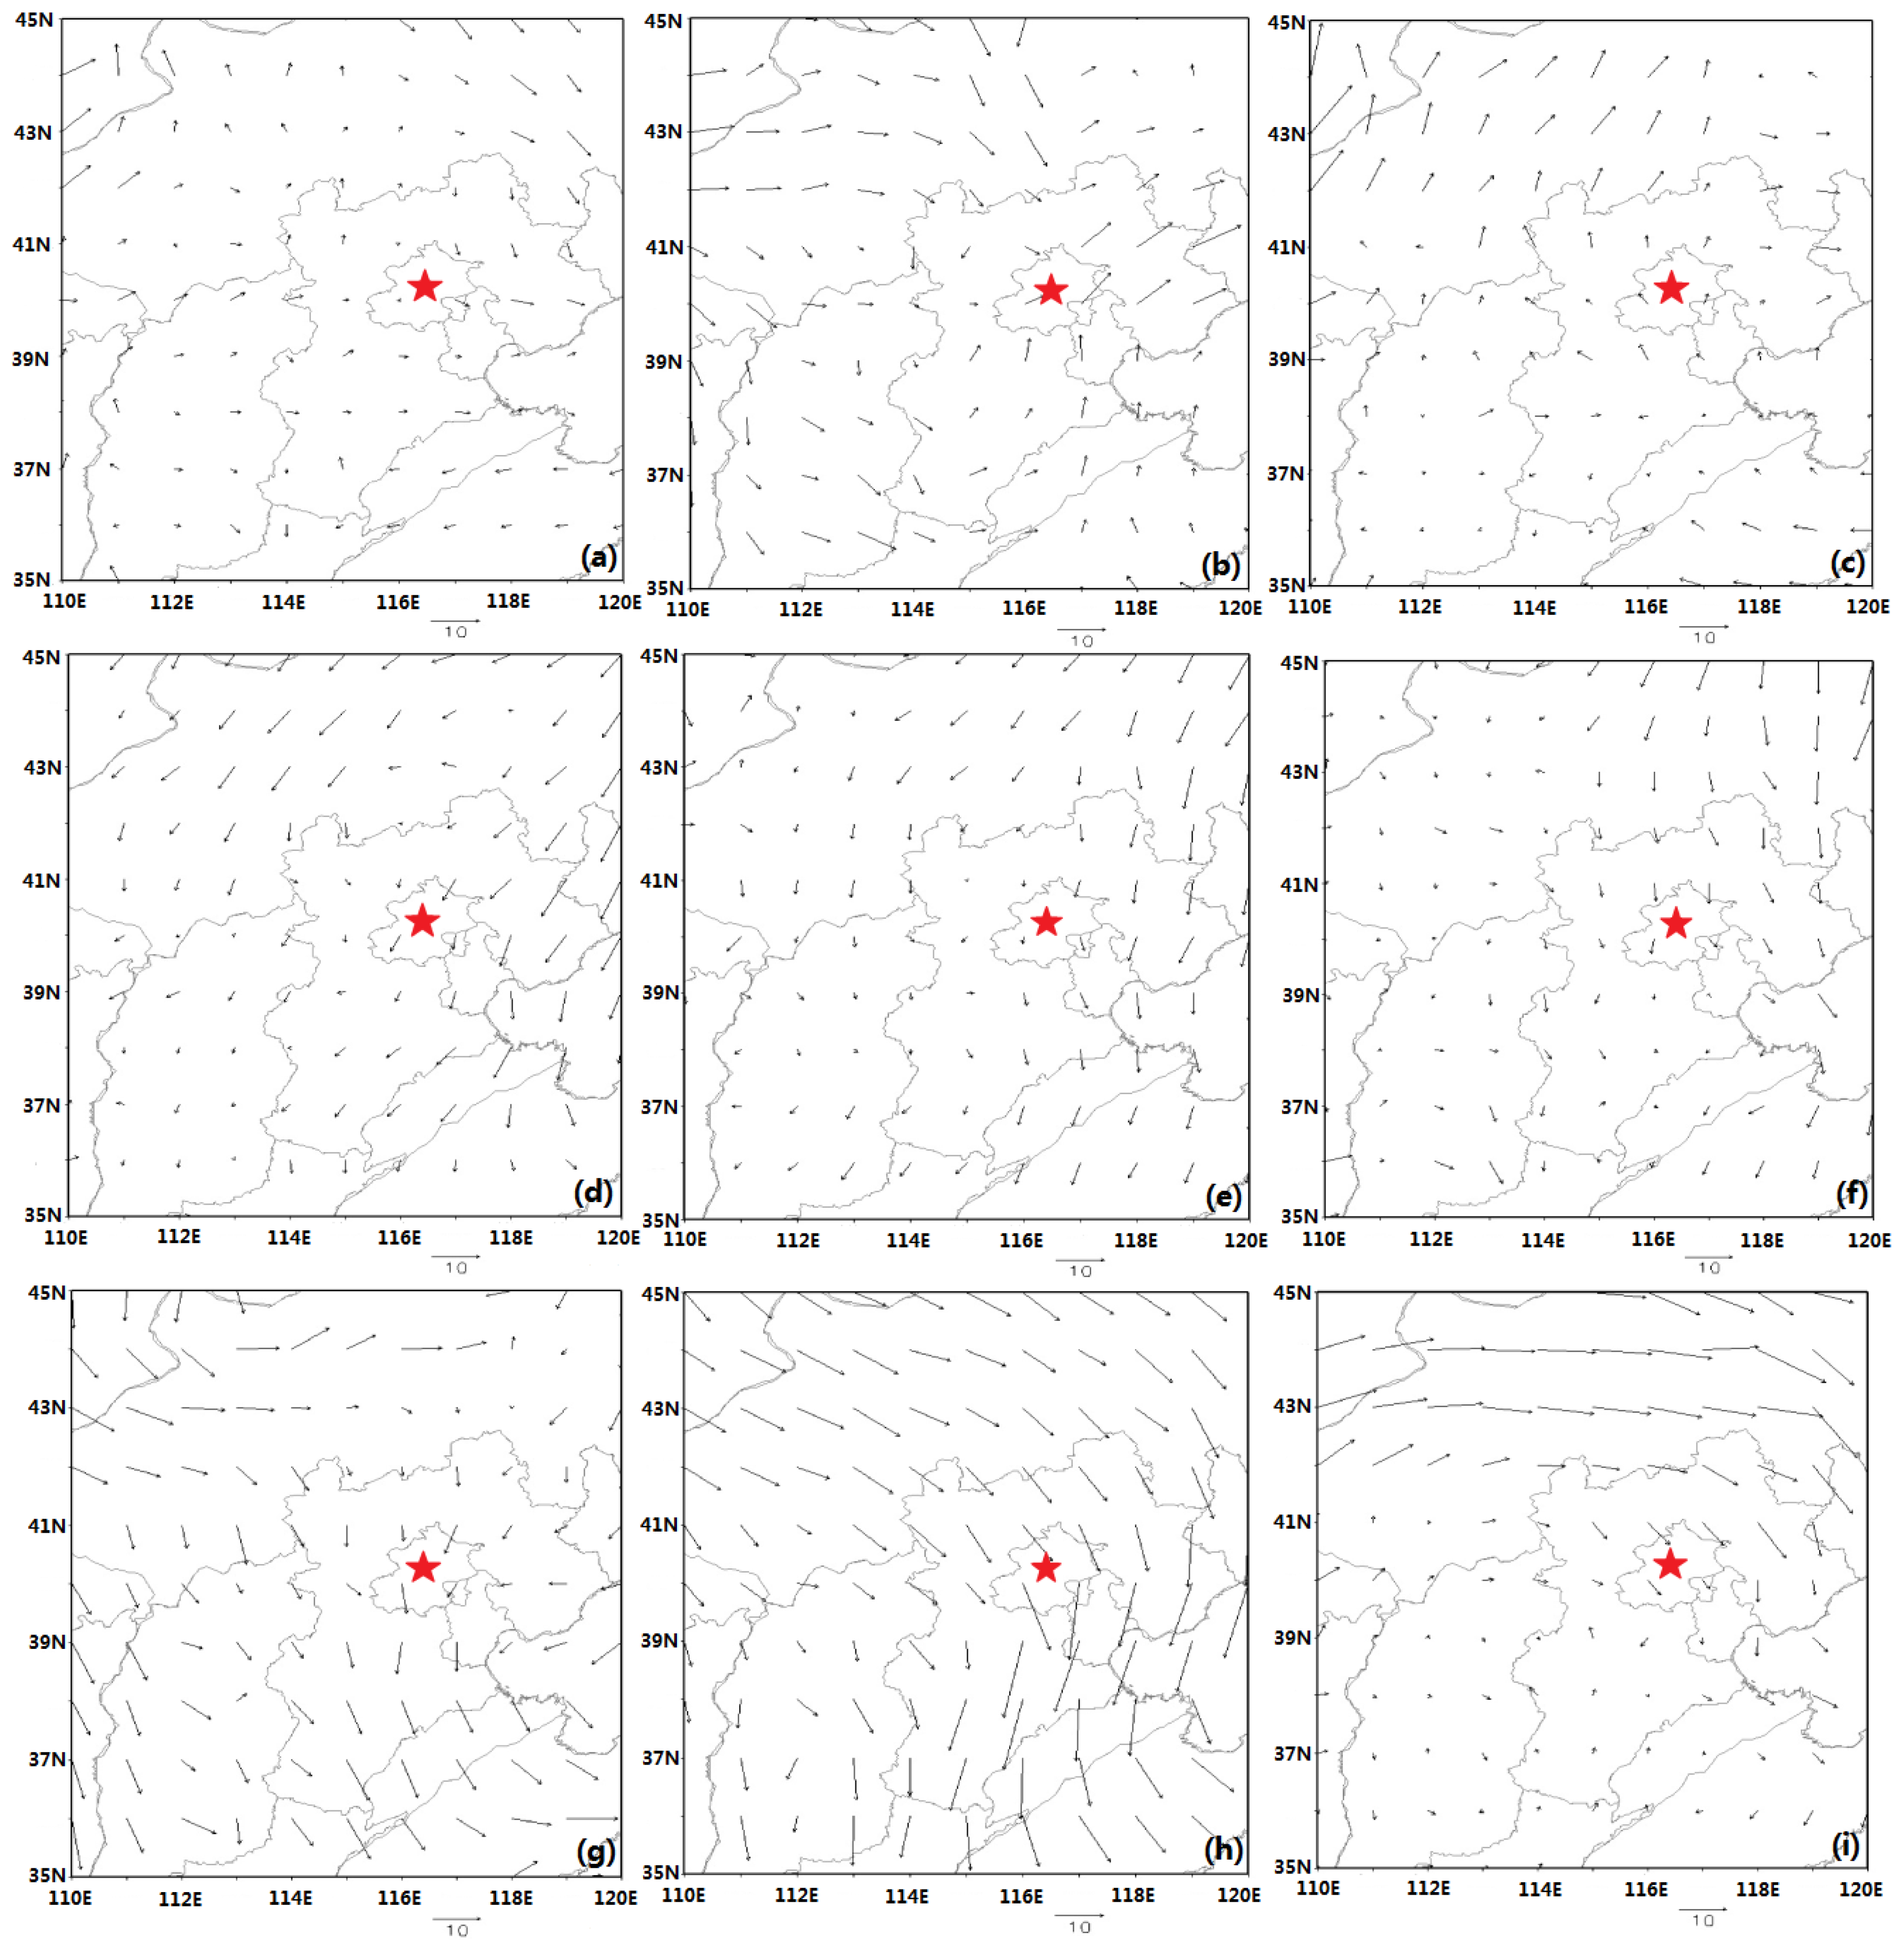
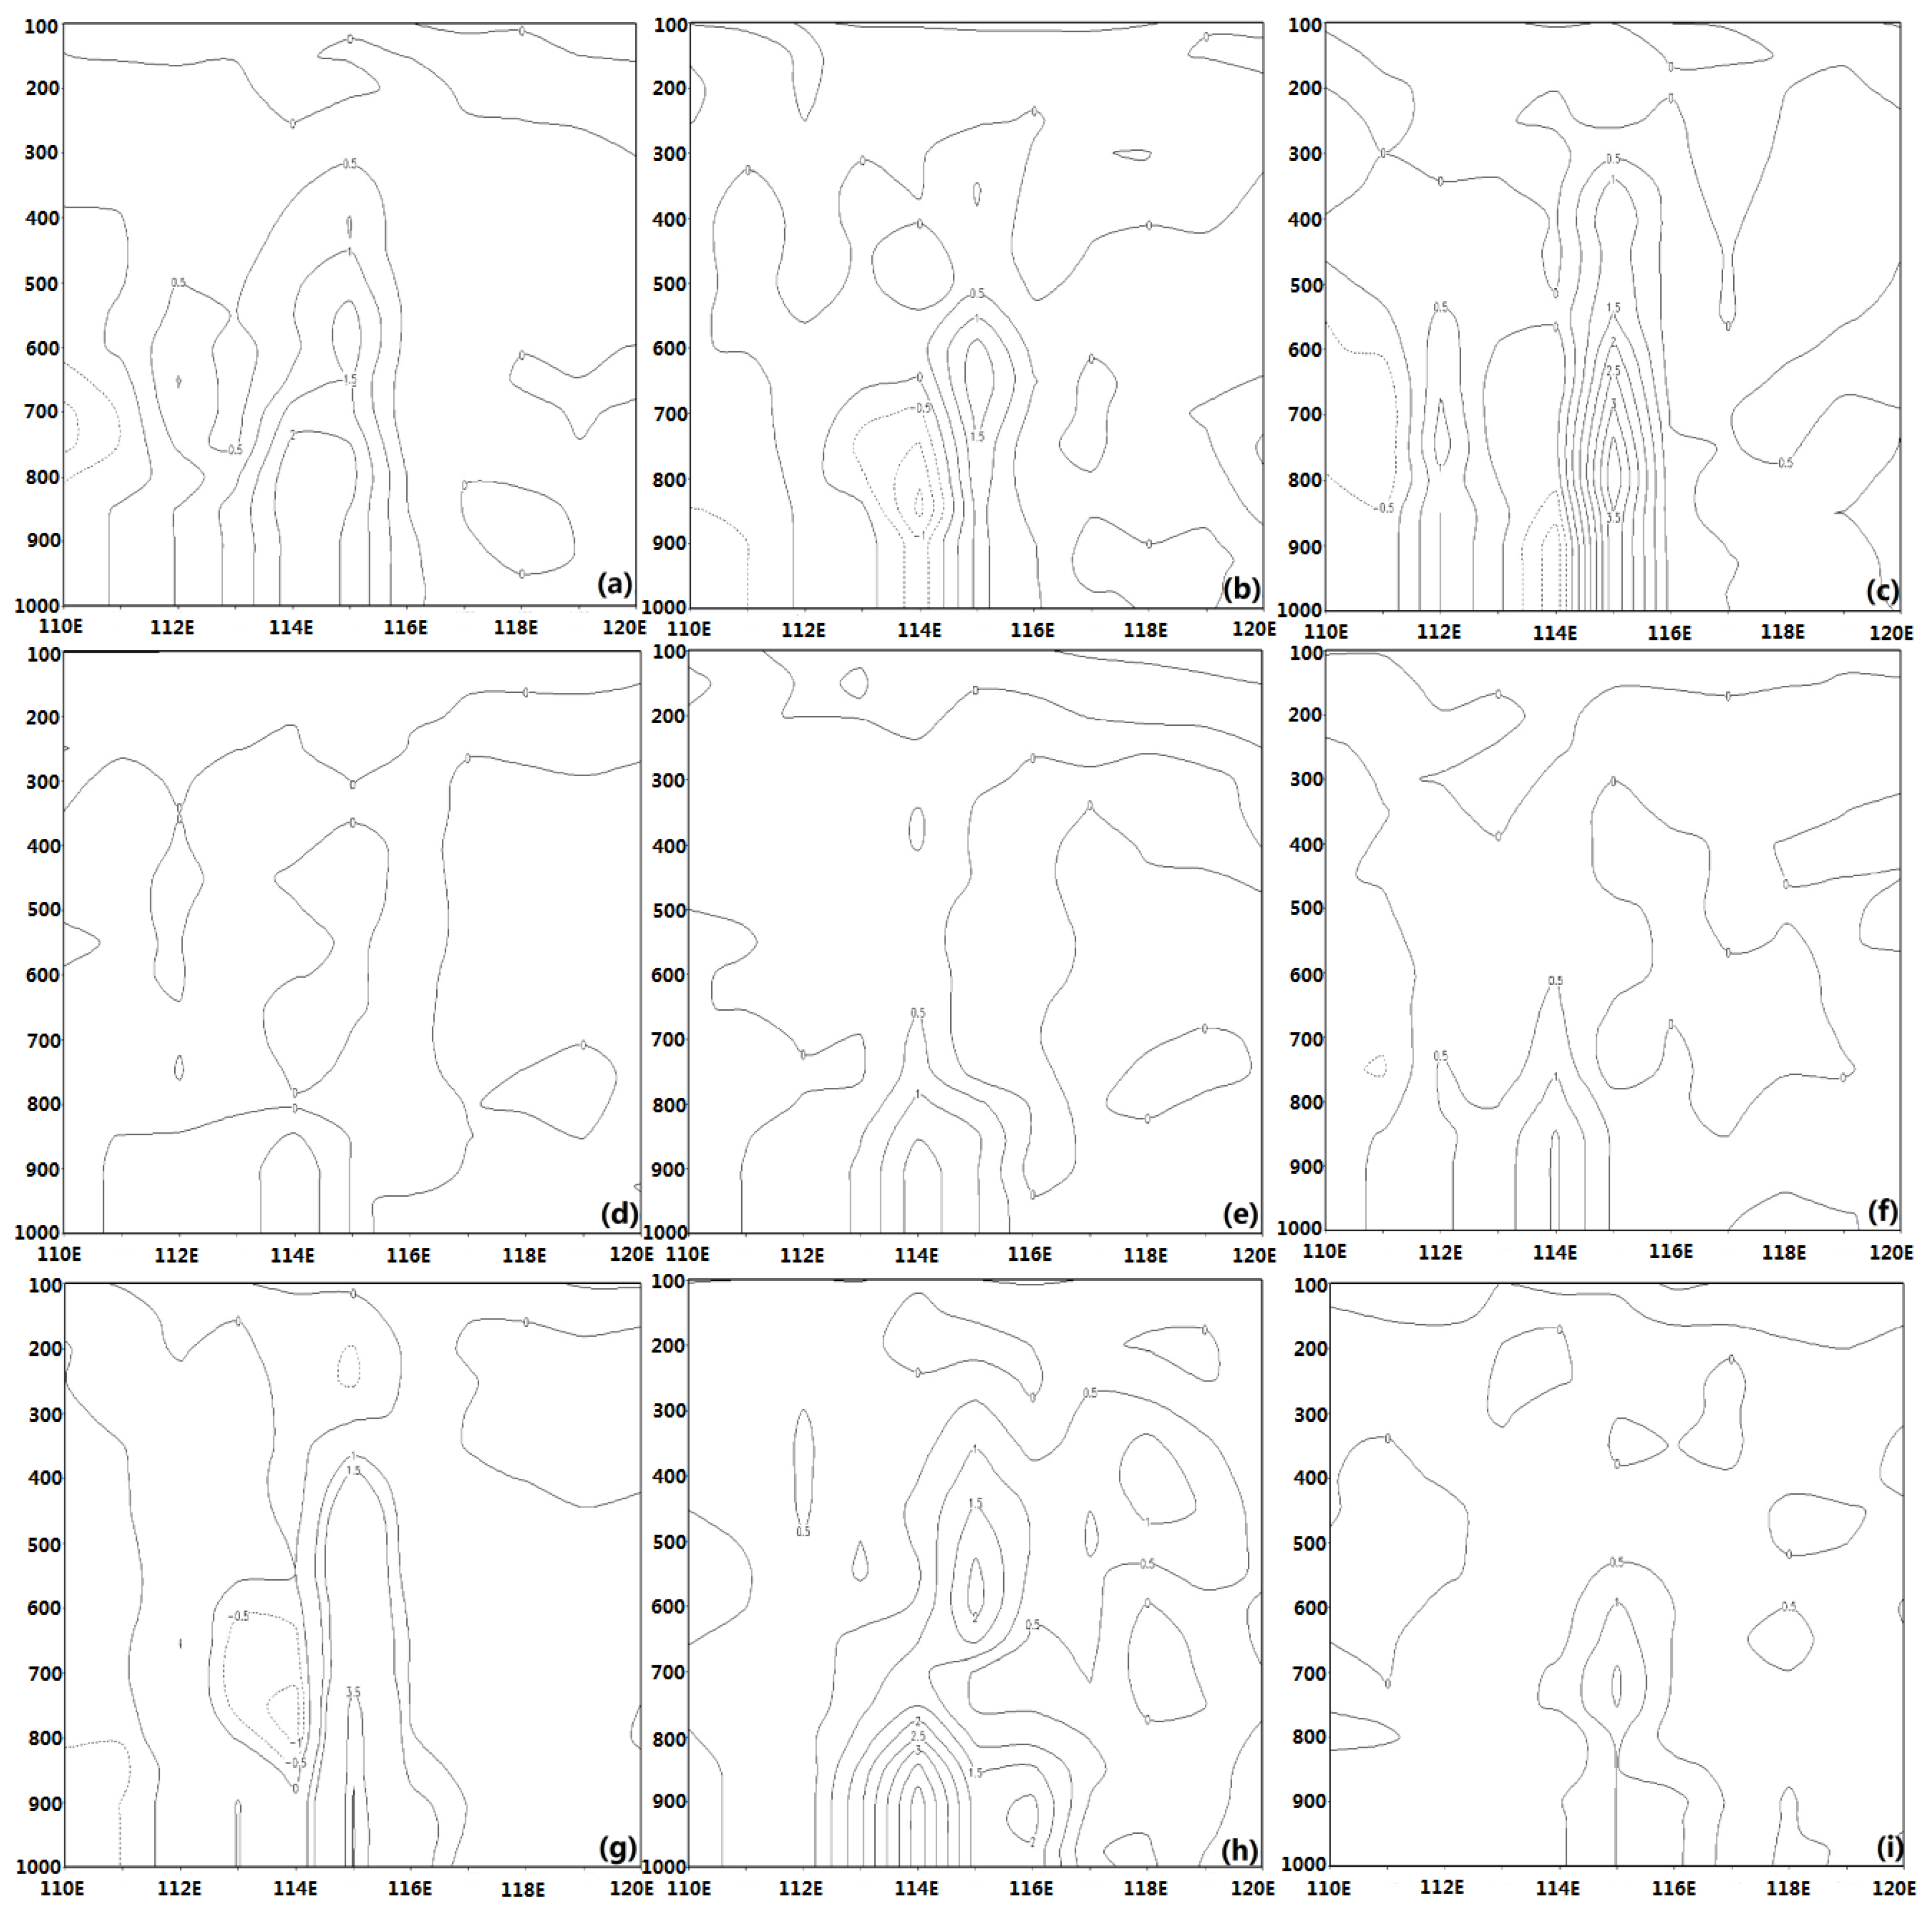
3.3. The Effect of Meteorological Conditions on Aerosol Optical Properties

Meteorological factors and weather conditions have a certain effect on AOD and in terms of the transportation of air pollutants, near-surface wind velocity and the vertical shear of horizontal wind in the lower troposphere will also affect this property. To examine this in the context of the present study, we analyzed some meteorological factors and the weather situation related to the changes in AOD.
Figure 9, Figure 10 and Figure 11 show the respective surface weather situation (including temperature, pressure, cloudiness and wind direction and speed), 850-hPa wind field (the length of arrows represents the wind speed) and vertical velocity field (40°N) at 08:00 on 16–18 August, 14:00 on 26–28 August (the data from 8:00 on 26–28 August were missing and so we used the 14:00 values instead), and 08:00 on 11–13 September in the Beijing area. During 16–18 August in S1, the Beijing area was affected by a low pressure system. On 16 August, the horizontal wind speed was low and the vertical velocity of the whole layer was slow, which was conducive to the accumulation of pollutants rather than a rapid dispersal. On 17 August, the prevailing southerly winds transported pollutants produced in Hebei province to Beijing, while the vertical velocity slightly decreased and large areas of vertical velocity were zero, reflecting the formation of a steady weather system and resulting in further accumulation of pollutants. Through this continuous accumulation, the AOD reached a maximum value on 18 August, and then, due to the passage of a cold front, vertical velocity increased, resulting in decline in AOD. During 26–28 August in S2, Beijing was located in the bottom part of a high pressure center and the back of a low pressure center, with prevailing northerly winds. Dry and clean wind from the north was conducive to the dispersion of pollutants and, together with the restrictive measures, helped the air quality level in Beijing to greatly improve. During 11–13 September in S3, Beijing was located in the front of a high pressure center and the back of a low pressure center. Dry and clean northerly wind and strong vertical convective movement were not conducive to the accumulation of pollutants; rather, they favored their dispersal. Generally speaking, despite the restrictive measures ending and pollutant emissions increasing compared with S2, the AOD in S3 remained at a low level. This was due to the Beijing area being controlled by a high pressure system, along with the pollutant diffusion effect of dry and clean northerly wind. In summary, the meteorological conditions certainly had an influence on AOD. Horizontal wind was conducive to the dispersion of pollutants and their transmission but, due to the different prevailing directions, may have caused local pollutant input or output effects, and weak vertical movement was conducive to the accumulation of pollutants.

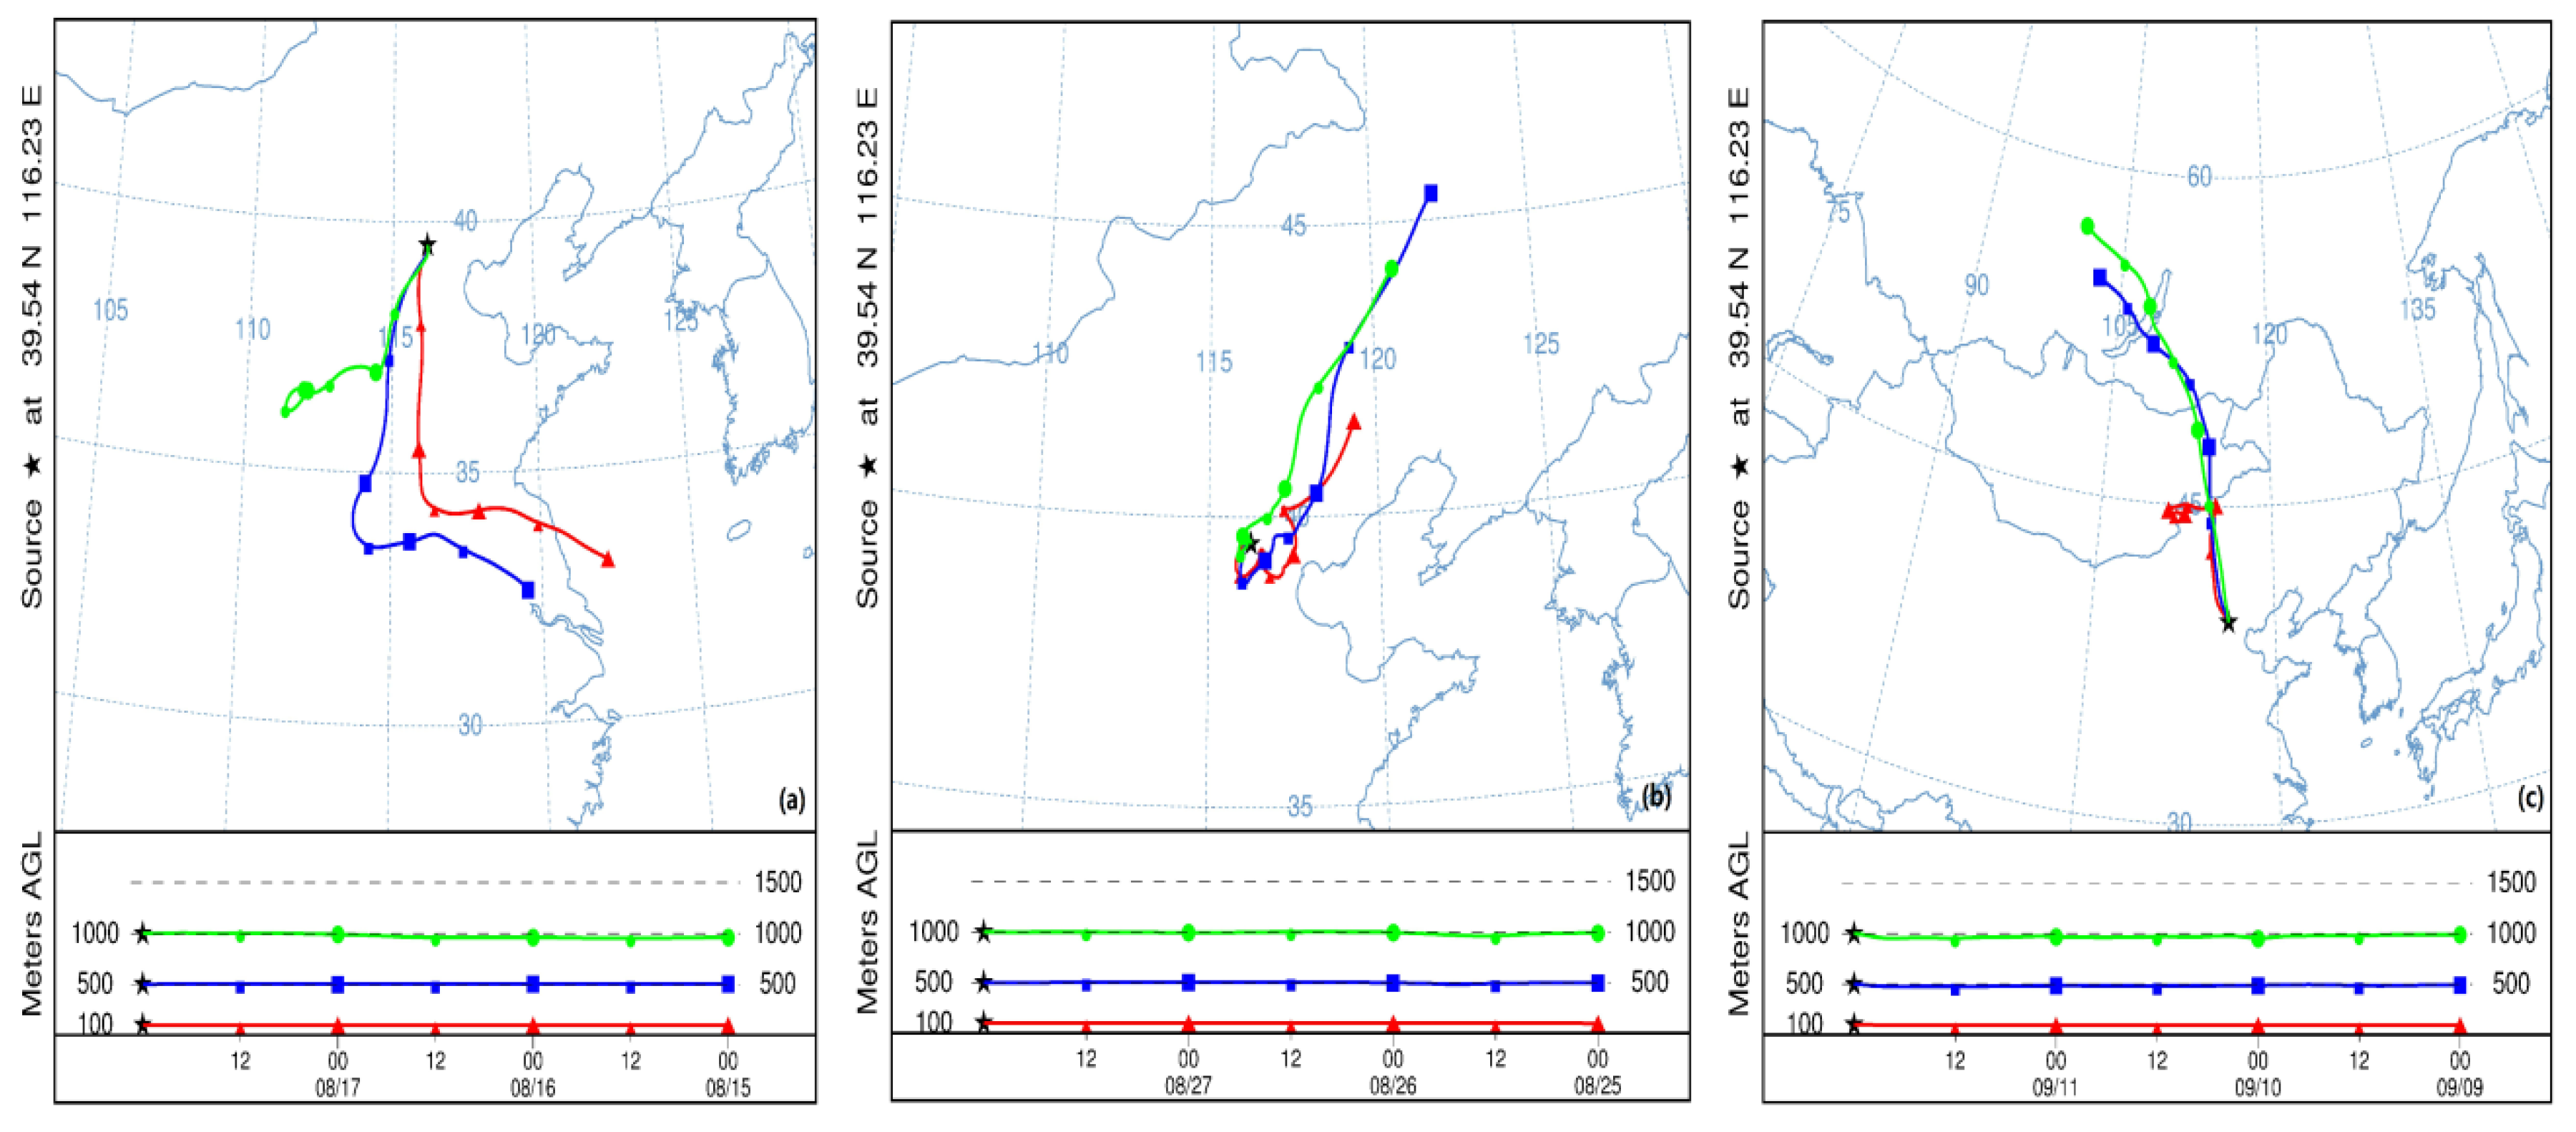
3.4. Backward Trajectory Analysis

Aerosol backward trajectory simulation can not only explain the sources of pollutants and air mass movement direction, but is also closely related to the AOD, SSA and gas column water content. Xia et al. [42] analyzed five years of pollution data in the Beijing area and pointed out that slow-moving aerosol tracks usually possess high AOD and SSA, as well as a high water content. For the present study, Figure 12 shows 72-h simulation results at three heights (100 m, 500 m, 1000 m) in Beijing local time at 08:00 on 18 August, 08:00 on 28 August, and 08:00 on 12 September, and the resolution of HYSPLIT in this case is 1° × 1°. It can be seen that for the more serious pollution on 18 August, at the three different heights, the air mass crossed the northern part of Jiangsu province, Henan province, Hebei province from the southwest of Beijing, and then travelled to the center of Beijing. Along this route are highly polluted areas, meaning such southerly flow easily transports pollutants originating from these regions to Beijing. During the restrictive period, air quality was quite good. On 28 August, the simulation showed the air mass at the three different heights moved mainly from the northeast direction of Beijing. The 500-m and 1000-m air masses moved mainly from the Inner Mongolian province and then crossed the Liaoning province and Hebei province, while the air mass at 100 m was derived from the Hebei province. However, the traffic and emissions measures that were introduced greatly reduced the emissions of pollutants in and around Beijing. The air quality improved under these combined effects. Following the end of the restrictive measures, it can be seen that the air mass on 12 September at the three different heights came from the northwest. Although the control measures had ended, the diffusion conditions for pollutants turned positive because of the dry clean air. This, together with the wet removal effect of precipitation, caused the air quality in Beijing during this period to remain improved.

4. Conclusions

This study used AERONET observations and inversion data together with ground PM measurements to analyze aerosol optical properties in the Beijing area from 6 August to 17 September 2015, a period when control measures were introduced to curb factory and vehicle emissions because of the occurrence of the World Athletics Championships and the Victory Day military parade. The influence of meteorological conditions on aerosol optical properties was also considered by using NCEP reanalysis data. Lastly, the pollutant sources were analyzed using the HYSPLIT model.
The main conclusions can be summarized as follows. The sources of pollutants in Beijing were mainly associated with human activity. When the restrictive measures came into force, air quality improved significantly. A decreased AOD of ~69% and an increased proportion of fine particles of ~9.5% were measured. The aerosol size distribution showed an obvious double peak distribution, and the peak value of fine and coarse particles reached their highest levels before the restrictive measures were introduced. During the period of restrictive measures, the AAOD was at its lowest (about 0.008 ± 0.009), but the SSA was at its highest (about 0.944 ± 0.045), indicating a strong scattering property.
Meteorological conditions certainly also had an effect on the aerosol optical properties. The high horizontal wind speed and the direction of dry and clean wind at particular times were beneficial to the diffusion of pollutants locally, which allowed the air quality to improve. However, the relatively low vertical velocity at other times was beneficial to the accumulation of pollutants. According to the backward trajectory analysis, air masses in the period of serious pollution derived mainly from polluted cities located to the south of Beijing. When the air quality was improved, this was mainly a result of air masses transported from the northwest.
Finally, precipitation also had a pronounced effect on improving the air quality. Precipitation can carry air pollutants down to the ground through the process of wet removal, enabling the air quality to improve and making the meteorology the dominant factor at times. Indeed, the overall improvement in air quality at certain times during this study period was a combined result of human intervention (i.e., the introduction of pollution control measures) and meteorological factors. This study revealed the facts of the observation during the restrictive period. But the precise contributions of meteorological factors and restrictive measures need to be evaluated in greater detail by numerical models combined with the analysis of precipitation to allow for a better overall understanding of the relative influences.

Acknowledgments

This work is financially supported by grants from the Project (41375153) supported by NSFC, the National Key Project of Basic Research (2014CB441201), the CAMS Basis Research Project (2014R17), the Climate Change Special Fund of CMA (CCSF201504) and Hangzhou Science and Technology Innovative project (20150533B17).

Author Contributions

Yu Zheng wrote the article; Huizheng Che and Tianliang Zhao conceived and designed the experiments; Yu Zheng, Ke Gui, Linchang An and Bing Qi performed the experiments; Yu Zheng and Jie Yu analyzed the data; Xiangao Xia, Hong Wang, Yaqiang Wang and Xiaoye Zhang helped perform the statistical analysis.

Conflicts of Interest

The authors declare no conflict of interest.

References

  1. Hansen, J.; Sato, M.; Ruedy, R.; Lacis, A.; Oinas, V. Global warming in the twenty-first century: An alternative scenario. Proc. Natl. Acad. Sci. USA 2000, 97, 9875–9880. [Google Scholar] [CrossRef] [PubMed]
  2. Qiu, J.; Yang, L. Variation characteristics of atmospheric aerosol optical depths and visibility in North China during 1980–1994. Atmos. Environ. 2000, 34, 603–609. [Google Scholar]
  3. Baklanov, A.; Schlünzen, K.; Suppan, P.; Baldasano, J.; Brunner, D.; Aksoyoglu, S.; Carmichael, G.; Douros, J.; Flemming, J.; Forkel, R.; et al. Online coupled regional meteorology chemistry models in Europe: Current status and prospects. Atmos. Chem. Phys. 2014, 14, 317–398. [Google Scholar] [CrossRef] [Green Version]
  4. Ramanathan, V.; Crutzen, P.J.; Lelieveld, J.; Mitra, A.P.; Althausen, D.; Anderson, J.; Andreae, M.O.; Cantrell, W.; Cass, G.R.; Chung, C.E.; et al. Indian Ocean Experiment: An integrated analysis of the climate forcing and effects of the great Indo-Asian haze. J. Geophys. Res. 2001, 106, 28371–28398. [Google Scholar] [CrossRef]
  5. Wiegner, M.; Madonna, F.; Binietoglou, I.; Forkel, R.; Gasteiger1, J.; Geiß1, A.; Pappalardo, G.; Schäfer, K.; Thomas, W. What is the benefit of ceilometers for aerosol remote sensing? An answer from EARLINET. Atmos. Meas. Tech. 2014, 7, 1979–1997. [Google Scholar] [CrossRef]
  6. Pappalardo, G.; Amodeo, A.; Apituley, A.; Comeron, A.; Freudenthaler, V.; Linné, H.; Ansmann, A.; Bösenberg, J.; D’Amico, G.; Mattis, I.; et al. EARLINET: Towards an advanced sustainable European aerosol lidar network. Atmos. Meas. Tech. 2014, 7, 2389–2409. [Google Scholar] [CrossRef] [Green Version]
  7. Kulmala, M.; Asmi, A.; Lappalainen, H.K.; Baltensperger, U.; Brenguier, J.L.; Facchini, M.C.; Hansson, H.C.; Hov, Ø.; O’Dowd, C.D.; Pöschl, U.; et al. General overview: European Integrated project on Aerosol Cloud Climate and Air Quality interactions (EUCAARI)-integrating aerosol research from nano to global scales. Atmos. Chem. Phys. 2011, 11, 13061–13143. [Google Scholar] [CrossRef] [Green Version]
  8. Huebert, B.J.; Bates, T.; Russell, P.B.; Shi, G.; Kim, Y.J.; Kawamura, K.; Carmichael, G.; Nakajima, T. An overview of ACE-Asia: Strategies for quantifying the relationships between Asian aerosols and their climatic impacts. J. Geophys. Res. 2003. [Google Scholar] [CrossRef]
  9. Stocker, T.F. Climate Change 2013: The Physical Science Basis: Working GROUP I Contribution to the Fifth Assessment Report of the Intergovernmental Panel on Climate Change; Cambridge University Press: Cambridge, UK, 2014. [Google Scholar]
  10. Watson, J.G. Visibility: Science and regulation. J. Air Waste Manag. 2002, 52, 628–713. [Google Scholar] [CrossRef]
  11. Luo, Y.; Lu, D.; Zhou, X.; Li, W.; He, Q. Characteristics of the spatial distribution and yearly variation of aerosol optical depth over China in last 30 years. J. Geophys. Res. 2001, 106, 14501–14513. [Google Scholar]
  12. Che, H.; Shi, G.; Uchiyama, A.; Yamazaki, A.; Chen, H.; Goloub, P.; Zhang, X. Intercomparison between aerosol optical properties by a PREDE skyradiometer and CIMEL sunphotometer over Beijing, China. Atmos. Chem. Phys. 2008, 8, 3199–3214. [Google Scholar] [CrossRef]
  13. Li, Z.; Gu, X.; Wang, L.; Li, D.; Xie, Y.; Li, K.; Dubovik, O.; Schuster, G.; Goloub, P.; Zhang, Y.; et al. Aerosol physical and chemical properties retrieved from ground-based remote sensing measurements during heavy haze days in Beijing winter. Atmos. Chem. Phys. 2013, 13, 10171–10183. [Google Scholar] [CrossRef] [Green Version]
  14. Che, H.; Zhang, X.; Li, Y.; Zhou, Z.; Qu, J.J. Horizontal visibility trends in China 1981–2005. J. Geophys. Res. Lett. 2007. [Google Scholar] [CrossRef]
  15. Che, H.; Shi, G.Y.; Zhang, X.Y.; Arimoto, R.; Zhao, J.Q.; Xu, L.; Wang, B.; Chen, Z.H. Analysis of 40 years of solar radiation data from China, 1961–2000. Geophys. Res. Lett. 2005. [Google Scholar] [CrossRef]
  16. Xu, J.; Bergin, M.H.; Yu, X.; Liu, G.; Zhao, J.; Carrico, C.M.; Baumann, K. Measurement of aerosol chemical, physical and radiative properties in the Yangtze delta region of China. Atmos. Environ. 2002, 36, 161–173. [Google Scholar] [CrossRef]
  17. Xu, X.; Xie, L.; Ding, G.; Bian, L. Beijing air pollution project to benefit 2008 Olympic Games. Bull. Am. Meteorol. Soc. 2005, 86, 1543–1544. [Google Scholar] [CrossRef]
  18. D’Almeida, A.G.; Koepke, P.; Shettle, E.P.H. Atmospheric Aerosols: Global Climatology and Radiative Characteristics; A. Deepak Publishing: Hampton, VA, USA, 1991. [Google Scholar]
  19. Chen, Y.; Bond, T.C. Light absorption by organic carbon from wood combustion. Atmos. Chem. Phys. 2010, 10, 1773–1787. [Google Scholar] [CrossRef]
  20. Wagner, R.; Ajtai, T.; Kandler, K.; Lieke, K.; Linke, C.; Muller, T.; Schnaiter, M.; Vragel, M. Complex refractive indices of Saharan dust samples at visible and near UV wavelengths: A laboratory study. Atmos. Chem. Phys. 2012, 12, 2491–2512. [Google Scholar] [CrossRef]
  21. Wang, X.; Huang, J.; Zhang, R.; Chen, B.; Bi, J. Surface measurements of aerosol properties over northwest China during ARM China 2008 deployment. J. Geophys. Res. 2010. [Google Scholar] [CrossRef]
  22. Zhang, R.; Jing, J.; Tao, J.; Hsu, S.-C.; Wang, G.; Cao, J.; Lee, C.S.L.; Zhu, L.; Chen, Z.; Zhao, Y.; et al. Chemical characterization and source apportionment of PM2.5 in Beijing: Seasonal perspective. Atmos. Chem. Phys. 2013, 13, 7053–7074. [Google Scholar] [CrossRef]
  23. Che, H.; Zhang, X.; Xia, X.; Goloub, P.; Holben, B.; Zhao, H.; Wang, Y.; Zhang, X.; Wang, H.; Blarel, L.; et al. Ground-based aerosol climatology of China: Aerosol optical depths from the China Aerosol Remote Sensing Network (CARSNET) 2002–2013. Atmos. Chem. Phys. 2015, 15, 7619–7652. [Google Scholar] [CrossRef]
  24. Che, H.; Zhao, H.; Wu, Y.; Xia, X.; Zhu, J.; Dubovik, O.; Estelles, V.; Ma, Y.; Wang, Y.; Wang, H.; et al. Application of aerosol optical properties to estimate aerosol type from ground-based remote sensing observation at urban area of northeastern China. J. Atmos. Sol. Terr. Phys. 2015, 132, 37–47. [Google Scholar] [CrossRef]
  25. Che, H.; Xia, X.; Zhu, J.; Wang, H.; Wang, Y.; Sun, J.; Zhang, X.; Shi, G. Aerosol optical properties under the condition of heavy haze over an urban site of Beijing, China. Environ. Sci. Pollut. R. 2014, 22, 1043–1053. [Google Scholar] [CrossRef] [PubMed]
  26. Che, H.; Xia, X.; Zhu, J.; Li, Z.; Dubovik, O.; Holben, B.; Goloub, P.; Chen, H.; Estelles, V.; Cuevas-Agulló, E.; et al. Column aerosol optical properties and aerosol radiative forcing during a serious haze-fog month over North China Plain in 2013 based on ground-based sunphotometer measurements. Atmos. Chem. Phys. 2014, 14, 2125–2138. [Google Scholar] [CrossRef]
  27. Eck, T.F.; Holben, B.N.; Sinyuk, A.; Pinker, R.T.; Goloub, P.; Chen, H.; Chatenet, B.; Li, Z.; Singh, R.H.; Tripathi, S.N.; et al. Climatological aspects of the optical properties of fine/coarse mode aerosol mixtures. J. Geophys. Res. 2010. [Google Scholar] [CrossRef]
  28. Zhang, X.Y.; Wang, Y.Q.; Lin, W.L.; Zhang, Y.M.; Zhang, X.C.; Zhao, P.; Yang, Y.Q.; Wang, J.Z.; Hou, Q.; Che, H.Z.; et al. Changes of Atmospheric Composition and Optical Properties over BEIJING—2008 Olympic Monitoring Campaign. Bull. Am. Meteorol. Soc. 2009. [Google Scholar] [CrossRef]
  29. Guo, S.; Hu, M.; Guo, Q.; Zhang, X.; Schauer, J.J.; Zhang, R. Quantitative evaluation of emission controls on primary and secondary organic aerosol sources during Beijing 2008 Olympics. Atmos. Chem. Phys. 2013, 13, 8303–8314. [Google Scholar] [CrossRef]
  30. Huang, K.; Zhang, X.; Lin, Y. The “APEC Blue” phenomenon: Regional emission control effects observed from space. Atmos. Res. 2015, 164, 65–75. [Google Scholar] [CrossRef]
  31. Meng, R.; Zhao, F.R.; Sun, K.; Zhang, R.; Huang, C.; Yang, J. Analysis of the 2014 “APEC Blue” in Beijing Using More than One Decade of Satellite Observations: Lessons Learned from Radical Emission Control Measures. Remote Sens. 2015, 7, 15224–15243. [Google Scholar] [CrossRef]
  32. Holben, B.N.; Eck, T.F.; Slutsker, I.; Tanre, D.; Buis, J.P.; Setzer, A.; Vermote, E.; Reagan, J.A.; Kaufman, Y.J.; Nakajima, T.; et al. AERONET-A federated instrument network and data archive for aerosol Characterization. Remote Sens. Environ. 1998, 66, 1–16. [Google Scholar] [CrossRef]
  33. Che, H.; Zhang, X.; Chen, H.; Damiri, B.; Goloub, P.; Li, Z.; Zhang, X.; Wei, Y.; Zhou, H.; Dong, F.; et al. Instrument calibration and aerosol optical depth validation of the China Aerosol Remote Sensing Network. J. Geophys. Res. 2009. [Google Scholar] [CrossRef]
  34. Eck, T.F.; Holben, B.N.; Reid, J.S.; Dubovik, O.; Smirnov, A.; O’Neill, N.T.; Slutsker, I.; Kinne, S. Wavelength Dependence of the Optical Depth of Biomass, Urban and Desert Dust Aerosols. J. Geophys. Res. 1999, 104, 31333–31350. [Google Scholar] [CrossRef]
  35. Draxler, R.R.; Hess, G.D. Description of the HYSPLIT_4 modeling system. In Memo ERL ARL-224; National Oceanic and Atmospheric Administration: Silver Springs, MD, USA, 1997; Volume 12, pp. 197–199. [Google Scholar]
  36. Zhao, H.; Ma, Y.; Wang, Y.; Zhu, Y. Aerosol optical characteristics and its influencing factor over Shenyang. J. Meteorol. Environ. 2015, 31, 43–49. [Google Scholar]
  37. Liu, Y.; Niu, S.; Zheng, Y. Optical depth characteristics of Yinchuan atmospheric aerosols based on the CE-318 sun tracking spectrophotometer data. J. Nanjing Inst. Meteorol. 2004, 27, 615–622. [Google Scholar]
  38. Zhao, X.; Xu, Z.; Wang, X.; Wang, J. Analysis of Beijing cars with licese plates allowed on the streets on air quality impact. J. Saf. Environ. 2010, 4, 82–87. [Google Scholar]
  39. Liu, Y.; Bi, S.; Zhou, B.; Wang, C.; Liao, H.; Li, L.; Cai, M. Study on vehicular emission reduction effect of traffic control in Foshan central district. China Environ. Sci. 2010, 11, 1563–1567. [Google Scholar]
  40. Dubovik, O.; Holben, B.; Eck, T.F.; Smirnov, A.; Kaufman, Y.J.; King, M.D.; Tanré, D.; Slutsker, I. Variability of absorption and optical properties of key aerosol types observed in worldwide locations. J. Atmos. Sci. 2002, 59, 590–608. [Google Scholar] [CrossRef]
  41. Watson, J.G.; Chow, J.C.; Lurmann, F.W.; Musarra, S.P. Ammonium nitrate, nitric acid, and ammonia equilibrium in wintertime Phoenix, Arizona. J. Air Waste Manag. 1994, 44, 405–412. [Google Scholar] [CrossRef]
  42. Xia, X.; Chen, H.; Zhang, W. Analysis of the dependence of column-integrated aerosol properties on long-range transport of air masses in Beijing. Atmos. Environ. 2007, 41, 7739–7750. [Google Scholar] [CrossRef]
Figure 1. Key regions in China where restrictive measures were implemented. The red star represents the Beijing measurement site.
Atmosphere 07 00047 g001
Figure 2. Daily mean values of AOD440nm and PM2.5.
Atmosphere 07 00047 g002
Figure 3. Linear fitting of PM2.5 (a) and PM10 (b) with AOD440.
Atmosphere 07 00047 g003aAtmosphere 07 00047 g003b
Figure 4. Daily variation (a) and Daily averages (b) of AOD and AE.
Atmosphere 07 00047 g004
Figure 5. Variation of mean SSA at different wavelengths.
Atmosphere 07 00047 g005
Figure 6. Variation in mean AAOD at different wavelengths.
Atmosphere 07 00047 g006
Figure 7. Variation of the imaginary part of the complex refractive index at different wavelengths.
Atmosphere 07 00047 g007
Figure 8. Daily average and stage average aerosol volume distribution.
Atmosphere 07 00047 g008
Figure 9. Surface weather situation at 08:00 (ac) on 16–18 August; 14:00 (df) on 26–28 August; and 08:00 (gi) on 11–13 September in the Beijing area.
Atmosphere 07 00047 g009
Figure 10. Wind field at 850 hPa at 08:00 (ac) on 16–18 August; 14:00 (df) on 26–28 August; and 08:00 (gi) on 11–13 September in the Beijing area. The red star represents the Beijing measurement site.
Atmosphere 07 00047 g010
Figure 11. Cross-section of vertical velocity along the latitude of 40°N at 08:00 (ac) on 16–18 August; 14:00 (df) on 26–28 August; and 08:00 (gi) on 11–13 September in the Beijing area.
Atmosphere 07 00047 g011
Figure 12. The 72-h backward air trajectories arriving at three hights in Beijing local time at (a) 08:00 on 18 August; (b) 08:00 on 28 August; and (c) 08:00 on 12 September.
Atmosphere 07 00047 g012
Table 1. Parameters of aerosol optical properties (r* is effective radius; r is volume median radius, F is fine mode fraction; Cf/Cc is the ratio of fine mode volume concentration to coarse; k440nm is the imaginary part of the complex refractive index at 440 nm).
ParameterOptical Properties
AOD440nmα440nm–870nmSSA440nmr*, rf (μm)r*, rc (μm)FCf/Cck440nm
S1Mean1.111.260.94(0.17, 0.19)(2.62, 3.14)0.861.410.0076
SD0.820.270.03(0.04, 0.05)(0.22, 0.23)0.091.070.0047
S2Mean0.341.380.95(0.16, 0.14)(2.27, 2.81)0.821.500.0061
SD0.200.250.04(0.03, 0.04)(0.46, 0.50)0.150.920.0050
S3Mean0.621.580.93(0.15, 0.16)(2.48, 3.03)0.851.230.0078
SD0.590.110.04(0.02, 0.02)(0.35, 0.40)0.090.720.0054

