1. Introduction
Atmospheric aerosols influence the Earth’s radiation both directly and indirectly due to their optical properties [
1]. Optical properties of aerosols, such as scattering and absorption, are wavelength dependent and rely on their size distribution, shape, chemical composition and the mixing state, which is also a strong function of relative humidity (RH) [
2,
3]. One of the main compositions, which need to be validated for an accurate understanding of the optical properties of aerosols, is organic carbon (OC). Components of OC account for a large, sometimes even dominant, fraction of air particulate matter. They influence the physico-chemical properties of aerosol particles and affect the atmosphere and climate [
1,
2]. These effects usually occur through interaction with reactive gases, water vapor, precipitation, radiation,
etc. OC can influence the biosphere and human health, through microorganisms. They are also known to have an impact on respiratory and cardiovascular functions, and cause allergies [
4].
It has generally been reported that particles and components of OC originate from direct emissions (primary organic carbon), as well as from chemical reactions and gas-to-particle conversions in the atmosphere (secondary organic carbon). At present, our understanding of the physico-chemical properties of OC is limited, and given their importance, the estimation of their environmental effects is uncertain. According to previous studies, hundreds of different atmospheric organic compounds have been detected [
5,
6], making the estimation of the direct and indirect effects extremely difficult [
7]. Among the different characteristics of organic carbon, hygroscopicity and light absorption are important for determining the aerosol optical properties [
8]. For example, water-soluble aerosols absorb water and grow (hygroscopic growth). The rate of hygroscopic growth is a function of the relative humidity and the composition of the aerosols, as well as the size distribution of their particles. Subsequently, the changes in the physical and chemical characteristics of the aerosols can change their optical properties. Along with hygroscopicity, another important characteristic to be considered in determining the optical properties of OC is its light absorption. Observational evidence suggests that some OC compounds from fossil fuels are weakly absorbent at some ultraviolet and visible wavelengths (e.g., [
9,
10,
11]). Jung
et al. (2015) [
8] developed a size-resolved model for calculating the optical properties of OC by combining its thermodynamic hygroscopic growth and aerosol dynamics models [
12]. In order to properly estimate the optical properties using composition based measurement, information for the size distribution, chemical composition as well as aerosol mixture should be given. However, many studies, especially long term routine measurements find it difficult to provide all this information regarding OC, which require sensitivity tests for accurately estimating the range of reliability.
In this study, the sensitivity of OC to aerosol optical properties was estimated. We focused particularly on the contribution of OC based on its optical properties, including absorption and hygroscopicity. The aerosol optical properties are simulated by combining the aerosol dynamic model for polydispersed aerosols with the optical properties model [
2,
13]. The measurement data are from the filter-based monthly averaged sampling data from an intensive observation site in Seoul, Korea [
14]. Both the refractive index and the hygroscopicity of OC were considered, and their sensitivity was tested. The optical properties thus obtained, such as extinction, scattering and absorption coefficient, were compared with the AERONET Aerosol Optical Thickness (AOT) measurement data.
2. Measurement and Data
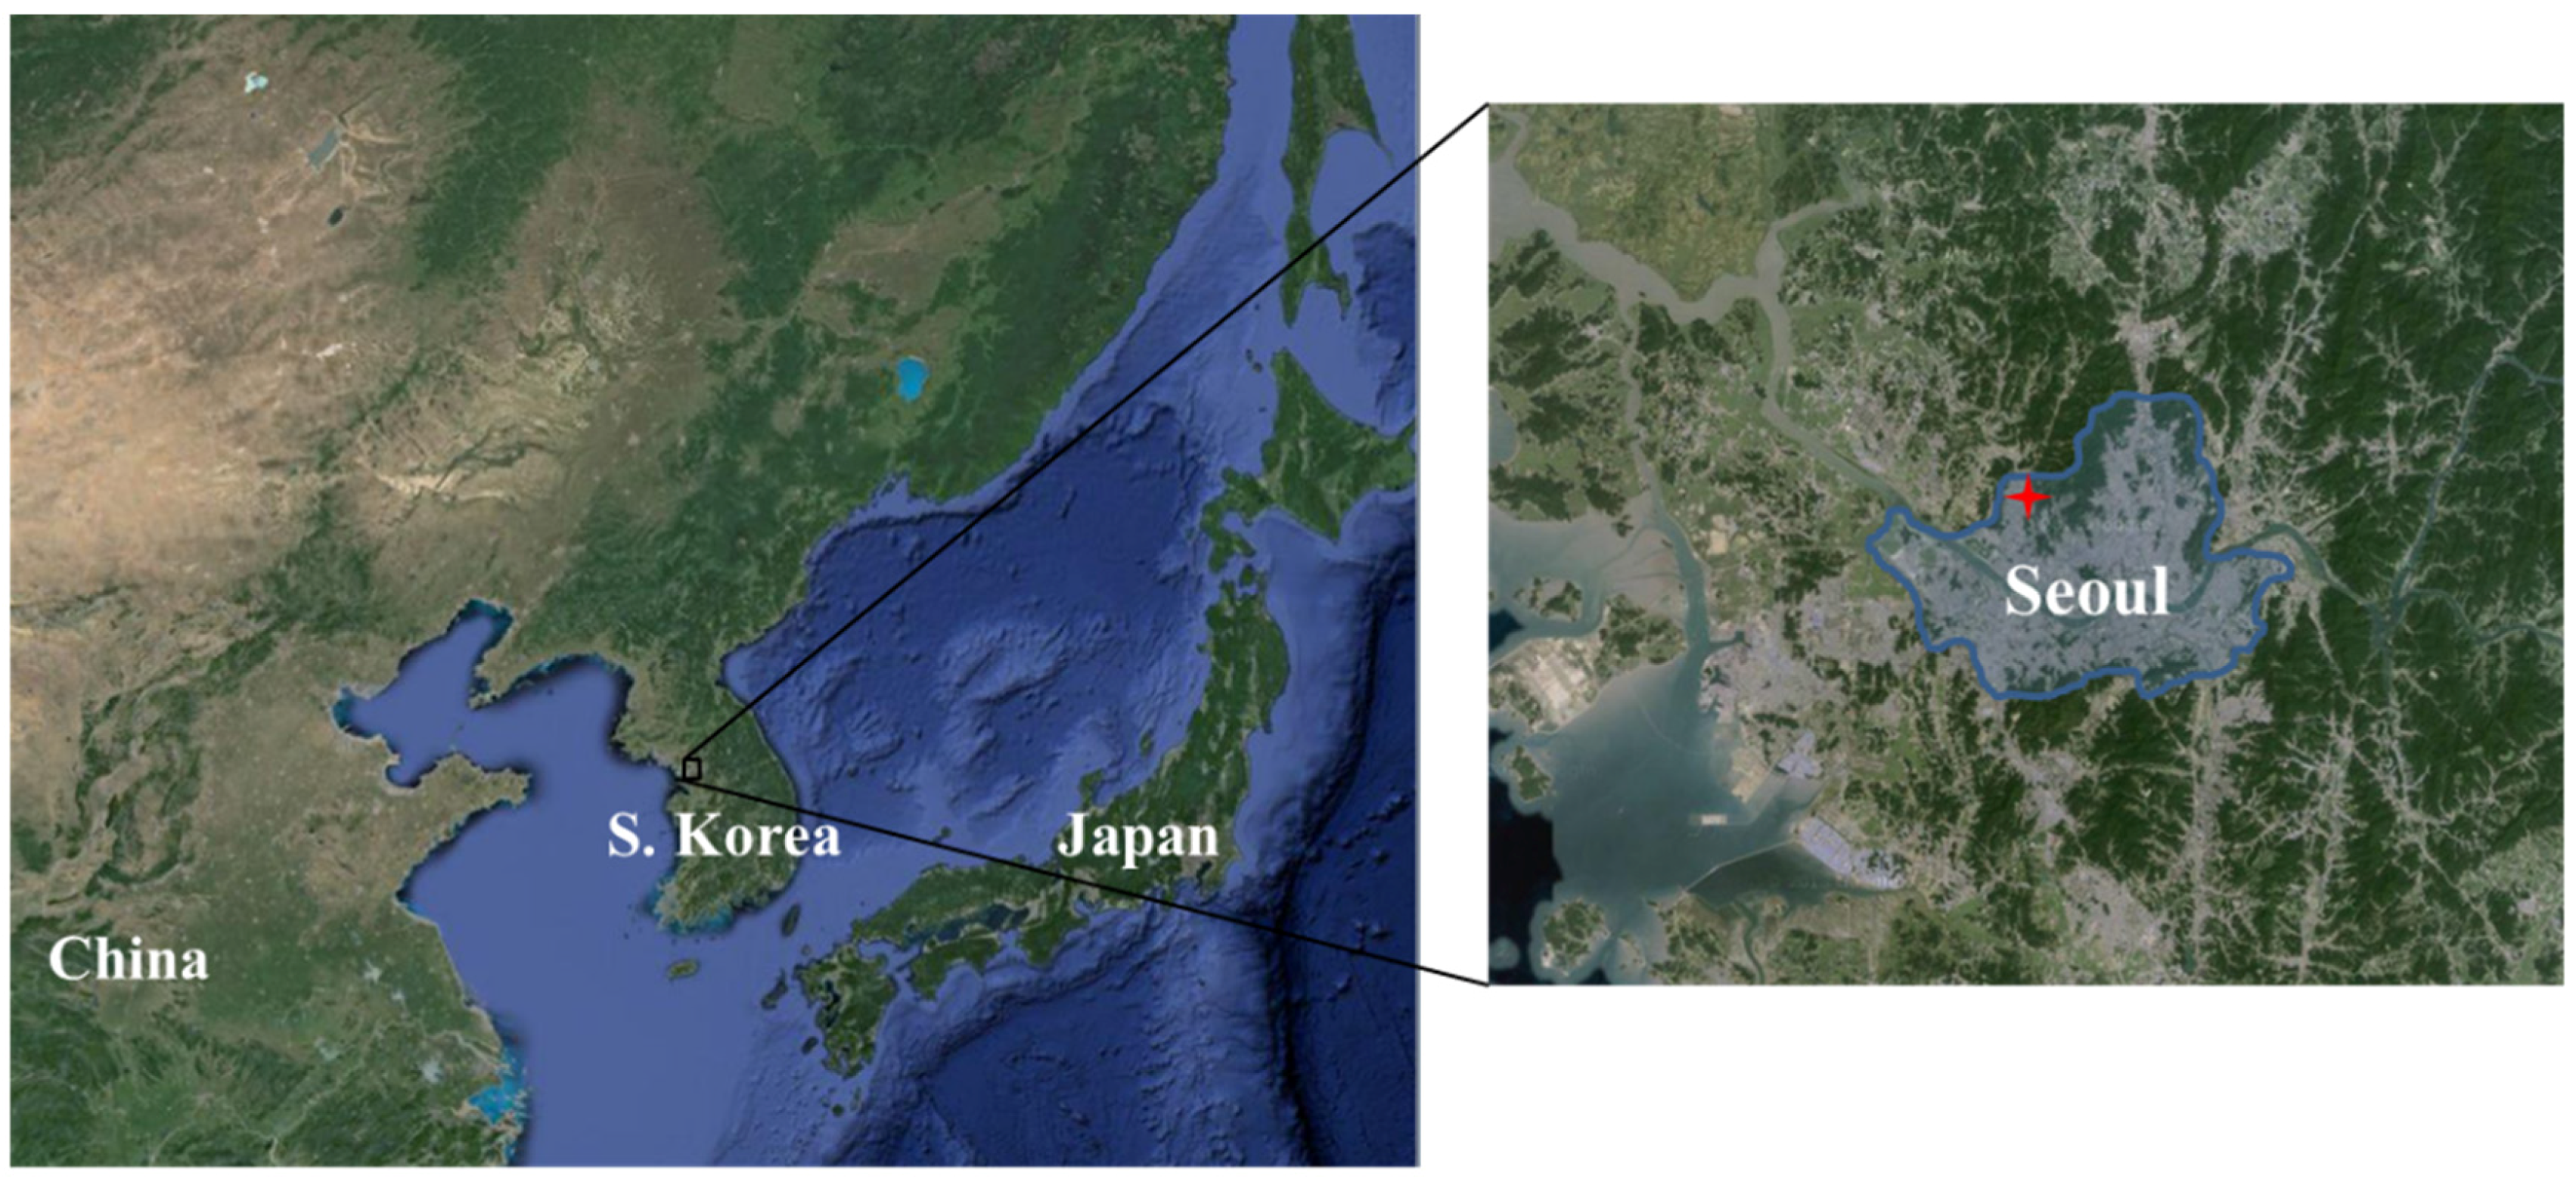
We used the data published in 2011 at the intensive monitoring station in Seoul, Korea (SIMS) operated by the National Institute of Environmental Research (NIER) [
11]. Basically, measurements were conducted 24 hours a day and the monthly averaged concentrations, calculated using the 24 h data, were considered. SIMS is located in northwest Seoul and is adjacent to the Bukhansan National Park to the north and the suburban area to the northwest, as shown in
Figure 1. To the south and southeast of downtown Seoul, residential and heavy traffic areas are located. Thus, SIMS represents the complexity of a typical urban area well. During the study periods, PM
2.5 (fine particles in the air 2.5 μm or less in size) bounded components such as water-soluble ions (mainly sulfate, nitrate and ammonium), carbonaceous materials (elemental carbon and organic carbon) and elements, which are revealed as the major components of PM
2.5, were continuously monitored on an hourly basis. Because of some operational problems, the sampling periods for analysis are from 1 April to 31 December 2011.
A brief description of the monitoring methods is as follows. An ambient air monitor (AIM, URG 9000D, URG Co., USA) was used for ion monitoring. The air flowed into the liquid diffusion denuder via a PM
2.5 inlet at a flow rate of 3 L/min to collect the gaseous pollutants. After that, the particulate matters were grown in a glass cyclone inside a super-saturation chamber with high temperature steam and collected into the sampling syringes. Liquid samples collected during 55 min were separately injected into the cation and anion ion chromatography equipment (ICS-2000, Dionex Co., column IonPag AG19, AS19; column IonPag CG12, CS12A) for analysis. In order to ensure the accuracy of real-time analysis, monthly standard calibration was conducted in this study. The blank test, using a blank filter at the end of the inlet, was also carried out every month. Equivalent ratio and ion mass balance equation were used to validate the accuracy of the ion data. The ion mass balance equation used in this study is as shown in Equation (1)
Atmospheric carbonaceous materials were monitored by SECOC analyzer on an hourly basis using modified NIOSH method 5040. The instruments were equipped with PM
2.5 cyclone for the sampler inlet and organic denuders to remove the gaseous organic carbons. Samples were collected for 45 min at a flow rate of 8 L/min, on the 47 mm quartz filters (TISSUQUARTZ, Gelman Sciences). After the samples were collected, the oven was purged with helium and heated to 840 °C using a stepped temperature ramp. Then, the thermally desorbed organic compounds and the pyrolysis products were placed inside a manganese dioxide (MnO
2) oxidizing oven. The carbon fragments, which were converted to CO
2 gas in the MnO
2 oven, were measured directly by a self-contained non-dispersive infrared (NDIR) detector system. A second temperature ramp was then initiated in the oxidizing gas stream so that any elemental carbon was oxidized off the filter and put into the oxidizing oven. The elemental carbon was then detected in the same manner as the organic carbon. Elements such as Si, K, Ca, Ti, V, Cr, Mn, Fe, Co, Ni, Zn, As, Se and Pb were monitored using online-XRF (Xact 620, Cooper Co.). This instrument is based on a reel to reel (RTR) filter tape sampling, followed by a nondestructive X-ray fluorescence (XRF) analysis of the metals. It consists of a PM
2.5 inlet, a temperature sensor, a sampling module, an analysis module and a flow control module. Samples were collected for 45 min at 16.7 L/min flow rate on the Teflon filters and analyzed by XRF. More details on the monitoring methods are described in NIER (2012) [
14]. The measured aerosol concentration can be used for calculating various aerosol optical properties such as MEE, MSE, and MAE, which stand for aerosol mass extinction, scattering, and absorption efficiency, respectively.
4. Results
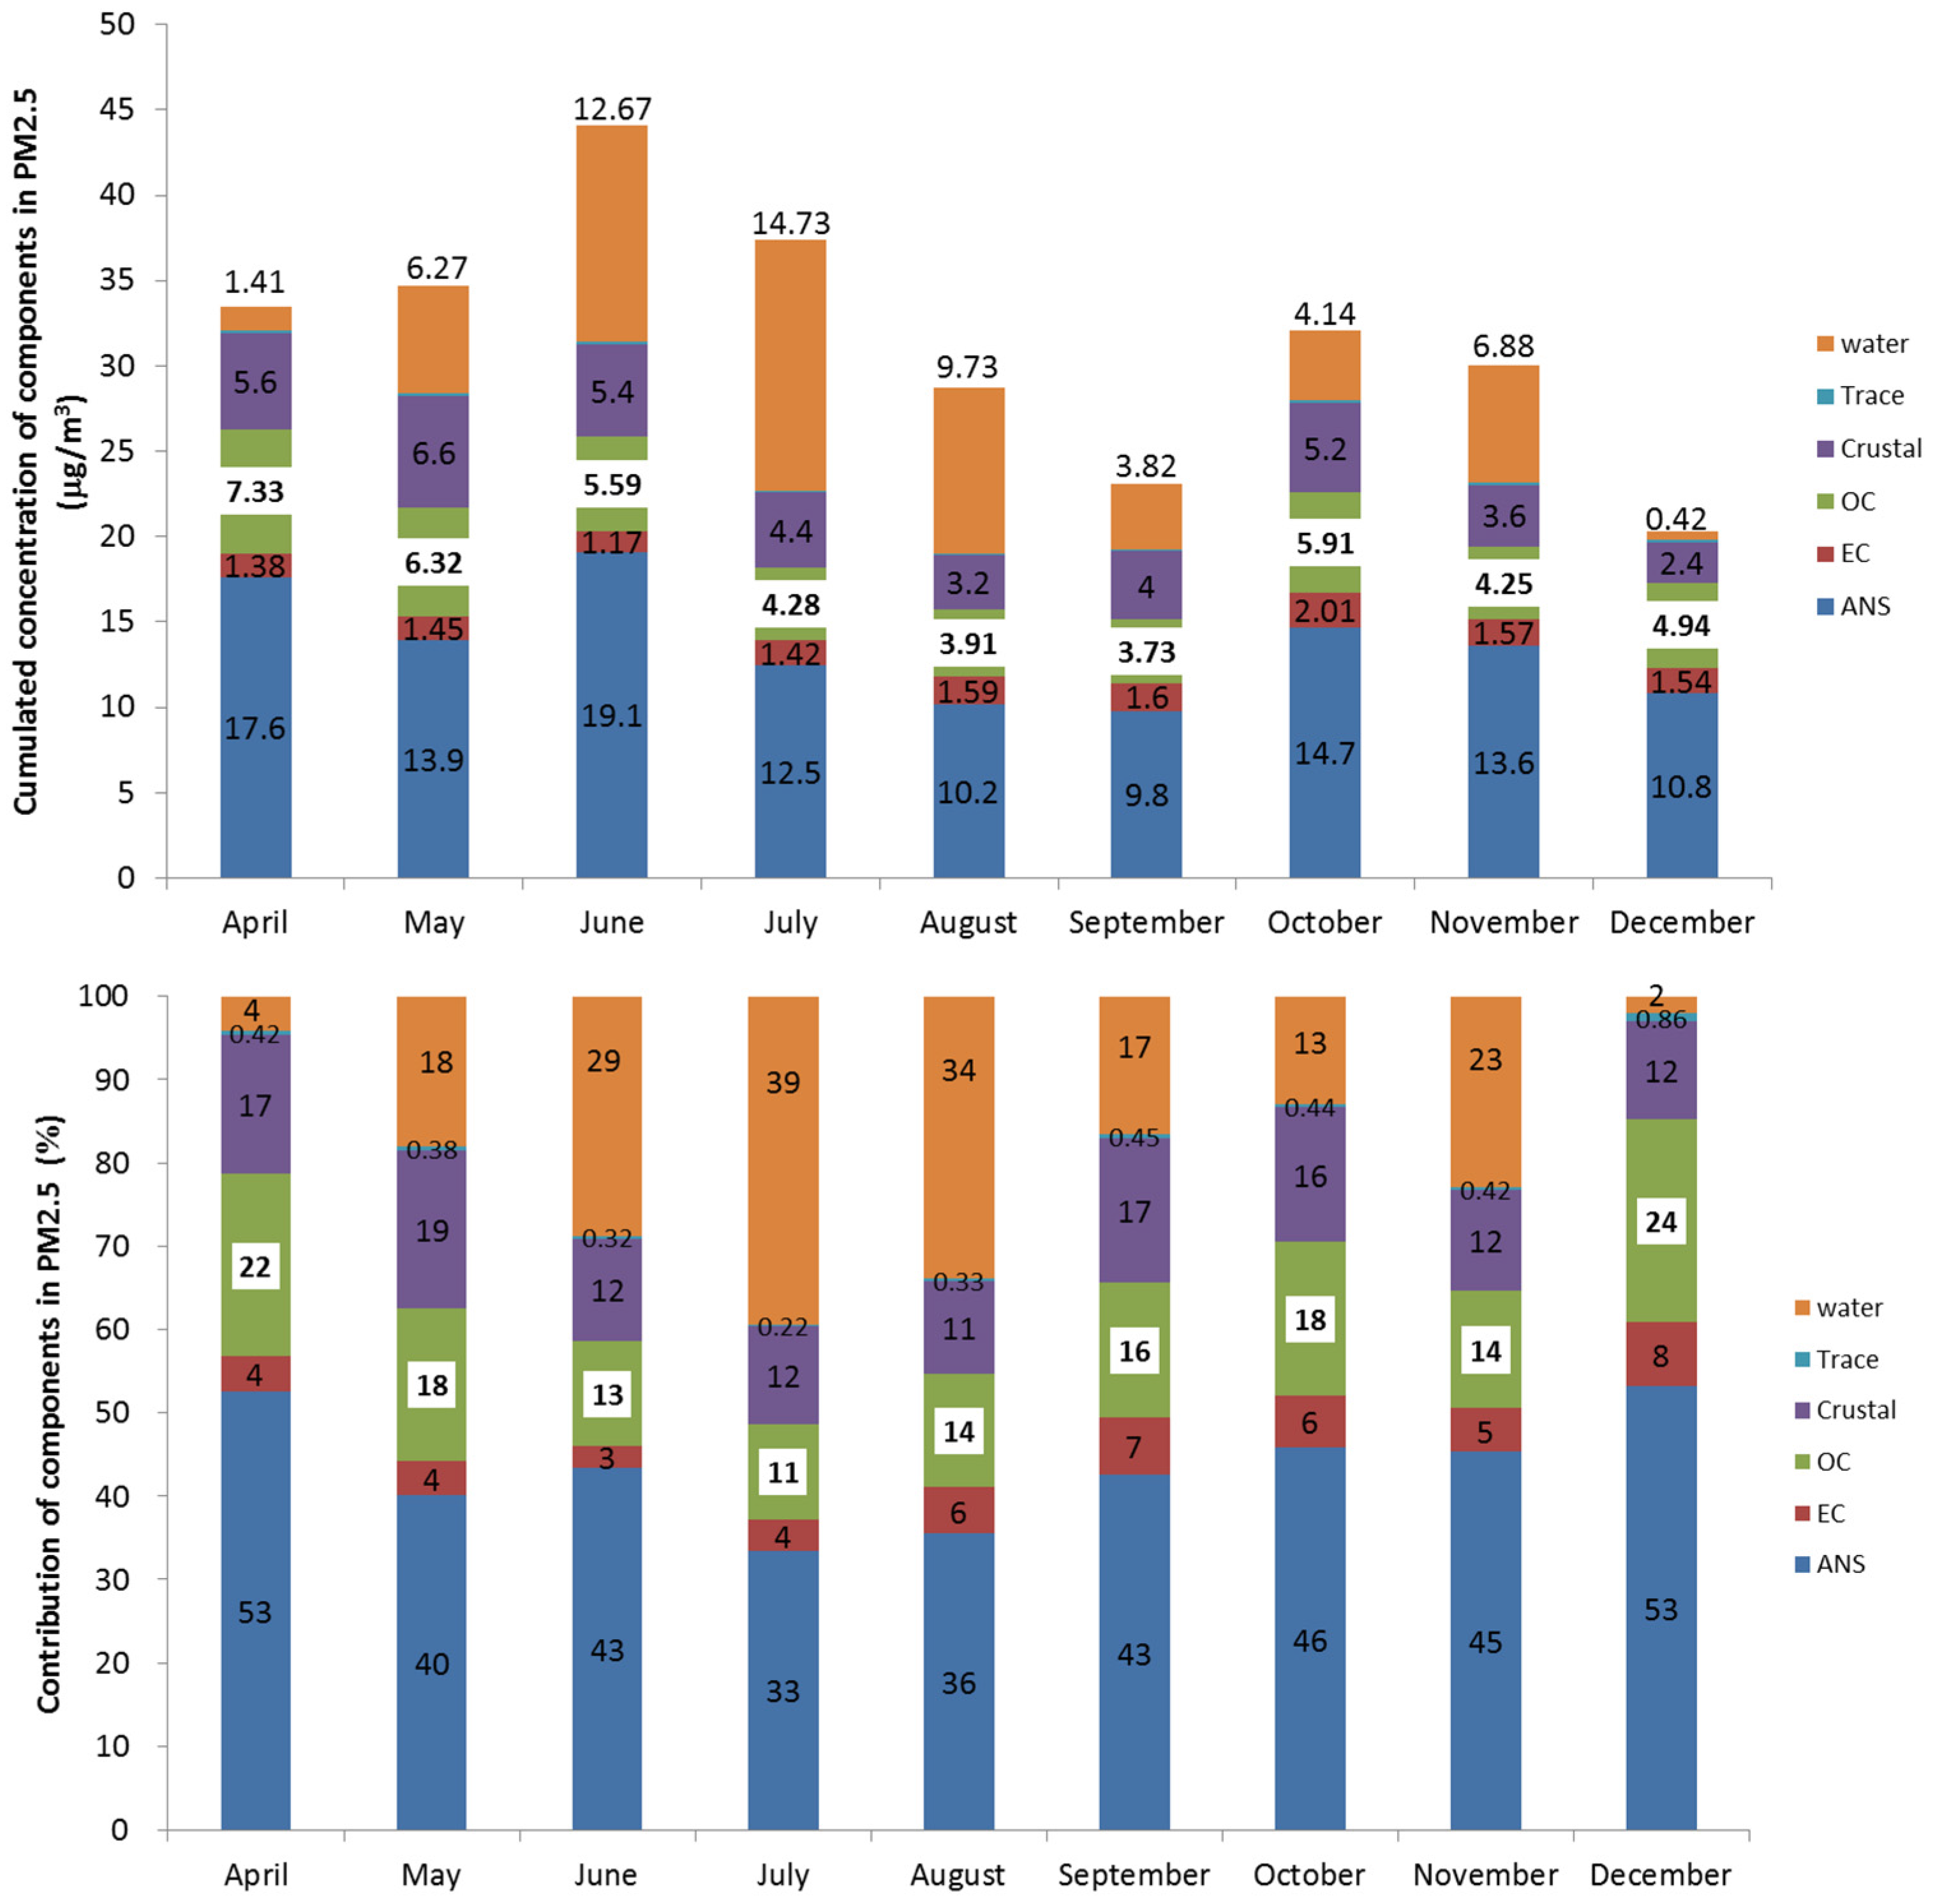
Figure 2 shows the monthly averaged concentrations of OC, EC, inorganic ion and crustal compounds. Water concentration was calculated using the thermodynamic aerosol equilibrium model (SCAPE II) under a specified relative humidity [
25]. As shown in
Figure 2, while the total PM
2.5 concentration decreases during August–September, mainly due to the precipitation scavenging of aerosols, it is high during April–June. The water content is high during summer—especially in July—and low during winter, because of relative humidity. The organic carbon concentration was higher than the other components in April and December. While both sulfate and nitrate were major components, the nitrate concentration decreased in summer due to nitrate volatility. However, it was higher in winter. The refractive index and the density of particles are shown in
Table 1 [
17,
30,
31].
Figure 2 also shows the monthly averaged contribution of each composition, which indicates that ANS (ammonium sulfate (AMS) + ammonium nitrate (AMN)) was dominant in every month, but was seasonally low during summer and high during winter and spring. The monthly contribution of OC also shows a similar trend, of being low in summer and high in winter. On the contrary, the contribution from water content was the highest during summer because of high relative humidity, while the OC contributed the highest in December. In the case of EC, however, the concentration trend seemed to be constant with no seasonal variations.
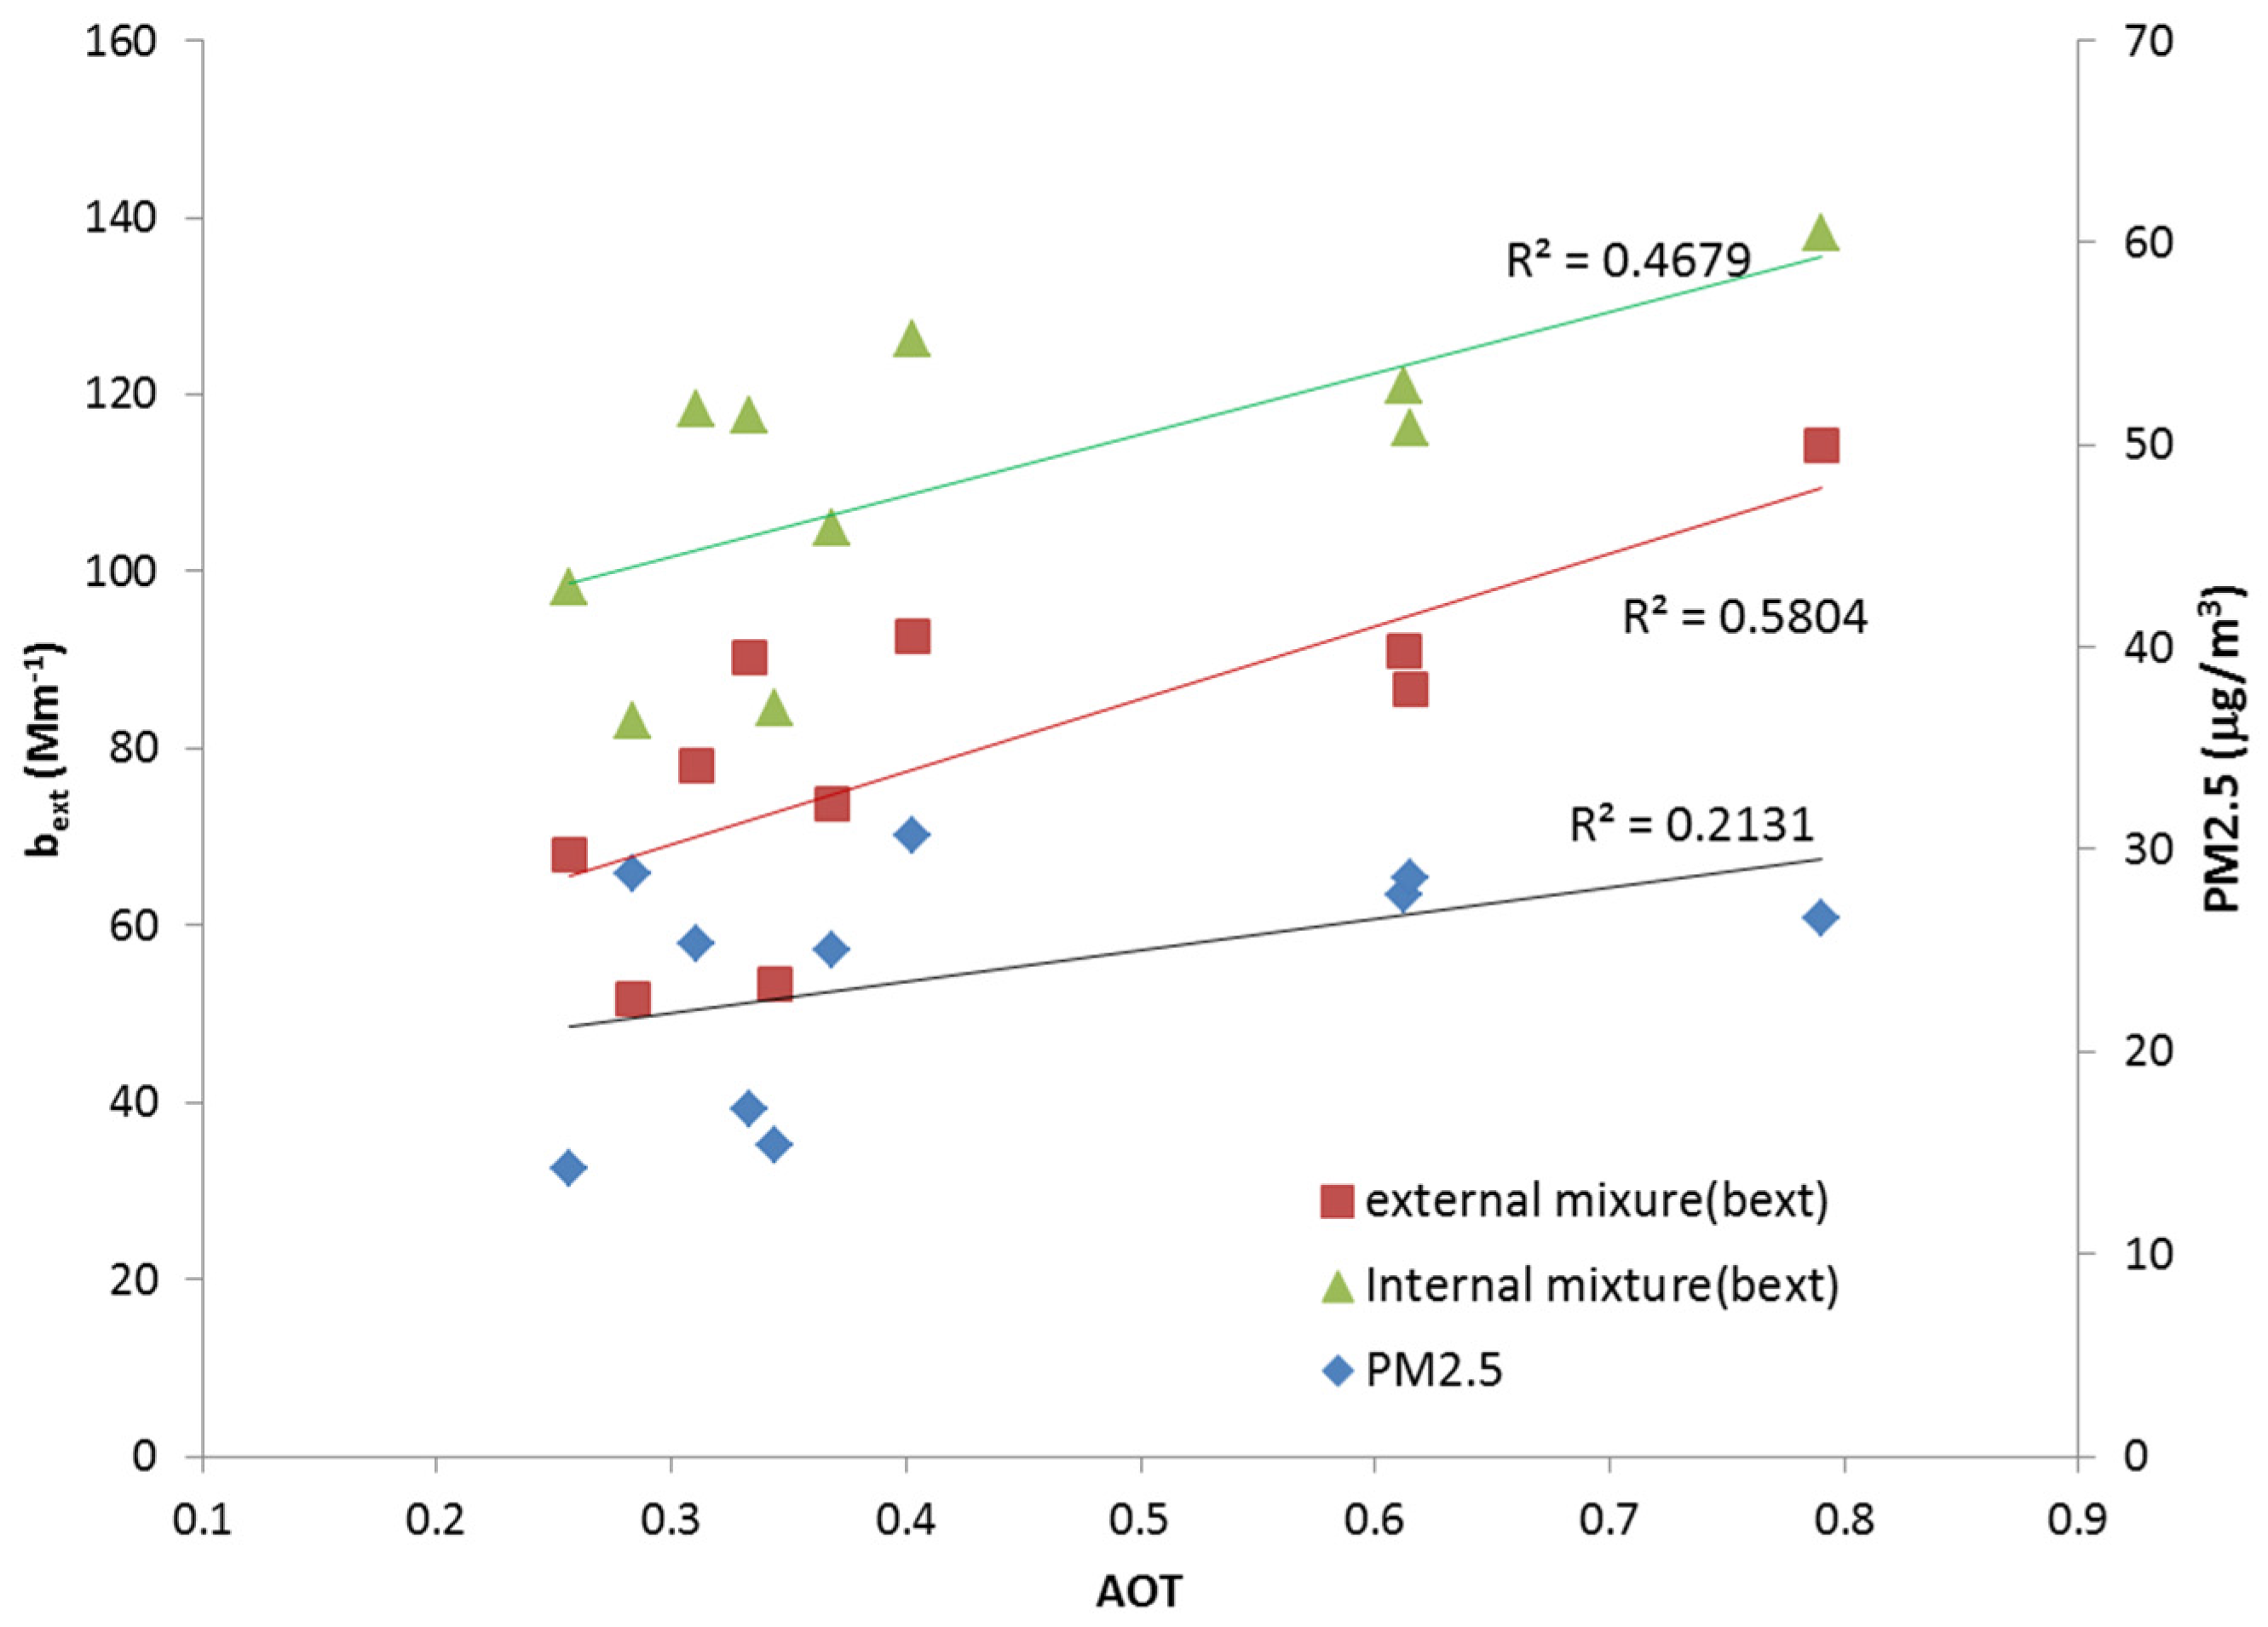
Figure 3 shows the comparison between the mass contribution of PM
2.5 and the AOT. The latter was retrieved from the AERONET data from Yonsei station, Seoul, at a wavelength of 500 nm. The AOT and extinction coefficients from both the external and internal mixtures were also compared. Here, the volume-averaged refractive index for internal mixture has been used, as shown in
Table 1.
The purpose of this comparison was to show the correlation among these three parameters. Generally, indirectly measured AOT is compared with a mass concentration measurement such as PM
2.5. As shown in
Figure 3, the particle concentration of PM
2.5 was proportional to the AOT to some extent. However, the correlation coefficient was rather low (R
2 = 0.2131). The main reason for this discrepancy was that optical properties depend not only on aerosol mass concentration, but also on their chemical composition. The aerosols are composed of various chemical components and each component has a different optical property. For this reason, the aerosol optical properties, such as AOT, show different tendencies depending upon the aerosol composition, although both the PM
2.5 and AOT show a similar trend. In this study, the calculated extinction coefficients were estimated based on the chemical composition measurement data of PM
2.5. This can reflect the optical properties of each chemical composition from the mass concentration. In
Figure 3, a comparison of the calculated aerosol extinction coefficient and the AOT values obtained from the AERONET data showed that the calculated extinction coefficient based on the chemical composition shows a relatively higher correlation with the AOT data. A comparison of the mixture types (
i.e., extinction coefficient in external and internal mixtures) with AOT shows that the correlation of the external mixture is higher than that of the internal mixture. The degree of correlation depends on the monthly characteristics of the aerosol mixture, mainly because the characteristics of the mixing state may differ every month. In addition, optically unidentified material, such as organic carbon, can influence the optical properties of total aerosols. This is the reason that a sensitivity study is required for quantifying the aerosol optical properties.
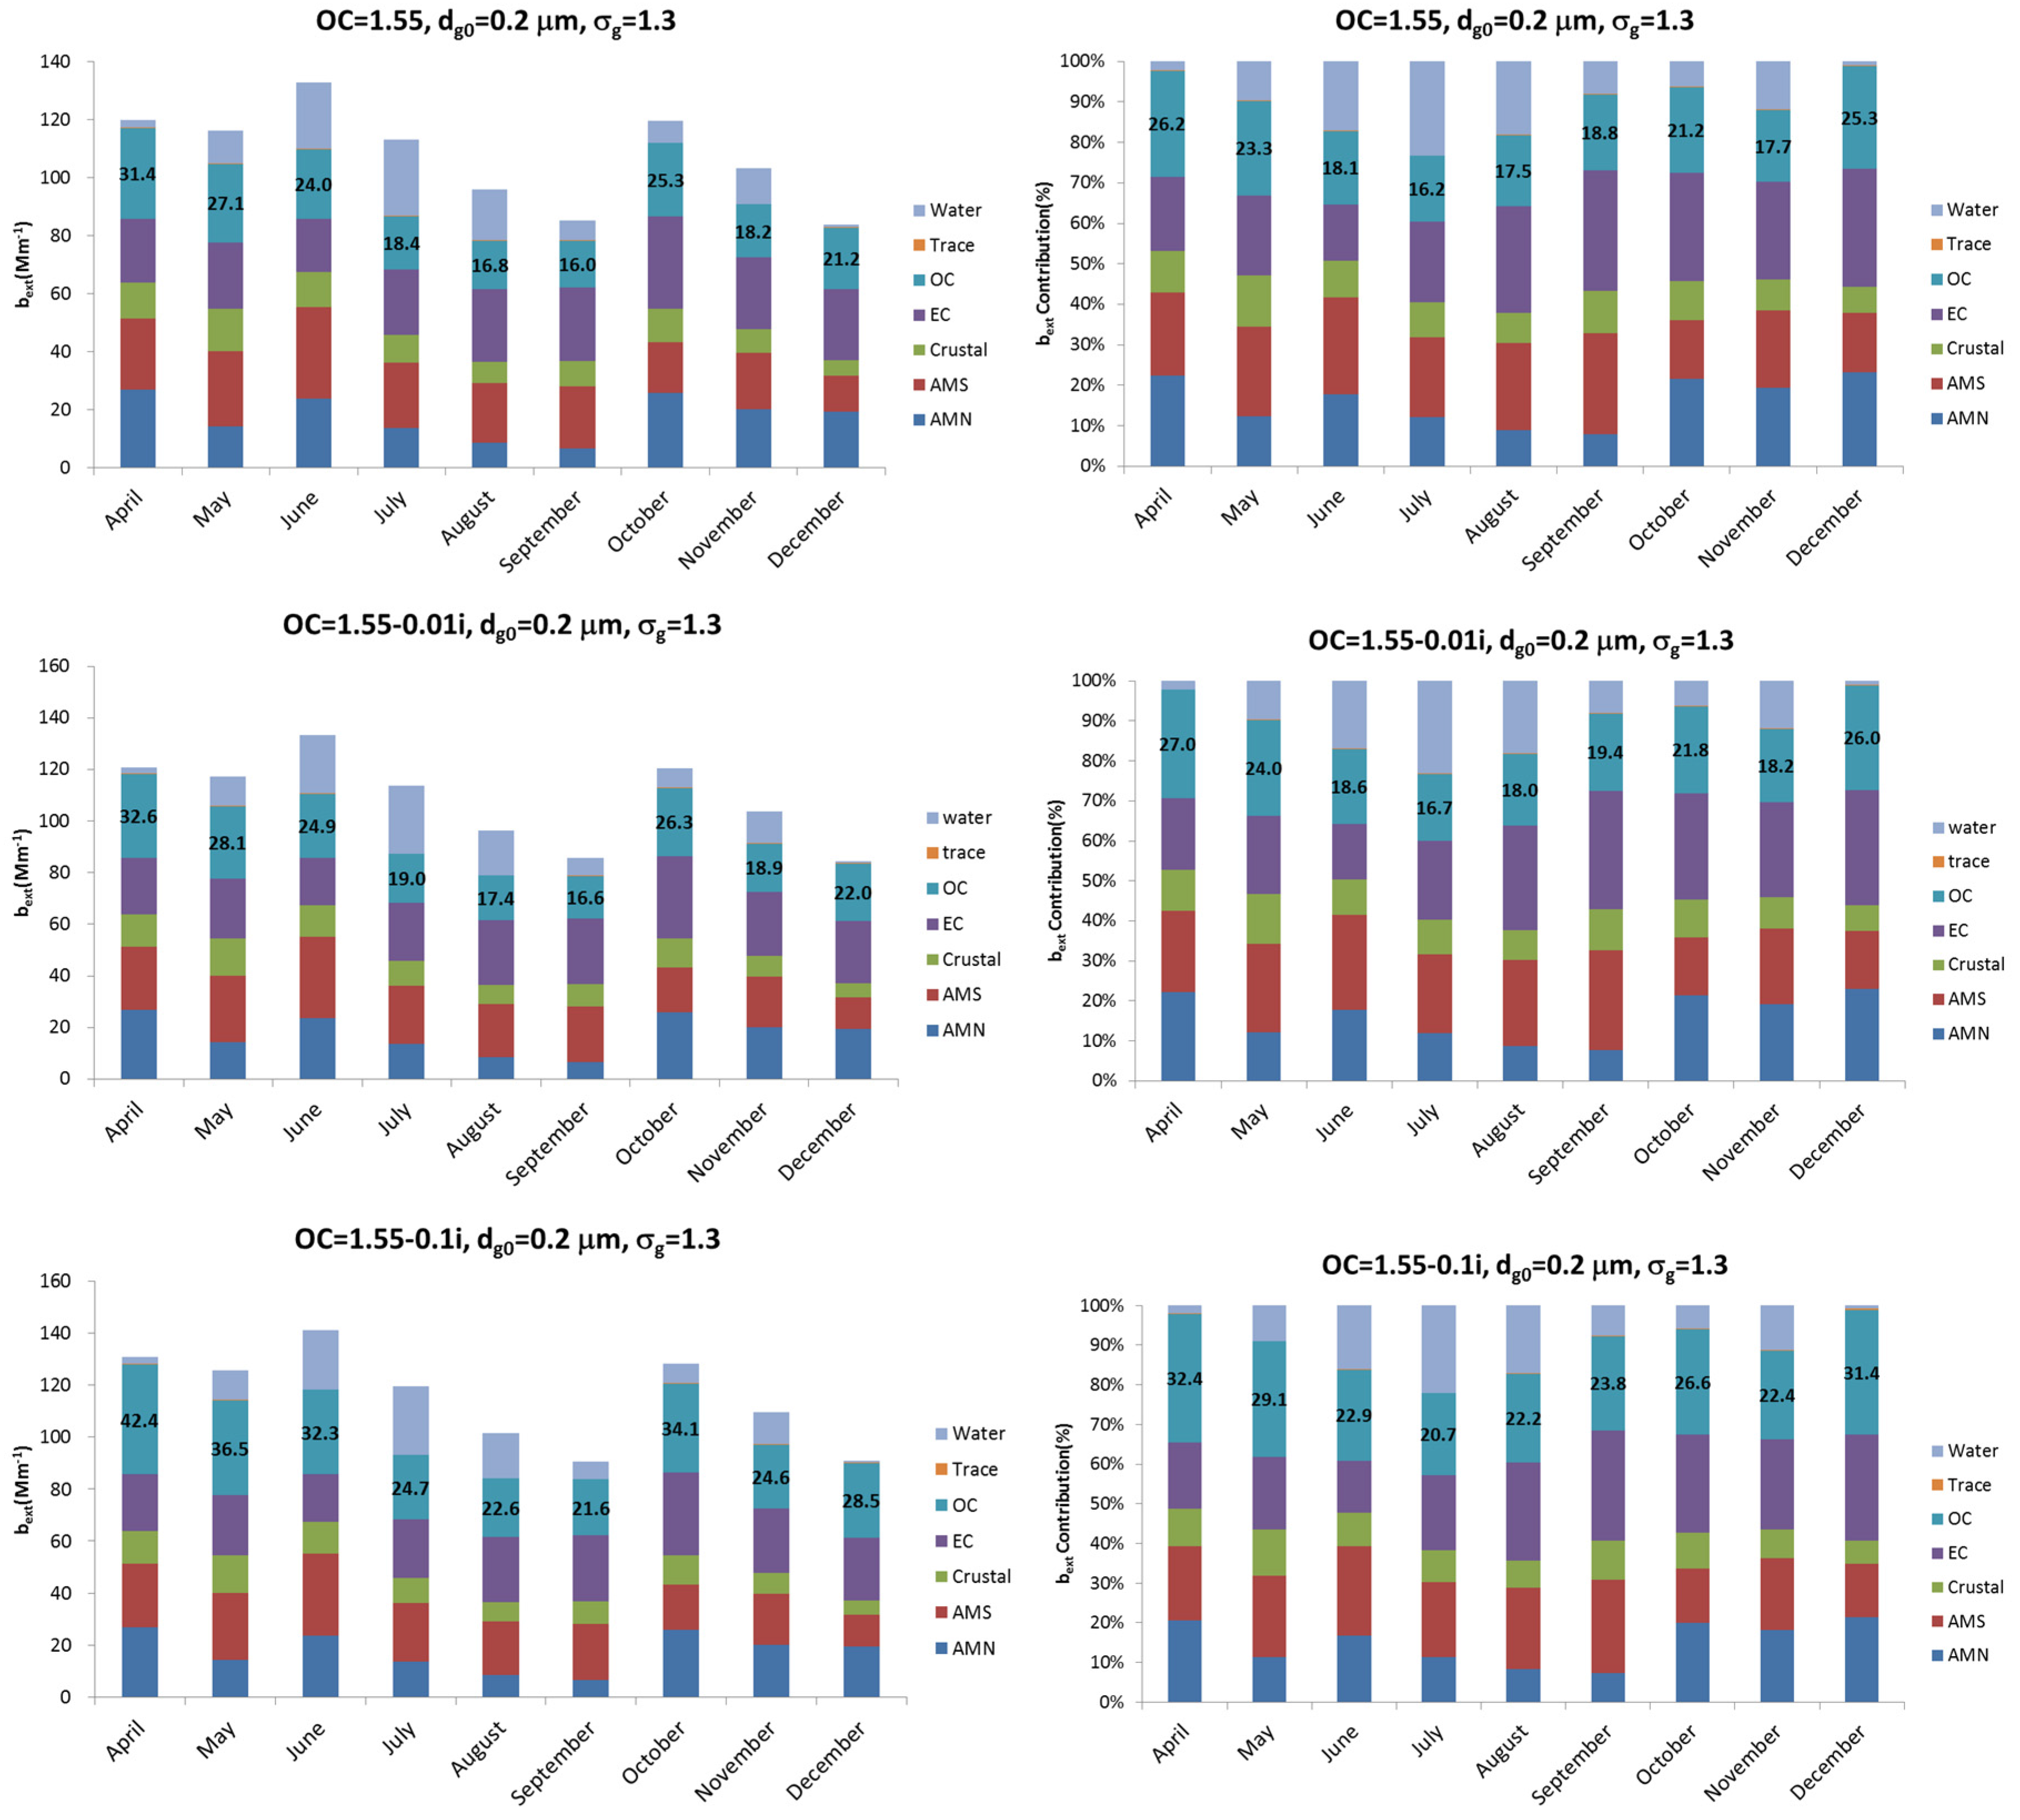
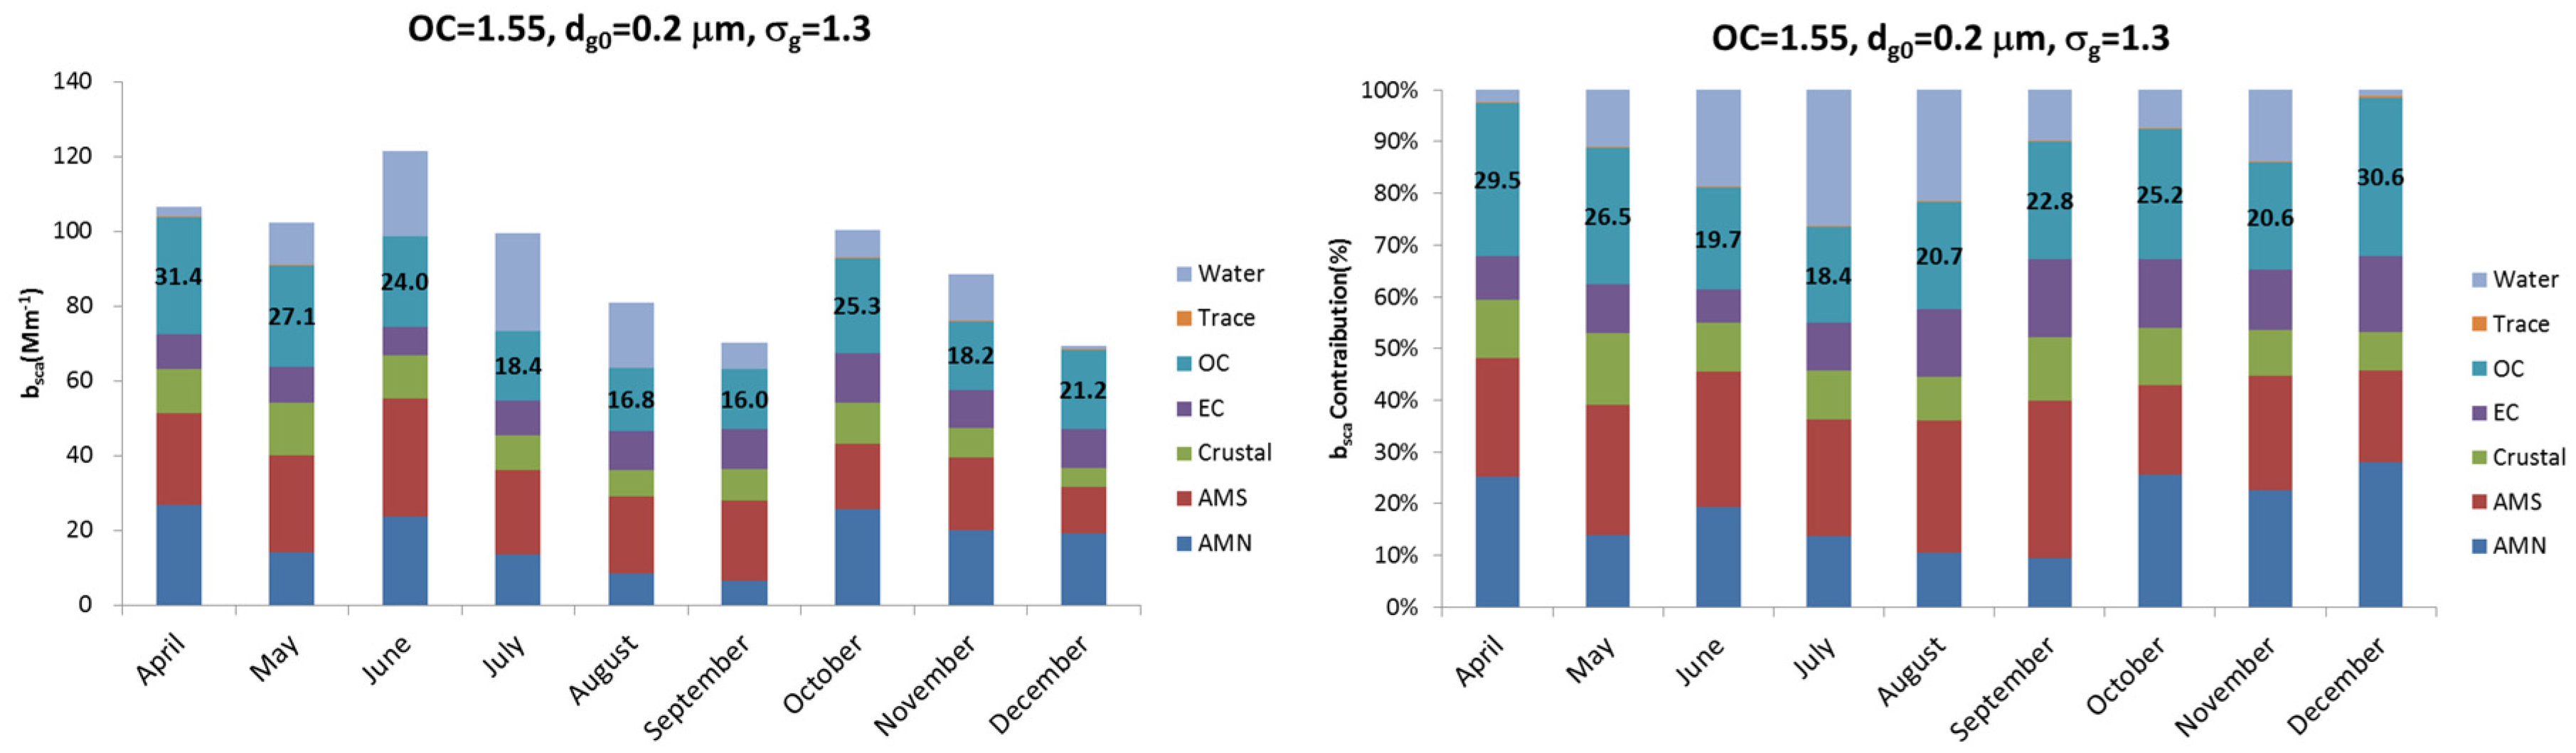
Figure 4 shows the monthly averaged extinction coefficient and the extinction coefficient contribution of each chemical in the aerosol composition. As
Figure 2 shows, the seasonal contribution of OC is low during summer and high during winter and spring. Their contribution to the total composition mass is 11% in July and 22% in April. According to
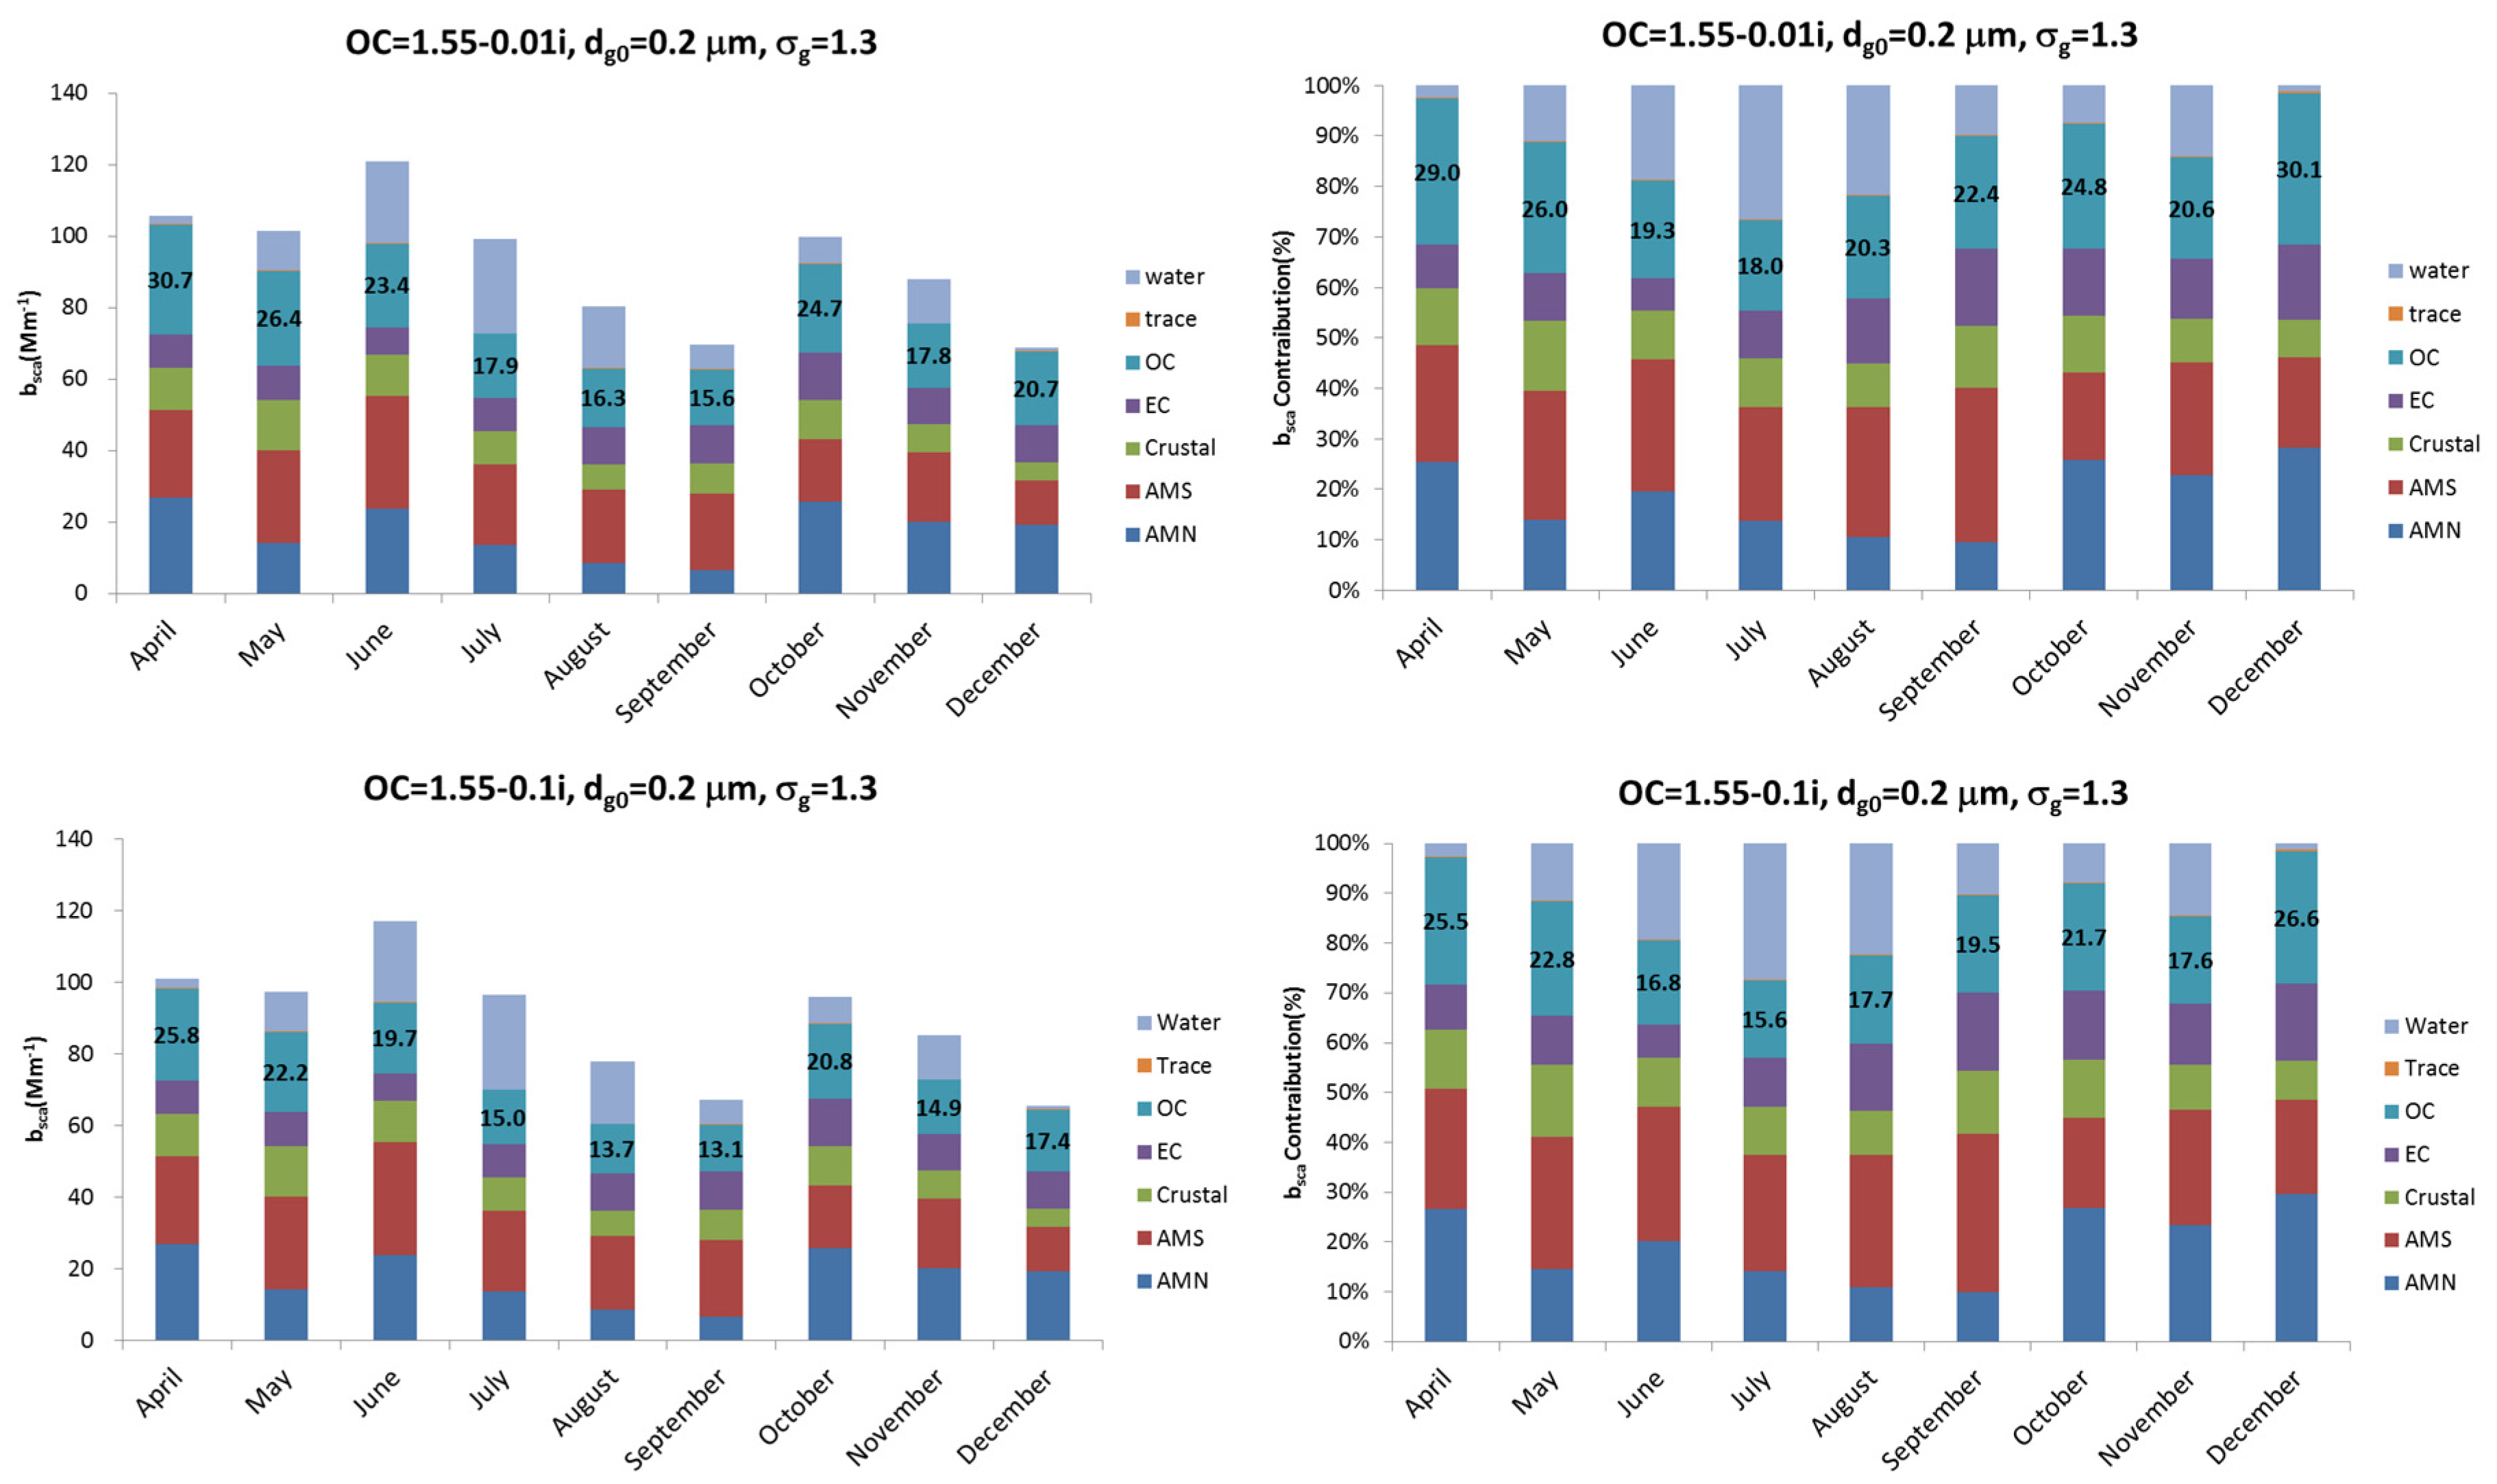
Figure 4, the contribution of extinction coefficient increases to 16.2% in July and 26.2% in April at the refractive index of 1.55, compared to the mass contribution. If the OC has light absorption properties like HULIS (Humic Like Substances), the imaginary refractive index should be considered and the contribution of the extinction coefficient should be changed. For example, when the refractive index is 1.55-0.1i, the contribution of OC in the extinction coefficient increases, compared to when the refractive index is 1.55, because of the imaginary refractive index, which can be explained by the particles absorbed.
Figure 5 shows the monthly averaged scattering coefficient and the scattering coefficient contribution between different refractive indices of OC. Compared to the extinction coefficient, the contribution of OC in the scattering coefficient decreases for imaginary refractive index, although the contribution of OC depends on the concentration of all the other components each month. This means that the contribution of OC in extinction and absorption coefficient increases because of the absorption characteristics of the aerosol, but scattering coefficient decreases when the imaginary refractive index of the OC exists.
The refractive index of organic carbon may have different values because of its variety and complexity. For example, organic carbon accounts for a large, sometimes even the dominant, fraction of air particulate matter. Moreover, hundreds of different atmospheric organic compounds have been detected (e.g., [
5,
6]), which makes the estimation of the refractive index of OC more difficult [
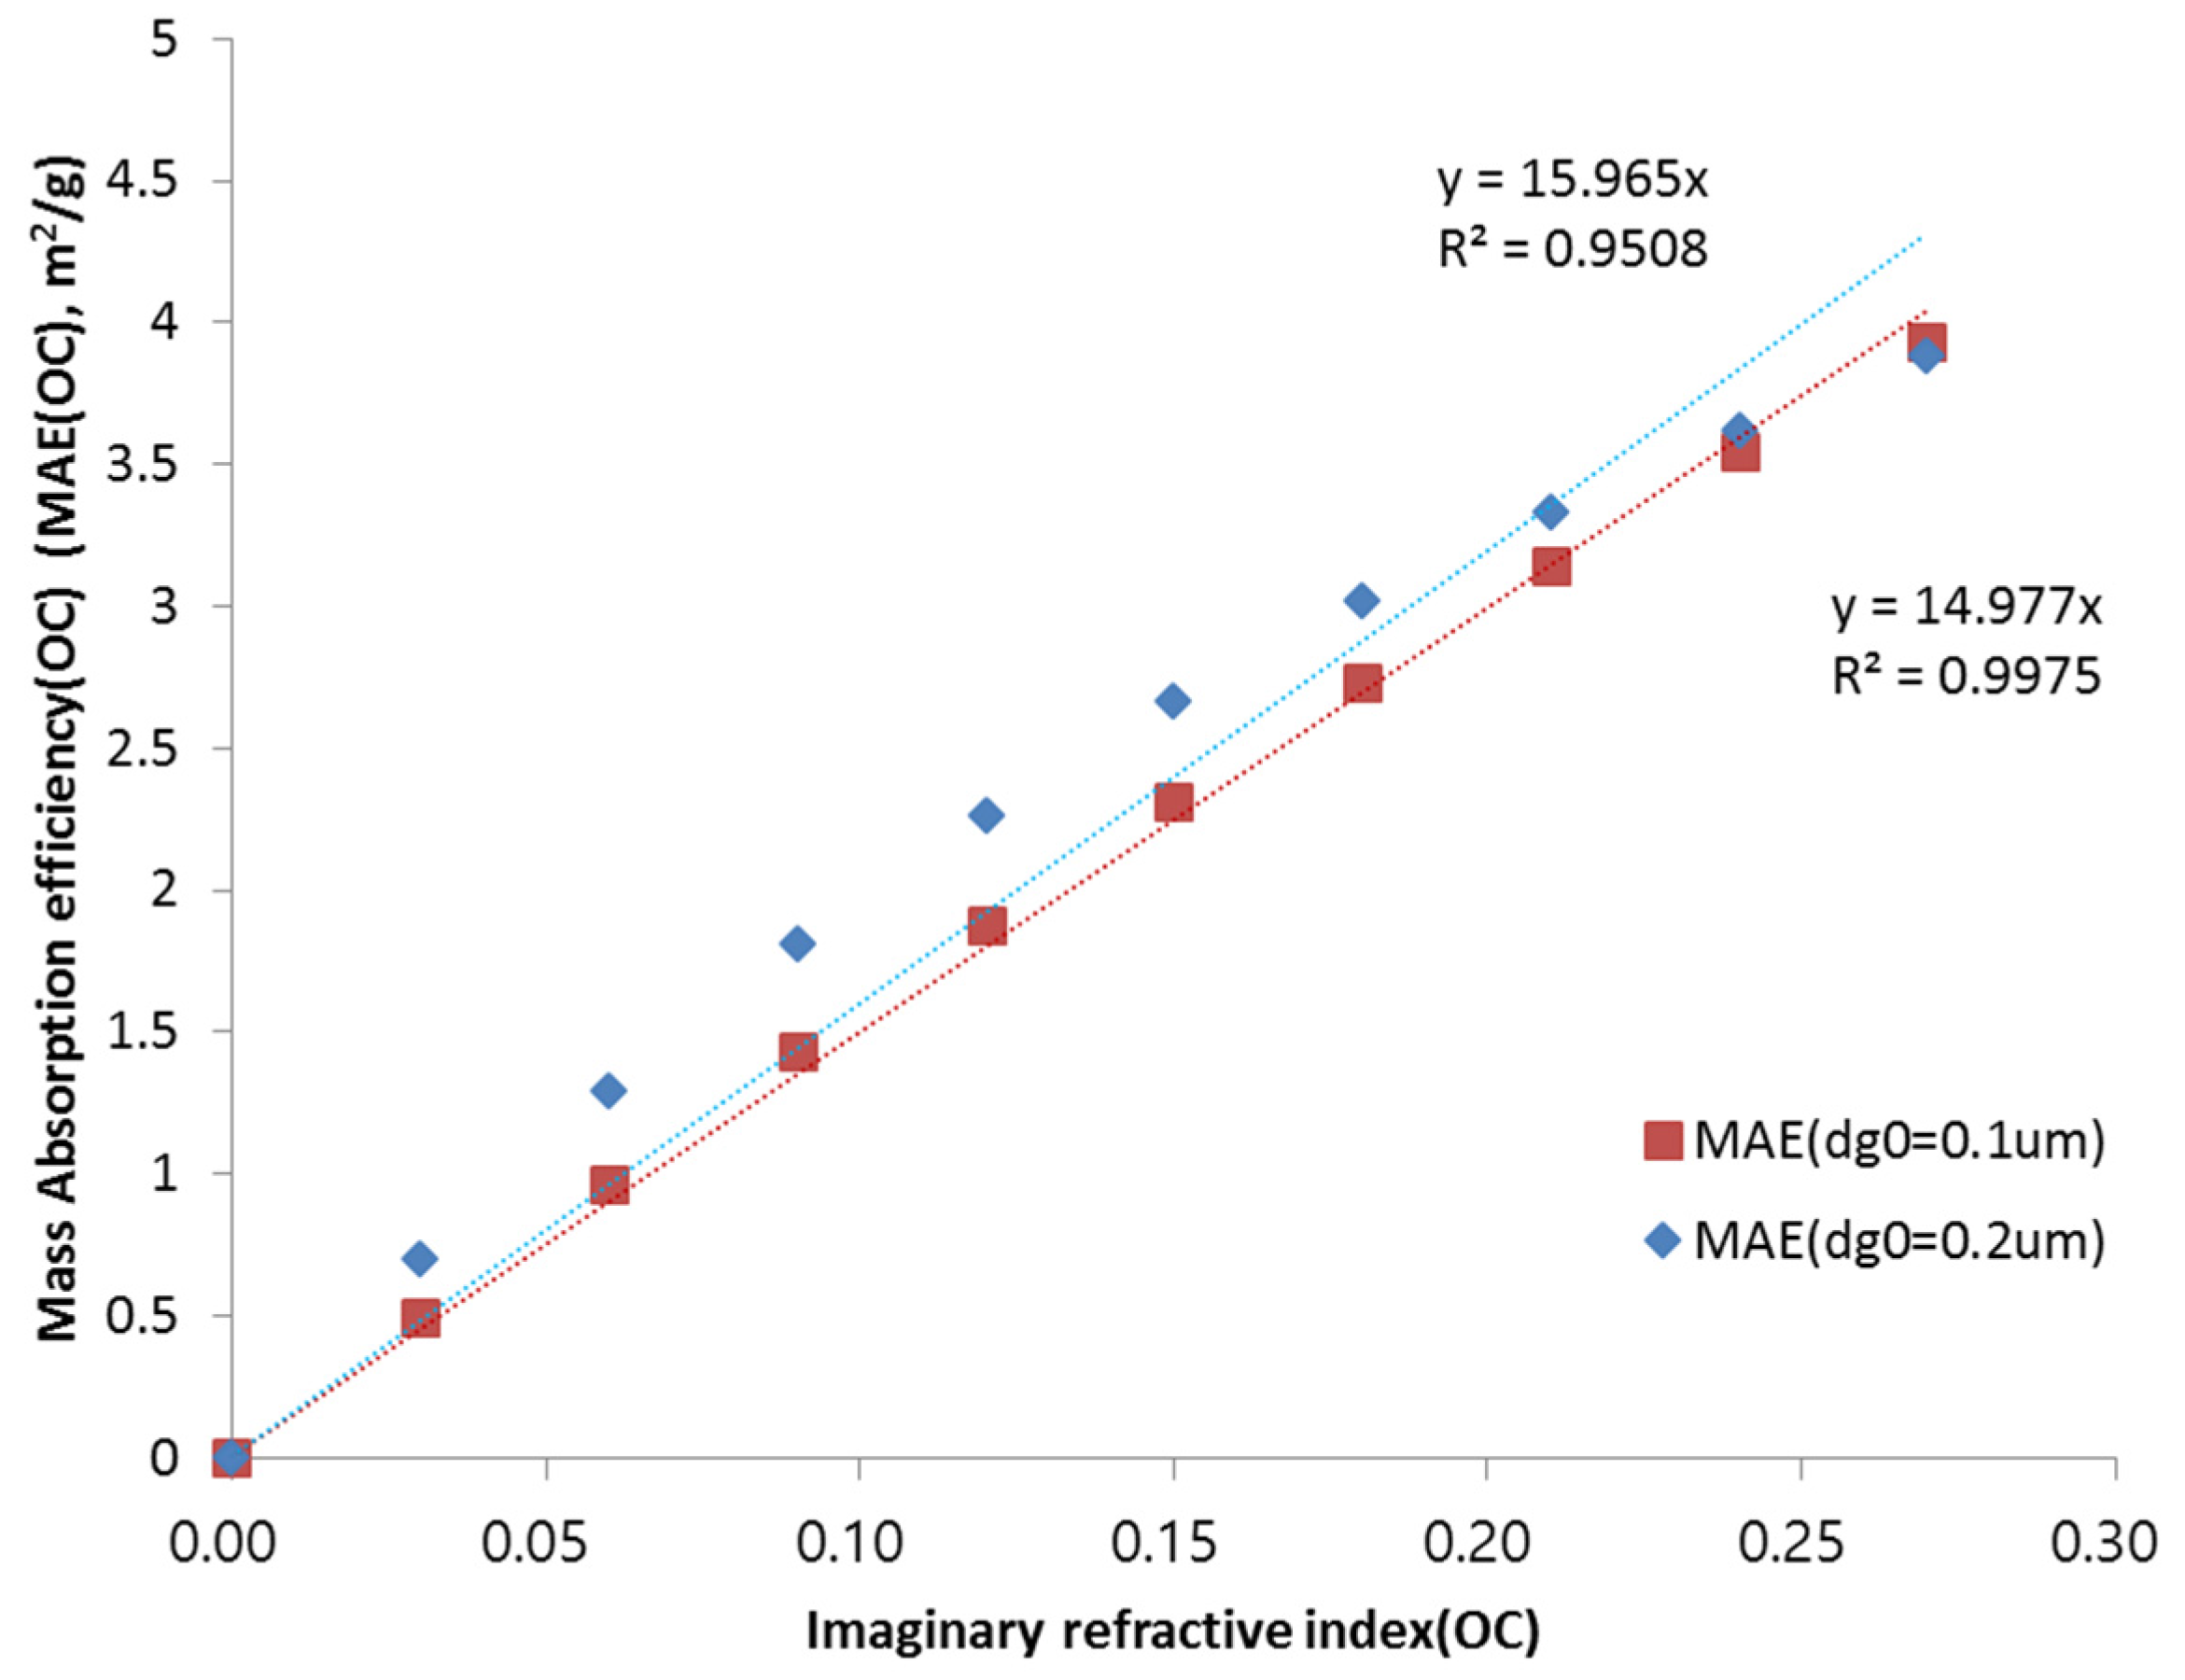
7]. For identifying the sensitivity of OC, the mass extinction efficiency (MEE) is calculated as a function of the imaginary refractive index of organic carbon.
Figure 6 shows the mass extinction efficiency as a function of the imaginary refractive index of organic carbon. In this calculation, the real refractive index was taken as 1.55, with a geometric standard deviation of 1.3. The figure shows that the mass absorption efficiency increases to about 0.15–0.16 m
2/g, by increasing the imaginary refractive index by 0.01, at a geometric mean diameter of 0.1–0.2 μm.
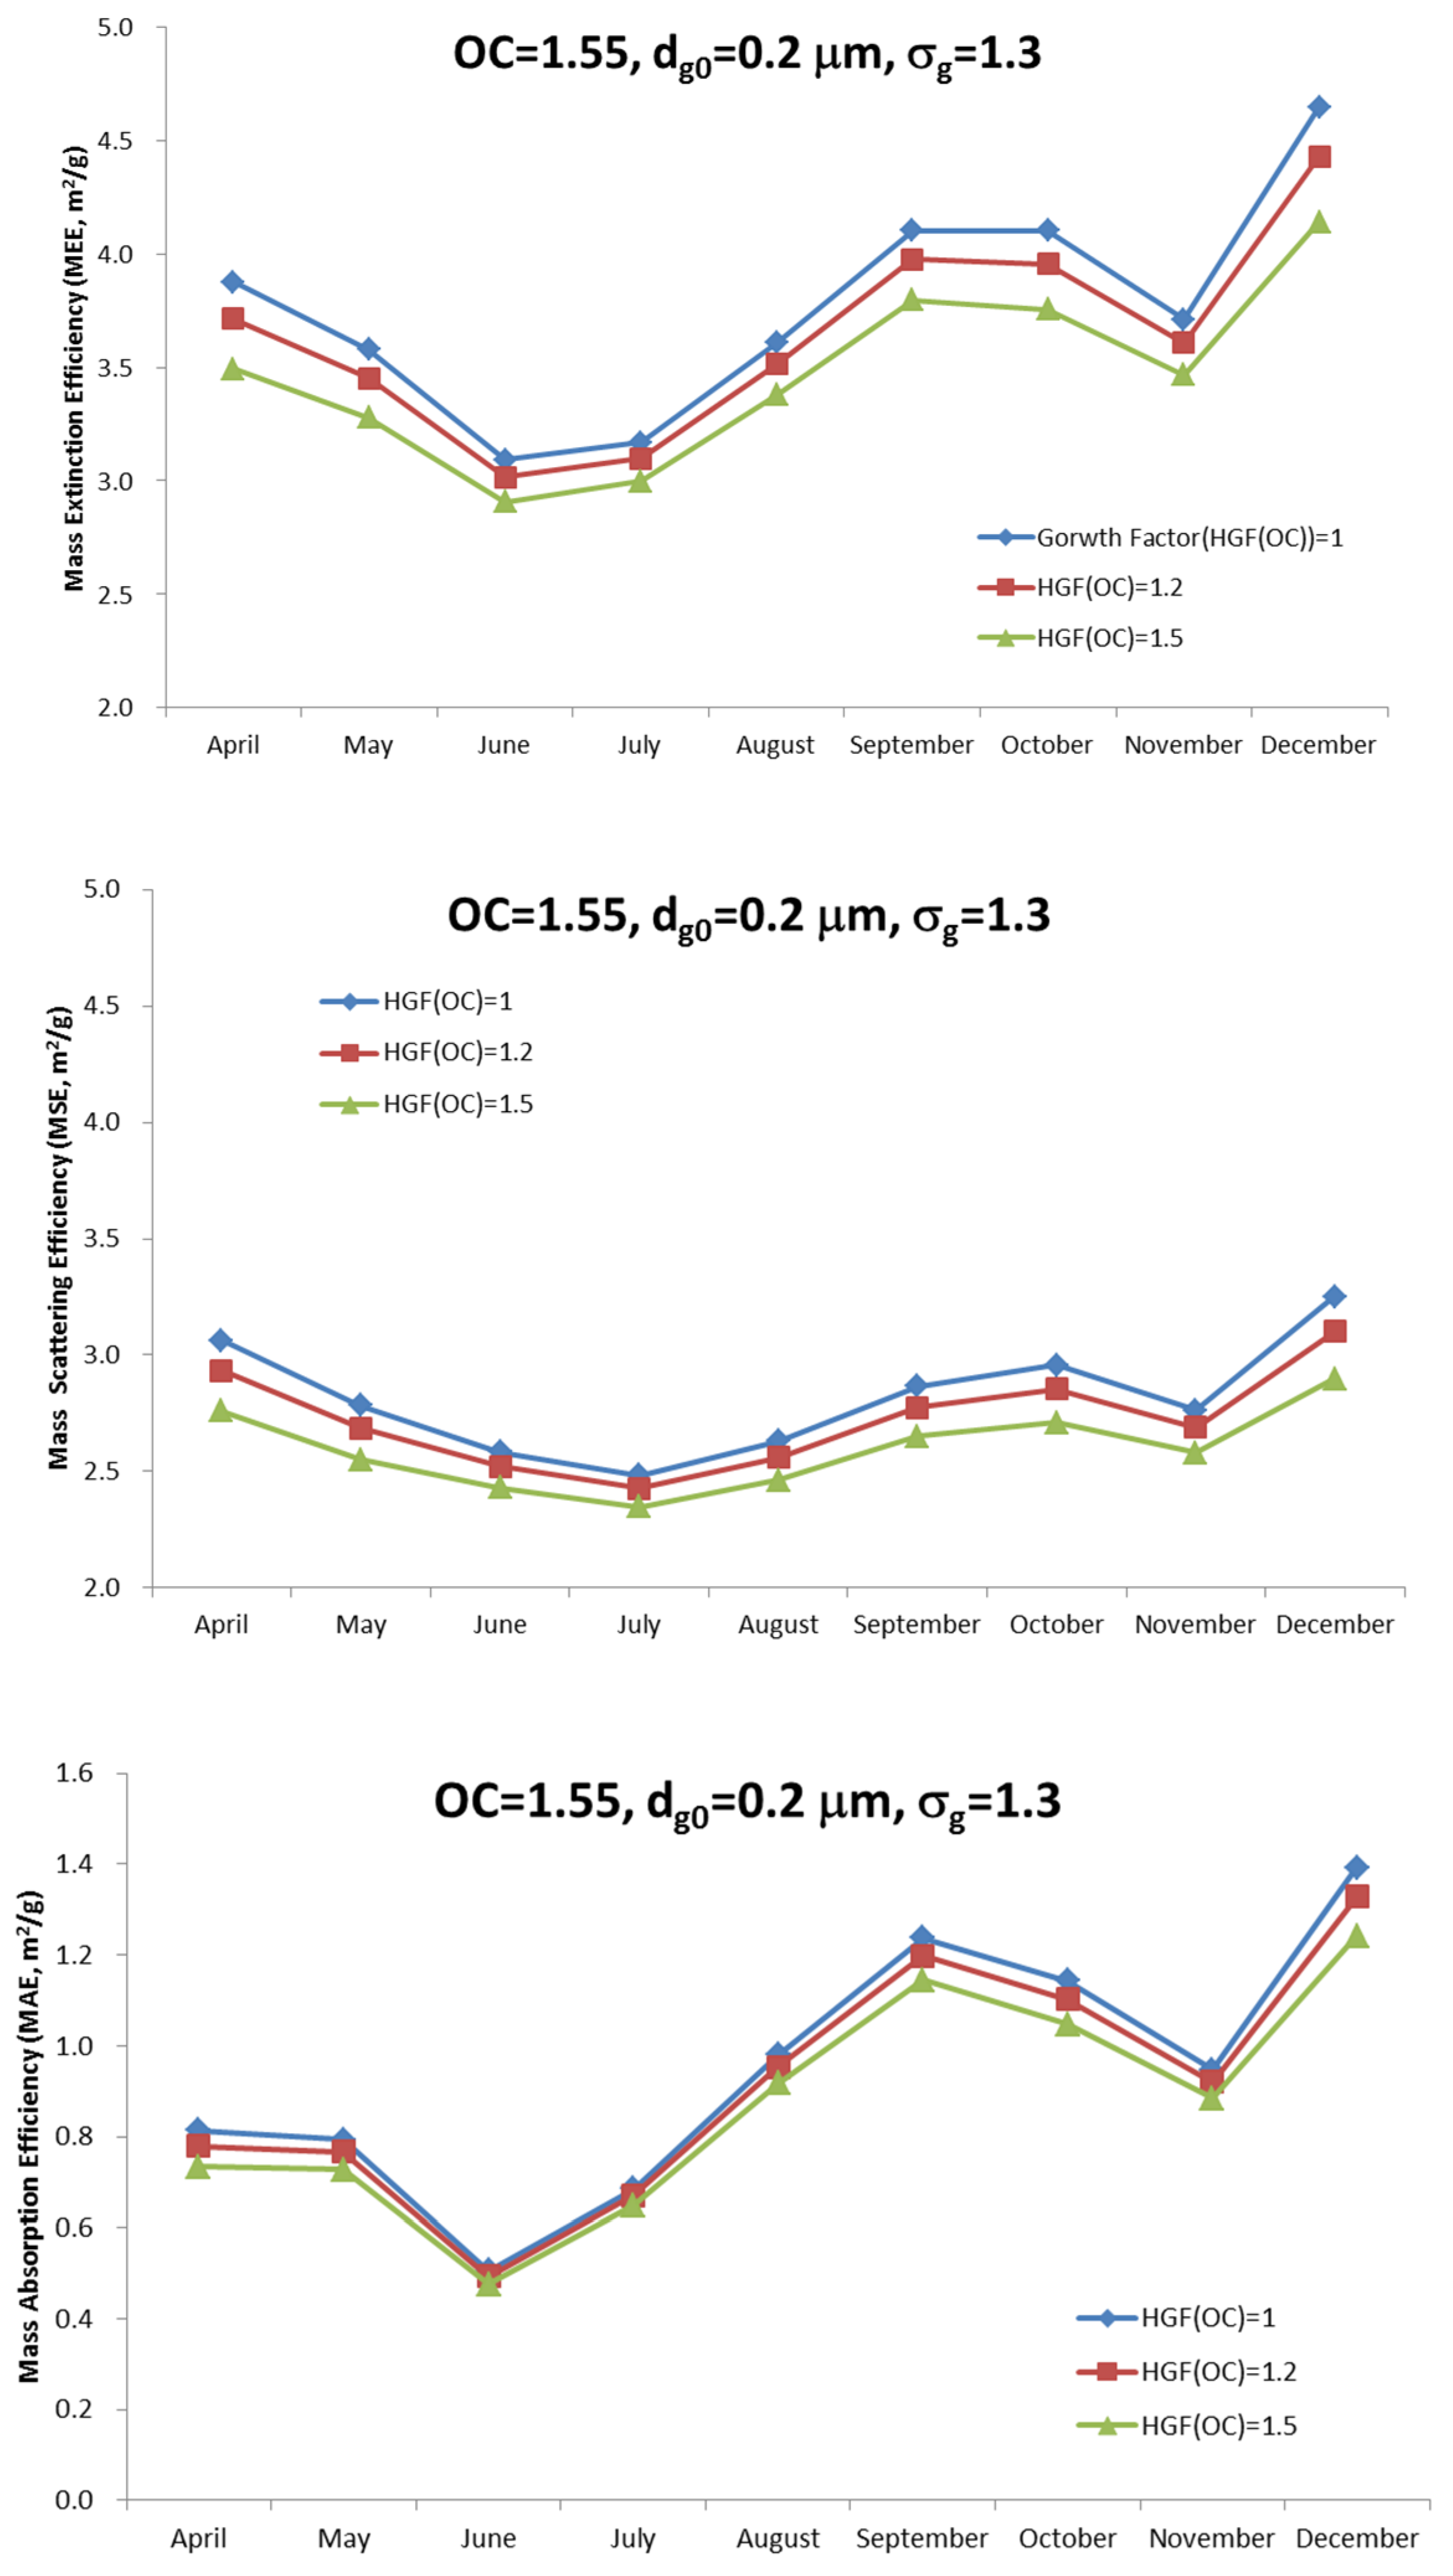
Figure 7 shows the comparison between the mass extinction efficiency (MEE), the mass scattering efficiency (MSE) and the mass absorption efficiency (MAE) of total aerosol, with different hygroscopic factors of organic carbon. The calculated extinction coefficient increases as the imaginary refractive index of organic carbon increases. In this study, we assumed that the internally mixed aerosol and the main composition that affects the mass absorption efficiency is EC. The hygroscopicity of OC depends on their various compositional characteristics. In this study, we tested for three cases with the hygroscopic factors of 1, 1.2, and 1.5. A hygroscopic factor of 1 means there is water uptake only by ion, not by OC. The water content of the inorganic ion aerosol can be calculated from the aerosol thermodynamic model SCAPE II [
25]. A detailed description of this approach has been explained in previous studies [
8]. As
Figure 7 shows, all the mass characteristics, including extinction, scattering and absorption, decrease as the hygroscopic factor increases. This is mainly because adding water to the particles makes the overall scattering efficiency lower.
5. Conclusions
In this study, the sensitivity of OC to aerosol optical properties was explored, based on the filter-based monthly averaged sampling measurement data from the intensive observation sites in Seoul, Korea. The sensitivity of both the absorption and hygroscopic properties of OC were estimated along with the contribution of each composition to the aerosol optical properties. The aerosol optical properties depend on size distribution and refractive index of the chemical composition, which means that the mass concentration alone is not sufficient to determine the aerosol extinction coefficient. This study simulated the aerosol optical properties by using polydispersed aerosol thermodynamic model and the optical properties were calculated using Mie theory [
2,
8,
12]. Finally, the optical properties thus obtained were compared with the AERONET AOT measurement data. The results showed that the calculated aerosol extinction coefficient shows a higher correlation coefficient than the mass concentration of PM
2.5. The results also showed that the contribution of chemical composition such as inorganic ion and OC are low during the summer and high during the winter and spring. However, EC does not show any seasonal trends. The comparison between AOT and calculated aerosol extinction coefficient shows that both follow similar trends. However, the correlation is not consistent every month because the optical properties depend on aerosol chemical composition, size distribution and aerosol mixture, which characterize the aerosol.
Finally, the sensitivity study showed that the mass absorption efficiency increases to 0.15–0.16 m2/g by increasing the imaginary refractive index by 0.01, at a geometric mean diameter of 0.1–0.2 μm. As for the hygroscopic characteristics, the results show that the mass extinction scattering and absorption efficiency decrease as the hygroscopic factor increases. The contribution of OC to the mass extinction efficiency depends on the chemical composition and their optical characteristics such as refractive index. The size distribution is one of the key factors that characterize aerosol optical properties as well as refractive index. This study assumes the polydisperse log-normal size distribution, but constant size parameters (geometric standard deviation and geometric mean diameter). Eventually, the sensitivity of the size distribution also needs to be considered, which remains to be studied in future.


