1. Introduction
A recurring question when operationally or observationally diagnosing the upper tropospheric flow is: how close is close enough for two jet maxima to be considered coupled? The term ‘coupled jet streaks’ here refers to two individual local jet maxima whose influence may be overlapping and/or are synergistically impacting each other, and thus the resultant weather. Jet streaks are isotach maxima that occur within a jet stream as defined by [
1].
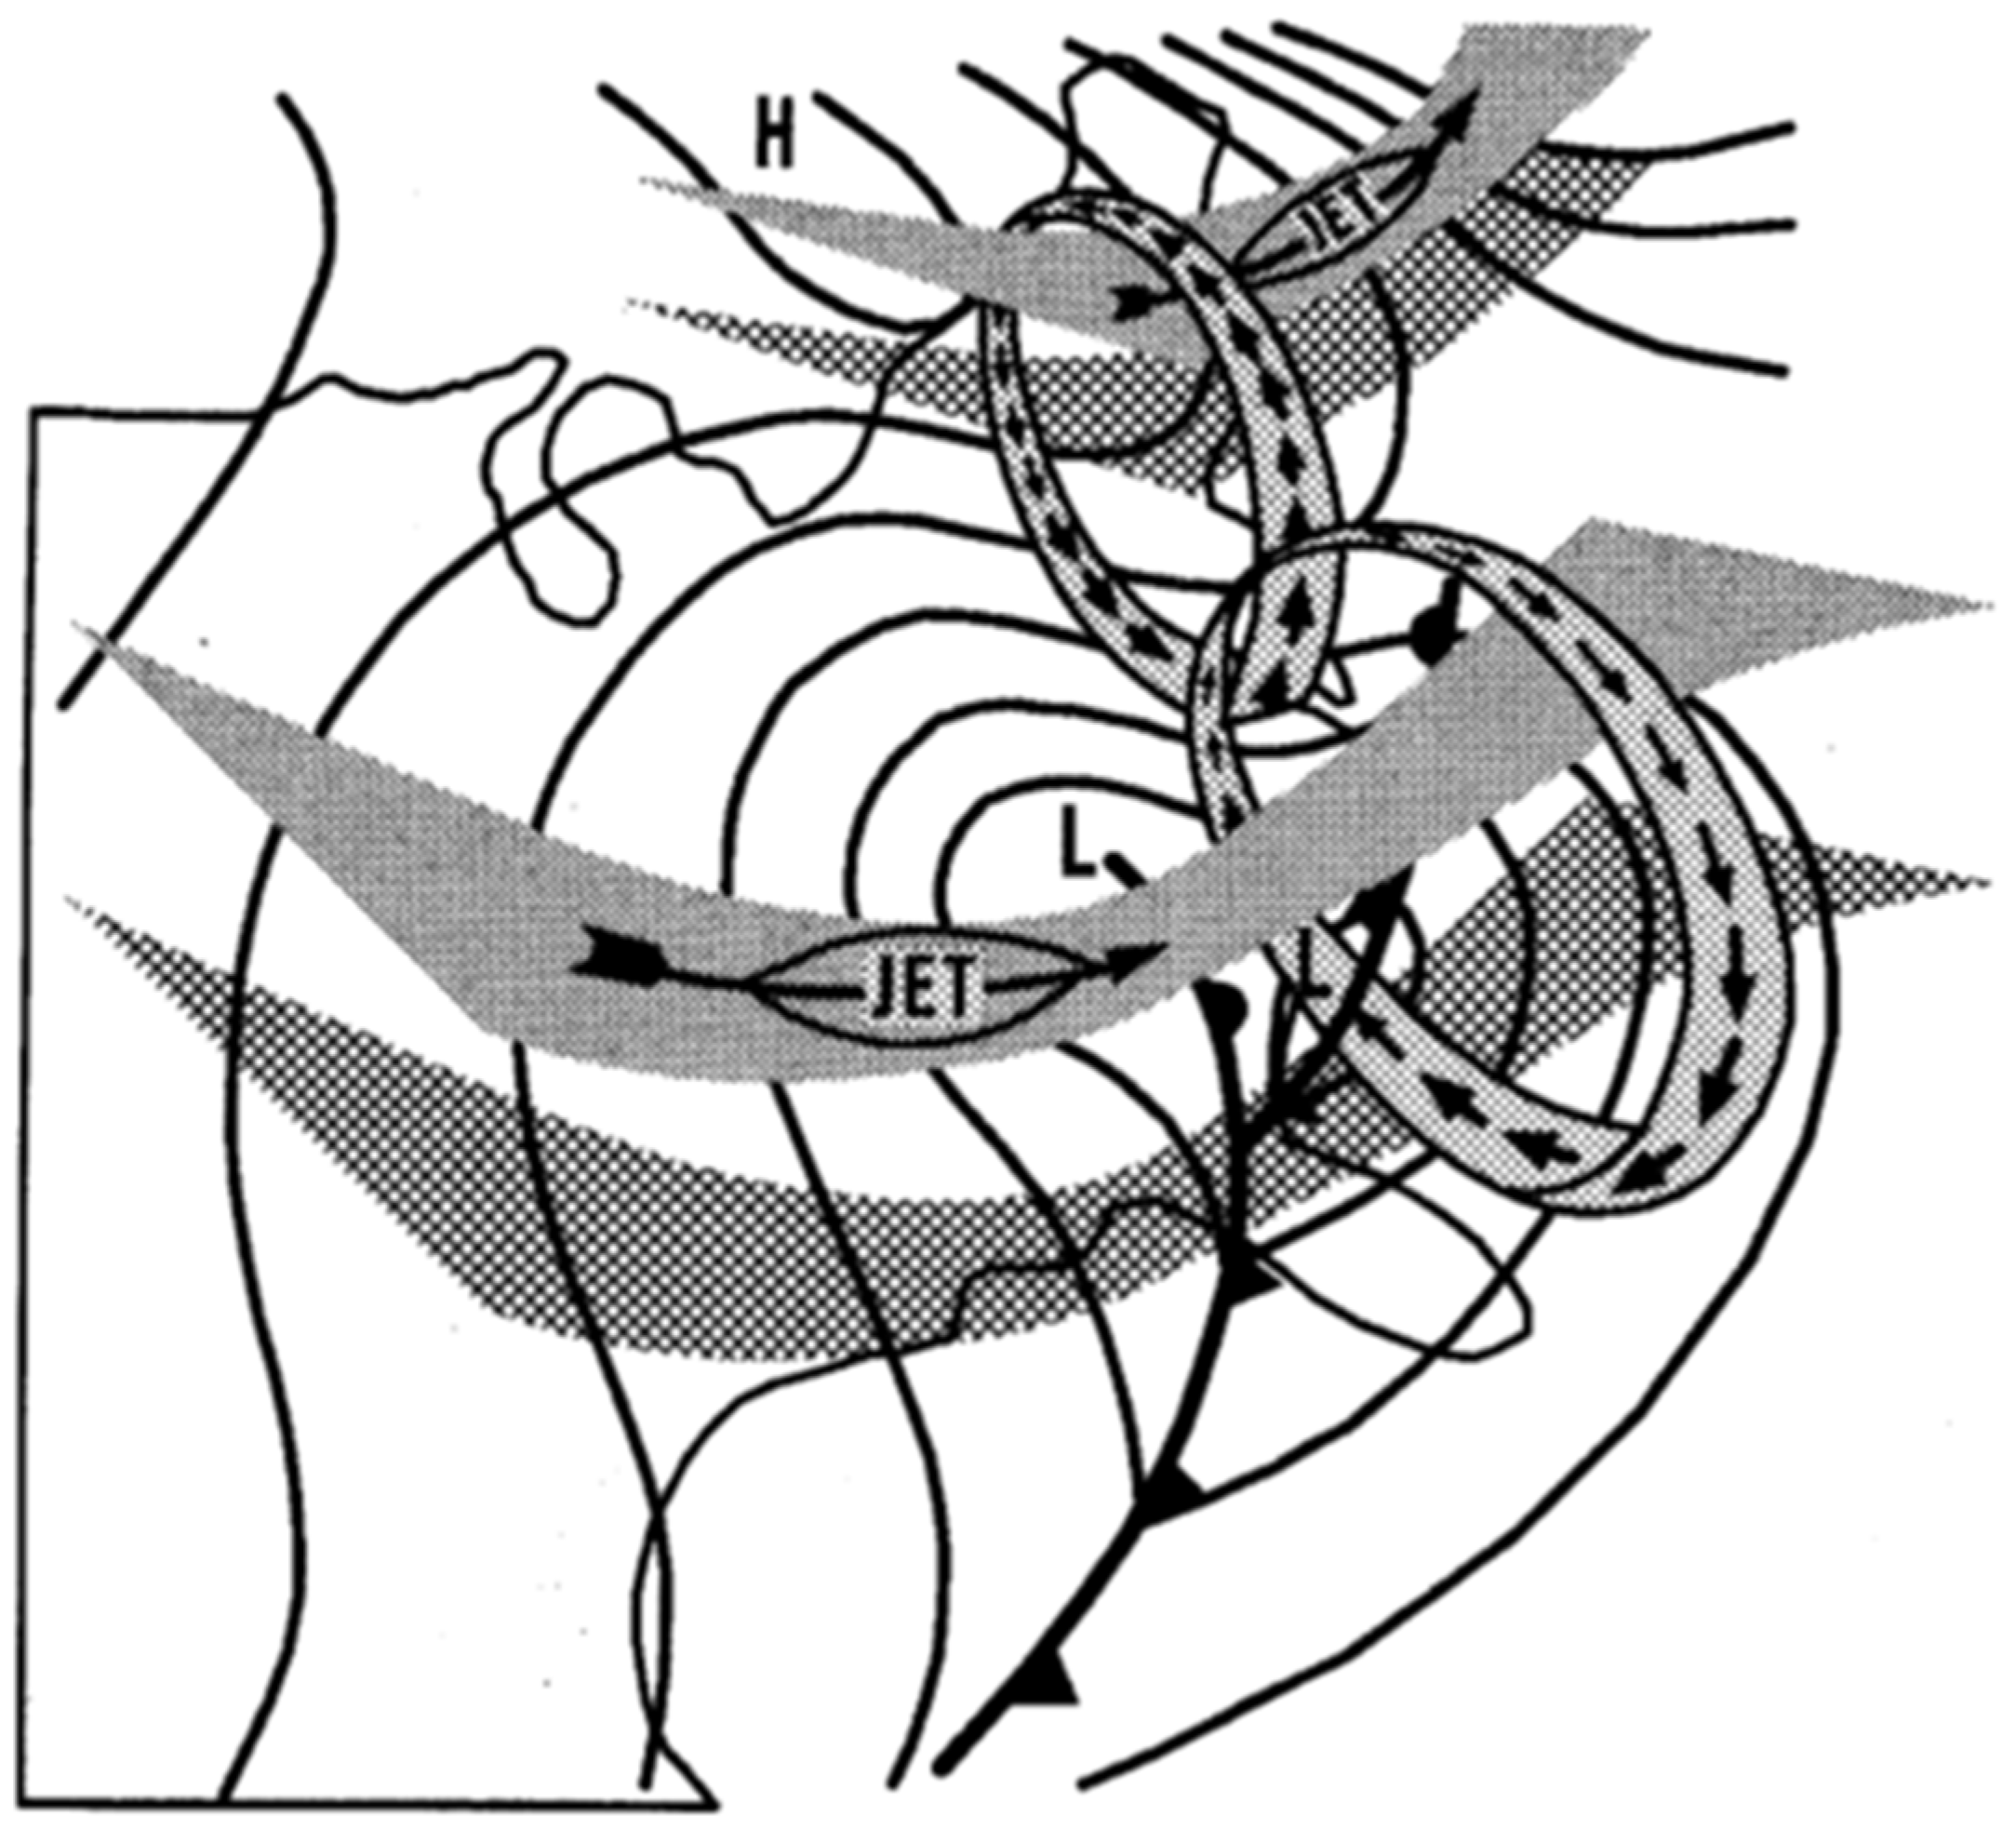
Figure 1, which was inspired by [
2], shows a three-dimensional schematic of two jet maxima aligned in such a manner that interaction is occurring. The work of [
2] used eight cases studies to subjectively demonstrate this concept, but did not quantify a critical distance between the two jet maxima for synergistic interaction to be taking place. This question beseeches an answer since these overlapping jet streaks often lead to significant precipitation events and powerful mid-latitude cyclones. Several studies [
2,
3,
4,
5,
6] provide substantial evidence suggesting the region in-between jet streaks is of major concern for enhanced precipitation and cyclogenesis, and occurs frequently over the Continental United States [
7].
Jet streaks are often, but not always, associated with cyclogenesis. Cyclogenesis has been studied analytically as a baroclinic instability problem, as well established in seminal works [
8,
9]. Then, subsequent studies considered baroclinic instability as represented by cyclogenesis resulting from the interaction between an upper tropospheric disturbance and a surface disturbance, and among these are [
10,
11,
12]. Often, this interaction is thought of as the upper level disturbance interacting with the lower one, a situation referred to as top-down development, or so-called Petterson “type B” cyclone behavior [
13]. These quasigeostrophic primitive equation models commonly solved elliptical wave-equations (e.g., quasigeostrophic, barotropic vorticity or potential vorticity equations) using normal modes, as was done in [
12], or the continuous spectrum following [
10]. In either case, disturbances can interact if they are deep enough into the troposphere (e.g., the parameter Rossby height or depth), and these disturbances subsequently grow, decay, or simply propagate depending on the complex value (imaginary part) of the wave phase speed, as demonstrated by [
14]. Similar behavior can be represented in the horizontal plane for the barotropic instability problem, as shown in [
15,
16].
Other studies demonstrate interaction between phenomena of differing spatial or temporal scales by partitioning the observed atmospheric flow into two separate scales in time, space, or both, in the horizontal plane. Thus, an interaction term will arise from all product terms (the advection terms as part of a total derivative, for example, in a vorticity equation). This technique has already been used to study the relative contributions by synoptic and planetary-scale waves in block formation or maintenance and their interactions [
17], speculating that Northern Hemisphere blocking events represent the mutually synergistic action between synoptic-scale cyclones and large-scale ridging based on the strength of the interaction term. They also postulated that Southern Hemisphere events are the result of constructive interference between each scale.
The purpose of this contribution is to answer the question, how close do overlapping jet streaks have to be in order to consider the transverse circulation coupled in an observational environment? These authors are not aware of any studies that use the methodologies employed here. This will be accomplished by examining the separation between the jet maxima compared to the Rossby radius of deformation. The Rossby radius of deformation is the length scale at which buoyant forces and rotational effects (Coriolis Effect) are equally influential in a flow about an embedded disturbance [
14]. The Rossby radius of deformation could also be considered the spatial domain over which an atmospheric disturbance may impact the flow in which it is embedded. Therefore, when multiple disturbances are present, the possibility exists for an area to be impacted by multiple disturbances (as is the case with upper-level jet streak coupling). When this happens, a Rossby radius of deformation overlap zone (RRDOZ) may exist. If a RRDOZ exists, jet streaks have the potential to synergistically work together to generate impactful weather.
This study will test to see if the presence of a RRDOZ indicates that jet streaks are coupled. This will be determined by following methods similar to those in a previous work [
2] in order to analyze the ageostrophic transverse circulation patterns and column-maximum upward vertical motion values within the RRDOZ for several cases. The end goal is to determine the necessary minimum distance between proximal jet streaks for a RRDOZ to exist, and if the RRDOZ indicates upper-level jet streak coupling. In order to achieve this goal, the following objectives will be accomplished; (1) determine if a RRDOZ exists for the cases examined; (2) test to see if ageostrophic transverse circulations are working together to create a region of enhanced vertical motions; and (3) characterize three archetypes for jet streak coupling over North America.
2. Data and Methods
The years 2002 through 2012 were examined for case selection. Daily 250 hPa and 300 hPa isotach analyses were inspected at the standard synoptic times, 0000 UTC and 1200 UTC. Cases were selected if there were two independent jet streaks present and they were aligned in a manner in which;
- (1)
the jet streaks had minimal curvature along their longer, along-stream horizontal axes;
- (2)
they were separated by at least one quarter wavelength of a trough or ridge;
- (3)
The potential coupled region (not necessarily the entire jet streaks) occurred over the Continental United States.
Some cases initially selected were dismissed because of an additional jet streak(s) in the vicinity, or because one of the jet streaks had exhibited more curvature than initially thought. In cases where there was an additional jet streak(s), it was eliminated because this case could influence the circulation pattern and the ageostrophic response to the jet streak. Cases that exhibited excessive curvature were removed because the typical divergence patterns that are associated with curved jet streaks are shown to be more erratic by some studies [
18,
19,
20], and they could be vastly different from straight line jet streaks, thus making the testing for a RRDOZ difficult. Therefore, those cases were eliminated subjectively. Cases were also not examined if any part of the event occurred substantially outside the domain described below. The total number of cases that met the criteria and had adequate data availability for analysis was 59. The number of cases rejected for excessive curvature or the presence of multiple jet streaks was 45, and most of these were due to curvature (74%, 33/45) or the presence of more than two jet streaks (20%, 9/45). Only three cases (of the 45) were too far outside the domain. Thus, only 56% of all cases met the criteria defined here for the study of interaction.
The National Centers for Environmental Prediction (NCEP) North American Regional Reanalysis (NARR) was the data set employed as the gridded data source [
21]. The NARR represented a single, unified reanalysis for the Continental United States. Moreover, the NARR grid spacing of 32.5 km is sufficient for this study because we are concerned with features that are on the meso-α to meso-β scale.
The main quantity used here is the Rossby radius of deformation discussed in the introduction, and an in-depth discourse on this quantity is discussed in [
14]. The Rossby radius of deformation as used here is a scaling parameter used to analyze the internal dynamics of fluids (see the
Glossary of Meteorology [
22]). This is the second definition in [
22] which states in part; “
An internal Rossby radius of deformation can be defined for fluids...” Alternative formulations do exist for other applications [
22]. The Rossby radius of deformation can be used for forecasting or operational applications, such as for diagnosing tropical cyclogenesis [
23].
Then, Bluestein [
24] discusses the Rossby radius of deformation by exploring the effects of geostrophic disturbances in terms of
Q vectors. Bluestein [
24] also states that such disturbances force the atmosphere out of thermal wind equilibrium as Q vectors deform the thickness field. Bluestein further notes that without ageostrophic and/or vertical motions, geostrophic thermal and vorticity advections destroy thermal wind balance. The destruction of balance gives rise to ageostrophic motions and divergence and convergence patterns. Note that the ageostrophic adjustment process actually can act to restore a geostrophic (or some other balanced) state over time as stated by [
25]. Additionally, Bluestein [
24] demonstrated that the Rossby radius of deformation is the length-scale out to which the impact of a disturbance becomes relatively small. The Rossby radius of deformation (
) is expressed here as in [
14]:
where
N is the Brunt–Väisälä frequency,
H is the scale height, and
is the Coriolis parameter.
Thus
is a function of stability, temperature, and latitude. This work makes use of a single
for all of these cases assuming that jet streaks are embedded within a typical mid-latitude synoptic-scale flow regime. The value used for
is guided, in part, by the analysis of the general character of these mid-latitude flow regimes. These cases were generally located within five degrees of 42.5° N and the typical mean tropospheric (US standard) lapse rate was 6.5 K·km
−1. Using these characteristic values for the mid-latitude atmosphere background flow (see [
26,
27]), a
of 1136 km was computed. Each case of potential jet coupling was then evaluated to determine if the jet streak’s divergent regions were within 2272 km of each other. Examining the potential for error in making these assumptions in estimating
revealed that the quantity is most sensitive to the choice of latitude. Thus, the value of
across the meridional direction of the domain varies by about 20%. However, the choice of a middle latitude does not result in the inclusion or exclusion of additional cases examined here.
The points used to assess the Rossby radius of deformation will be referred to as the upstream jet streak point, and the downstream jet streak point. The upstream jet streak point refers to the jet streak contributing the indirect thermal circulation to the potentially coupled jet pair. The downstream jet streak point refers to the jet streak contributing the direct thermal circulation to the potentially coupled jet pair. For the Northern Hemisphere, the downstream jet streak was typically eastward and poleward of the upstream jet streak. Isotachs contoured every 5 ms−1 (10 knots) were used to assess the jet streaks. The downstream jet streak point was placed on the furthest position west on the first closed isotach of the poleward jet streak. The upstream jet streak point was established at the furthest position east on the first closed contour of the equatorward jet streak. The locations of these points were selected because they represent the beginning of the entrance (for a downstream jet streak) and end of the exit (for an upstream jet streak) regions for the given jet streaks.
A buffer was then created around each point with a radius equal to the
value used for this study (1136 km) using the Aeronautical Reconnaissance Coverage Geographical Information System (ArcGIS) software package (Version 10.1) licensed to the University of Missouri. In particular, the data were plotted using ArcMAP which can be used to determine distance between two data points. The placement of these entrance (exit) regions is where the transverse circulations can be found according to [
28]. The jet streak had to have at least one closed isotach greater than 30 m·s
−1 (60 knots) and at least 5 m·s
−1 in excess of the jet stream it was within (represented by least one closed contour). Case to case, the minimum closed isotach could vary, but each jet streak always has at least 5 m·s
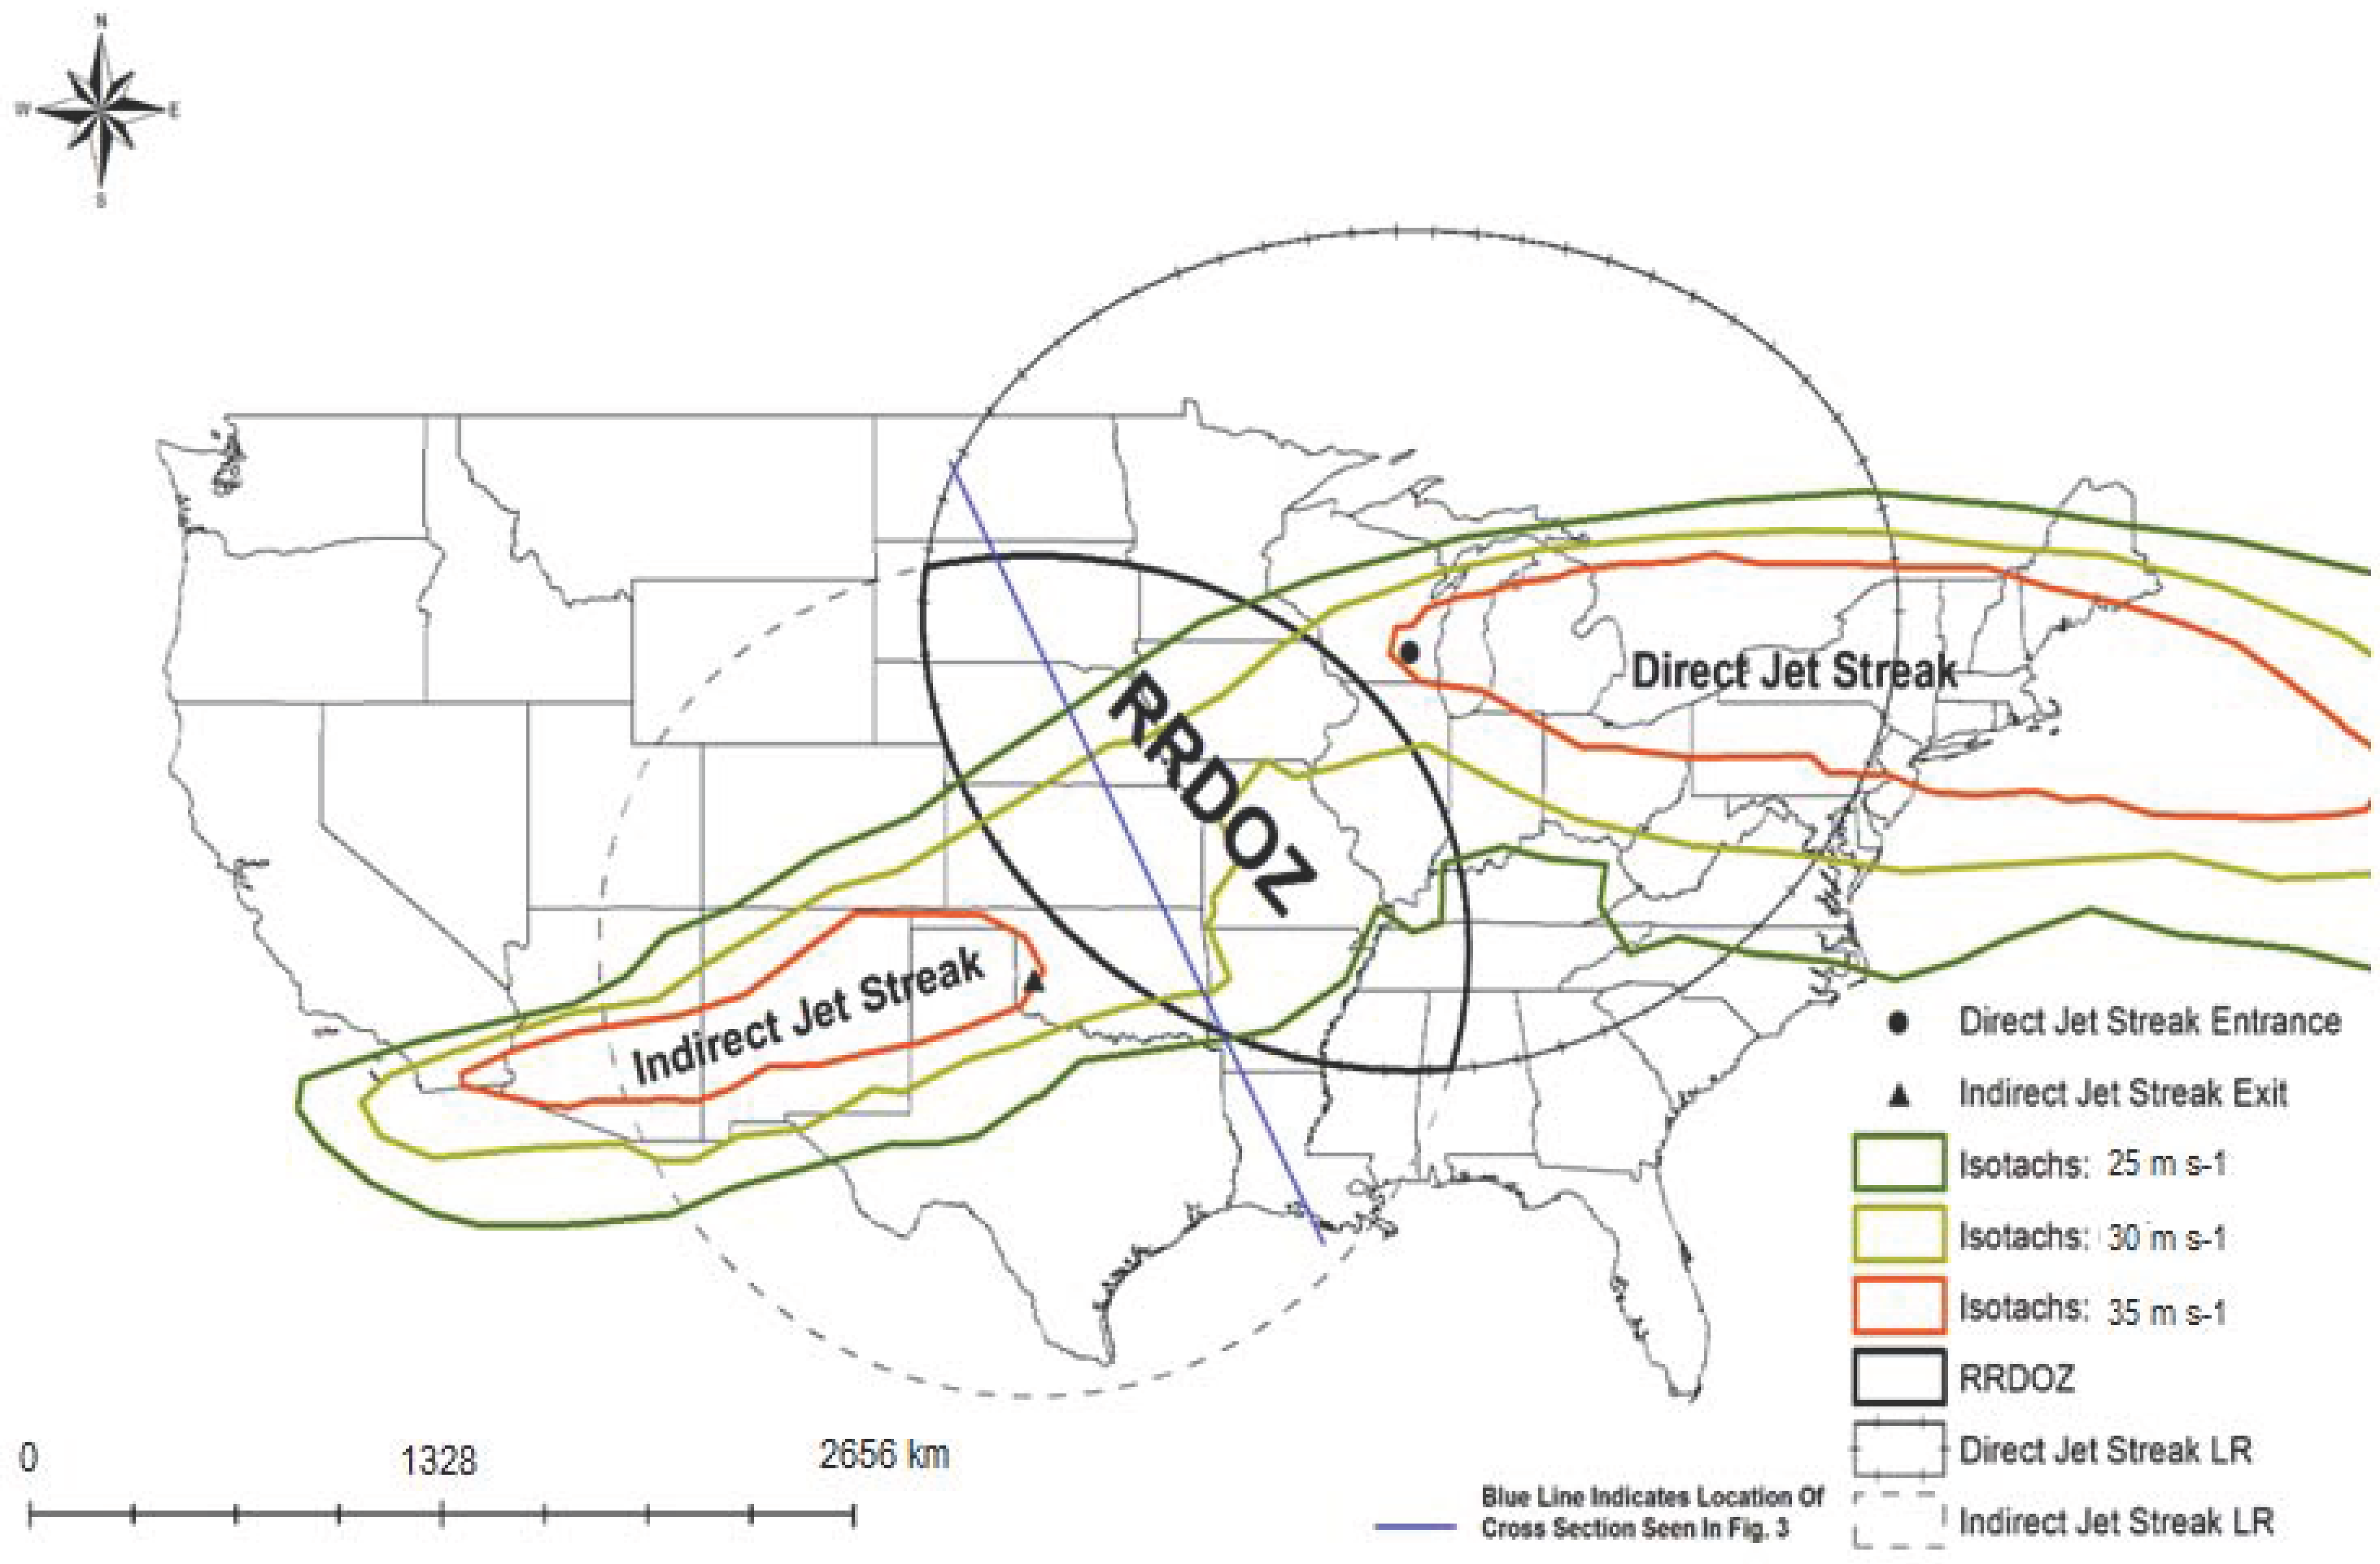
−1 in excess of the jet stream. For example,
Figure 2 depicts a case that occurred on 27 January 2009. In this case, the closed isotachs around the jet streak were 35 m·s
−1 (70 knots). This occurred within a jet stream flow of 30 m·s
−1 (the 25 m·s
−1 (50 knot) isotach is also shown), thus satisfying the condition of the jet streak being 5 m·s
−1 in excess of the jet stream.
Figure 2 shows an example of the resulting RRDOZ by way of intersecting
buffers. The image shows how the
buffers are centered at the entrance (downstream jet streak) and exit (upstream jet streak) regions of the jet streaks. Once these points were established for each jet streak pair, a buffer was created around each point with a radius equal to the
value (1136 km). If an overlap in these buffers existed, then a RRDOZ was present and the jet streaks were impacting one another. A vertical cross section was then taken through the RRDOZ to reveal if strong transverse ageostrophic circulations existed, overlapped, and created an enhanced region of upward vertical motion of (≤−5 μb·s
−1 ) within the RRDOZ (
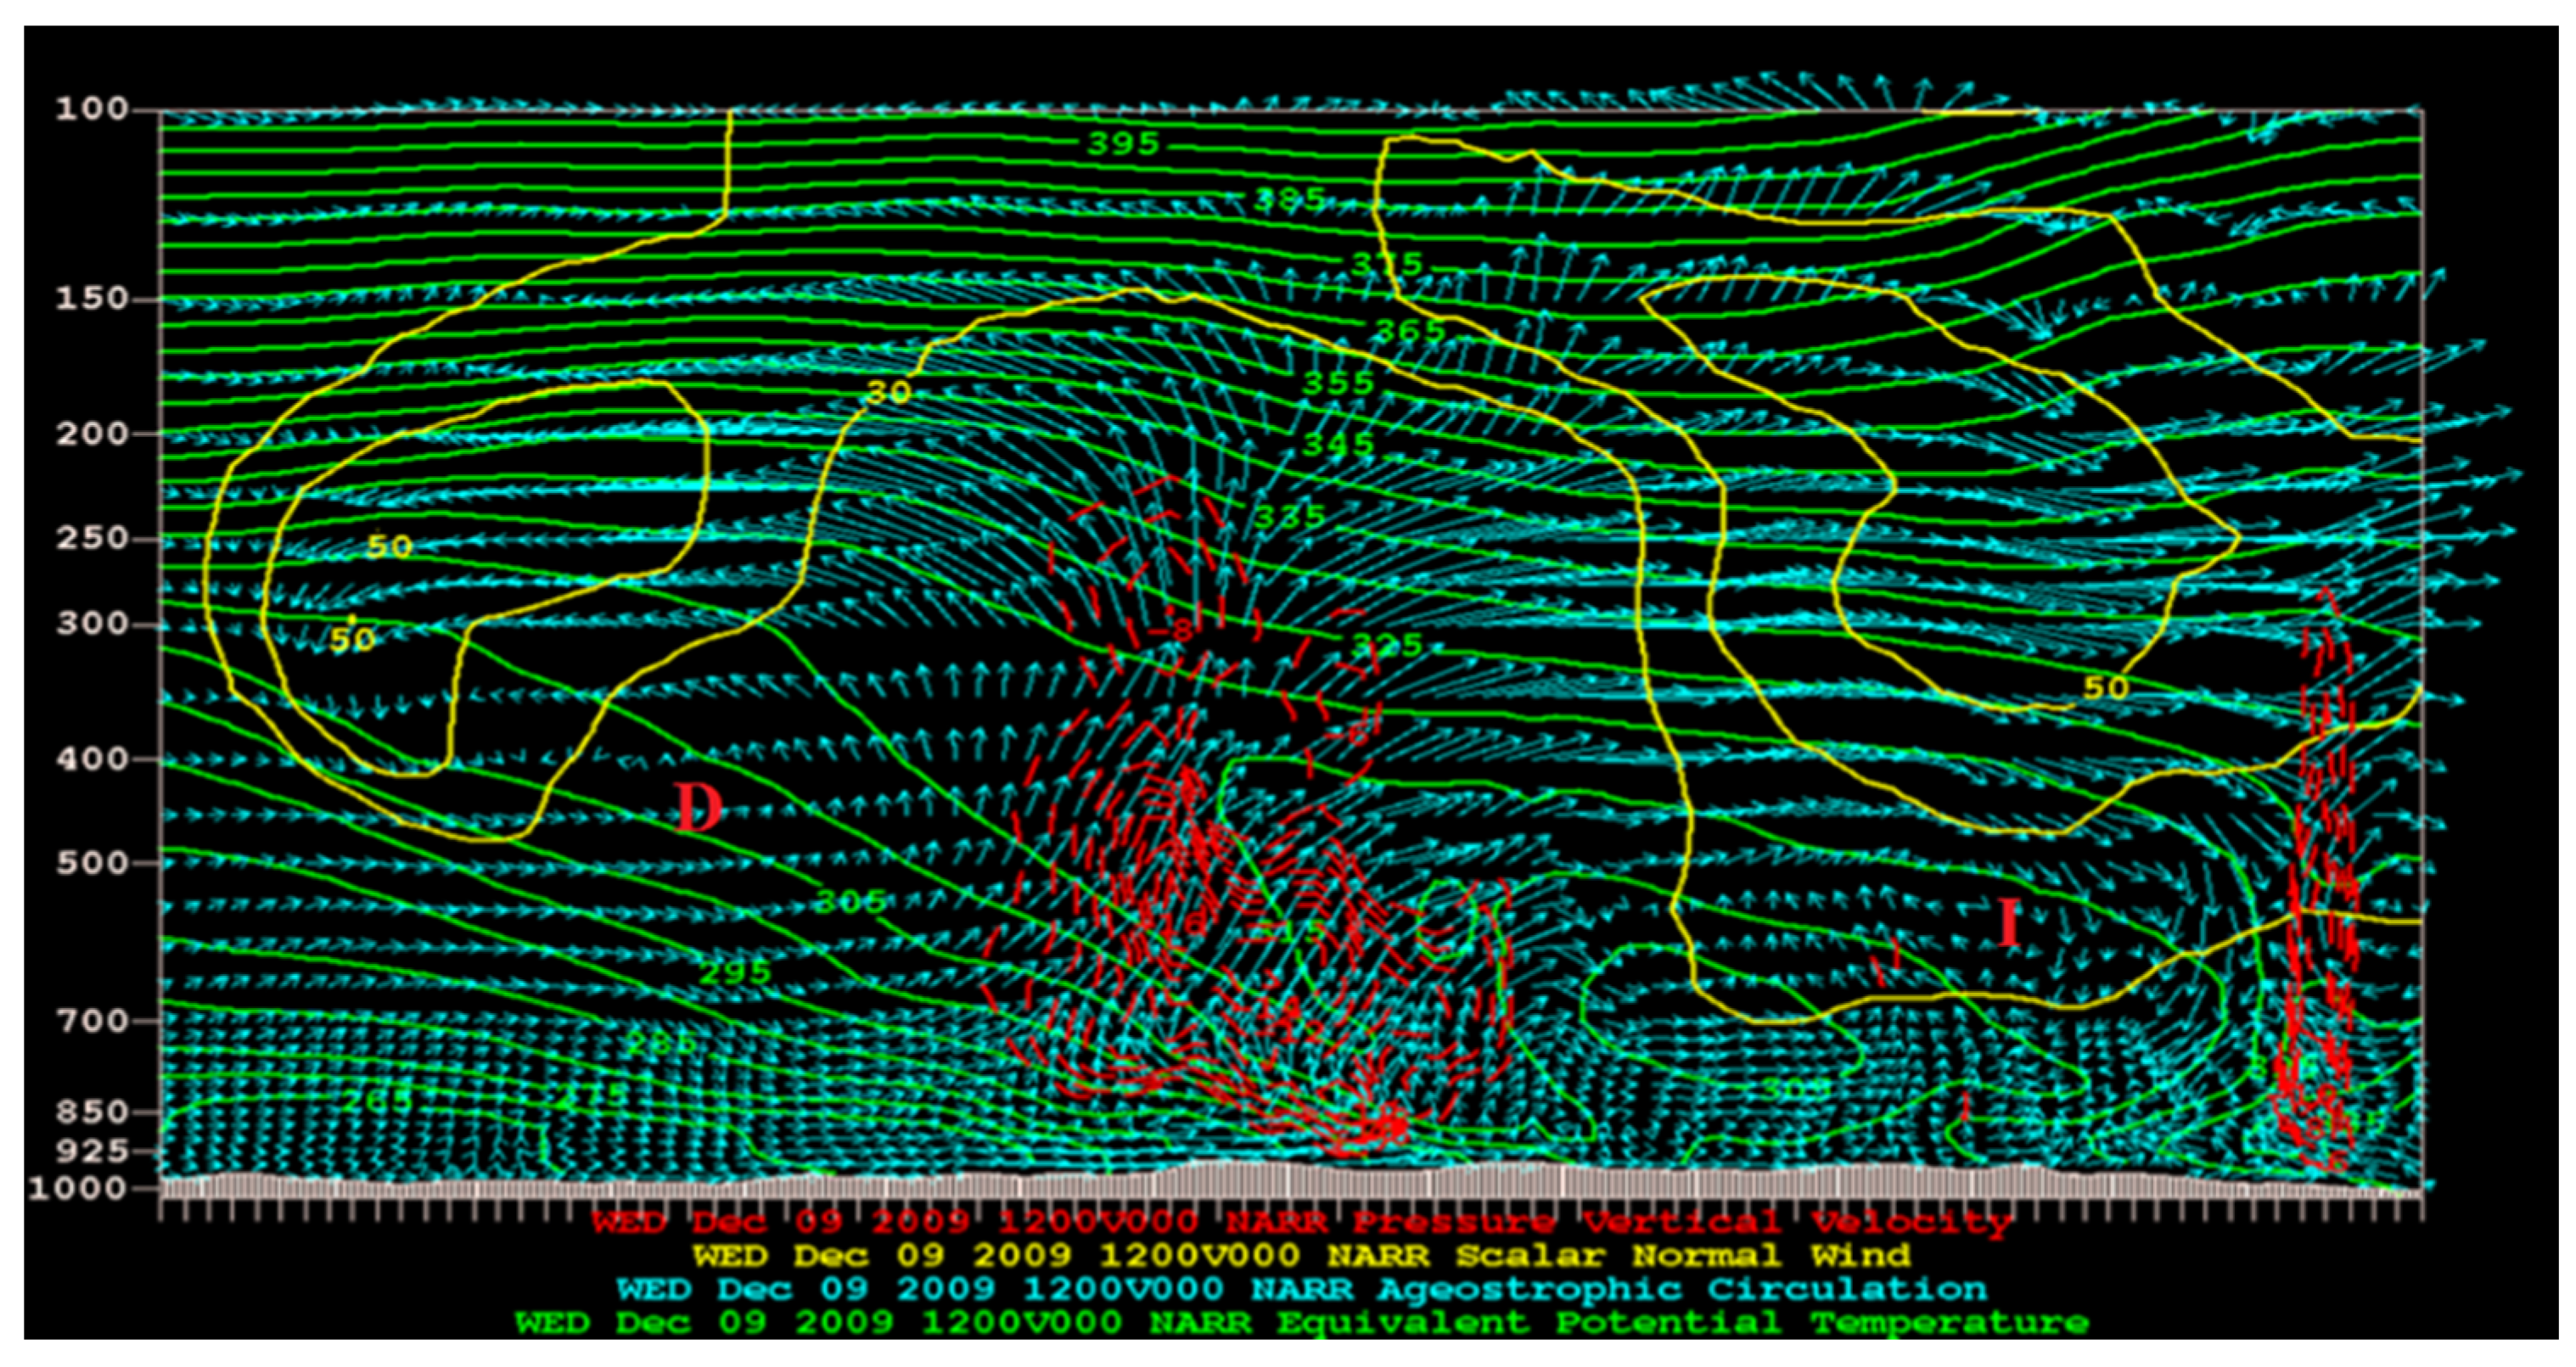
Figure 2). An example of this can be seen in
Figure 3, which depicts a cross section taken through the RRDOZ for the case of 9 December 2009. The cross section reveals a clear direct and indirect circulations in the ageostrophic circulation vectors.
This overlap could be constructive or synergistic in the same sense as [
17] discussed in the introduction. It could be shown using the techniques in [
17,
25], or [
29] that the overlapping divergence region or the forcing could be expressed as resulting from the sum of the contributions by each jet maximum and their interactions. This can be accomplished easily if the geopotential (gz = φ) in the overlap region is assumed to be partitioned among a contribution from each maximum (φ1
max, φ2
max) as well as an interaction term (φ
int) as done by [
27] or [
30]. Thus, the divergent region in an overlap case is at least partially due to the contribution of each jet maximum and the divergence would be larger than if there were only one maximum present. Actual calculations are beyond the scope of this study, as the goal here is to simply identify overlap within the Rossby radius of deformation.
Figure 3 also shows a region of upward vertical motion of ≤−5 μb·s
−1 where the indirect and direct ageostrophic circulation vectors align to form a unified-branch of vectors pointing upward. This vertical motion threshold was chosen in accordance with the studies of [
2,
31].
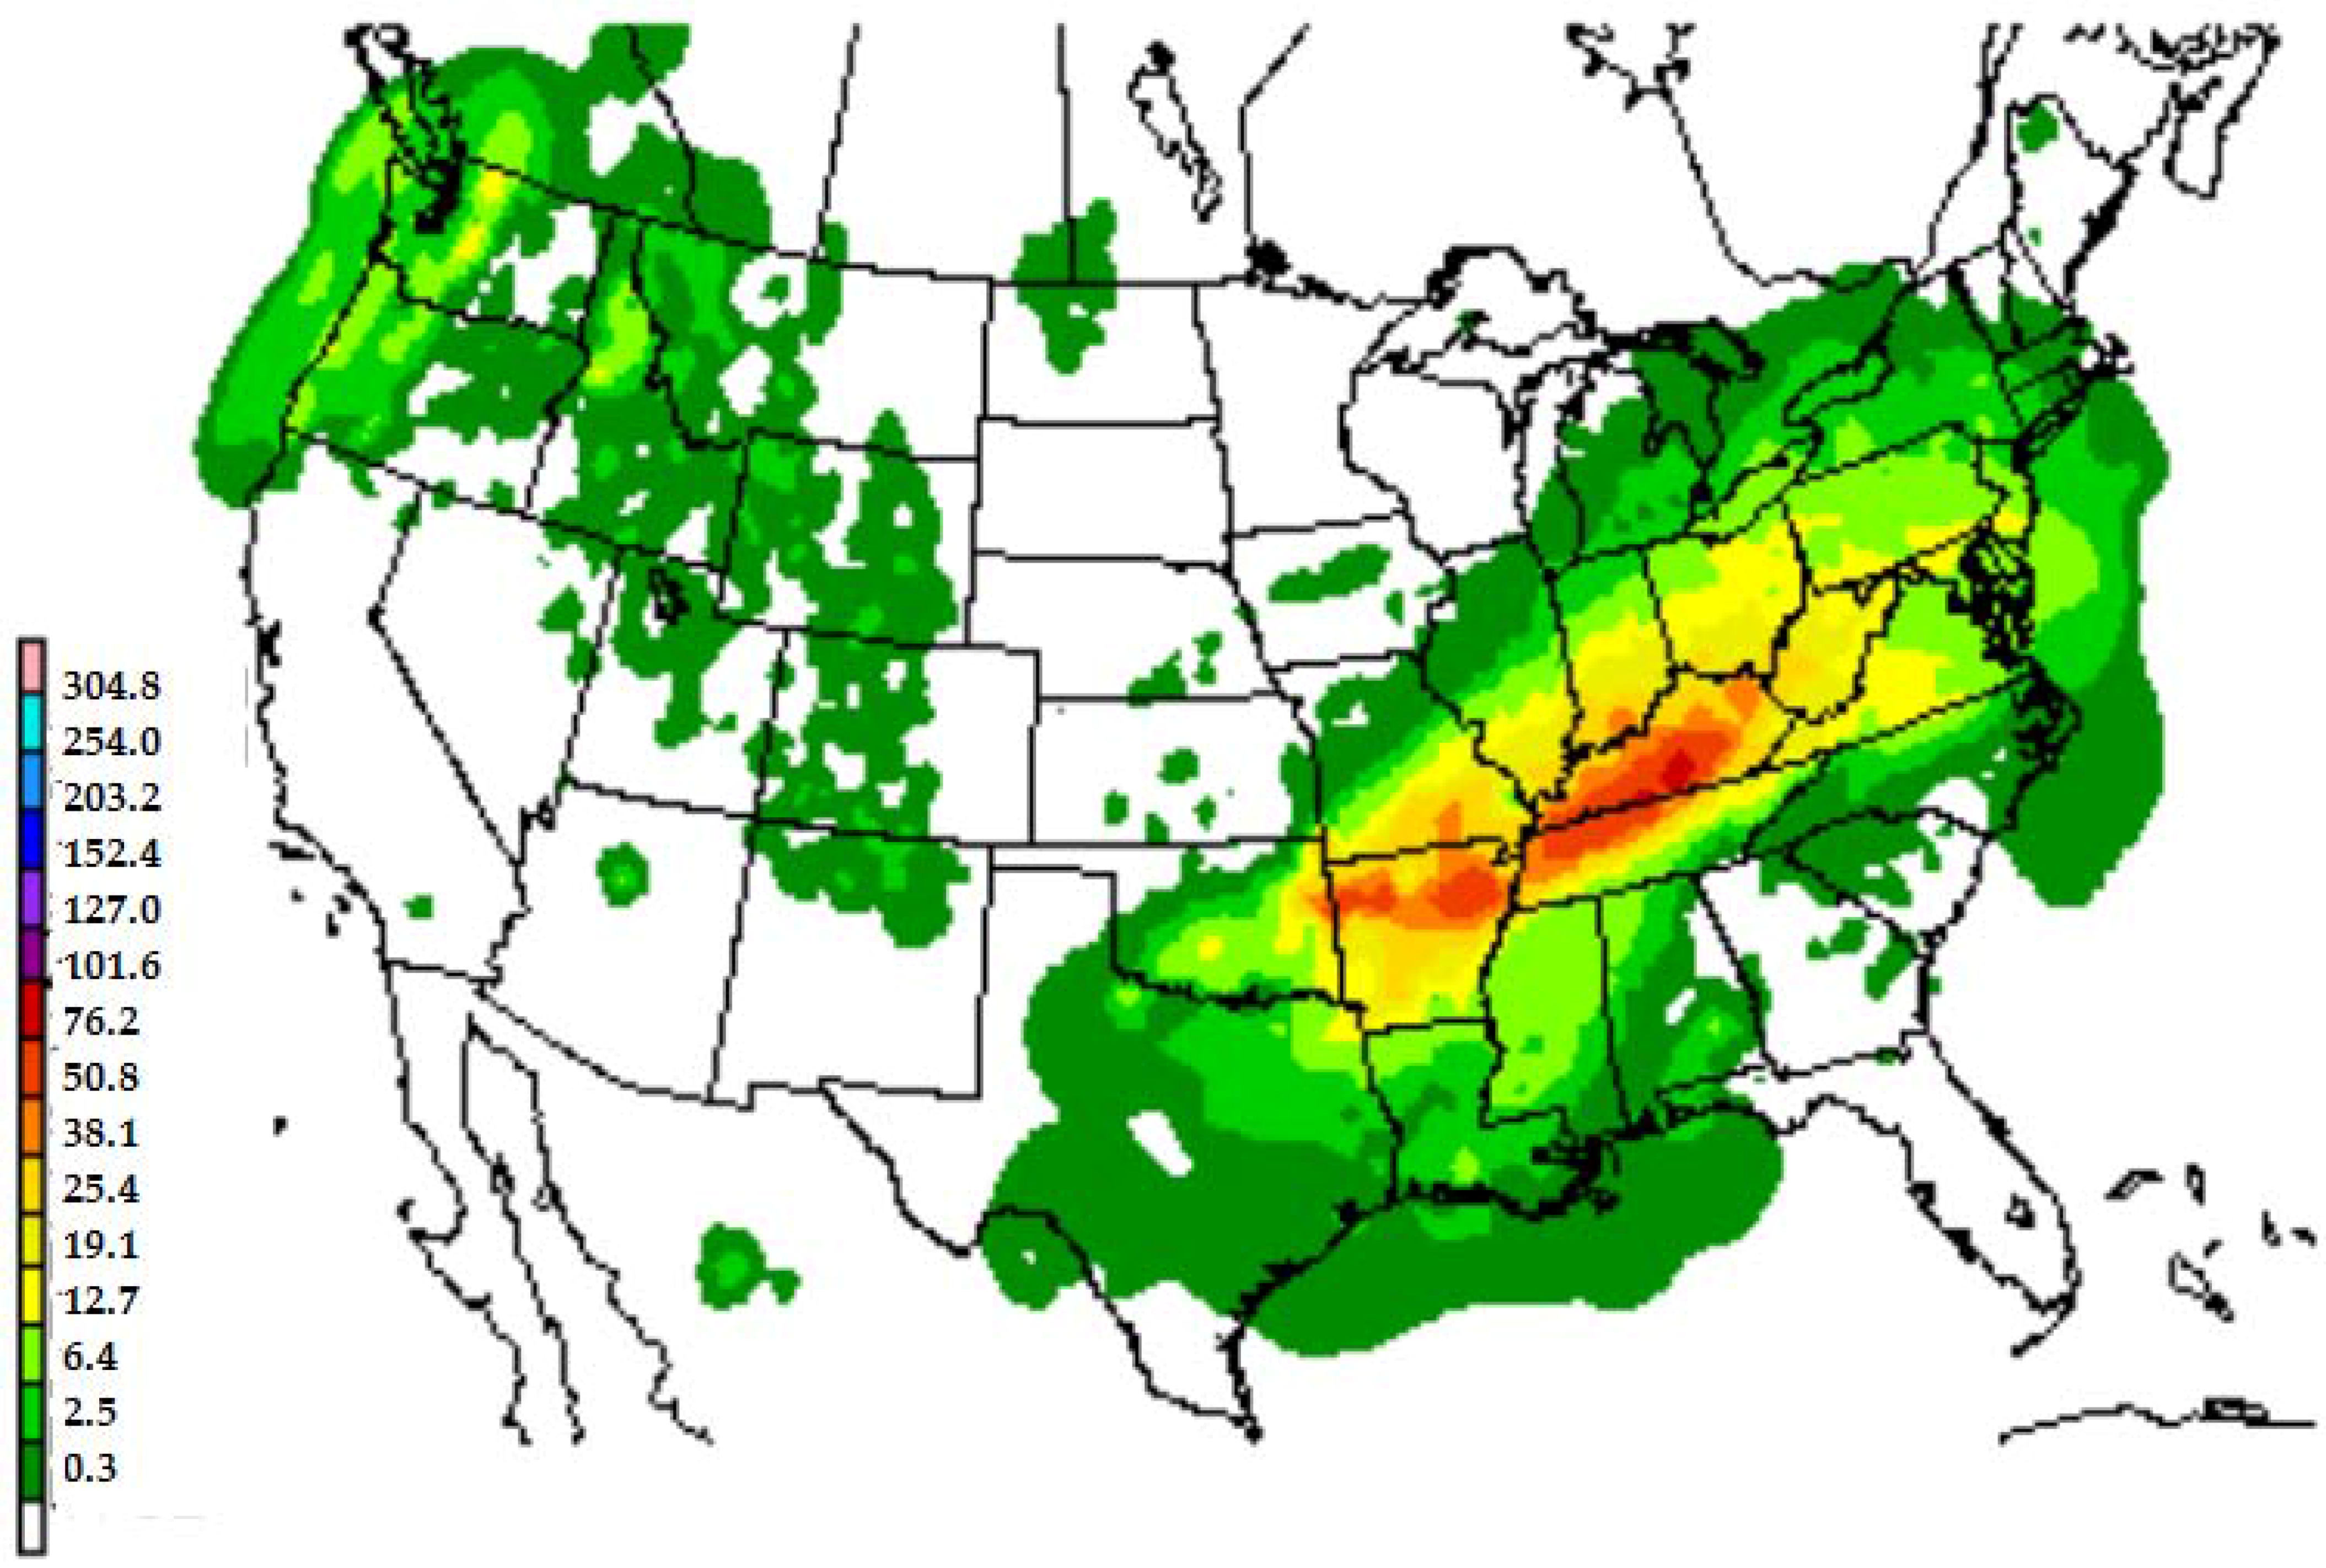
In order to assess the sensible weather impact, US Daily Weather Maps [
32] are examined and a maximum precipitation amount associated with the RRDOZ region is determined and archived in
Appendix A. Since these maps provide contoured precipitation amounts, the largest contour found within the RRDOZ region is used for the amount given here. The map corresponding to
Figure 2 is shown in
Figure 4.
3. Results and Analysis
Analysis revealed that in all 59 cases there existed a Rossby radius of deformation overlap zone (RRDOZ) lasting at least six hours. The cases varied between 6 h to 36 h where the conditions for coupling were met. This result demonstrates that in all cases the investigated jet streaks were within the Rossby radius of deformation and therefore could influence one another.
At first, this result may seem unlikely when one considers the typical Rossby radius of deformation for the Continental United States is 1136 km. However, since there are two jet streaks involved, that number is doubled to 2272 km, which is large enough to fully resolve a synoptic-scale wave. Jet streaks tend to form just upstream or downstream of the apex of ridge or base of a trough in meridional flow (when jet streaks form around the base of a trough or apex of a ridge, they generally exhibit strong curvature). This translates to jet streaks forming, in many cases, approximately ½ wavelength (synoptic-scale wave ~1000 km) apart. This value is close to the value of the Rossby radius of deformation that was used (1136 km). In zonal flow the jet streaks tend to form near shortwaves within the flow. In these cases, the jet streaks are farther apart but still within 2000 km of one another.
Furthering this result, all cases contained periods of at least 3 h in which column maximum upward vertical motion—ω ≤ −5 μb·s
−1 exist within the RRDOZ. This shows that there is ascending air occurring within the region between the jet streaks, strongly indicating that the coupled jet streaks are forcing enhanced rising motion via ageostrophic transverse circulations.
Figure 3 reveals that the ageostrophic transverse circulation is indeed between the two jet streaks, resulting in an enhanced region of upward vertical velocity (labeled ω in
Figure 3). It appears that when straight jet streaks are present and are aligned approximately ½ wavelength apart, rising motion results in response to the collocation of the ageostrophic transverse circulations. In all of these cases the jet streaks could both influence the resultant forcing. Therefore, one may proceed with the assumption that if two straight jet streaks in the same wave are present that the jet streaks are close enough to be coupled.
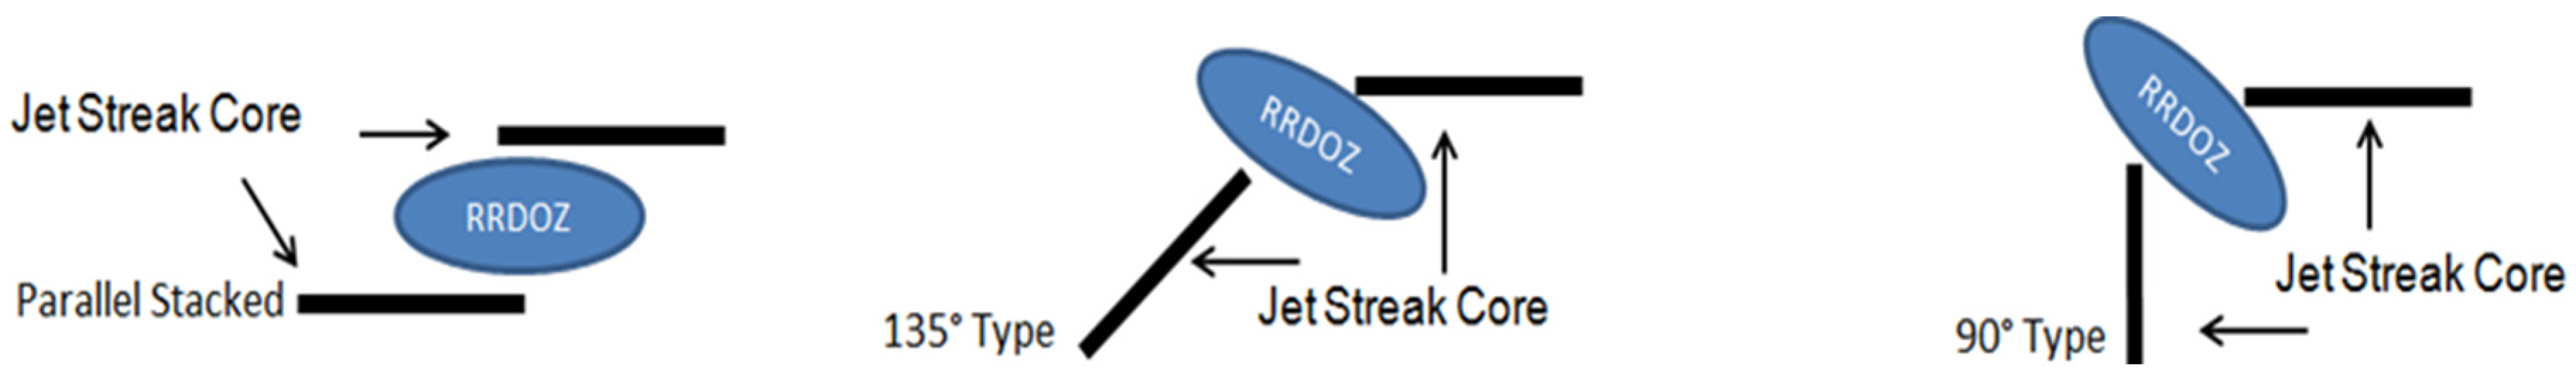
This work also revealed three patterns of jet streak overlap formations.
Figure 5 shows the three archetypes of jet streak coupling that were apparent in this study. The three typical formations of coupled jet streaks were called; (1) parallel stacked; (2) 135° type; and (3) 90° type.
Appendix A contains a list of all events examined here and characteristics such as the archetype and location. The parallel stacked formation was the most common alignment at 58% (34/59). The 135° type was the second most common at 31% (18/59). The 90° type was less common with only 8% (5/59). Finally, two cases transitioned between types during their lifespan and accounted for only 3% of all cases (2/59).
Not surprisingly, jet streak coupling occurred most during meteorological winter months (December through February) at 37% (22/59), followed by spring (March through May) at 28% (16/59), fall (September through November) at 20% (12/59), and lastly the summer (June through August) at 15% (9/59). The majority of winter (15/22) and spring (10/16) were parallel stacked, while for summer and fall events parallel stacked and 135° events occurred equally as often.
In order to examine where these cases were most often located, the Continental United States was broken down into three sub-regions: the West Pacific Coast and Rocky Mountain States (Montana, Wyoming, Colorado, and New Mexico), the East (Appalachian States and Atlantic Coast), and the Central region. The majority of cases at 69% (41/59) occurred over the Central region. Only 20% (12/59) and 11% (6/59) of cases occurred over the East and West sub-regions, respectively. This may at least partly be a function of the choice of the larger study region and/or the availability of data. Examining the distribution of types in each region showed it was similar to the overall distribution within the larger domain.
It was also noted that the majority of cases occurred within a meridional 500 hPa height pattern (64%, 38/59), with the remaining cases associated with zonal flow. Furthermore, it was found that the majority of coupling events were of relatively short duration: 61% of the events lasted between three and 12 h, with the remaining cases having lifetimes up to 36 h. Lastly, there was no correlation between the maximum wind speeds in the jet streaks and the RRDOZ.
Assuming that jet streaks are interacting based on their proximity is a powerful assumption, and all of these cases exhibited column maximum vertical motions (ω ≤ −5 μb·s−1) during every single time step. This shows that there is an influence on upward vertical motion by these jet streaks when they are within RRDOZ. Additionally, cross-sections confirm the presence of interacting transverse ageostrophic circulations within the RRDOZ during every case. Not every time step within a case showed interacting transverse ageostrophic circulations, but every case had at least one time-step where there existed such interacting circulations.
Thus, all 59 of these cases are reasonably assumed to be coupled. As long as jet streaks are aligned, as in
Figure 5, they could yield a region of enhanced upward motions greatly increasing the risk of significant sensible weather here defined as a region of measurable precipitation within the RRDOZ region similar to a previous study [
28].
Appendix A shows that all but one case was associated with at least 12.7 mm of precipitation, and 29% of these (17/59) were associated with at least 50 mm of precipitation. Of these higher precipitation cases, 15 of them were Central region cases, and two were Eastern region. Nine were parallel stacked, six were of 135°, and one each of the 90° and transitional case.


